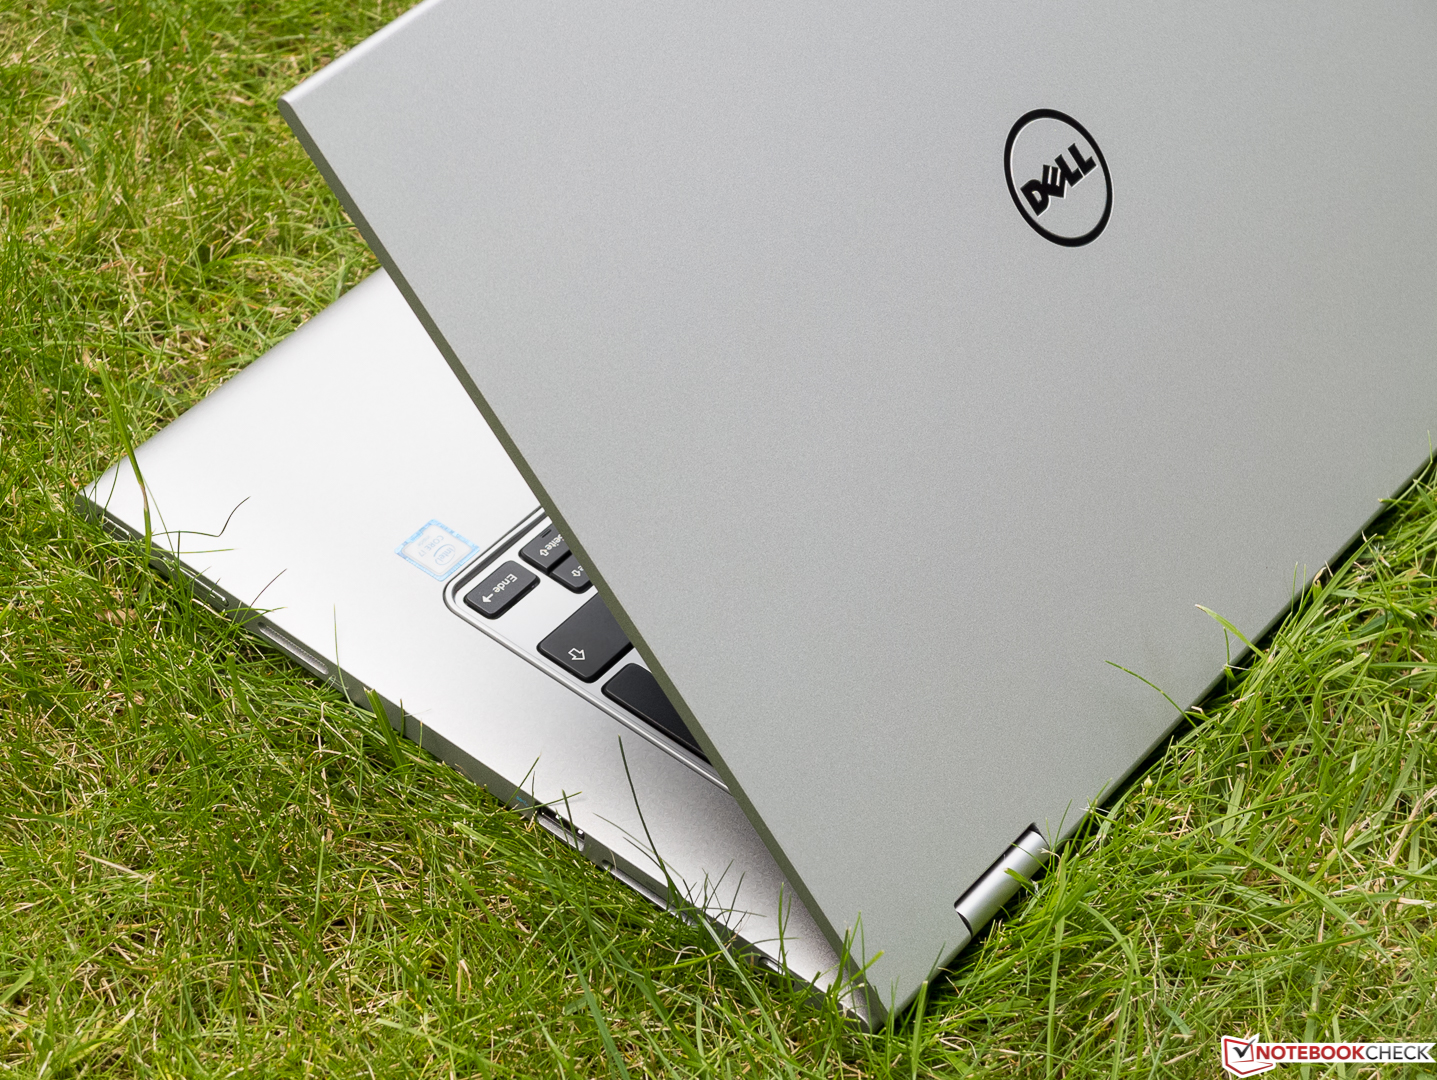
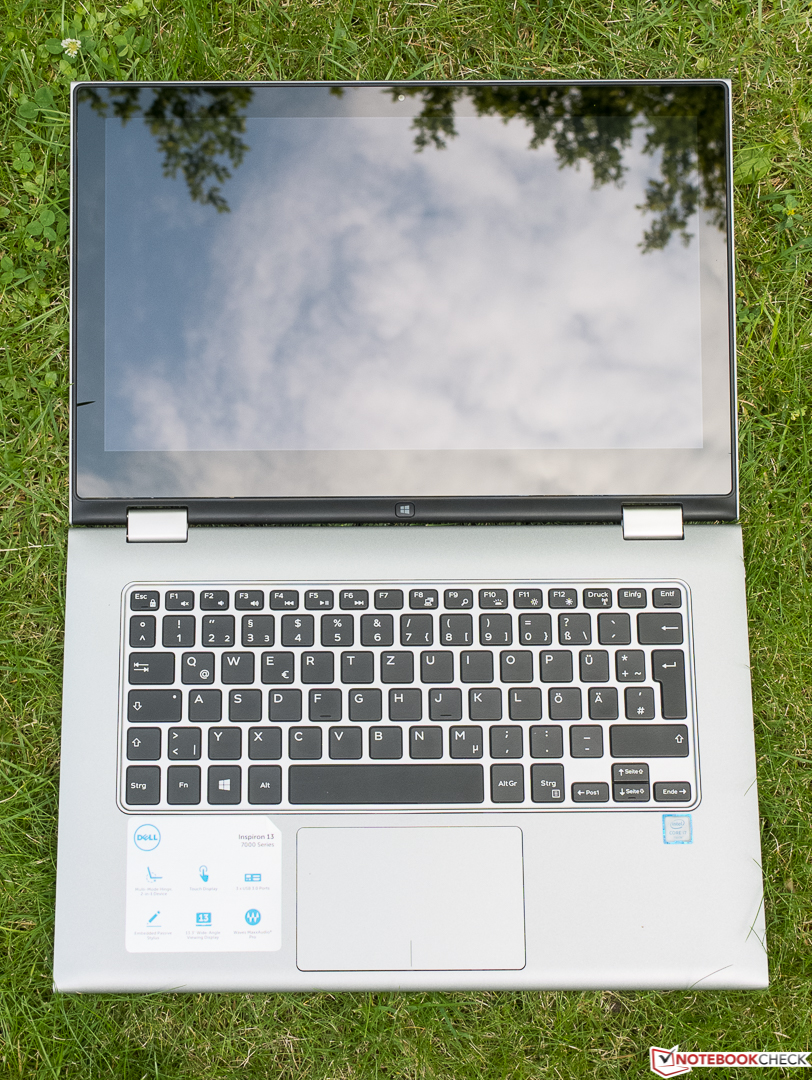
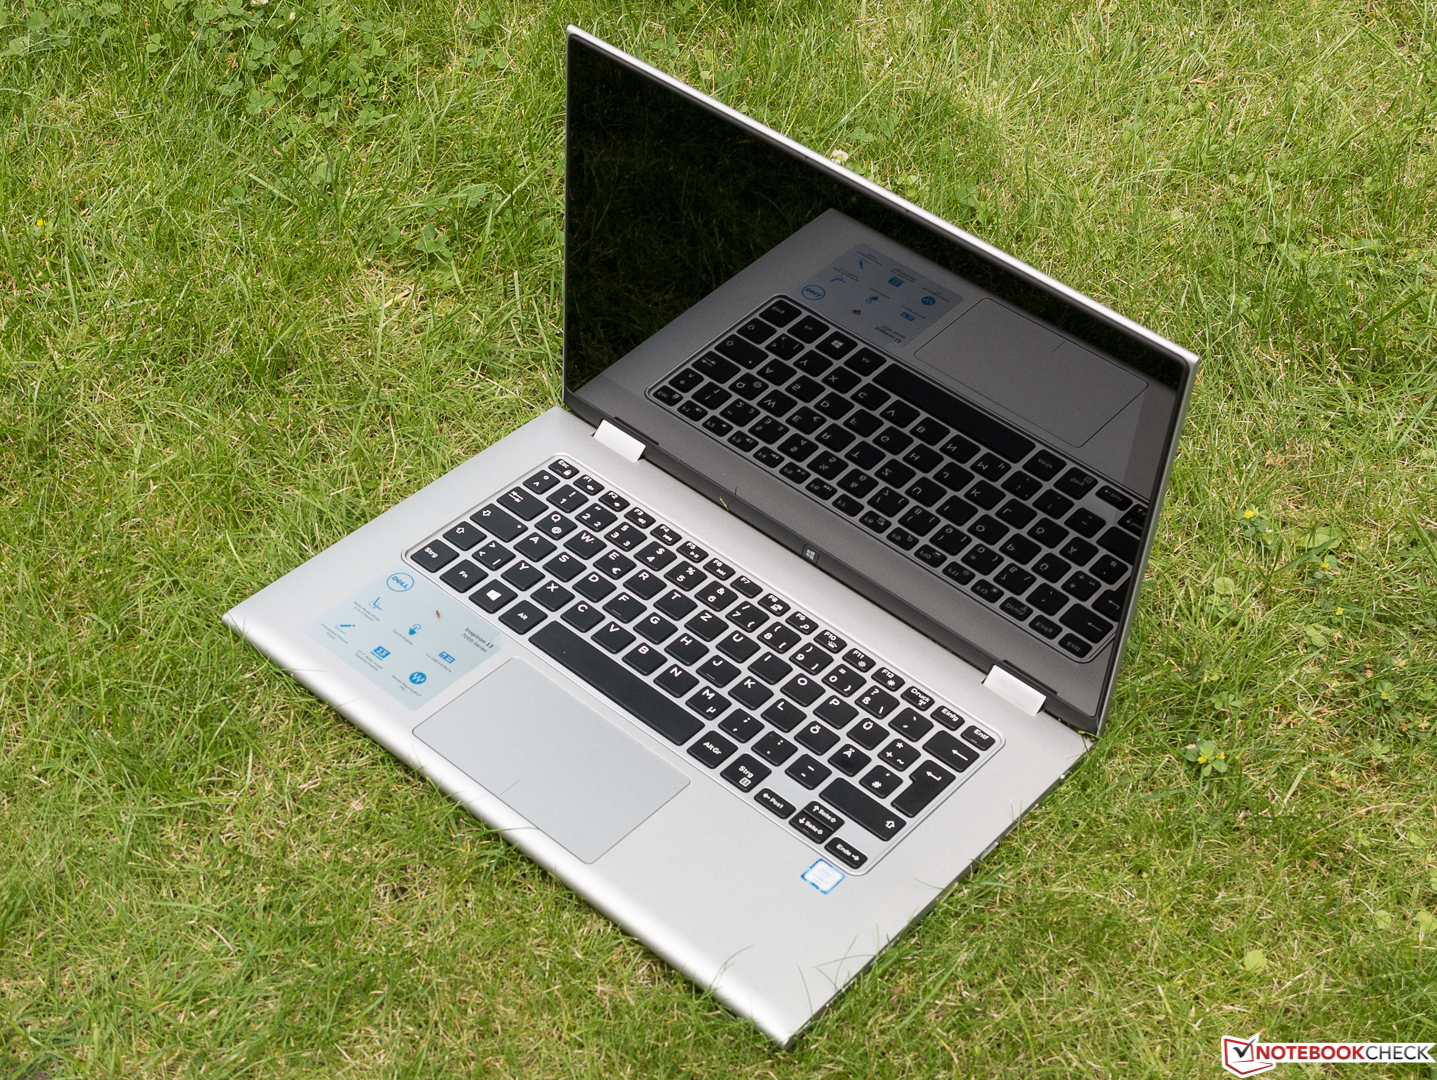
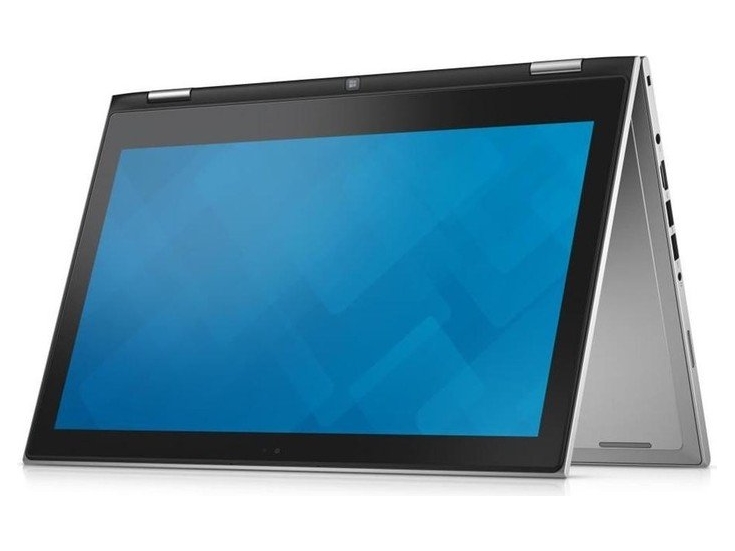
Breve Análise do Conversível Dell Inspiron 13 7359-4839
| SD Card Reader | |
| average JPG Copy Test (av. of 3 runs) | |
| Lenovo Yoga 3 Pro 13 80HE004LGE | |
| Dell Inspiron 13 7359-4839 | |
| Acer Aspire R13 R7-372T | |
| maximum AS SSD Seq Read Test (1GB) | |
| Lenovo Yoga 3 Pro 13 80HE004LGE | |
| Dell Inspiron 13 7359-4839 | |
| Acer Aspire R13 R7-372T | |
| Networking | |
| Wi-Fi Client 1m | |
| Wi-Fi Server 1m |
| |||||||||||||||||||||||||
iluminação: 83 %
iluminação com acumulador: 259 cd/m²
Contraste: 904:1 (Preto: 0.28 cd/m²)
ΔE ColorChecker Calman: 6.36 | ∀{0.5-29.43 Ø4.71}
ΔE Greyscale Calman: 10.26 | ∀{0.09-98 Ø4.96}
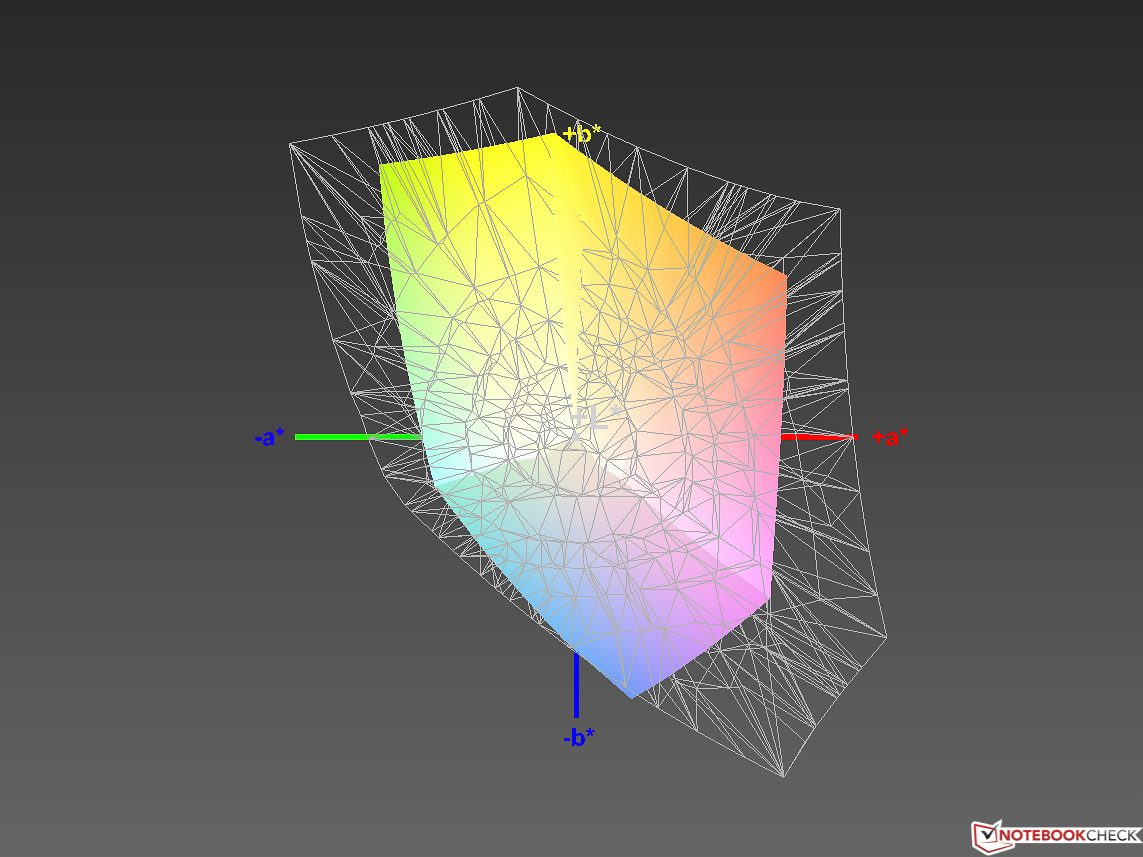
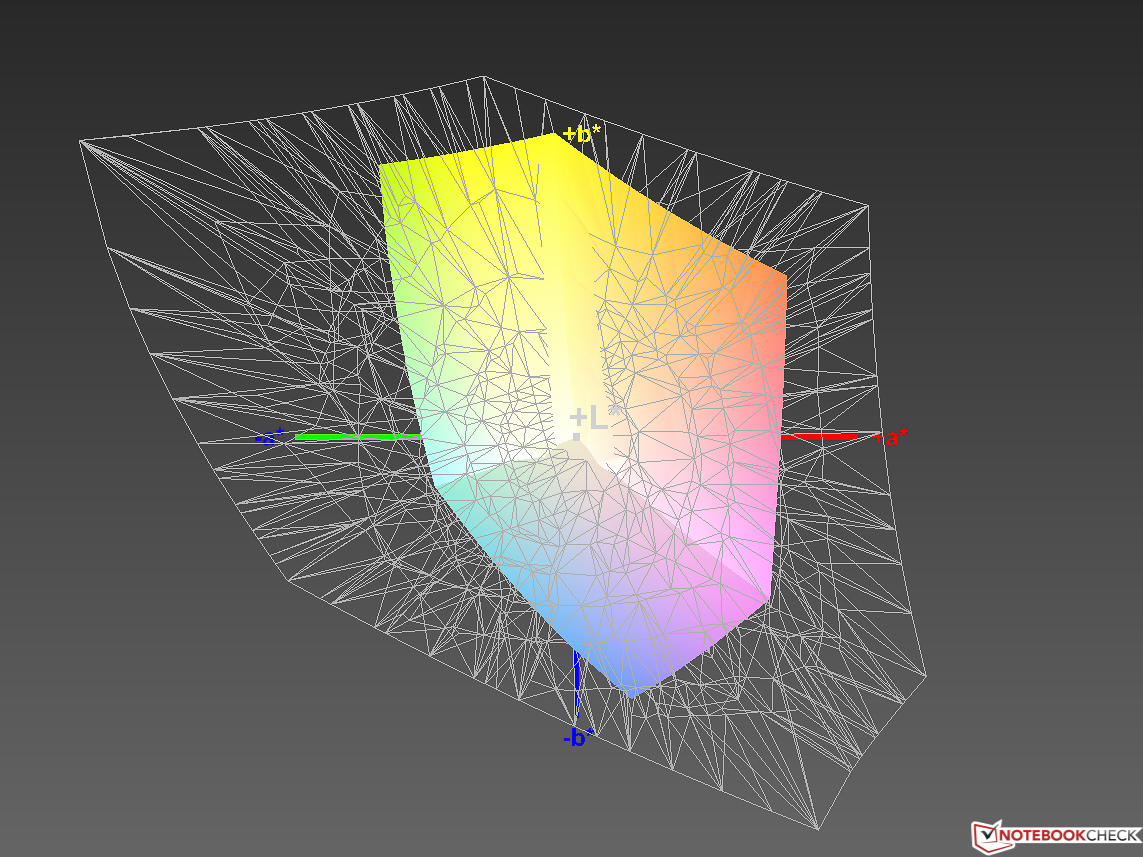
60% sRGB (Argyll 1.6.3 3D)
38% AdobeRGB 1998 (Argyll 1.6.3 3D)
41.65% AdobeRGB 1998 (Argyll 3D)
60.5% sRGB (Argyll 3D)
40.31% Display P3 (Argyll 3D)
Gamma: 2.28
CCT: 6500 K
| Dell Inspiron 13 7359-4839 Samsung SDC864D / 133HL [Dell P/N: PVFF5], , 1920x1080, 13.3" | Acer Aspire R13 R7-372T AU Optronics B133HAT02.5, , 1920x1080, 13.3" | Lenovo Yoga 3 Pro 13 80HE004LGE Samsung L_LLTN133YL03L01, , 3200x1800, 13.3" | HP Spectre x360 13-4104ng LG Philips LGD0000, , 2560x1440, 13.3" | Acer Aspire Switch Alpha 12 SA5-271-56HM Panasonic VVX12T041N00, , 2160x1440, 12" | |
|---|---|---|---|---|---|
| Display | 55% | 55% | 60% | 61% | |
| Display P3 Coverage (%) | 40.31 | 63.2 57% | 64.6 60% | 66.8 66% | 65.5 62% |
| sRGB Coverage (%) | 60.5 | 92.3 53% | 89.5 48% | 92.8 53% | 96.1 59% |
| AdobeRGB 1998 Coverage (%) | 41.65 | 64.3 54% | 65.5 57% | 67.3 62% | 66.9 61% |
| Response Times | -8% | 4% | 36% | 15% | |
| Response Time Grey 50% / Grey 80% * (ms) | 38 ? | 48 ? -26% | 36 ? 5% | 24 ? 37% | 20 ? 47% |
| Response Time Black / White * (ms) | 29 ? | 26 ? 10% | 28 ? 3% | 19 ? 34% | 34 ? -17% |
| PWM Frequency (Hz) | 1330 ? | 1000 ? | |||
| Screen | 36% | 20% | 29% | 16% | |
| Brightness middle (cd/m²) | 253 | 339 34% | 314 24% | 324 28% | 345 36% |
| Brightness (cd/m²) | 232 | 331 43% | 294 27% | 324 40% | 328 41% |
| Brightness Distribution (%) | 83 | 90 8% | 83 0% | 90 8% | 91 10% |
| Black Level * (cd/m²) | 0.28 | 0.22 21% | 0.57 -104% | 0.34 -21% | 0.38 -36% |
| Contrast (:1) | 904 | 1541 70% | 551 -39% | 953 5% | 908 0% |
| Colorchecker dE 2000 * | 6.36 | 5.72 10% | 2.18 66% | 4.36 31% | 8.4 -32% |
| Colorchecker dE 2000 max. * | 12.72 | 10.45 18% | 6.48 49% | 11.9 6% | |
| Greyscale dE 2000 * | 10.26 | 5.74 44% | 2.45 76% | 4.62 55% | 4.3 58% |
| Gamma | 2.28 96% | 2.18 101% | 2.39 92% | 2.18 101% | 2.63 84% |
| CCT | 6500 100% | 7393 88% | 6745 96% | 6857 95% | 7368 88% |
| Color Space (Percent of AdobeRGB 1998) (%) | 38 | 59 55% | 58 53% | 60 58% | 62 63% |
| Color Space (Percent of sRGB) (%) | 60 | 92 53% | 89 48% | 93 55% | |
| Média Total (Programa/Configurações) | 28% /
34% | 26% /
25% | 42% /
37% | 31% /
26% |
* ... menor é melhor
Exibir tempos de resposta
| ↔ Tempo de resposta preto para branco | ||
|---|---|---|
| 29 ms ... ascensão ↗ e queda ↘ combinadas | ↗ 6 ms ascensão | 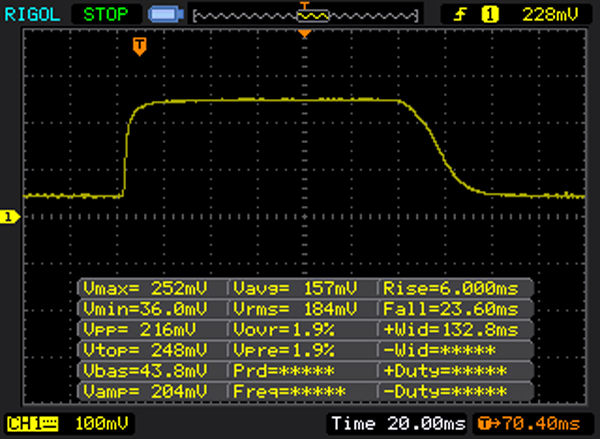 |
| ↘ 23 ms queda | ||
| A tela mostra taxas de resposta relativamente lentas em nossos testes e pode ser muito lenta para os jogadores. Em comparação, todos os dispositivos testados variam de 0.1 (mínimo) a 240 (máximo) ms. » 77 % de todos os dispositivos são melhores. Isso significa que o tempo de resposta medido é pior que a média de todos os dispositivos testados (19.8 ms). | ||
| ↔ Tempo de resposta 50% cinza a 80% cinza | ||
| 38 ms ... ascensão ↗ e queda ↘ combinadas | ↗ 19 ms ascensão | 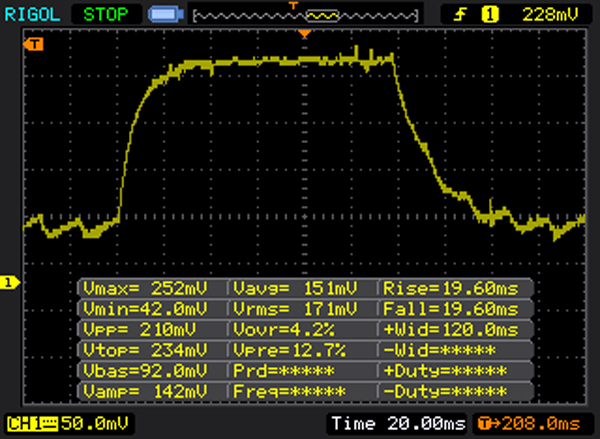 |
| ↘ 19 ms queda | ||
| A tela mostra taxas de resposta lentas em nossos testes e será insatisfatória para os jogadores. Em comparação, todos os dispositivos testados variam de 0.165 (mínimo) a 636 (máximo) ms. » 55 % de todos os dispositivos são melhores. Isso significa que o tempo de resposta medido é pior que a média de todos os dispositivos testados (31 ms). | ||
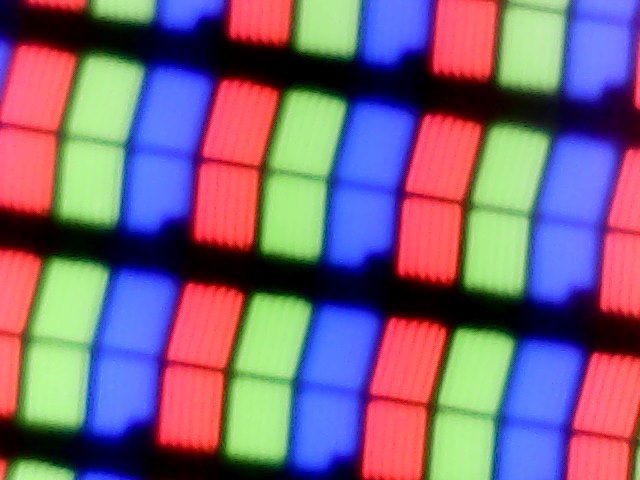
Cintilação da tela / PWM (modulação por largura de pulso)
| Tela tremeluzindo / PWM não detectado | ||
[pwm_comparison] Em comparação: 52 % de todos os dispositivos testados não usam PWM para escurecer a tela. Se PWM foi detectado, uma média de 7757 (mínimo: 5 - máximo: 343500) Hz foi medida. | ||
| Cinebench R15 | |
| CPU Single 64Bit | |
| Dell Inspiron 13 7359-4839 | |
| Acer Aspire R13 R7-372T | |
| Acer Aspire Switch Alpha 12 SA5-271-56HM | |
| HP Spectre x360 13-4104ng | |
| Lenovo Yoga 3 Pro 13 80HE004LGE | |
| CPU Multi 64Bit | |
| Dell Inspiron 13 7359-4839 | |
| Acer Aspire Switch Alpha 12 SA5-271-56HM | |
| Acer Aspire R13 R7-372T | |
| HP Spectre x360 13-4104ng | |
| Lenovo Yoga 3 Pro 13 80HE004LGE | |
| PCMark 8 | |
| Home Score Accelerated v2 | |
| Acer Aspire Switch Alpha 12 SA5-271-56HM | |
| Dell Inspiron 13 7359-4839 | |
| Acer Aspire R13 R7-372T | |
| Lenovo Yoga 3 Pro 13 80HE004LGE | |
| Work Score Accelerated v2 | |
| Dell Inspiron 13 7359-4839 | |
| Acer Aspire R13 R7-372T | |
| Acer Aspire Switch Alpha 12 SA5-271-56HM | |
| Lenovo Yoga 3 Pro 13 80HE004LGE | |
| PCMark 8 Home Score Accelerated v2 | 3224 pontos | |
| PCMark 8 Work Score Accelerated v2 | 4207 pontos | |
Ajuda | ||
| Dell Inspiron 13 7359-4839 Liteonit LCH-256V2S | Acer Aspire R13 R7-372T 2x Hynix HFS128G39MND M.2 (RAID 0) | Lenovo Yoga 3 Pro 13 80HE004LGE Samsung SSD PM851 MZNTE512HMJH | HP Spectre x360 13-4104ng Samsung SSD PM851 256 GB MZNTE256HMHP | Acer Aspire Switch Alpha 12 SA5-271-56HM Kingston RBU-SNS8152S3256GG2 | |
|---|---|---|---|---|---|
| CrystalDiskMark 3.0 | 22% | 8% | -19% | -9% | |
| Read Seq (MB/s) | 486.3 | 1001 106% | 521 7% | 491.8 1% 491.8 1% | 518 7% |
| Write Seq (MB/s) | 283.7 | 375.7 32% | 238.6 -16% | 264.5 -7% 264.5 -7% | 199.9 -30% |
| Read 512 (MB/s) | 337.5 | 510 51% | 417.3 24% | 396.2 17% 396.2 17% | 374.9 11% |
| Write 512 (MB/s) | 283.5 | 383.4 35% | 237.7 -16% | 264.5 -7% 264.5 -7% | 201 -29% |
| Read 4k (MB/s) | 26.75 | 25.65 -4% | 35.9 34% | 30.88 15% 30.88 15% | 29.3 10% |
| Write 4k (MB/s) | 85.3 | 56.1 -34% | 99.9 17% | 75.6 -11% 75.6 -11% | 76.8 -10% |
| Read 4k QD32 (MB/s) | 309.7 | 268 -13% | 366.6 18% | 31.85 -90% 31.85 -90% | 272 -12% |
| Write 4k QD32 (MB/s) | 250.8 | 252.6 1% | 236.7 -6% | 73.9 -71% 73.9 -71% | 197.1 -21% |

| 3DMark 11 - 1280x720 Performance GPU | |
| Acer Aspire Switch Alpha 12 SA5-271-56HM | |
| Acer Aspire R13 R7-372T | |
| HP Spectre x360 13-4104ng | |
| HP Spectre x360 13-4104ng | |
| Dell Inspiron 13 7359-4839 | |
| Lenovo Yoga 3 Pro 13 80HE004LGE | |
| 3DMark - 1280x720 Cloud Gate Standard Graphics | |
| Acer Aspire R13 R7-372T | |
| HP Spectre x360 13-4104ng | |
| HP Spectre x360 13-4104ng | |
| Acer Aspire Switch Alpha 12 SA5-271-56HM | |
| Dell Inspiron 13 7359-4839 | |
| Lenovo Yoga 3 Pro 13 80HE004LGE | |
| 3DMark 11 Performance | 1367 pontos | |
| 3DMark Ice Storm Standard Score | 43629 pontos | |
| 3DMark Cloud Gate Standard Score | 5062 pontos | |
Ajuda | ||
| baixo | média | alto | ultra | |
|---|---|---|---|---|
| BioShock Infinite (2013) | 38.2 | 21.2 | 17.1 | |
| Battlefield 4 (2013) | 28.6 | 21.6 | 7.6 | |
| The Witcher 3 (2015) | 11.8 |
Barulho
| Ocioso |
| 32.2 / 32.2 / 32.2 dB |
| Carga |
| 34.1 / 34 dB |
 | ||
30 dB silencioso 40 dB(A) audível 50 dB(A) ruidosamente alto |
||
min: | ||
(+) A temperatura máxima no lado superior é 39.1 °C / 102 F, em comparação com a média de 35.4 °C / 96 F , variando de 19.6 a 60 °C para a classe Convertible.
(±) A parte inferior aquece até um máximo de 43.6 °C / 110 F, em comparação com a média de 36.9 °C / 98 F
(+) Em uso inativo, a temperatura média para o lado superior é 24.5 °C / 76 F, em comparação com a média do dispositivo de 30.3 °C / ### class_avg_f### F.
(+) Os apoios para as mãos e o touchpad são mais frios que a temperatura da pele, com um máximo de 27 °C / 80.6 F e, portanto, são frios ao toque.
(±) A temperatura média da área do apoio para as mãos de dispositivos semelhantes foi 28 °C / 82.4 F (+1 °C / 1.8 F).
Dell Inspiron 13 7359-4839 análise de áudio
(-) | alto-falantes não muito altos (###valor### dB)
Graves 100 - 315Hz
(±) | graves reduzidos - em média 8.4% menor que a mediana
(+) | o baixo é linear (6.8% delta para a frequência anterior)
Médios 400 - 2.000 Hz
(+) | médios equilibrados - apenas 4.7% longe da mediana
(+) | médios são lineares (6.8% delta para frequência anterior)
Altos 2 - 16 kHz
(+) | agudos equilibrados - apenas 1.9% longe da mediana
(±) | a linearidade dos máximos é média (7.9% delta para frequência anterior)
Geral 100 - 16.000 Hz
(+) | o som geral é linear (14.1% diferença em relação à mediana)
Comparado com a mesma classe
» 20% de todos os dispositivos testados nesta classe foram melhores, 4% semelhantes, 76% piores
» O melhor teve um delta de 6%, a média foi 20%, o pior foi 57%
Comparado com todos os dispositivos testados
» 17% de todos os dispositivos testados foram melhores, 4% semelhantes, 79% piores
» O melhor teve um delta de 4%, a média foi 23%, o pior foi 134%
Apple MacBook 12 (Early 2016) 1.1 GHz análise de áudio
(+) | os alto-falantes podem tocar relativamente alto (###valor### dB)
Graves 100 - 315Hz
(±) | graves reduzidos - em média 11.3% menor que a mediana
(±) | a linearidade dos graves é média (14.2% delta para a frequência anterior)
Médios 400 - 2.000 Hz
(+) | médios equilibrados - apenas 2.4% longe da mediana
(+) | médios são lineares (5.5% delta para frequência anterior)
Altos 2 - 16 kHz
(+) | agudos equilibrados - apenas 2% longe da mediana
(+) | os máximos são lineares (4.5% delta da frequência anterior)
Geral 100 - 16.000 Hz
(+) | o som geral é linear (10.2% diferença em relação à mediana)
Comparado com a mesma classe
» 7% de todos os dispositivos testados nesta classe foram melhores, 2% semelhantes, 90% piores
» O melhor teve um delta de 5%, a média foi 18%, o pior foi 53%
Comparado com todos os dispositivos testados
» 5% de todos os dispositivos testados foram melhores, 1% semelhantes, 94% piores
» O melhor teve um delta de 4%, a média foi 23%, o pior foi 134%
| desligado | |
| Ocioso | |
| Carga |
|
Key:
min: | |
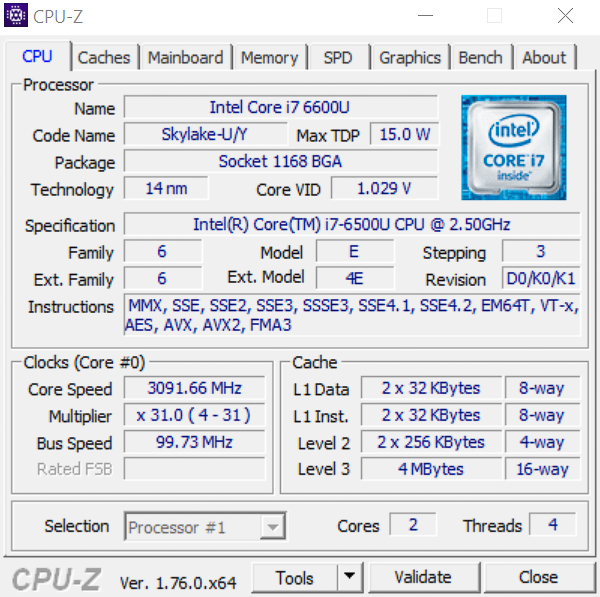
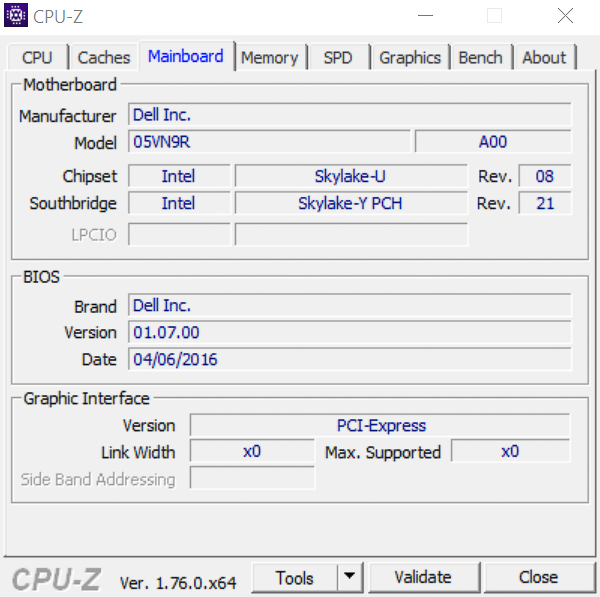
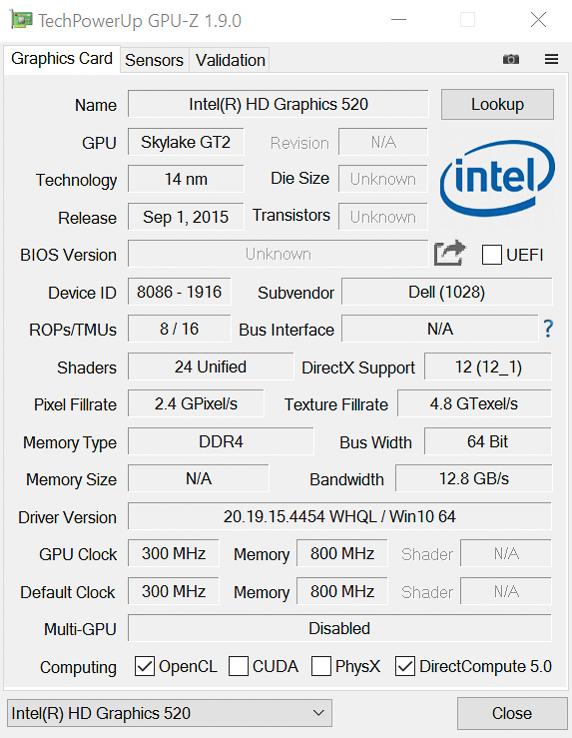
| Dell Inspiron 13 7359-4839 6500U, HD Graphics 520, Liteonit LCH-256V2S, IPS, 1920x1080, 13.3" | Acer Aspire R13 R7-372T 6200U, HD Graphics 520, 2x Hynix HFS128G39MND M.2 (RAID 0), IPS, 1920x1080, 13.3" | Lenovo Yoga 3 Pro 13 80HE004LGE 5Y70, HD Graphics 5300, Samsung SSD PM851 MZNTE512HMJH, IPS, 3200x1800, 13.3" | HP Spectre x360 13-4104ng 6200U, HD Graphics 520, Samsung SSD PM851 256 GB MZNTE256HMHP, IPS, 2560x1440, 13.3" | Acer Aspire Switch Alpha 12 SA5-271-56HM 6200U, HD Graphics 520, Kingston RBU-SNS8152S3256GG2, IPS, 2160x1440, 12" | |
|---|---|---|---|---|---|
| Power Consumption | -27% | -25% | -12% | -42% | |
| Idle Minimum * (Watt) | 4 | 5.1 -27% | 4.8 -20% | 3.9 2% | 7.3 -83% |
| Idle Average * (Watt) | 4.8 | 7.2 -50% | 10.7 -123% | 7.4 -54% | 10 -108% |
| Idle Maximum * (Watt) | 7.6 | 9 -18% | 11.8 -55% | 9.2 -21% | 10.15 -34% |
| Load Average * (Watt) | 30 | 34.2 -14% | 18.3 39% | 28.1 6% | 25.2 16% |
| Load Maximum * (Watt) | 29.3 | 37 -26% | 19.7 33% | 27.6 6% | 29.3 -0% |
* ... menor é melhor
| Dell Inspiron 13 7359-4839 6500U, HD Graphics 520, 44 Wh | Acer Aspire R13 R7-372T 6200U, HD Graphics 520, 50 Wh | Lenovo Yoga 3 Pro 13 80HE004LGE 5Y70, HD Graphics 5300, 44 Wh | HP Spectre x360 13-4104ng 6200U, HD Graphics 520, 56 Wh | Acer Aspire Switch Alpha 12 SA5-271-56HM 6200U, HD Graphics 520, 37 Wh | |
|---|---|---|---|---|---|
| Duração da bateria | -9% | -46% | 2% | -18% | |
| Reader / Idle (h) | 14.8 | 12.3 -17% | 10.7 -28% | ||
| WiFi v1.3 (h) | 8.1 | 7.4 -9% | 4.4 -46% | 8.3 2% | 5.4 -33% |
| Load (h) | 1.8 | 1.8 0% | 1.9 6% | ||
| H.264 (h) | 6.7 | 7.8 |
Pro
Contra
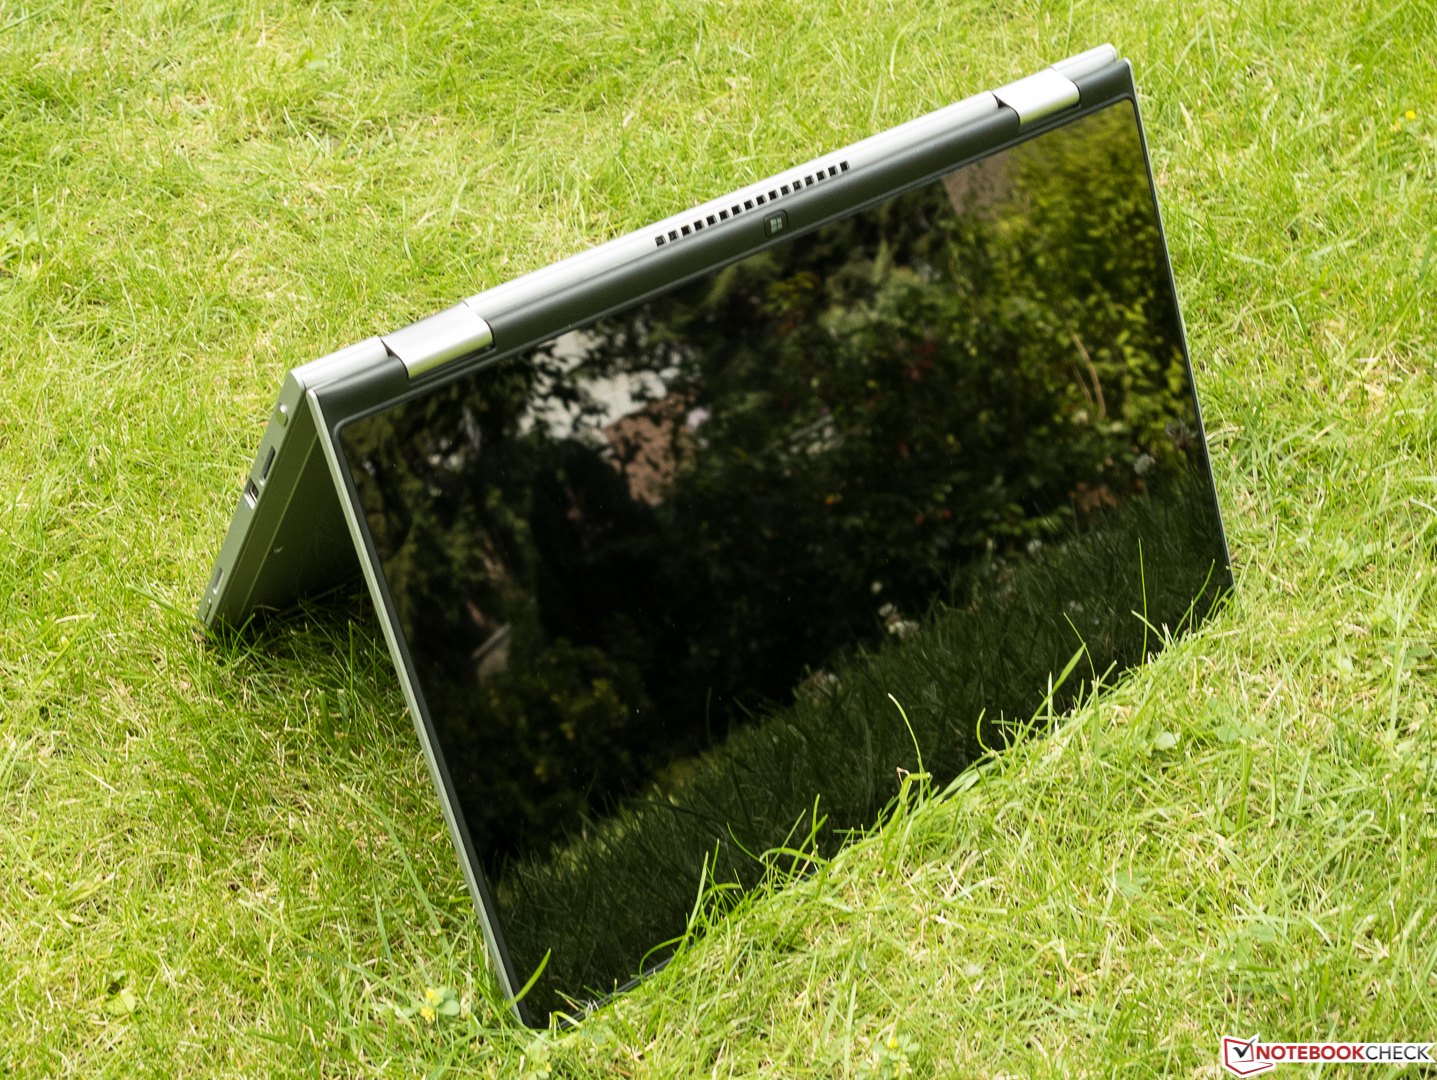
No final do teste, o Dell Inspiron 13 7359-4839 nos deixou levemente decepcionado. O motivo principal é a construção da tela que o torna inadequado para utilizá-lo como tablet.
O fato de que as evidentes distorções se materializem apenas quando está abrindo e ajustando a tampa normalmente, nos induziu a uma (benevolente) dedução de 10% na avaliação da carcaça. Afortunadamente (...) o aparelho é pesado demais para ser utilizado com uma só mão.
As outras desvantagens mencionadas na lista de pros não são tão importantes. Temos que criticar o baixo brilho de forma separada, especialmente para um conversível altamente móvel. Isto poderia ser um problema, particularmente em exteriores.
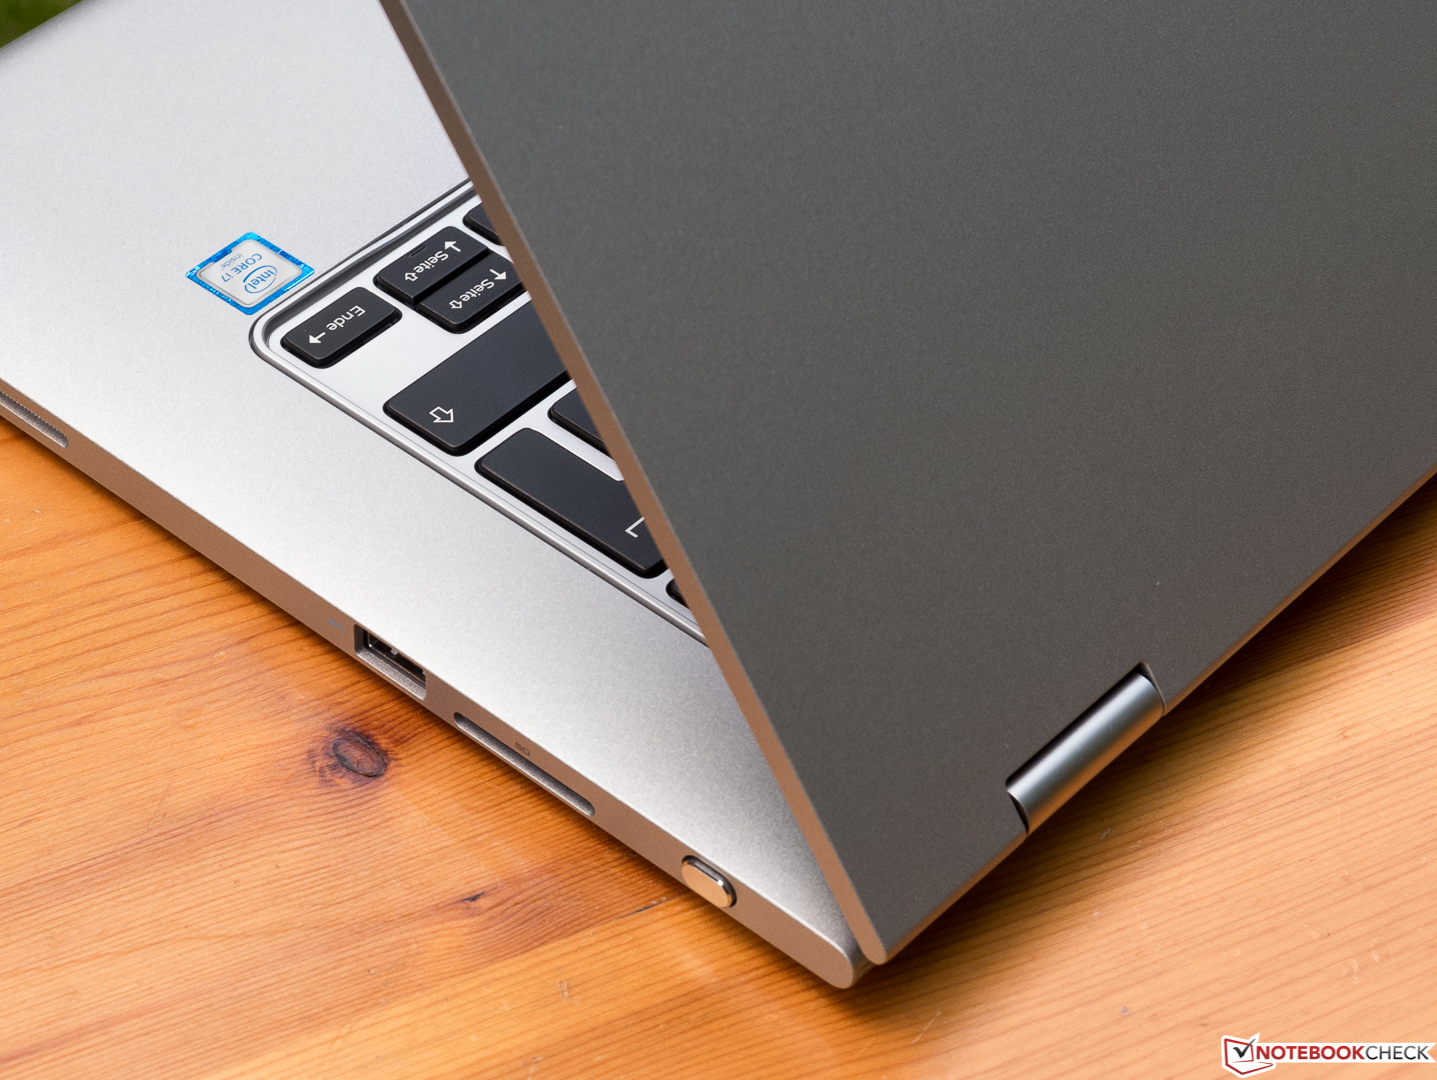
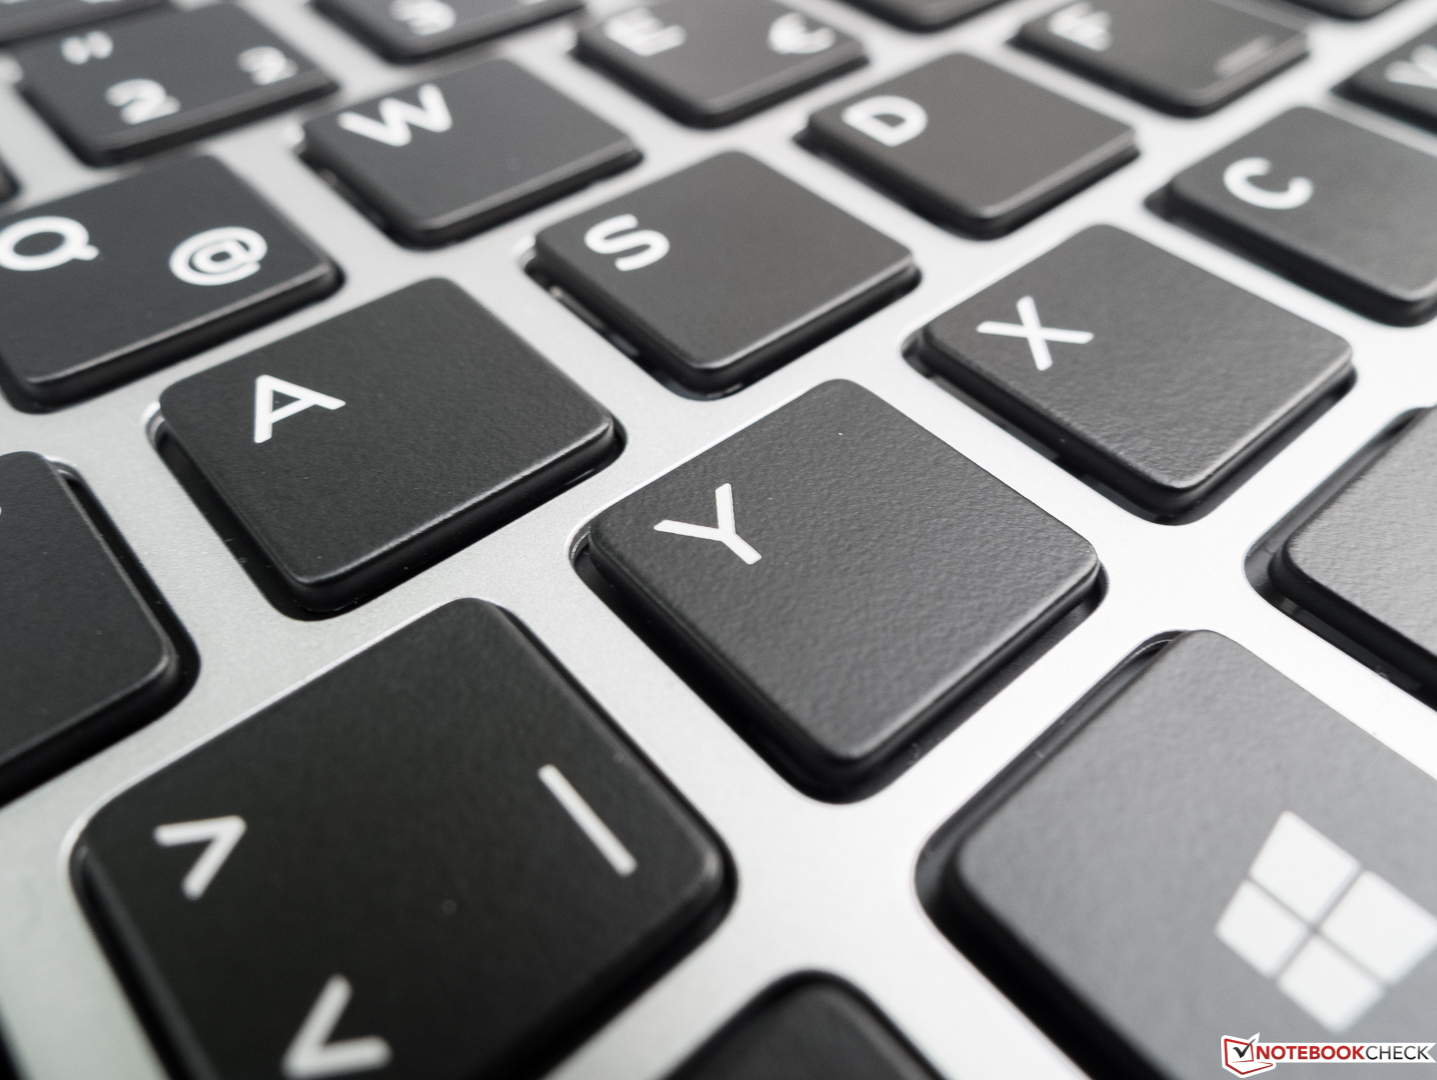
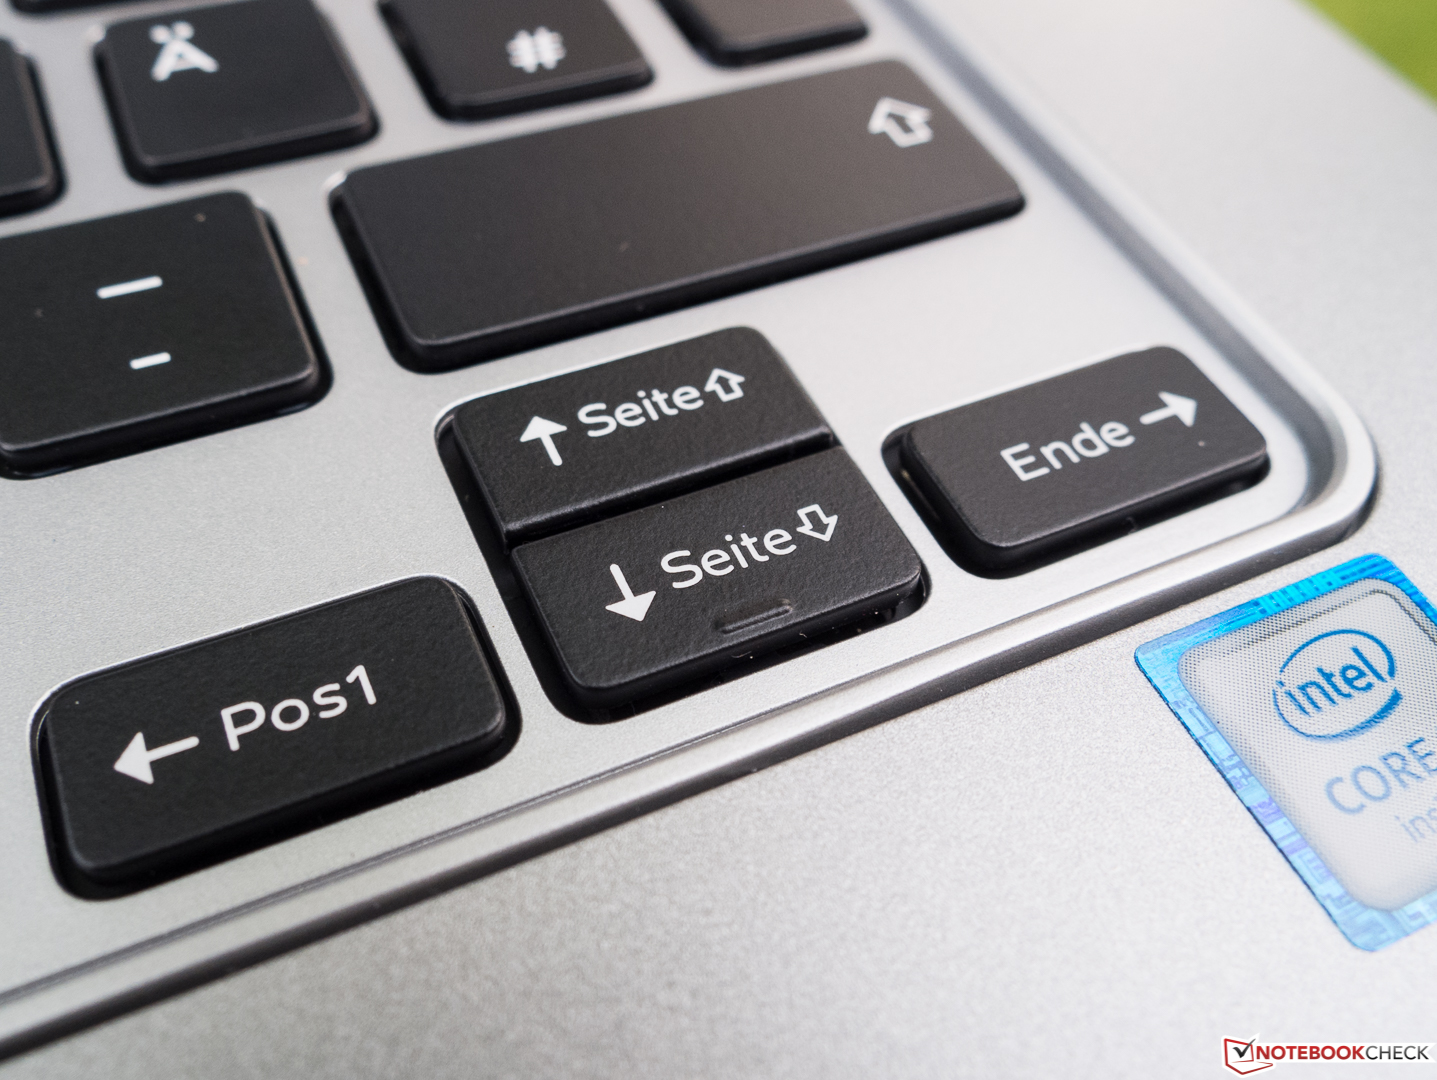
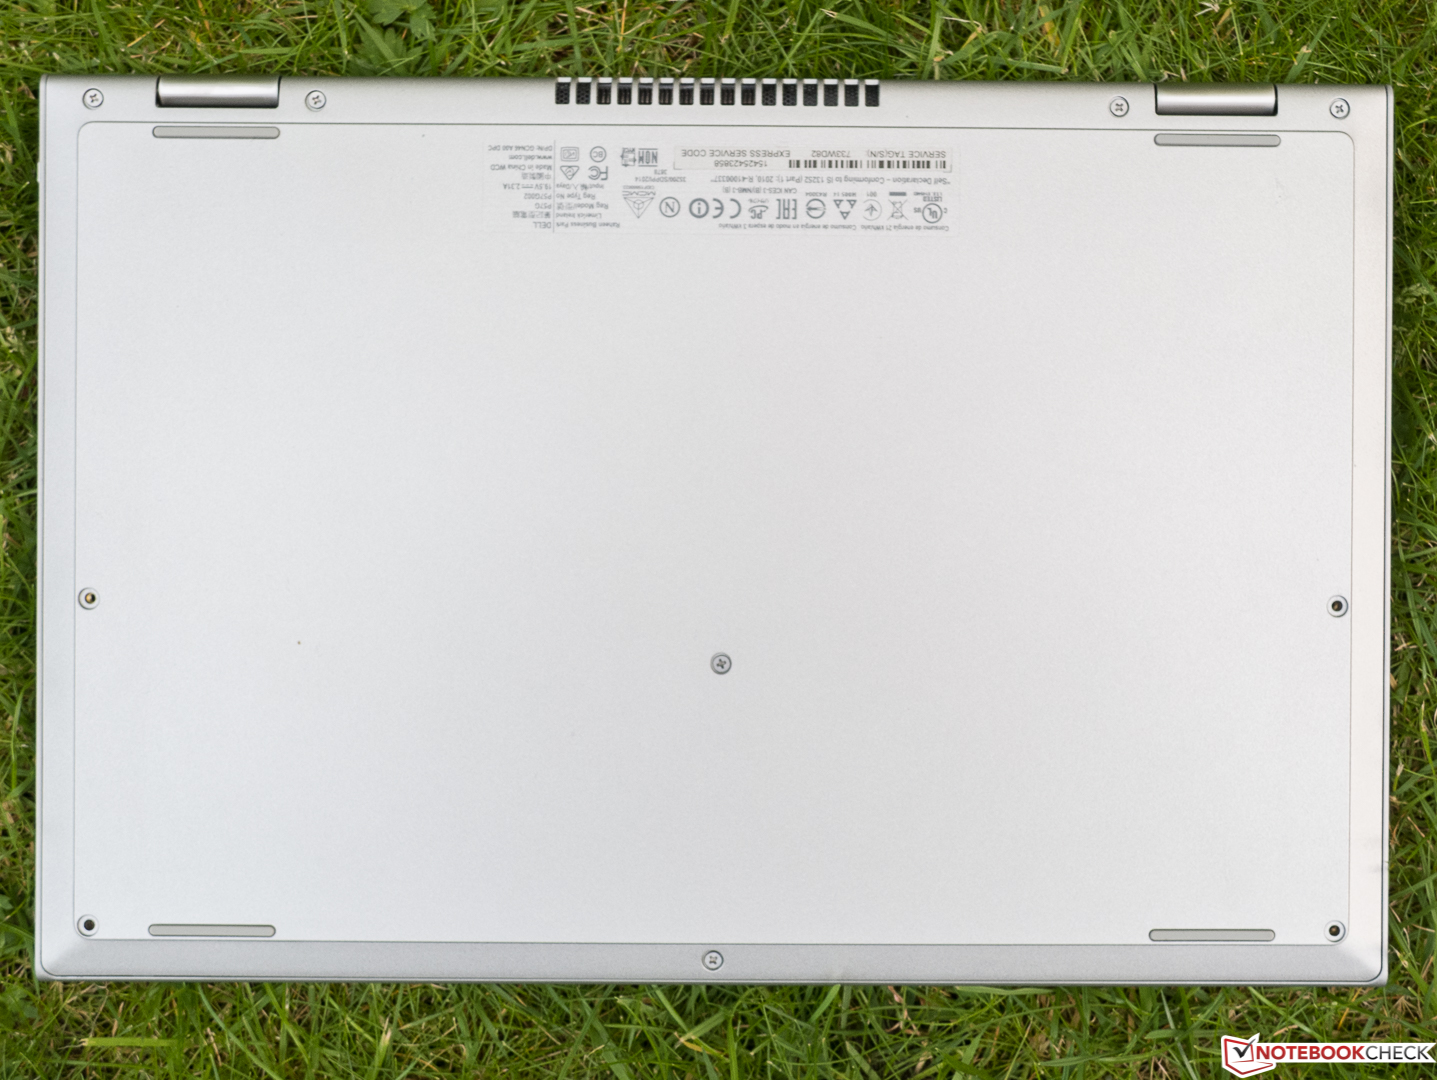
Finalmente, os diversos aspectos positivos: A base é elegante, sólida, muito bem construída, e inclui um stylus integrado. Os aspectos técnicos estão quase livres de críticas. O usuário normalmente pode contar com uma operação fria e silenciosa. Apesar de pequenos problemas com a iluminação de fundo do touchpad e teclado, os dispositivos de entrada estão bem concebidos. Os usuários que desejarem fazer manutenção provavelmente estarão contentes com o fato de que os interiores podem ser acessados muito bem através da grande escotilha. Finalmente, a importante estabilidade dos ângulos de visão para um tablet é absolutamente convincente.
Apesar de tudo, nós não podemos outorgar uma recomendação de compra para o aparelho, pelos motivos citados no início.
Esta é uma versão reduzida da análise original. Você pode ler a análise completa em inglês aqui.
Dell Inspiron 13 7359-4839
- 07/24/2016 v5.1 (old)
Sven Kloevekorn