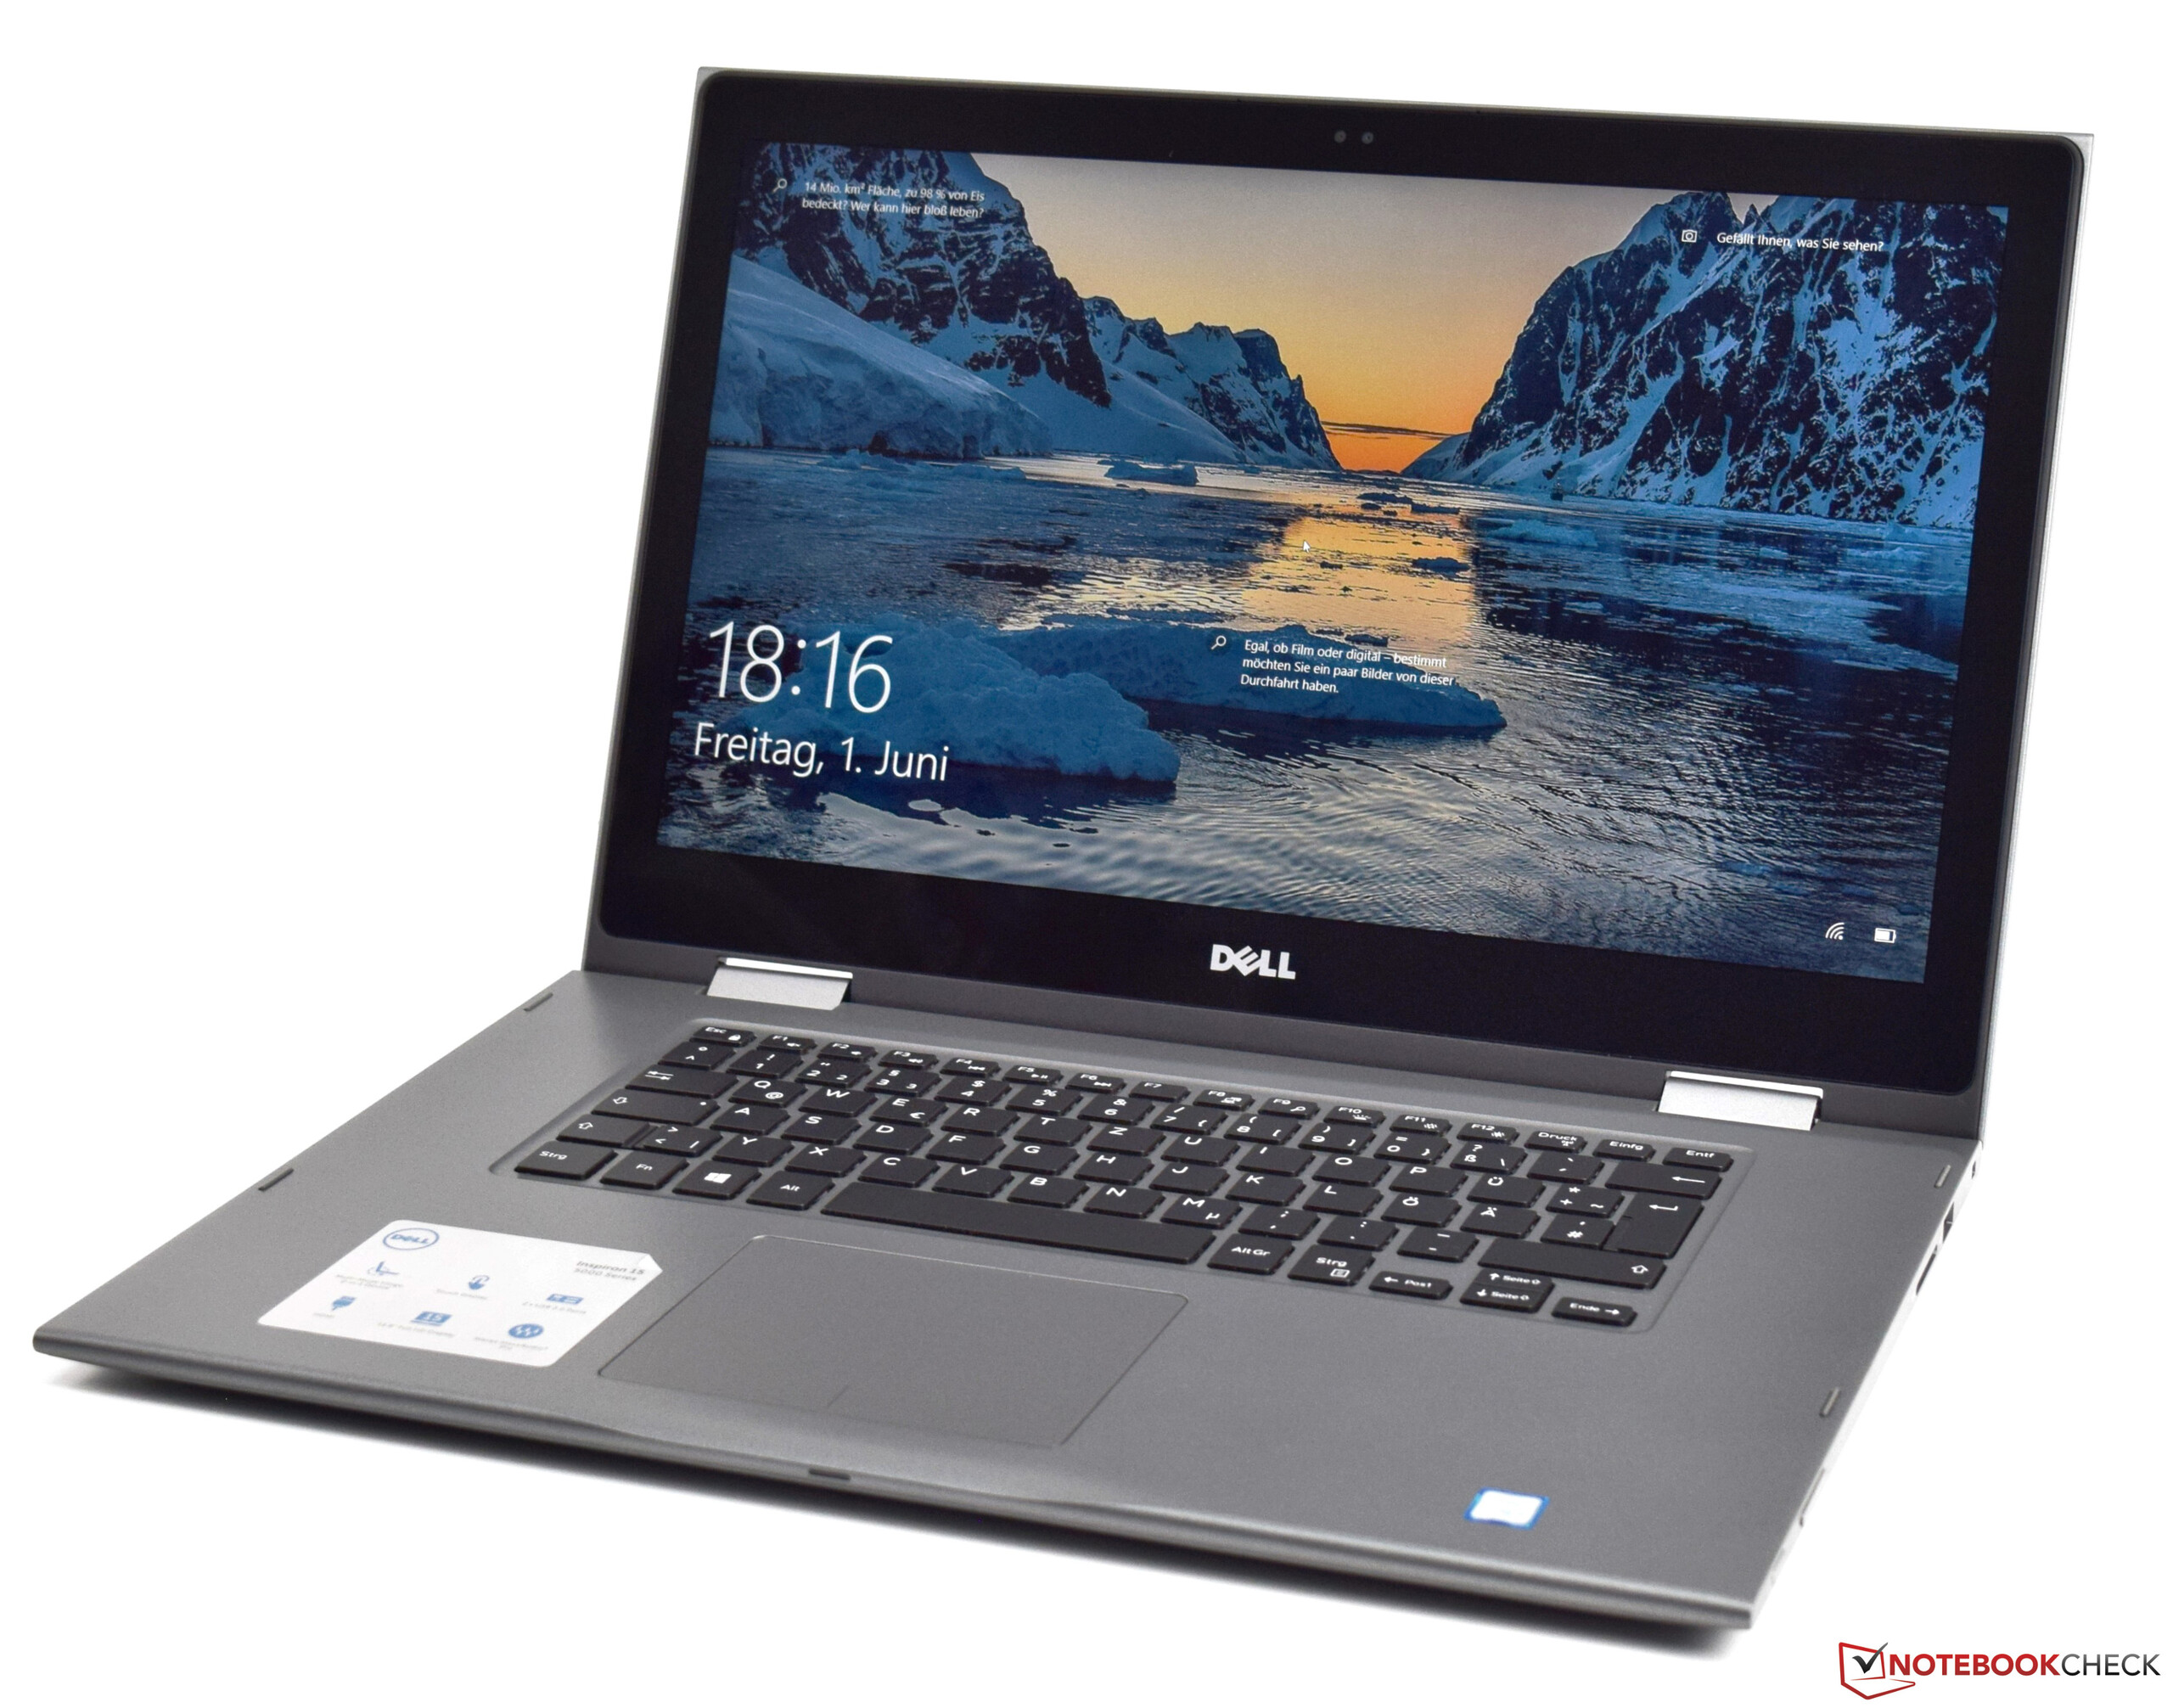
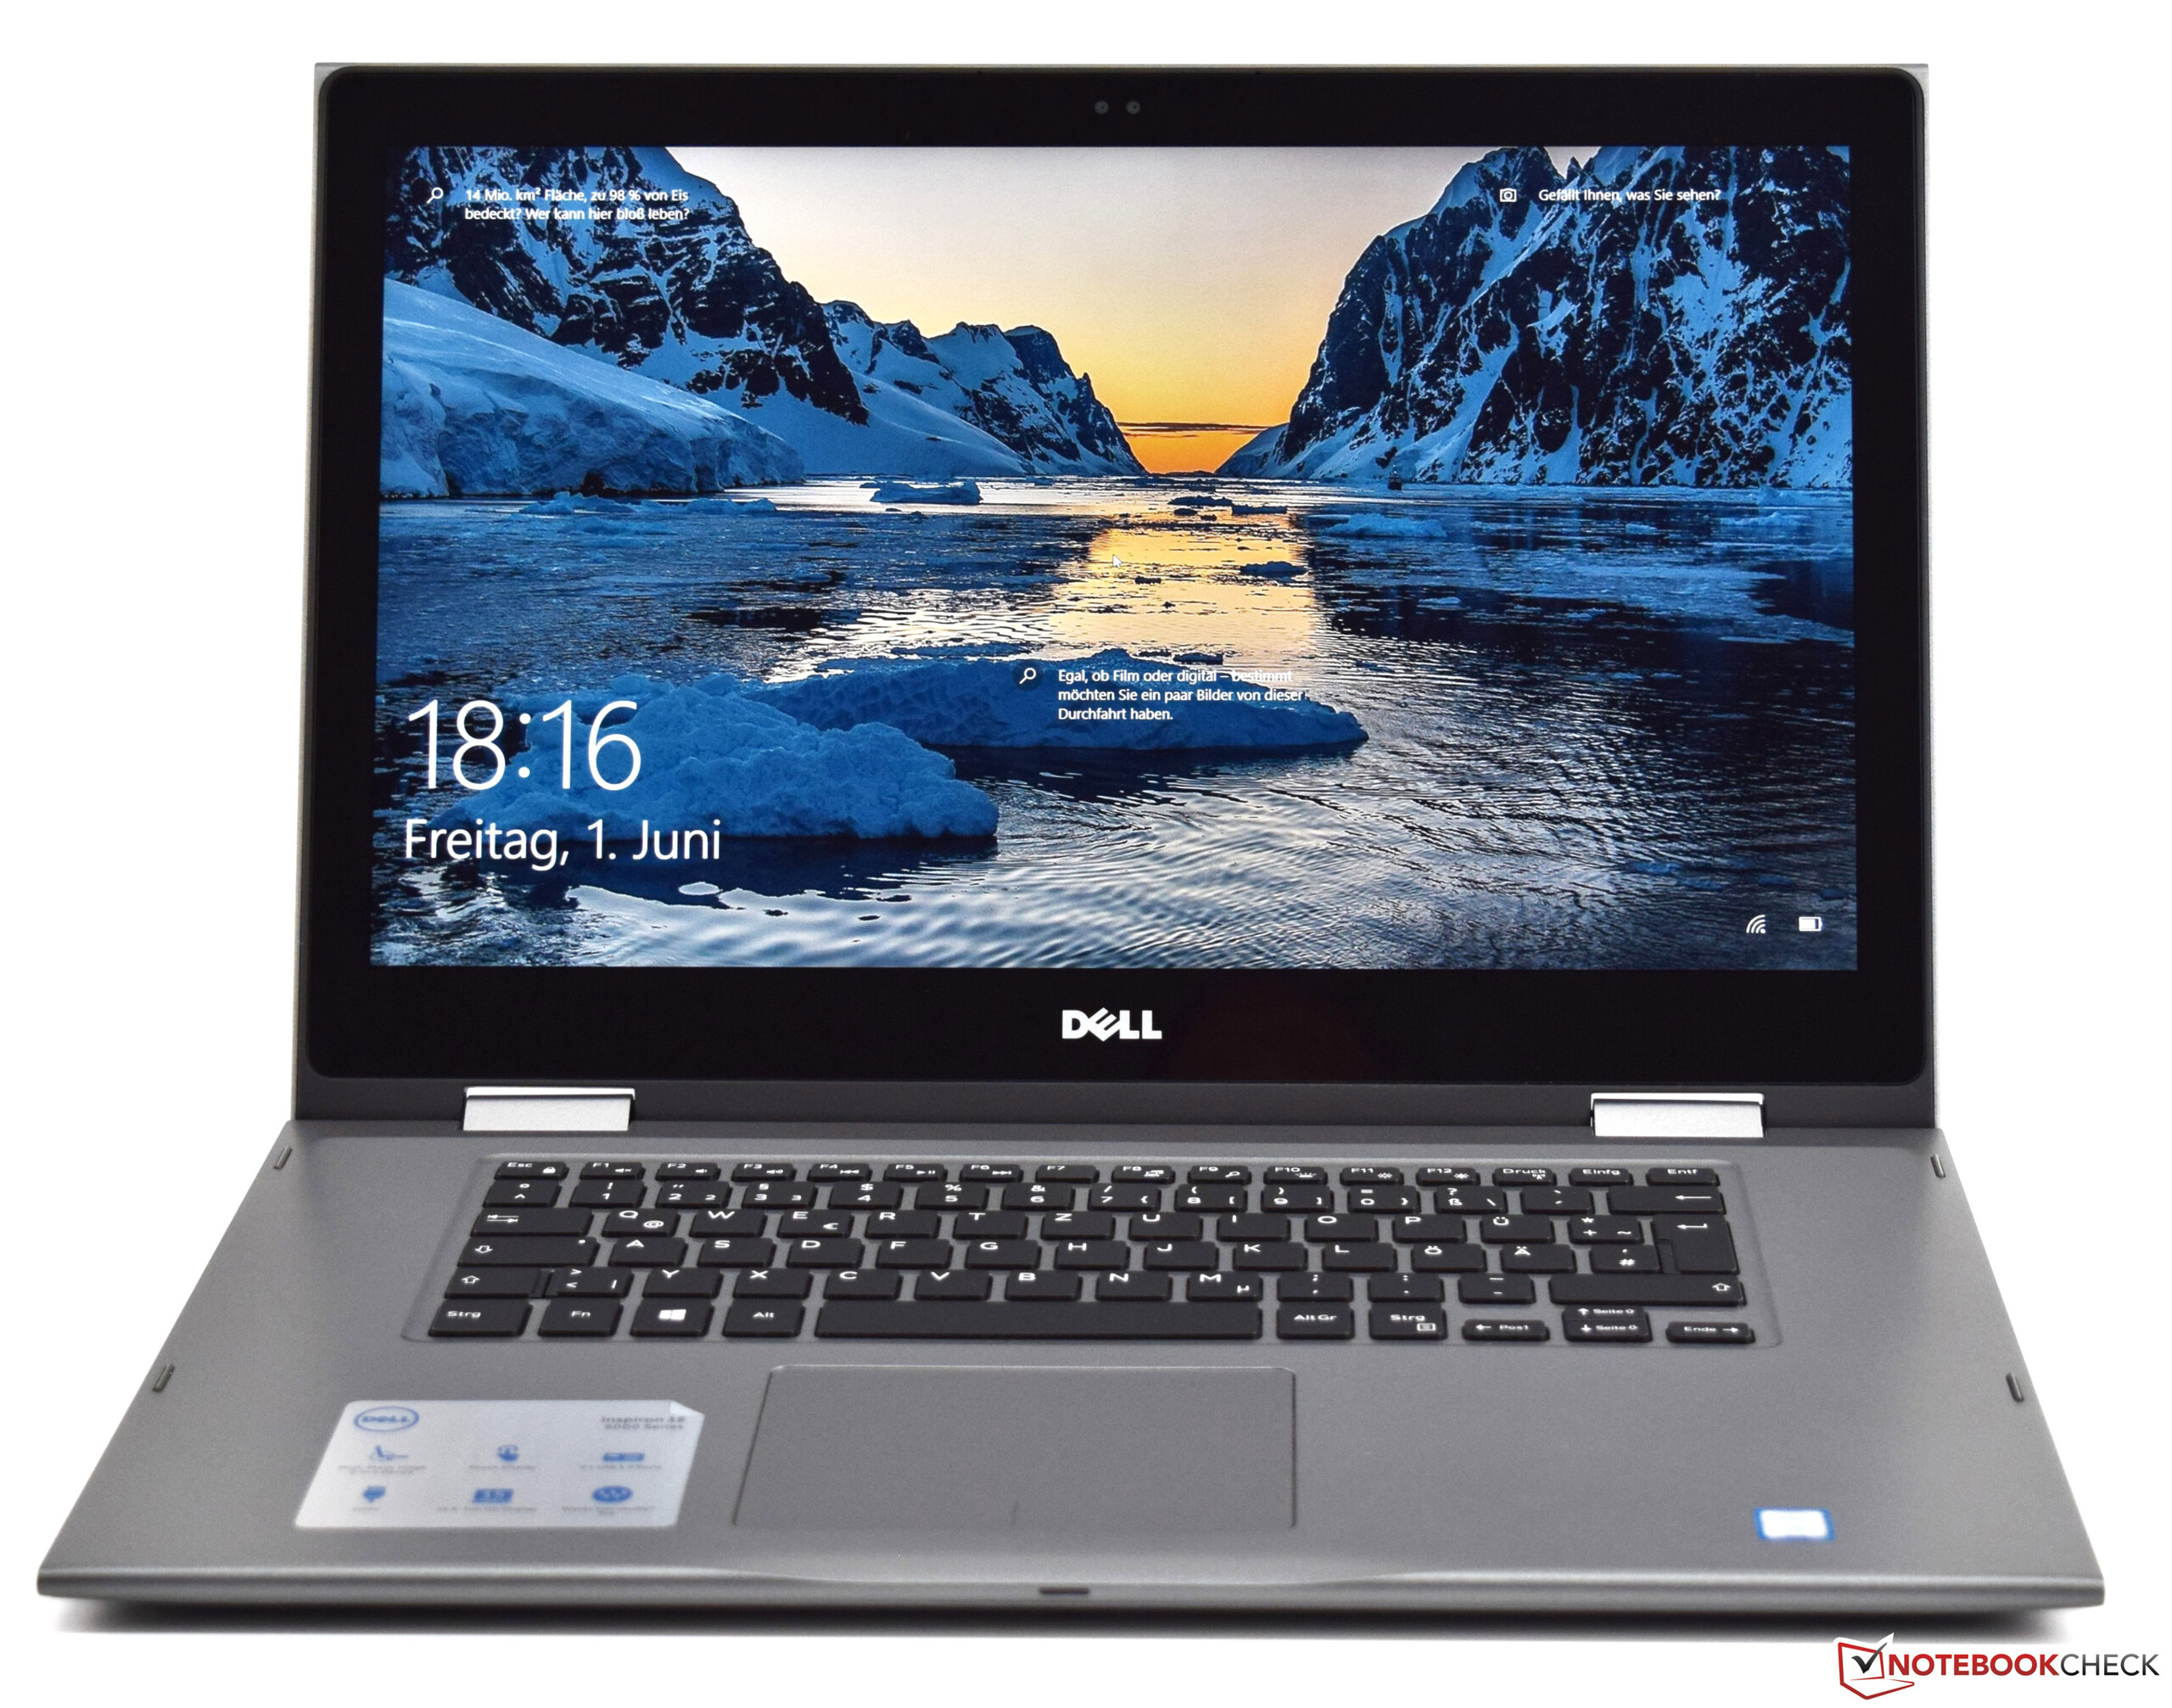
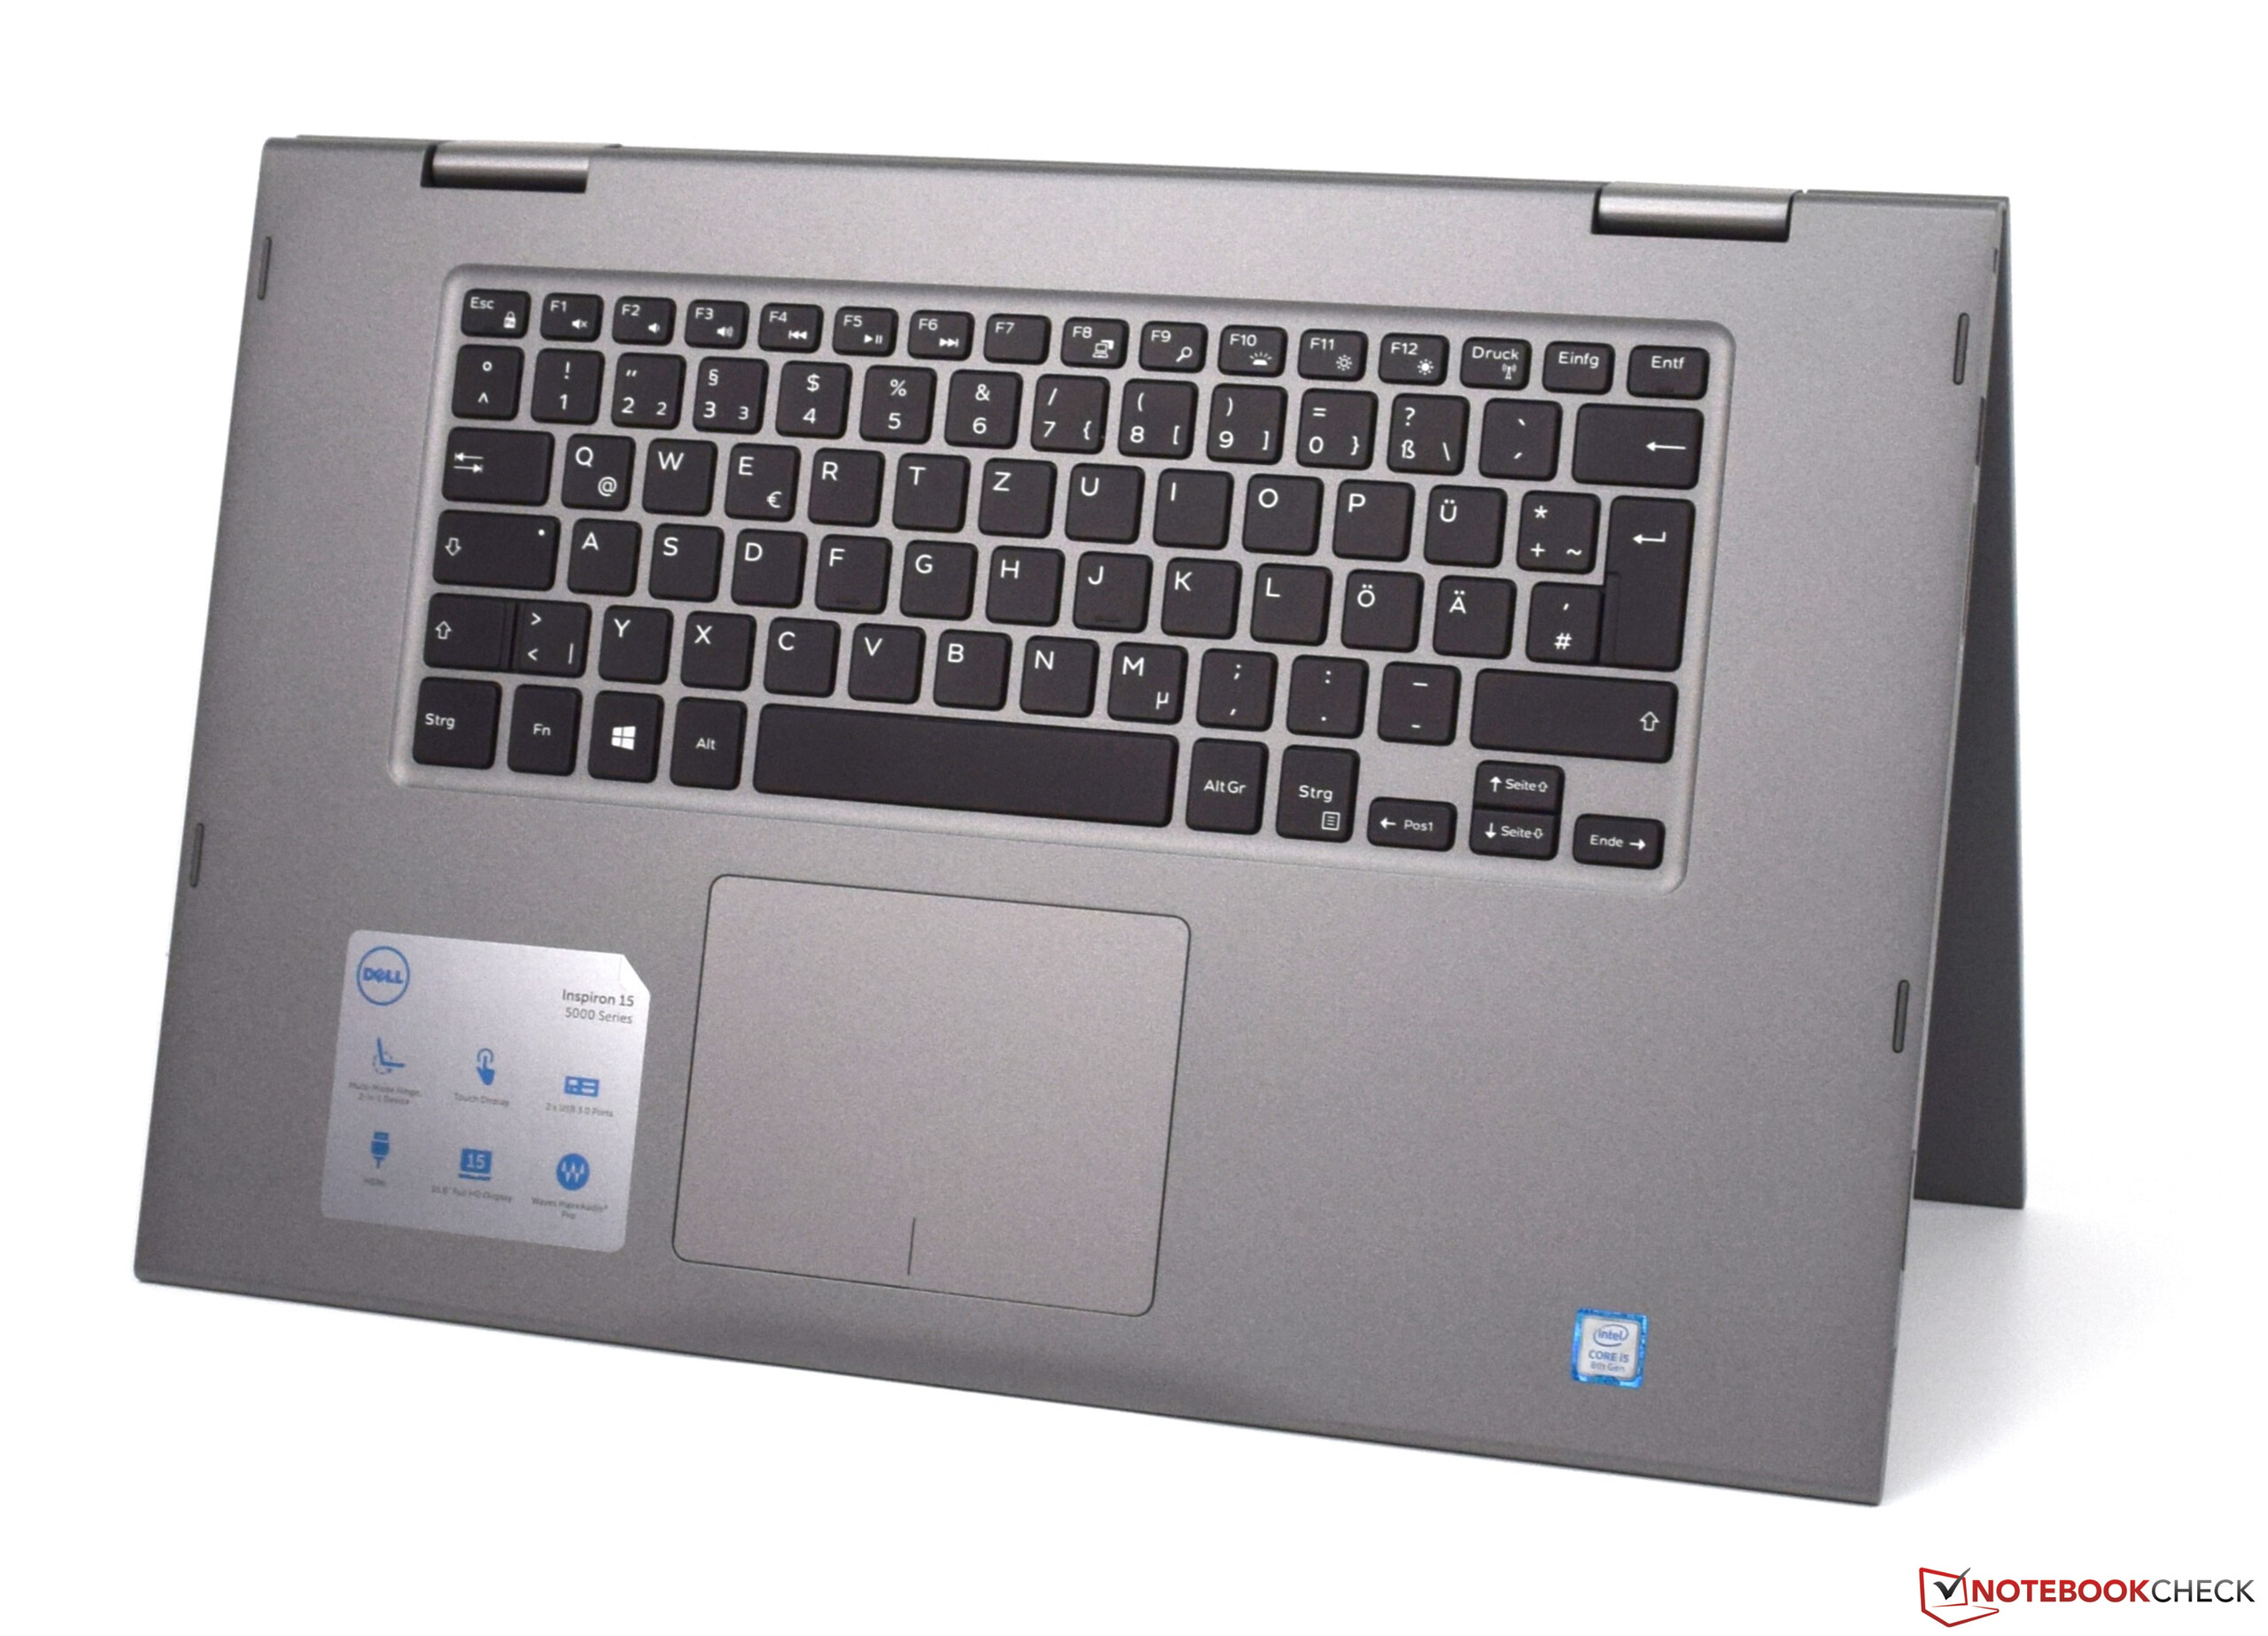
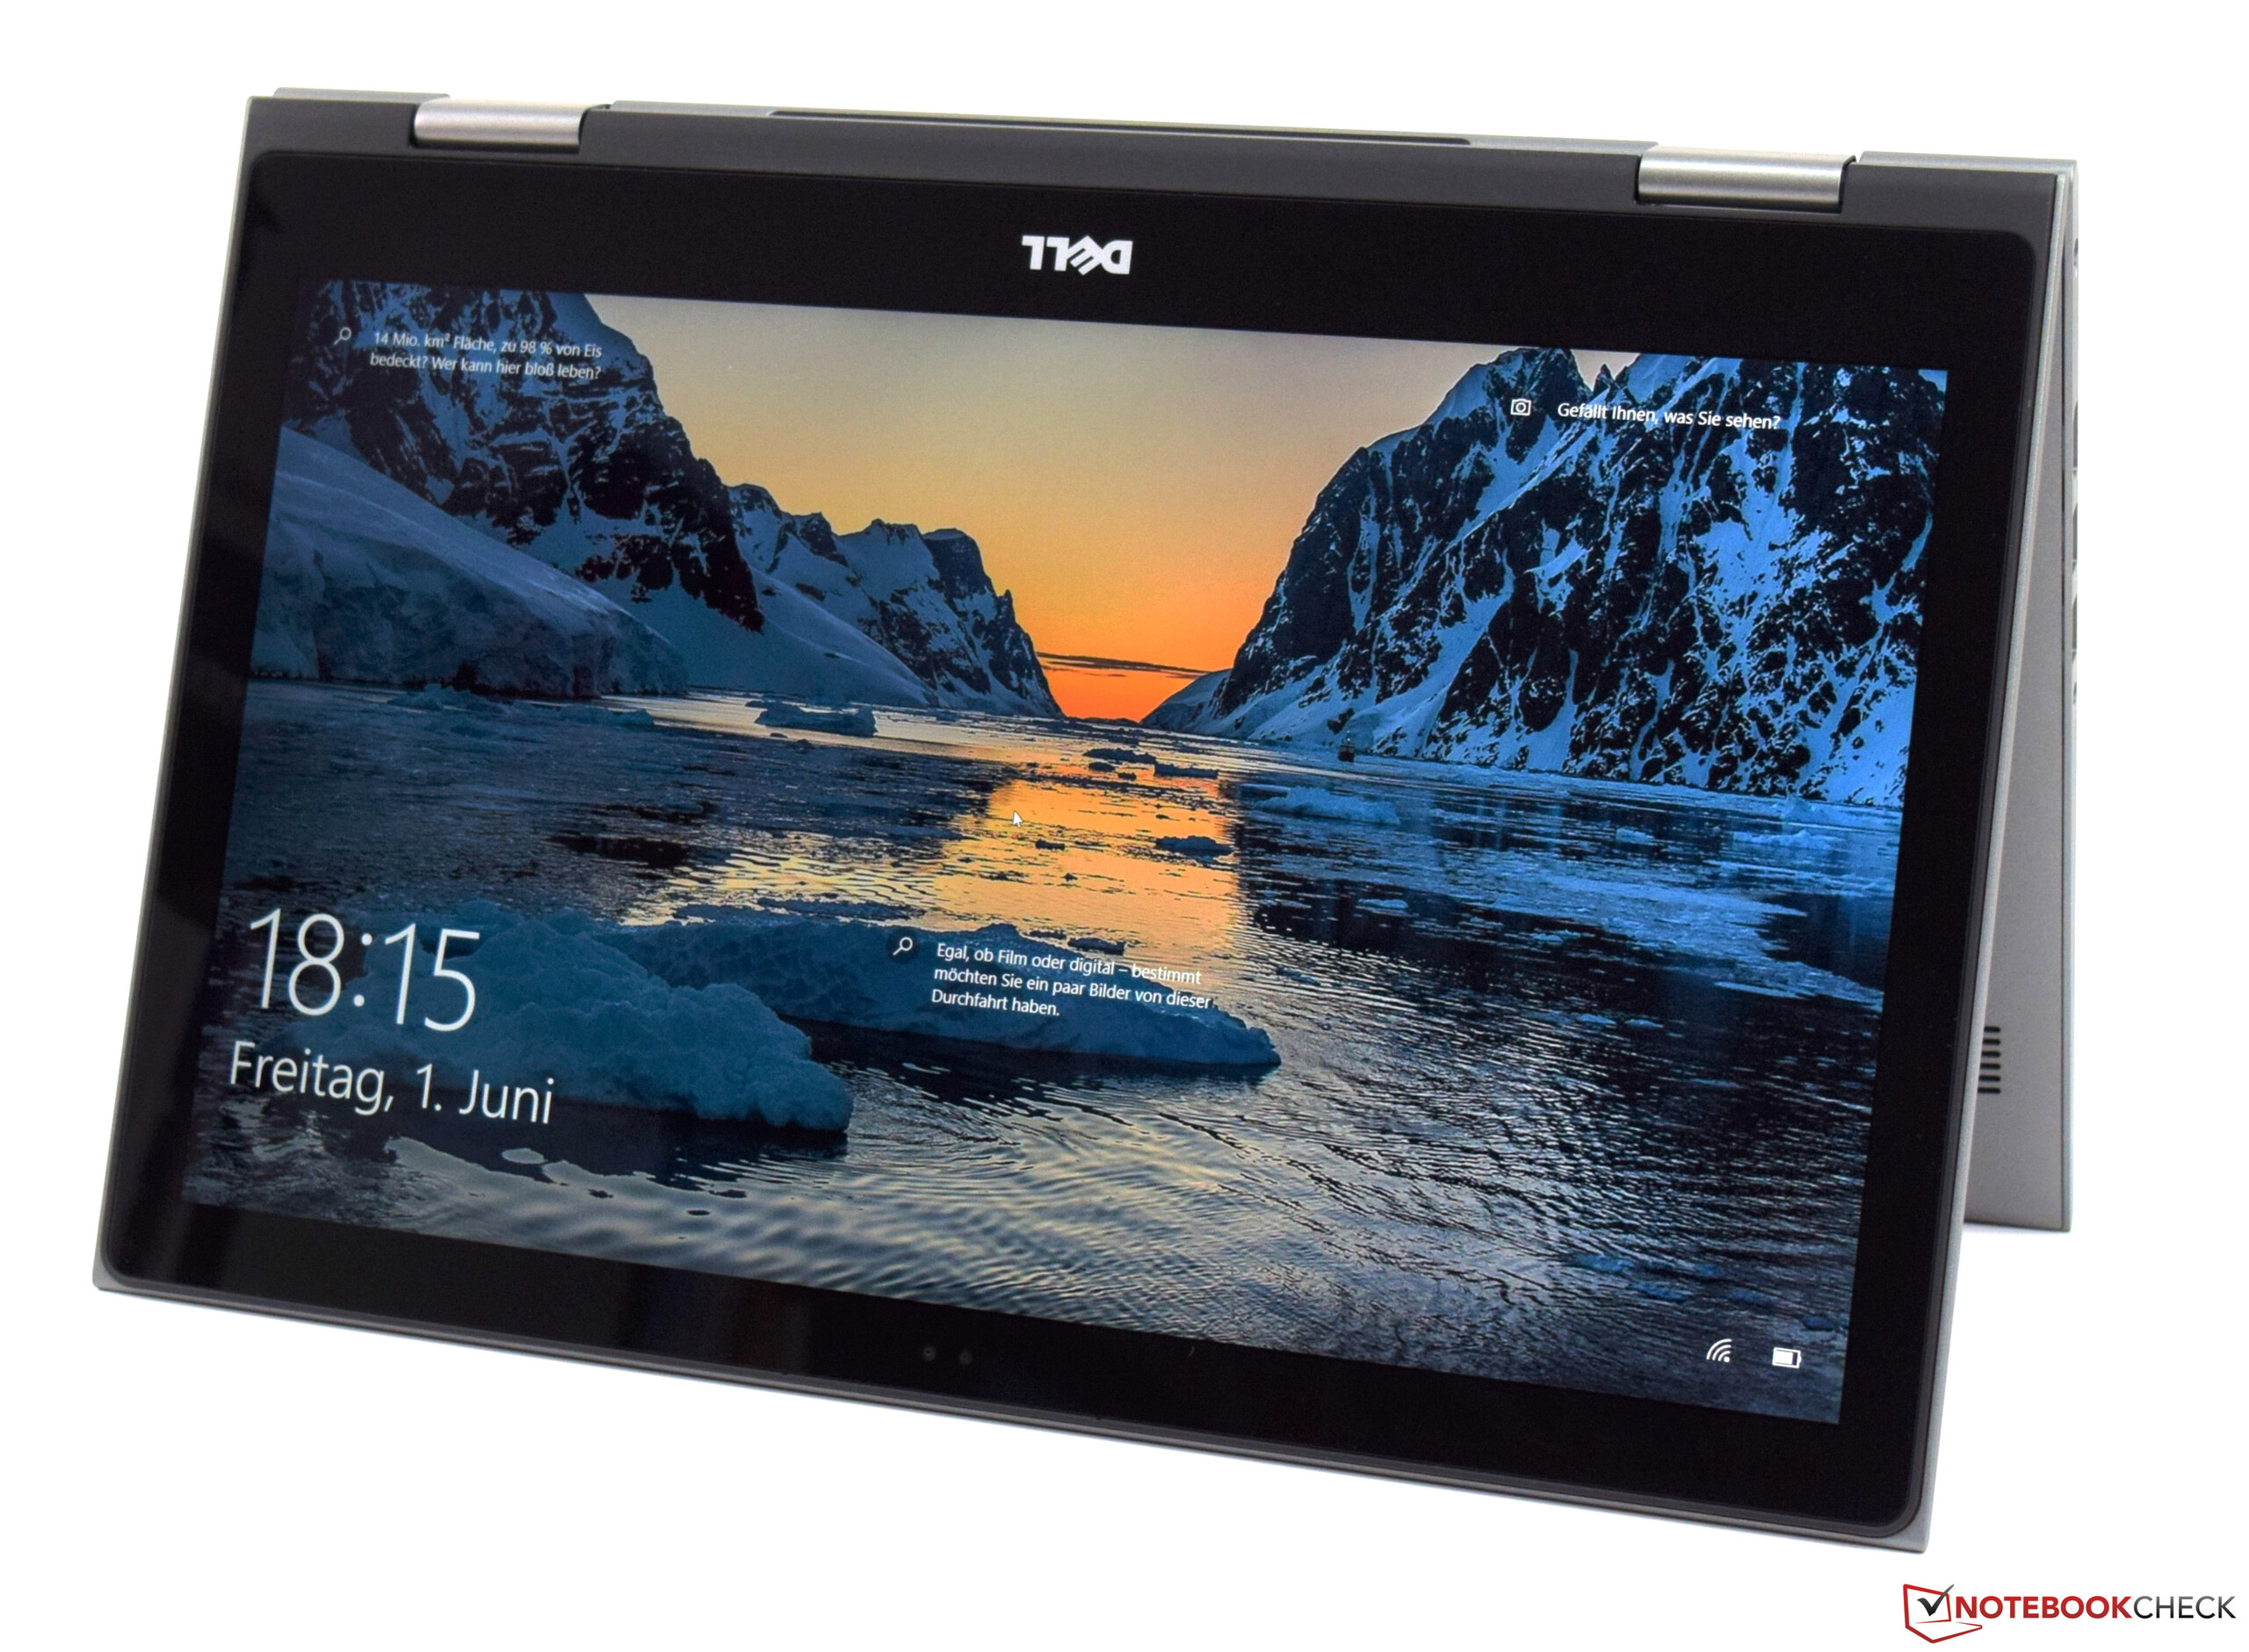
Breve Análise do Conversível Dell Inspiron 15 5579 (i5-8250U, SSD, IPS, Touch)
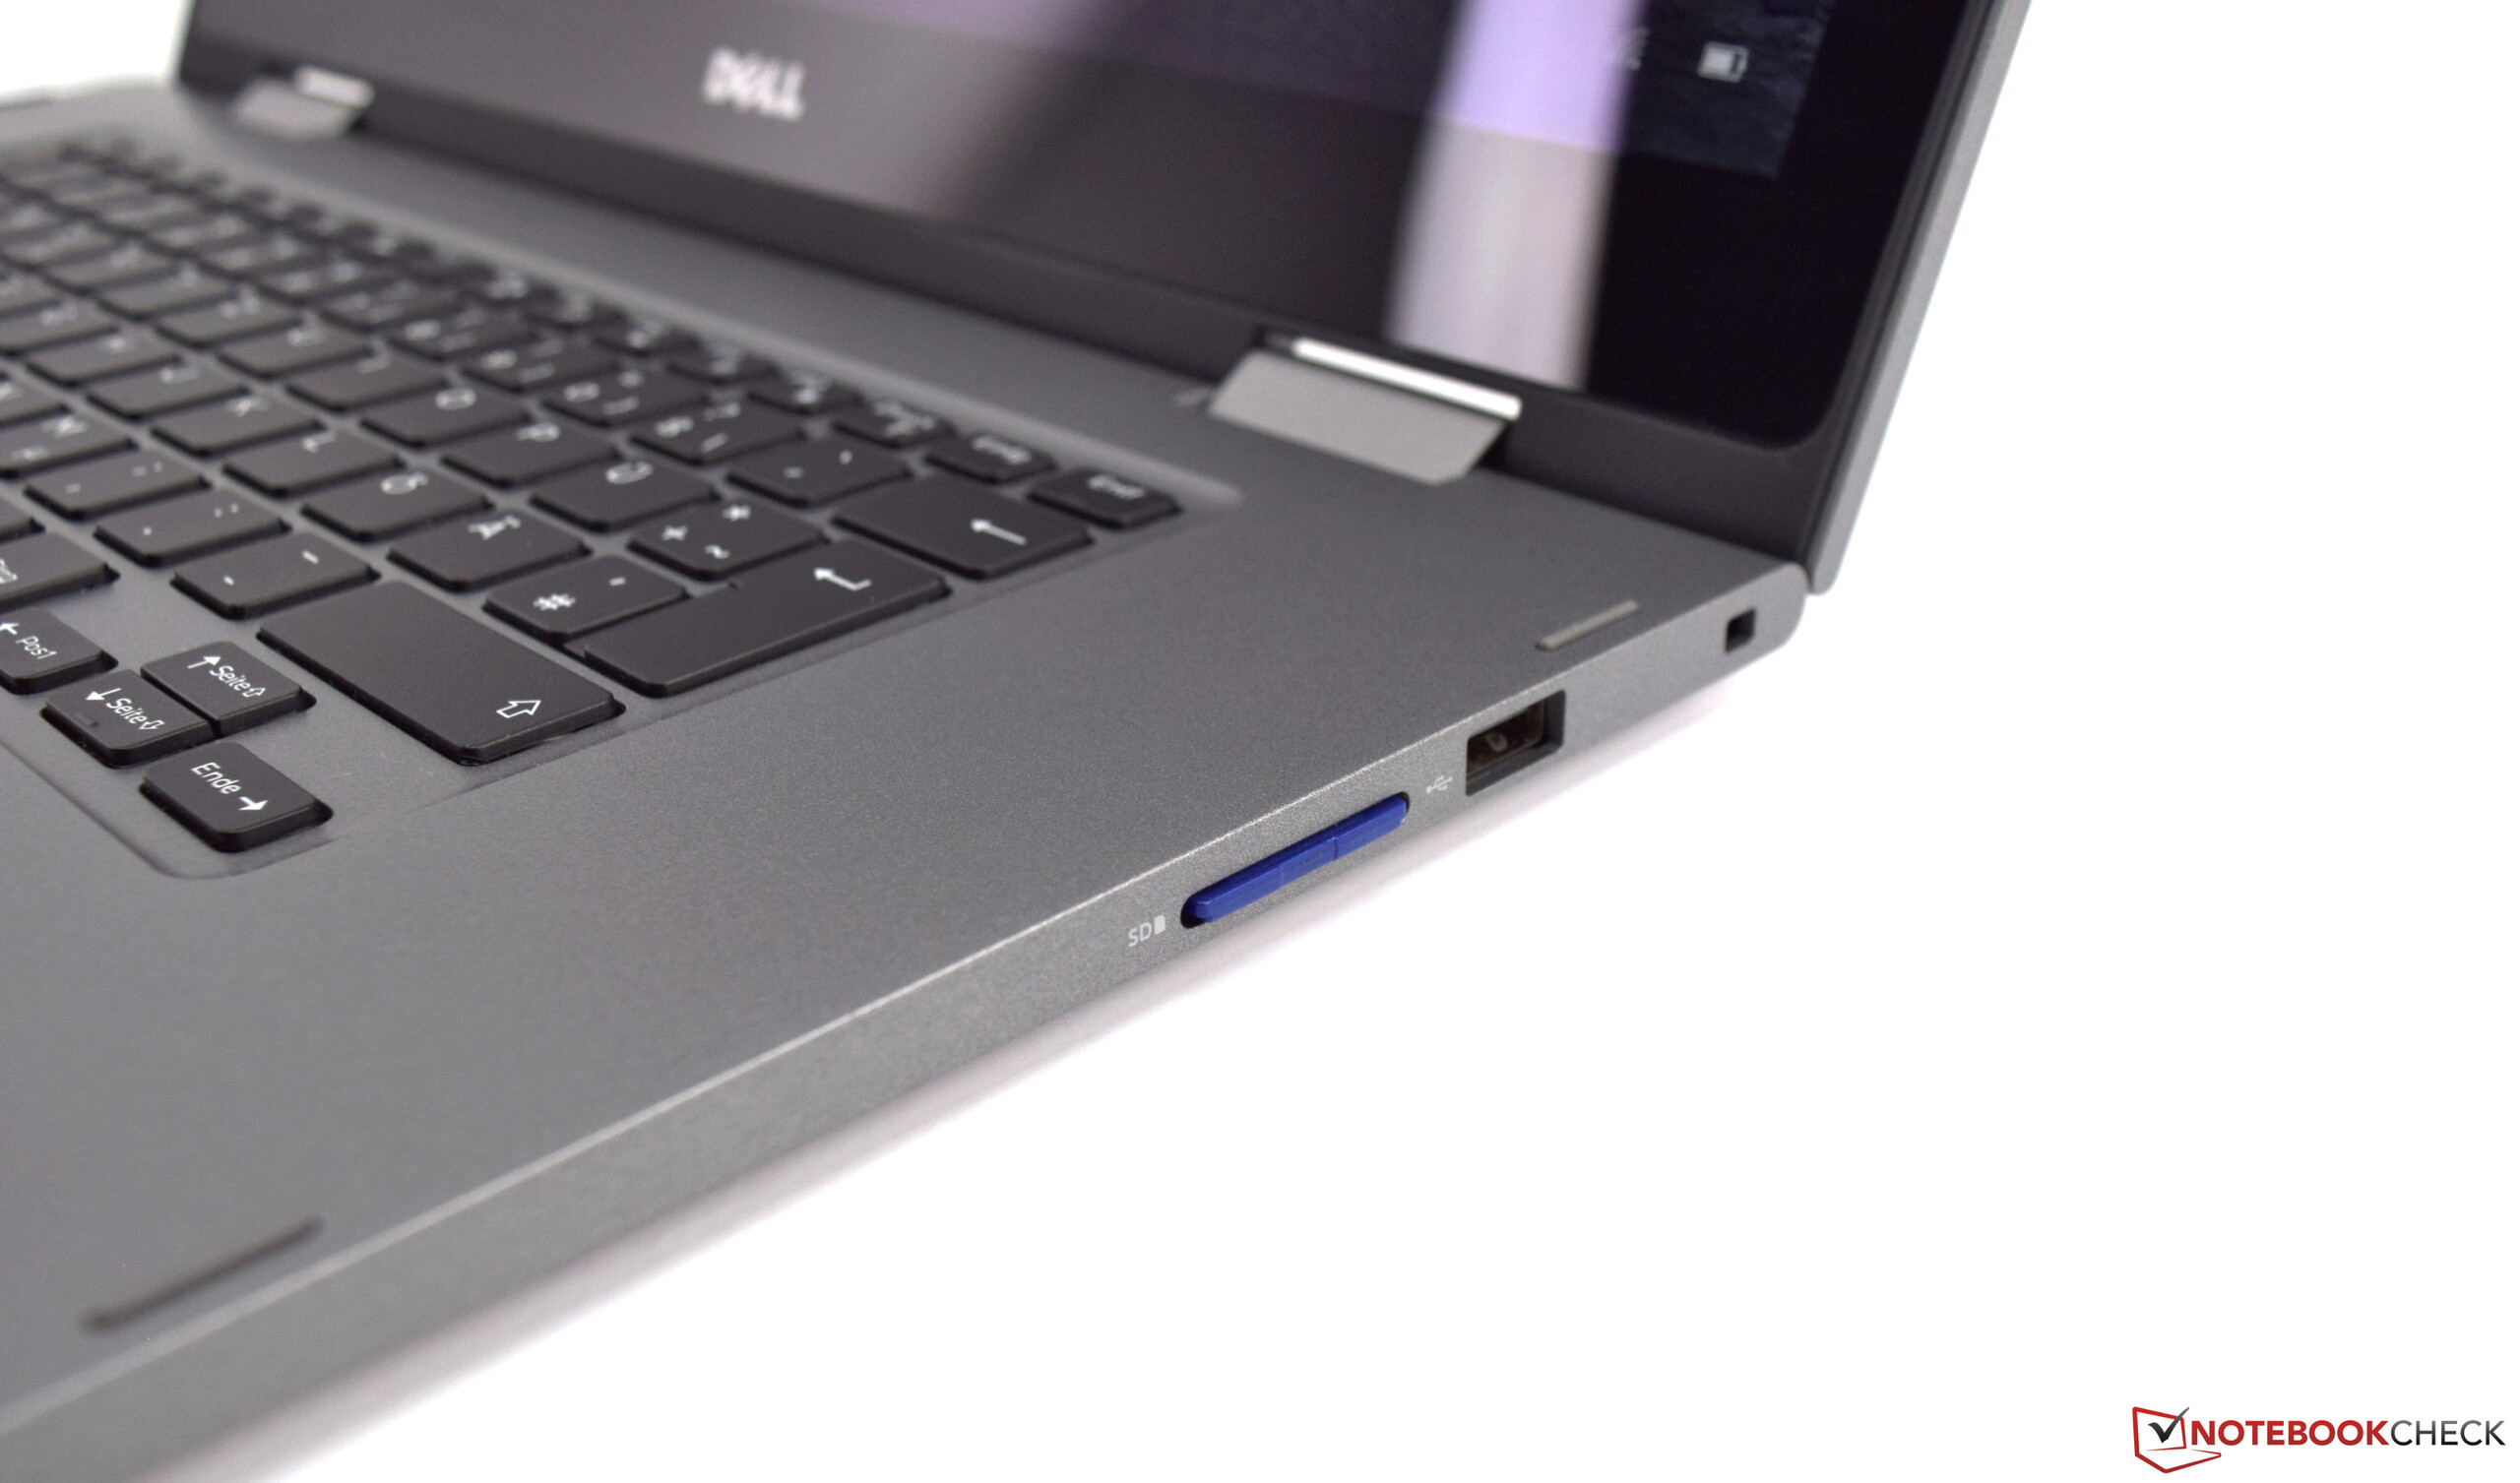

| SD Card Reader | |
| average JPG Copy Test (av. of 3 runs) | |
| Lenovo ThinkPad L380 Yoga-20M7001BGE (Toshiba Exceria Pro M501 microSDXC 64GB) | |
| HP Envy x360 15-bq102ng (Toshiba Exceria Pro SDXC 64 GB UHS-II) | |
| Média da turma Convertible (29.4 - 186, n=21, últimos 2 anos) | |
| Dell Inspiron 15 5578-1777 2-in-1 (Toshiba Exceria Pro SDXC 64 GB UHS-II) | |
| Dell Inspiron 15 5579-9672 (Toshiba Exceria Pro SDXC 64 GB UHS-II) | |
| Asus VivoBook Flip 15 TP510UA-E8073T (Toshiba Exceria Pro SDXC 64 GB UHS-II) | |
| Acer Spin 3 SP314-51-548L (Toshiba Exceria Pro SDXC 64 GB UHS-II) | |
| maximum AS SSD Seq Read Test (1GB) | |
| Média da turma Convertible (67.5 - 254, n=20, últimos 2 anos) | |
| Lenovo ThinkPad L380 Yoga-20M7001BGE (Toshiba Exceria Pro M501 microSDXC 64GB) | |
| HP Envy x360 15-bq102ng (Toshiba Exceria Pro SDXC 64 GB UHS-II) | |
| Dell Inspiron 15 5578-1777 2-in-1 (Toshiba Exceria Pro SDXC 64 GB UHS-II) | |
| Dell Inspiron 15 5579-9672 (Toshiba Exceria Pro SDXC 64 GB UHS-II) | |
| Asus VivoBook Flip 15 TP510UA-E8073T (Toshiba Exceria Pro SDXC 64 GB UHS-II) | |
| Acer Spin 3 SP314-51-548L (Toshiba Exceria Pro SDXC 64 GB UHS-II) | |
| |||||||||||||||||||||||||
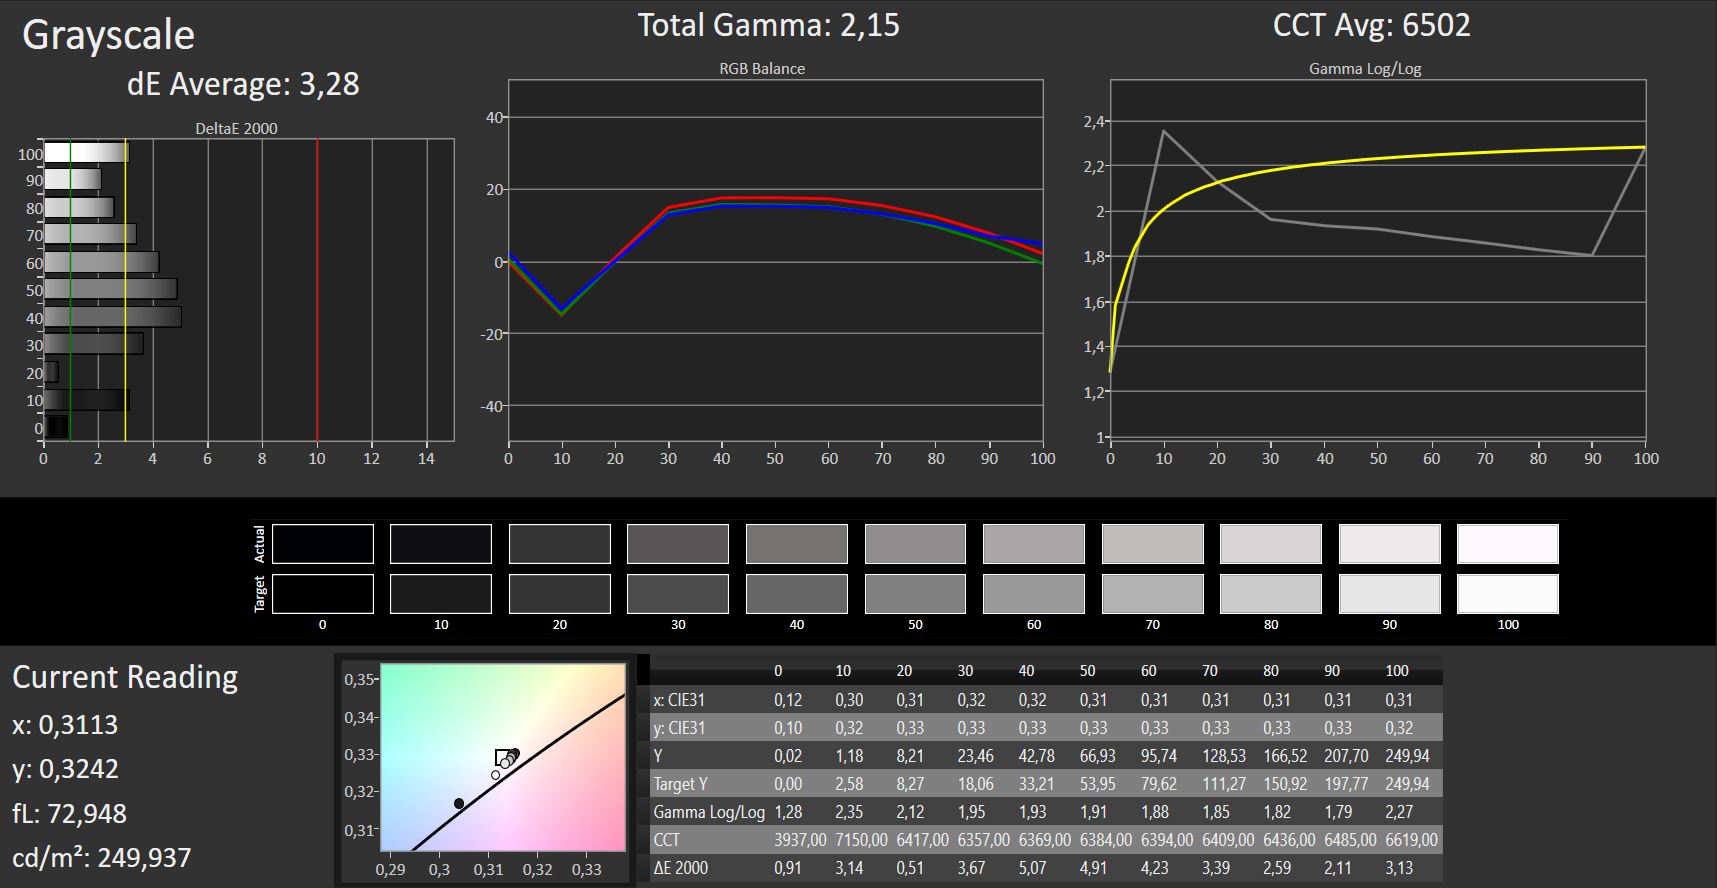
iluminação: 84 %
iluminação com acumulador: 249 cd/m²
Contraste: 1255:1 (Preto: 0.2 cd/m²)
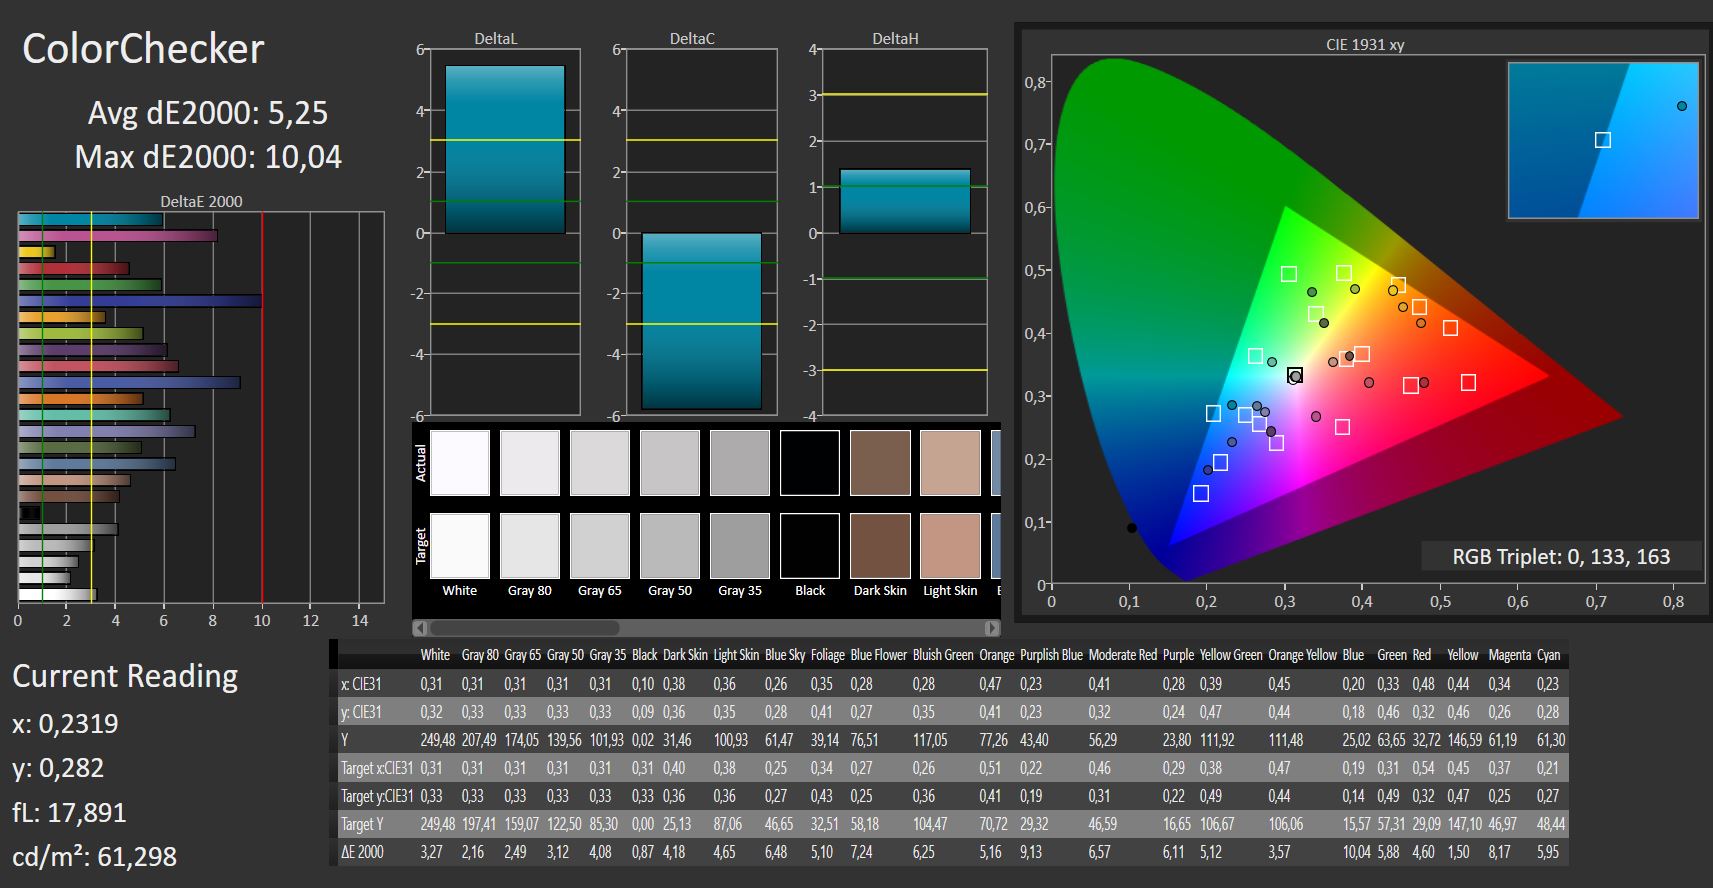
ΔE ColorChecker Calman: 5.25 | ∀{0.5-29.43 Ø4.71}
ΔE Greyscale Calman: 3.28 | ∀{0.09-98 Ø4.96}
55% sRGB (Argyll 1.6.3 3D)
35% AdobeRGB 1998 (Argyll 1.6.3 3D)
38.23% AdobeRGB 1998 (Argyll 3D)
55.6% sRGB (Argyll 3D)
37% Display P3 (Argyll 3D)
Gamma: 2.15
CCT: 6502 K
| Dell Inspiron 15 5579-9672 AUO, B156HW01, 1920x1080, 15.6" | Dell Inspiron 15 5578-1777 2-in-1 LG Philips (Dell 156WF7), 1920x1080, 15.6" | HP Envy x360 15-bq102ng Chi Mei CM15E9, 1920x1080, 15.6" | Asus VivoBook Flip 15 TP510UA-E8073T AU Optronics B156HAN02.1, 1920x1080, 15.6" | Acer Spin 3 SP314-51-548L BOE CQ NV140FHM-N41, 1920x1080, 14" | Lenovo ThinkPad L380 Yoga-20M7001BGE M133NWF4-R3, 1920x1080, 13.3" | |
|---|---|---|---|---|---|---|
| Display | 13% | 12% | 6% | 7% | 74% | |
| Display P3 Coverage (%) | 37 | 41.74 13% | 41.36 12% | 39.19 6% | 39.68 7% | 65.1 76% |
| sRGB Coverage (%) | 55.6 | 62.8 13% | 62.2 12% | 58.9 6% | 58.9 6% | 95.5 72% |
| AdobeRGB 1998 Coverage (%) | 38.23 | 43.13 13% | 42.74 12% | 40.49 6% | 41 7% | 66.9 75% |
| Response Times | -2% | 6% | -4% | -13% | -6% | |
| Response Time Grey 50% / Grey 80% * (ms) | 41 ? | 55 ? -34% | 40 ? 2% | 44 ? -7% | 43 ? -5% | 47 ? -15% |
| Response Time Black / White * (ms) | 29 ? | 20 ? 31% | 26 ? 10% | 29 ? -0% | 35 ? -21% | 28 ? 3% |
| PWM Frequency (Hz) | 25000 ? | 1000 | 217 ? | |||
| Screen | -3% | 17% | -2% | 9% | 13% | |
| Brightness middle (cd/m²) | 251 | 244 -3% | 221 -12% | 229 -9% | 220 -12% | 323 29% |
| Brightness (cd/m²) | 240 | 242 1% | 207 -14% | 221 -8% | 221 -8% | 310 29% |
| Brightness Distribution (%) | 84 | 93 11% | 87 4% | 76 -10% | 78 -7% | 88 5% |
| Black Level * (cd/m²) | 0.2 | 0.25 -25% | 0.15 25% | 0.15 25% | 0.18 10% | 0.22 -10% |
| Contrast (:1) | 1255 | 976 -22% | 1473 17% | 1527 22% | 1222 -3% | 1468 17% |
| Colorchecker dE 2000 * | 5.25 | 4.94 6% | 4.35 17% | 5.03 4% | 3.98 24% | 5 5% |
| Colorchecker dE 2000 max. * | 10.04 | 7.3 27% | 8.98 11% | 8.89 11% | 7.69 23% | 9.56 5% |
| Greyscale dE 2000 * | 3.28 | 4.93 -50% | 3.09 6% | 5.56 -70% | 1.68 49% | 6.64 -102% |
| Gamma | 2.15 102% | 2.7 81% | 2.23 99% | 2.64 83% | 2.37 93% | 2.2 100% |
| CCT | 6502 100% | 7401 88% | 6068 107% | 7015 93% | 6382 102% | 6638 98% |
| Color Space (Percent of AdobeRGB 1998) (%) | 35 | 40 14% | 56 60% | 37 6% | 38 9% | 61 74% |
| Color Space (Percent of sRGB) (%) | 55 | 63 15% | 86 56% | 59 7% | 58 5% | 95 73% |
| Colorchecker dE 2000 calibrated * | 4 | |||||
| Média Total (Programa/Configurações) | 3% /
1% | 12% /
15% | 0% /
-1% | 1% /
6% | 27% /
22% |
* ... menor é melhor
Exibir tempos de resposta
| ↔ Tempo de resposta preto para branco | ||
|---|---|---|
| 29 ms ... ascensão ↗ e queda ↘ combinadas | ↗ 17 ms ascensão | 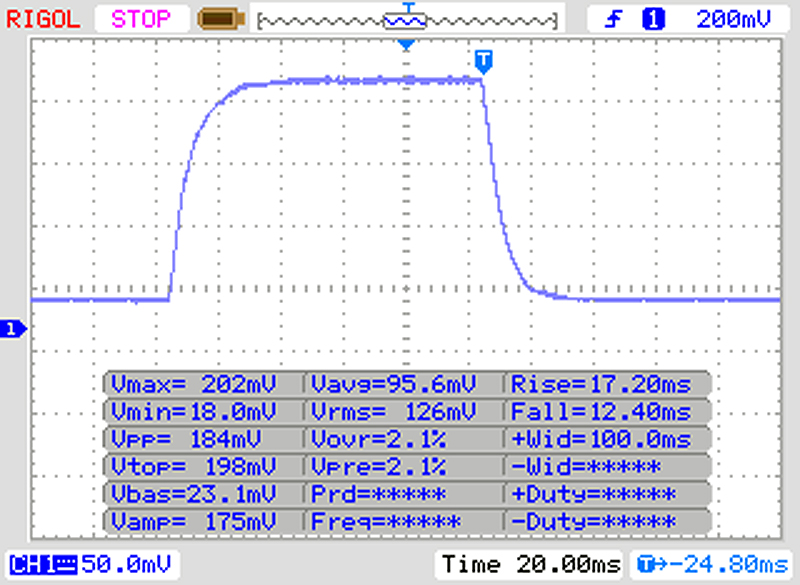 |
| ↘ 12 ms queda | ||
| A tela mostra taxas de resposta relativamente lentas em nossos testes e pode ser muito lenta para os jogadores. Em comparação, todos os dispositivos testados variam de 0.1 (mínimo) a 240 (máximo) ms. » 77 % de todos os dispositivos são melhores. Isso significa que o tempo de resposta medido é pior que a média de todos os dispositivos testados (19.8 ms). | ||
| ↔ Tempo de resposta 50% cinza a 80% cinza | ||
| 41 ms ... ascensão ↗ e queda ↘ combinadas | ↗ 19 ms ascensão | 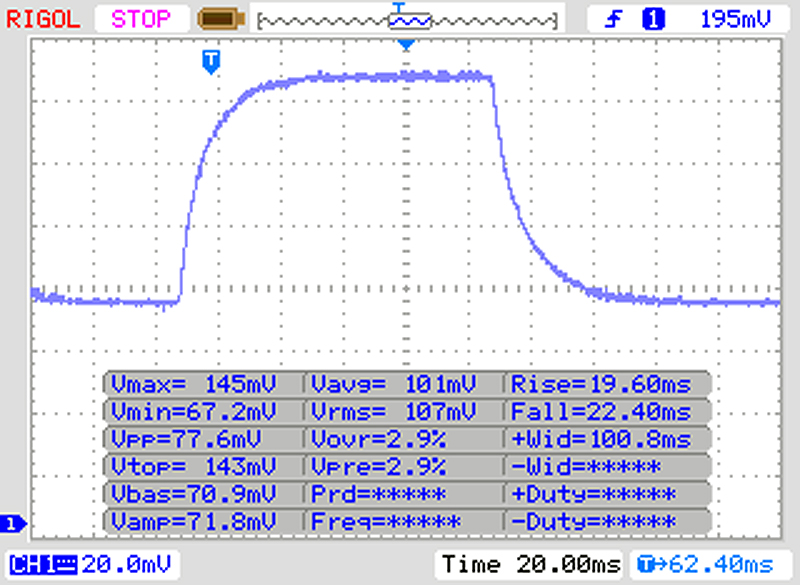 |
| ↘ 22 ms queda | ||
| A tela mostra taxas de resposta lentas em nossos testes e será insatisfatória para os jogadores. Em comparação, todos os dispositivos testados variam de 0.165 (mínimo) a 636 (máximo) ms. » 65 % de todos os dispositivos são melhores. Isso significa que o tempo de resposta medido é pior que a média de todos os dispositivos testados (31 ms). | ||
Cintilação da tela / PWM (modulação por largura de pulso)
| Tela tremeluzindo / PWM não detectado | 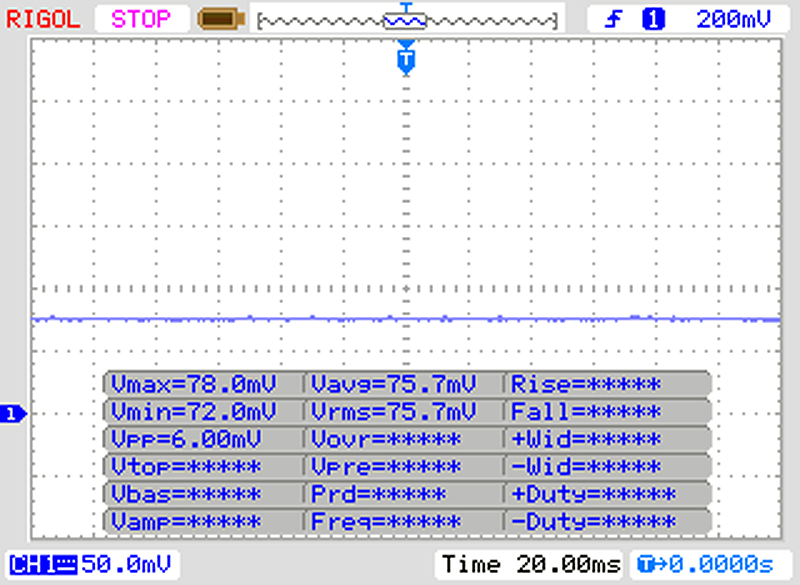 | ||
[pwm_comparison] Em comparação: 52 % de todos os dispositivos testados não usam PWM para escurecer a tela. Se PWM foi detectado, uma média de 7754 (mínimo: 5 - máximo: 343500) Hz foi medida. | |||
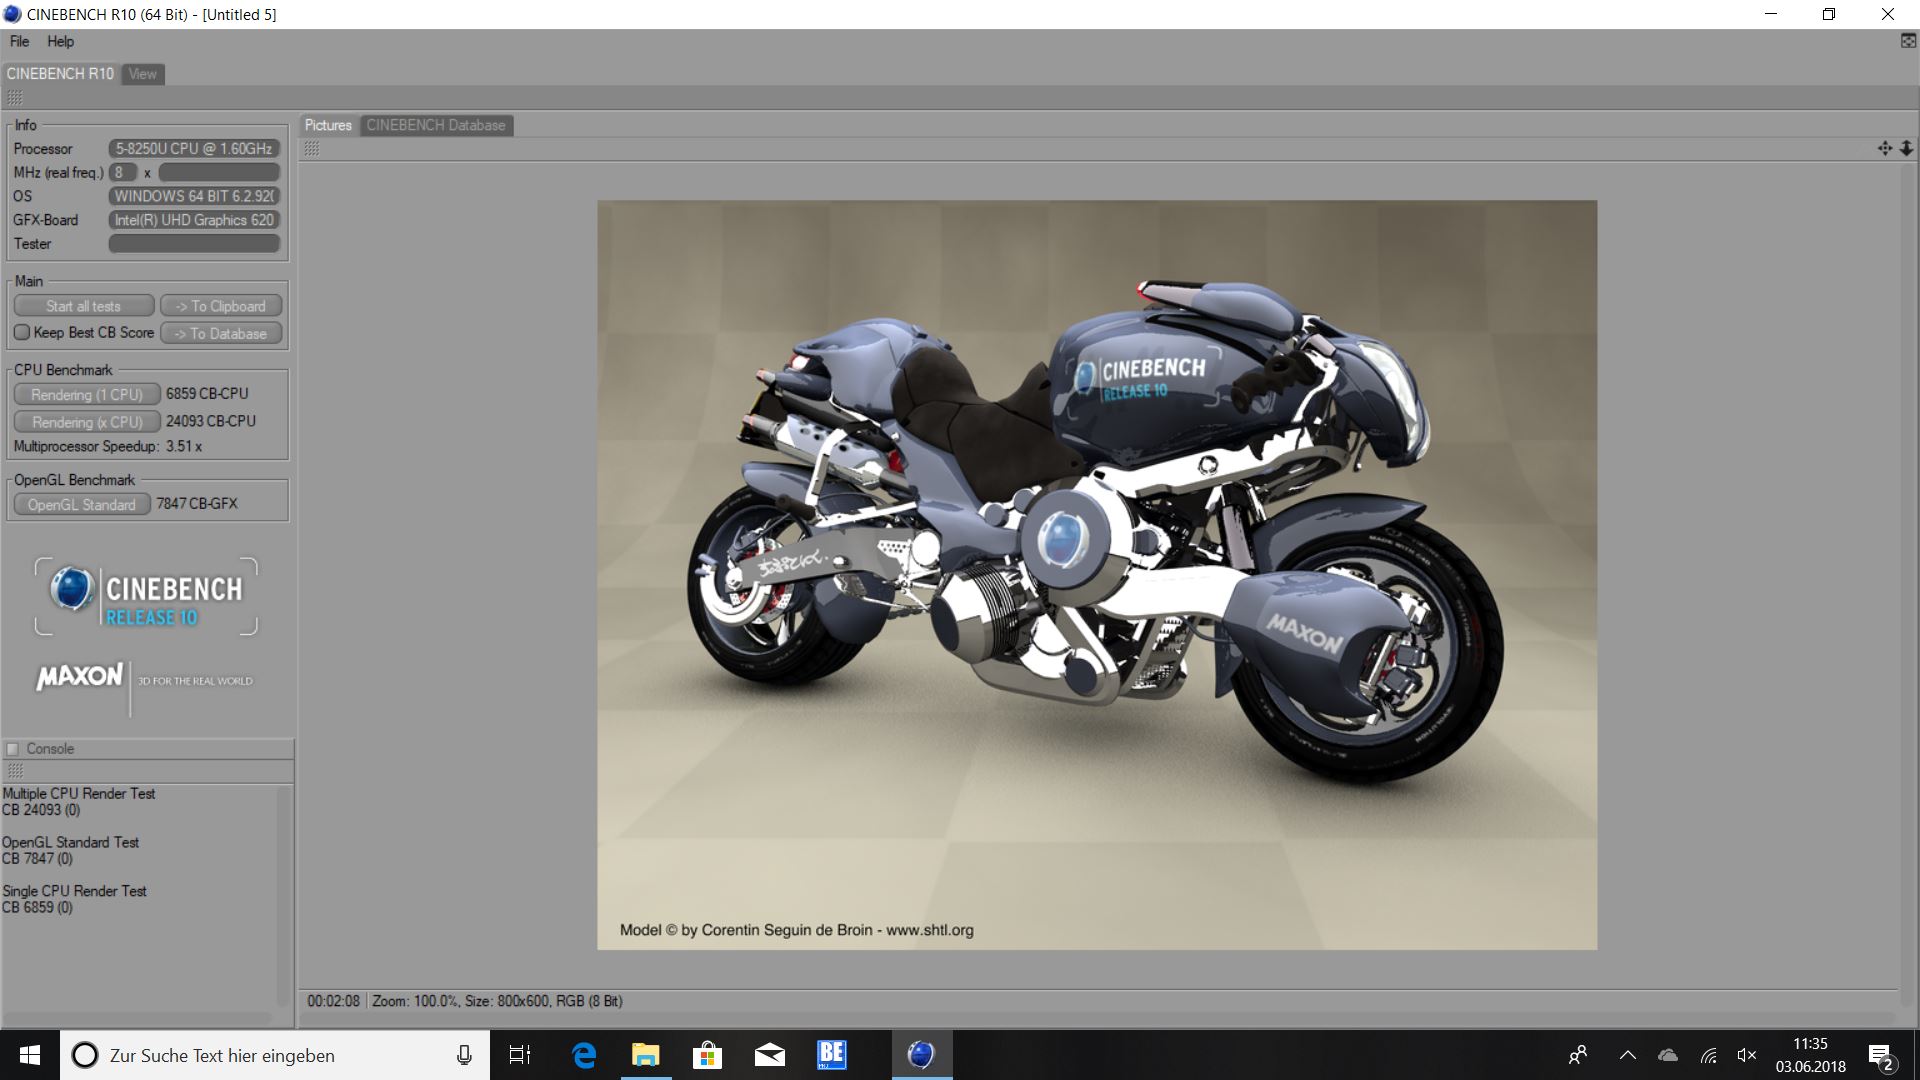
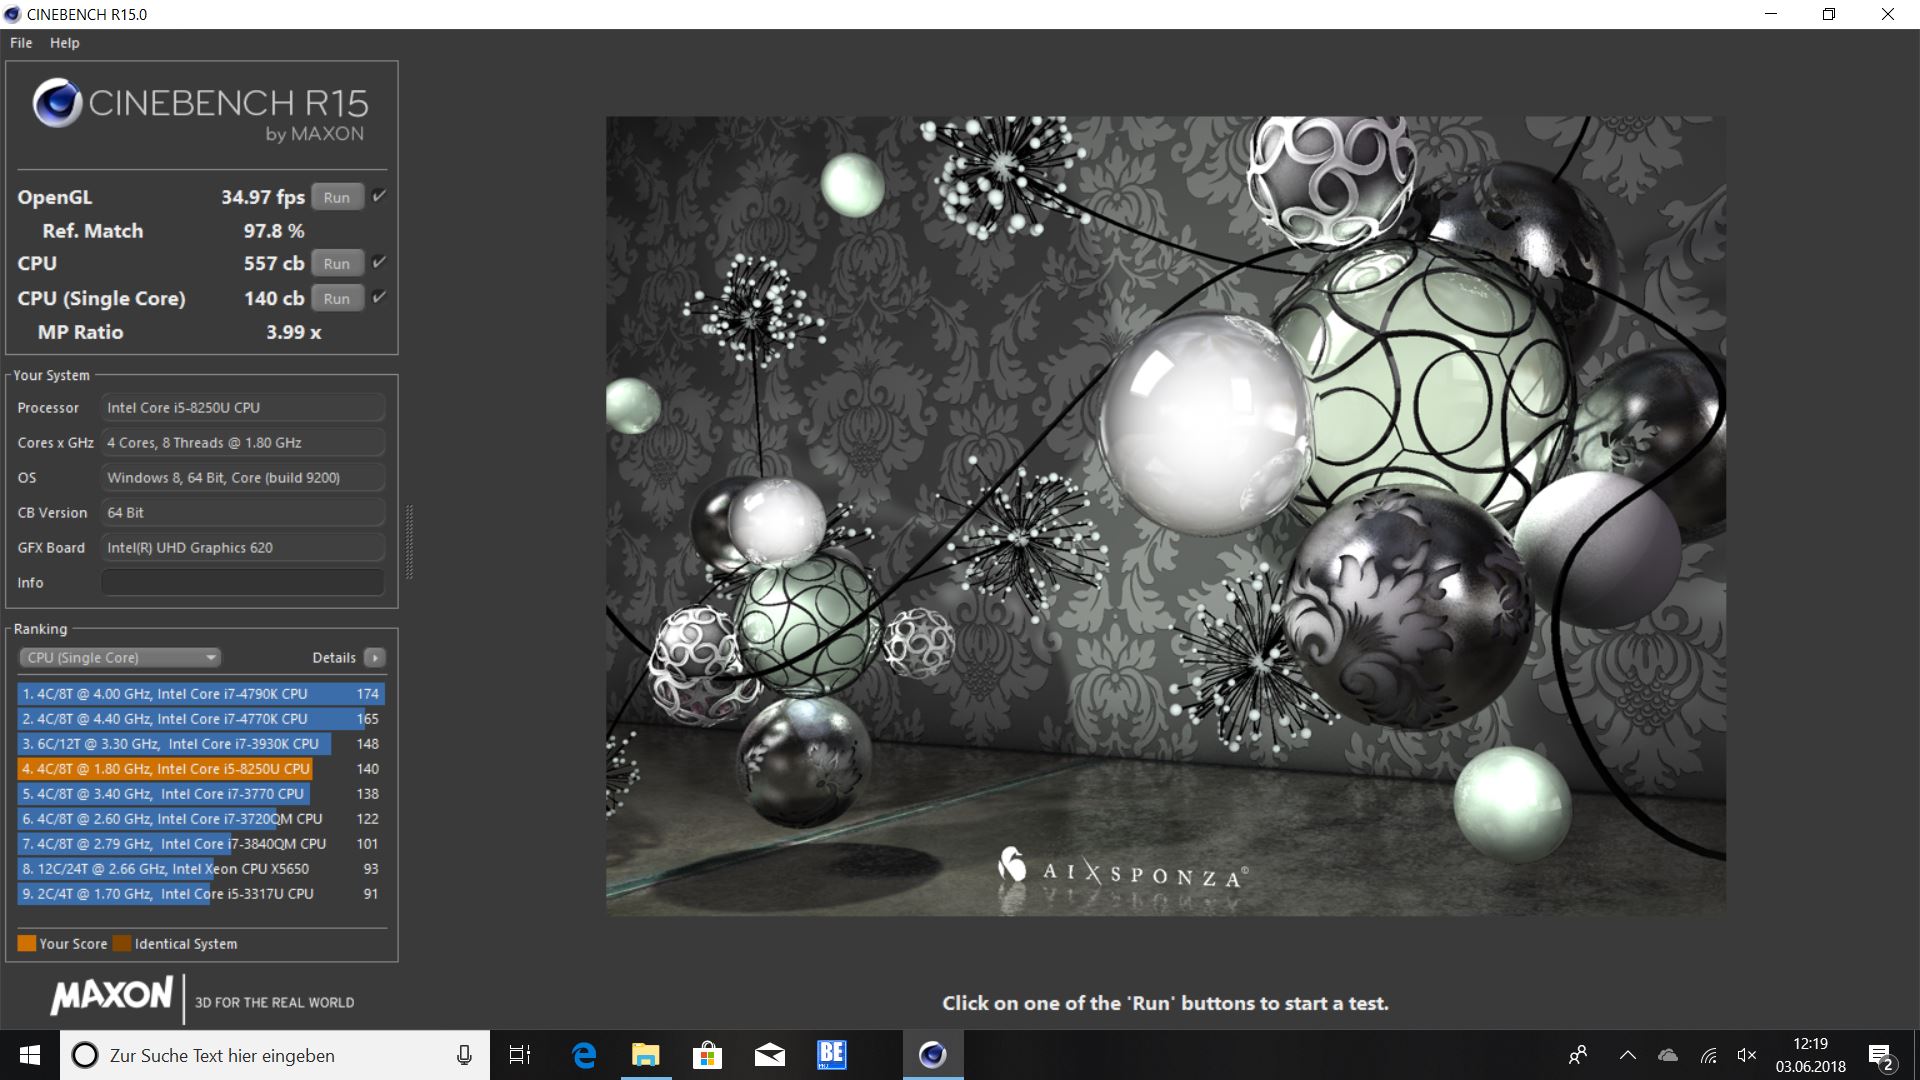
| Cinebench R10 | |
| Rendering Single CPUs 64Bit | |
| Média da turma Convertible (12127 - 12555, n=2, últimos 2 anos) | |
| Média Intel Core i5-8250U (5163 - 8153, n=13) | |
| Dell Inspiron 15 5579-9672 | |
| Rendering Multiple CPUs 64Bit | |
| Média da turma Convertible (36094 - 50439, n=2, últimos 2 anos) | |
| Dell Inspiron 15 5579-9672 | |
| Média Intel Core i5-8250U (11245 - 28932, n=13) | |
| HWBOT x265 Benchmark v2.2 - 4k Preset | |
| Média da turma Convertible (3.43 - 36.2, n=48, últimos 2 anos) | |
| Média Intel Core i5-8250U (3.02 - 4.78, n=8) | |
| Dell Inspiron 15 5579-9672 | |
* ... menor é melhor

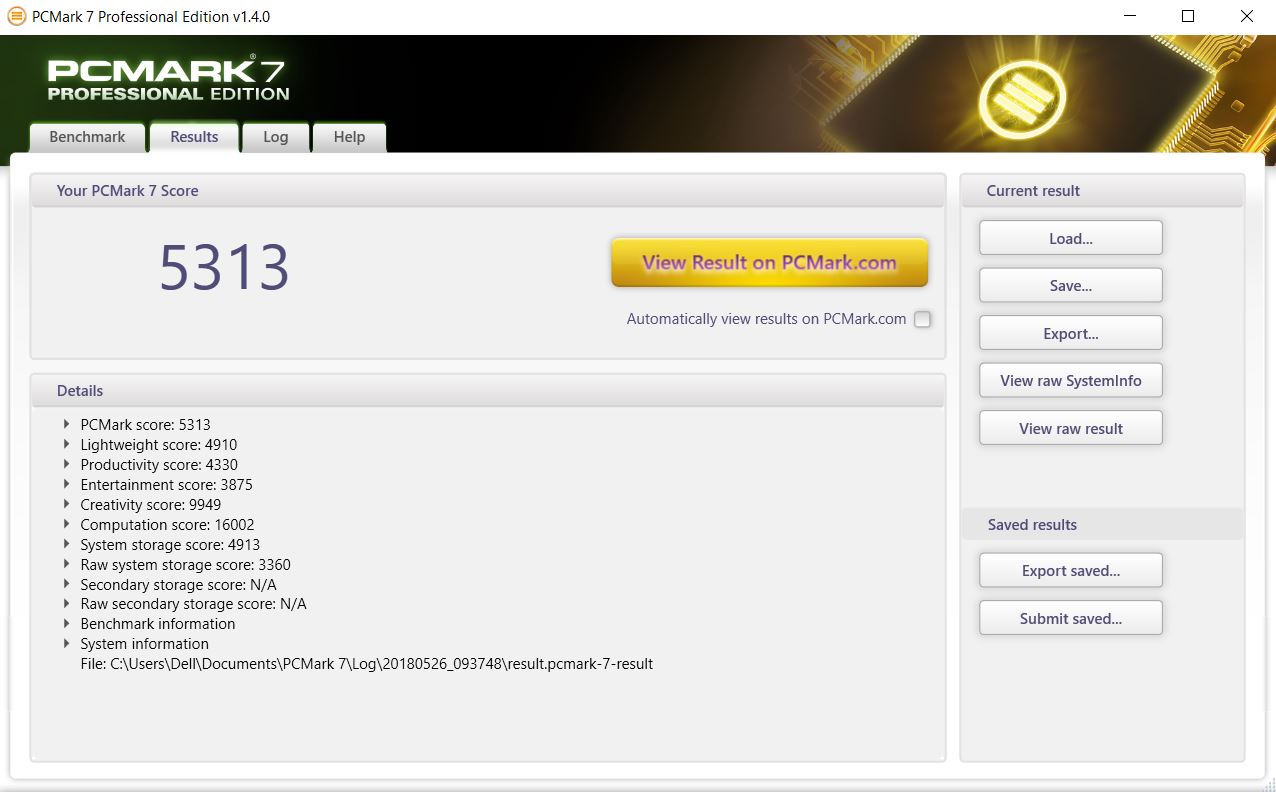
| PCMark 7 Score | 5313 pontos | |
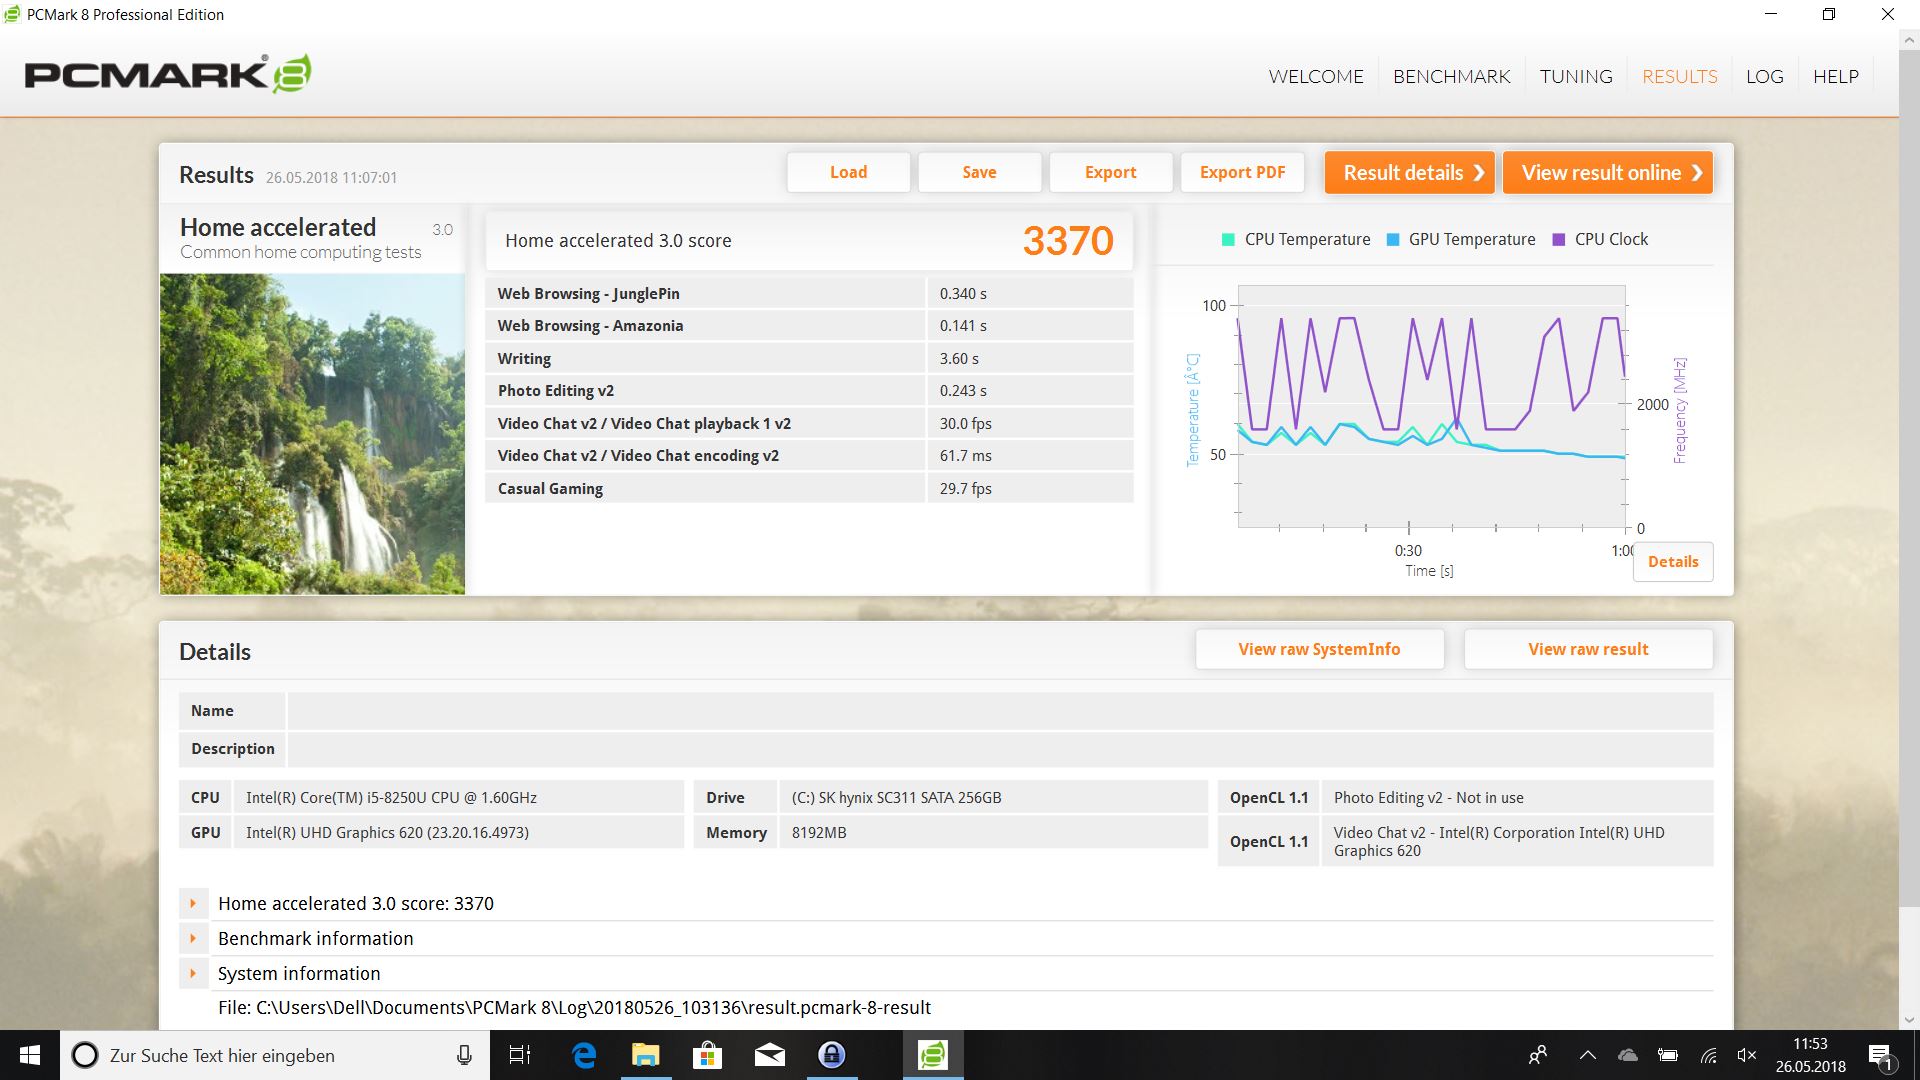
| PCMark 8 Home Score Accelerated v2 | 3370 pontos | |
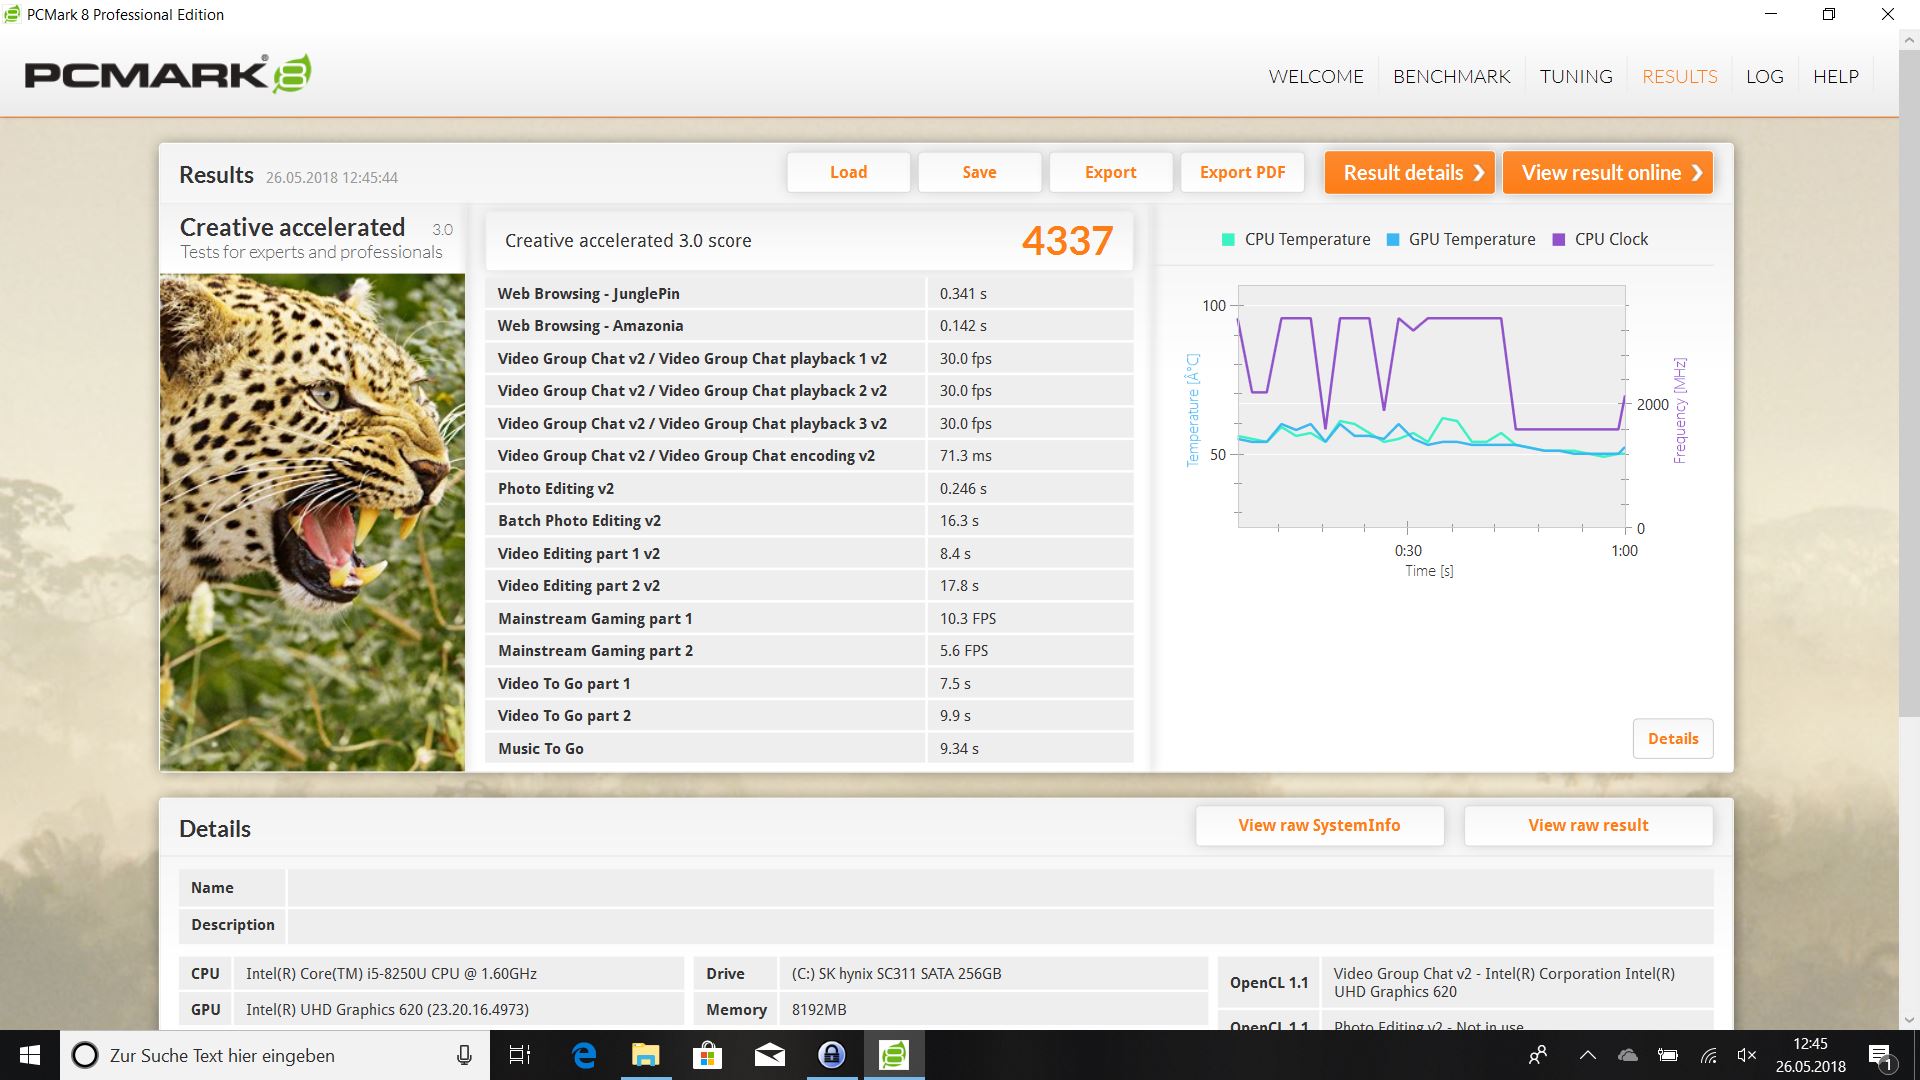
| PCMark 8 Creative Score Accelerated v2 | 4337 pontos | |
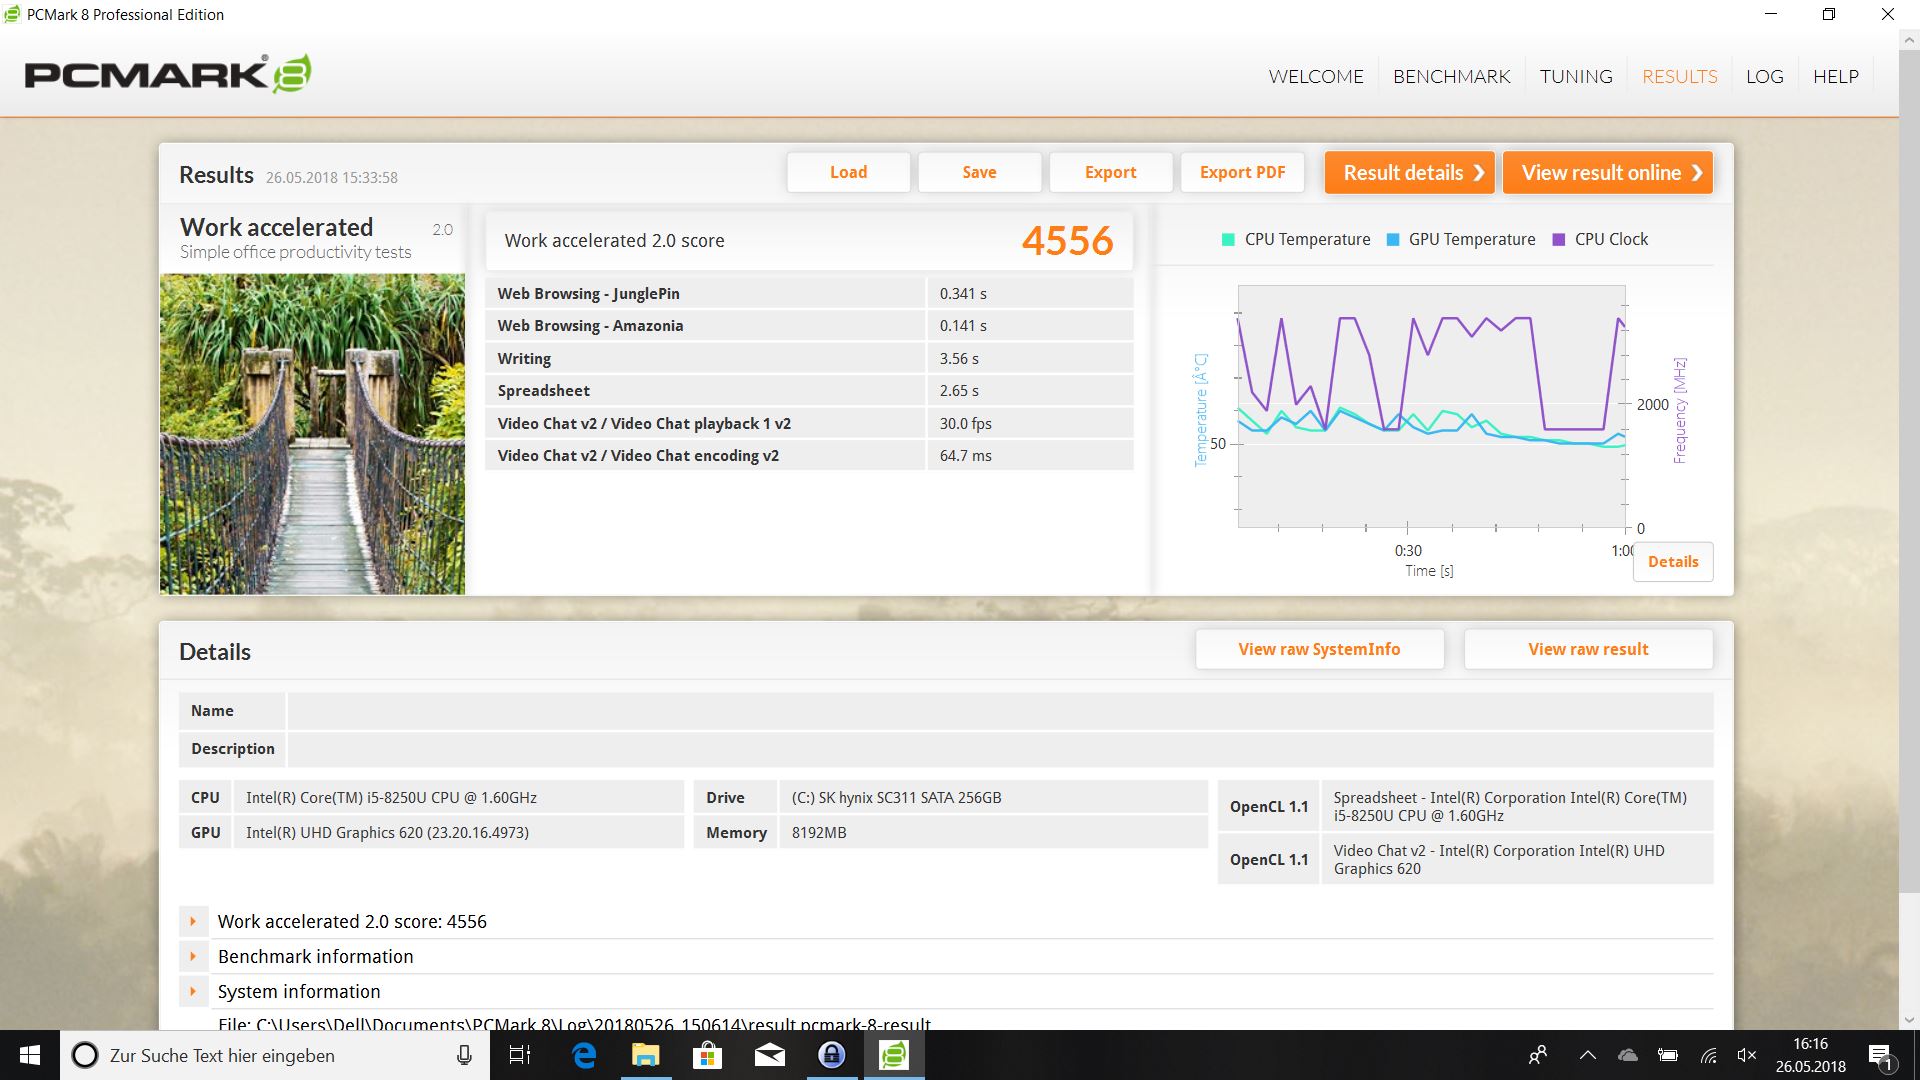
| PCMark 8 Work Score Accelerated v2 | 4556 pontos | |
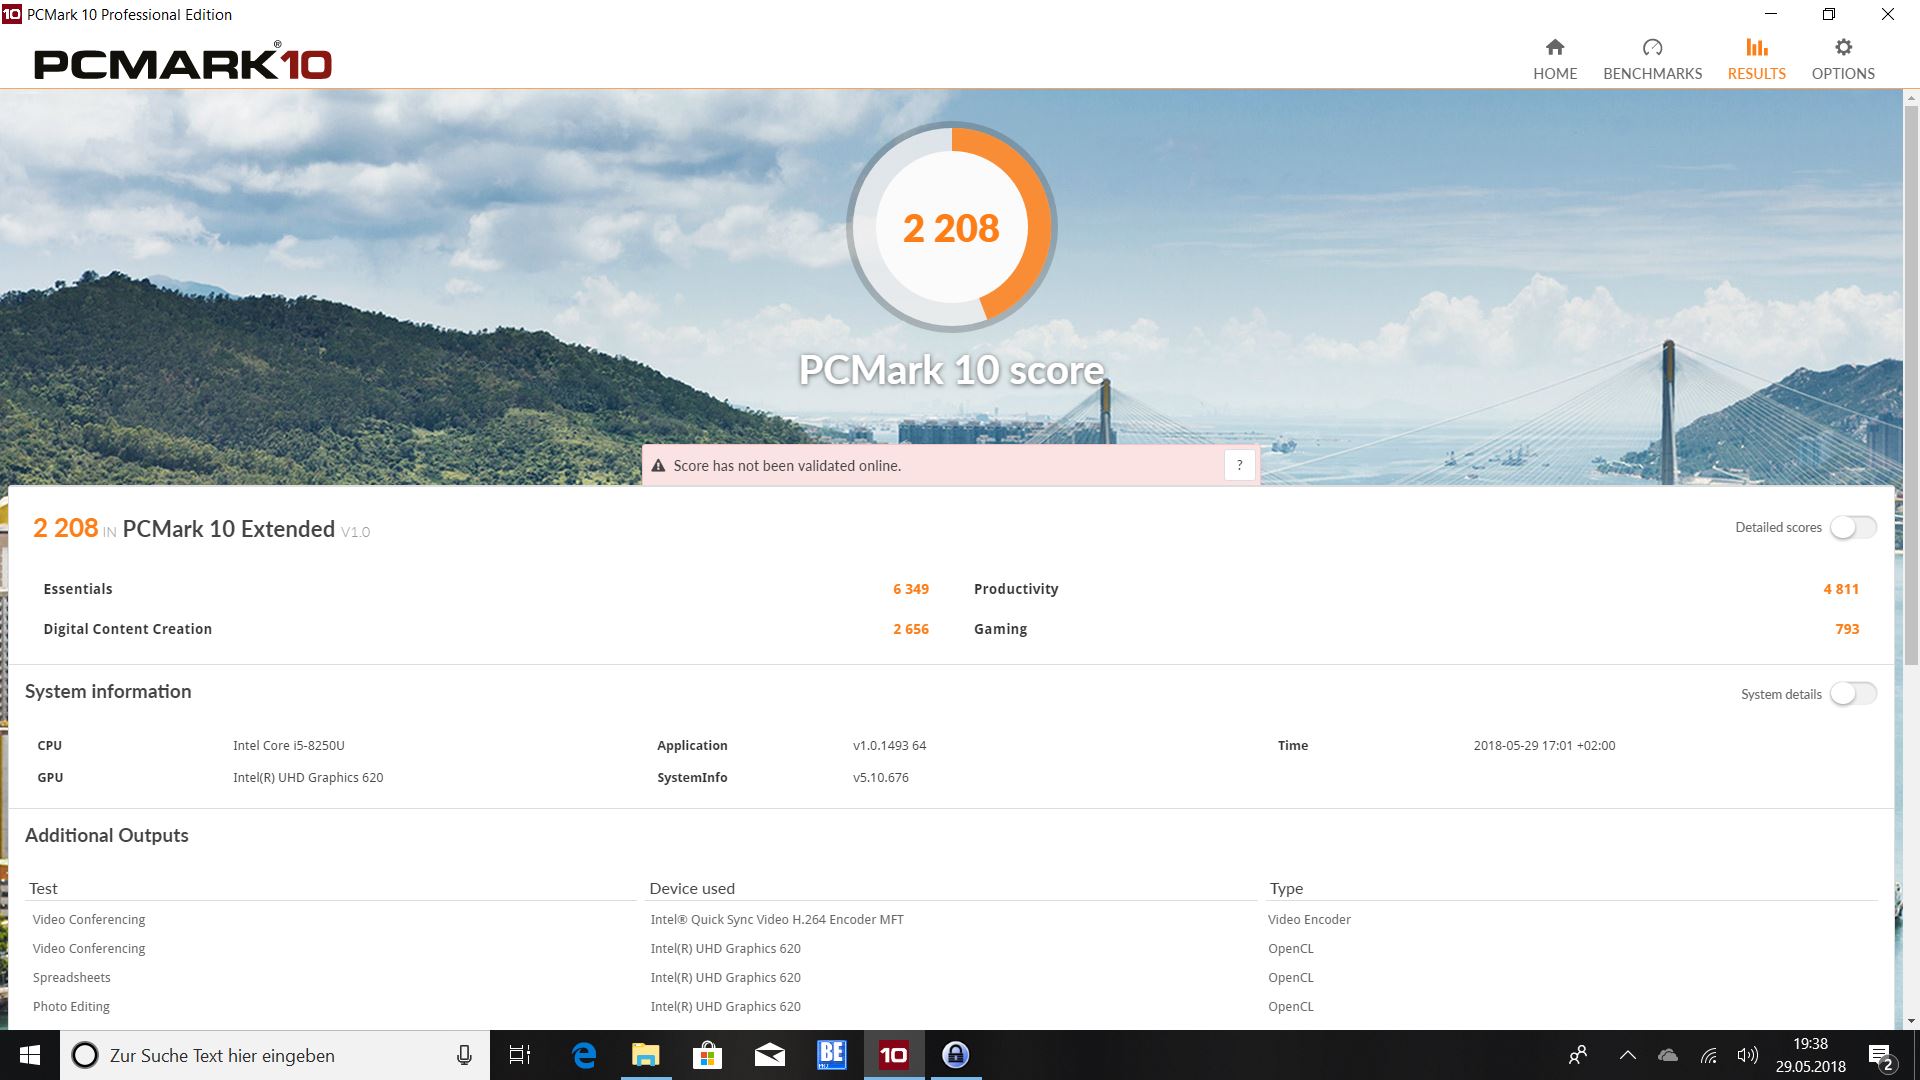
| PCMark 10 Score | 2208 pontos | |
Ajuda | ||
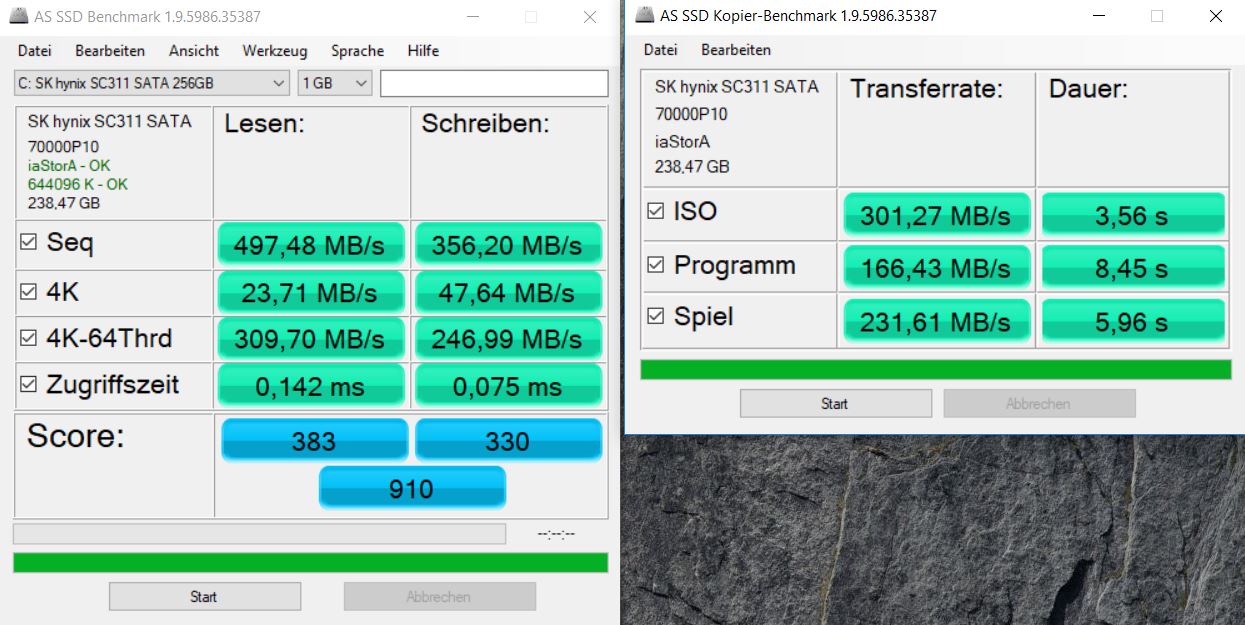
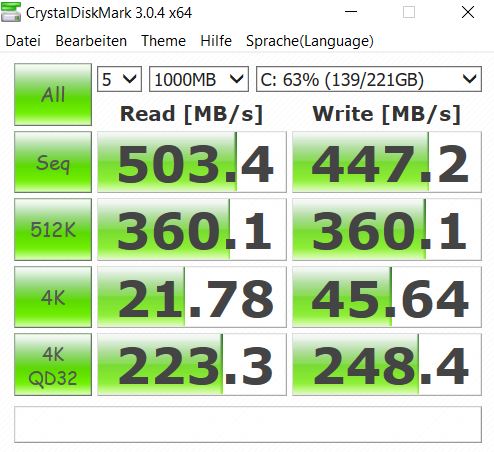
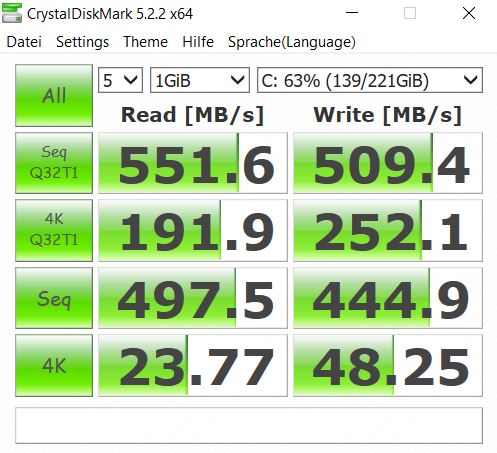
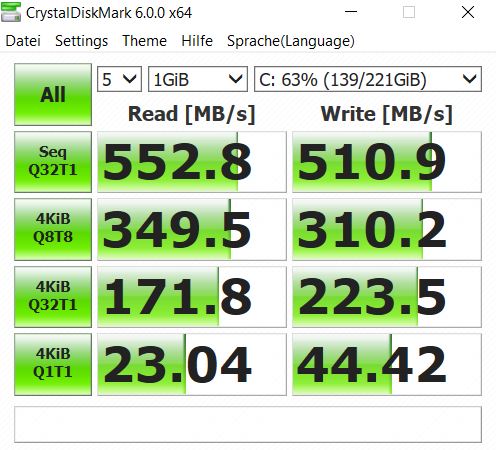
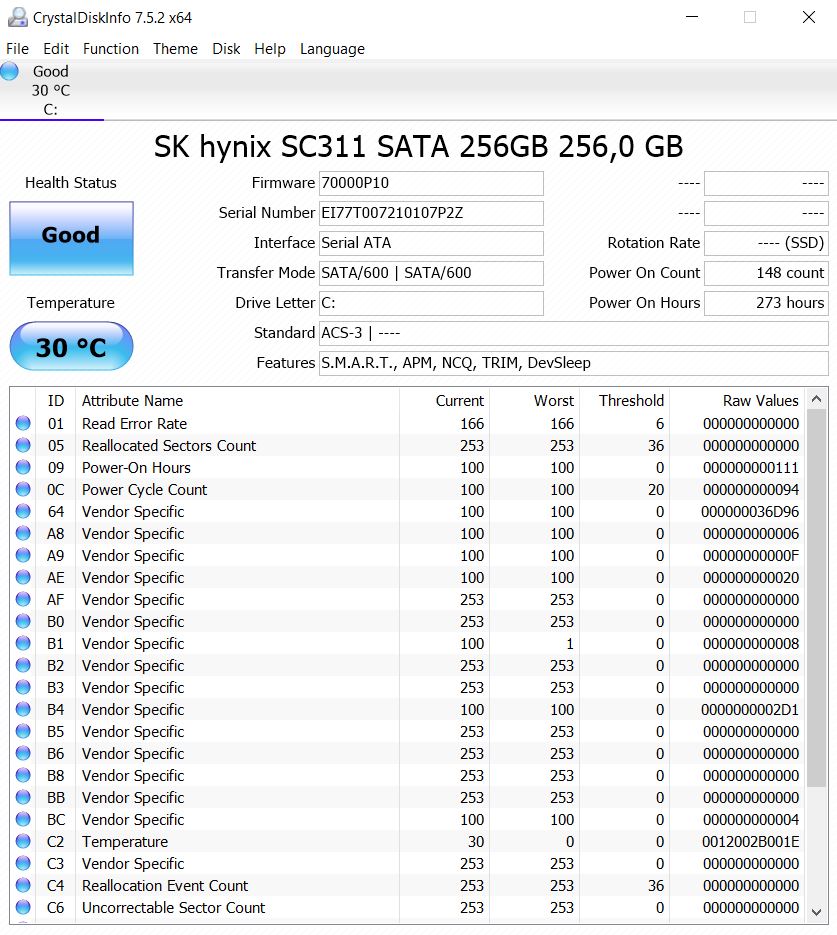
| Dell Inspiron 15 5579-9672 SK hynix SC311 SATA | Dell Inspiron 15 5578-1777 2-in-1 SanDisk X400 256GB, SATA (SD8SB8U-256G) | HP Envy x360 15-bq102ng Samsung PM961 MZVLW256HEHP | Asus VivoBook Flip 15 TP510UA-E8073T SanDisk SD8SN8U128G1002 | Acer Spin 3 SP314-51-548L Micron 1100 MTFDDAV256TBN | Lenovo ThinkPad L380 Yoga-20M7001BGE Samsung PM961 MZVLW256HEHP | |
|---|---|---|---|---|---|---|
| CrystalDiskMark 3.0 | 7% | 114% | -5% | 14% | 164% | |
| Read Seq (MB/s) | 503 | 503 0% | 1487 196% | 458.5 -9% | 484.3 -4% | 2073 312% |
| Write Seq (MB/s) | 447.2 | 465.3 4% | 1241 178% | 337.2 -25% | 439.8 -2% | 943 111% |
| Read 512 (MB/s) | 360.1 | 293 -19% | 923 156% | 319.1 -11% | 316.4 -12% | 1221 239% |
| Write 512 (MB/s) | 360.1 | 322.7 -10% | 797 121% | 186 -48% | 345.4 -4% | 819 127% |
| Read 4k (MB/s) | 21.78 | 28.9 33% | 49.38 127% | 28.39 30% | 27.17 25% | 53.5 146% |
| Write 4k (MB/s) | 45.64 | 55 21% | 97.3 113% | 56.6 24% | 86.7 90% | 127.4 179% |
| Read 4k QD32 (MB/s) | 223.3 | 314.5 41% | 295 32% | 321.1 44% | 246.7 10% | 396.6 78% |
| Write 4k QD32 (MB/s) | 248.4 | 209.2 -16% | 212.5 -14% | 128.5 -48% | 260.6 5% | 538 117% |

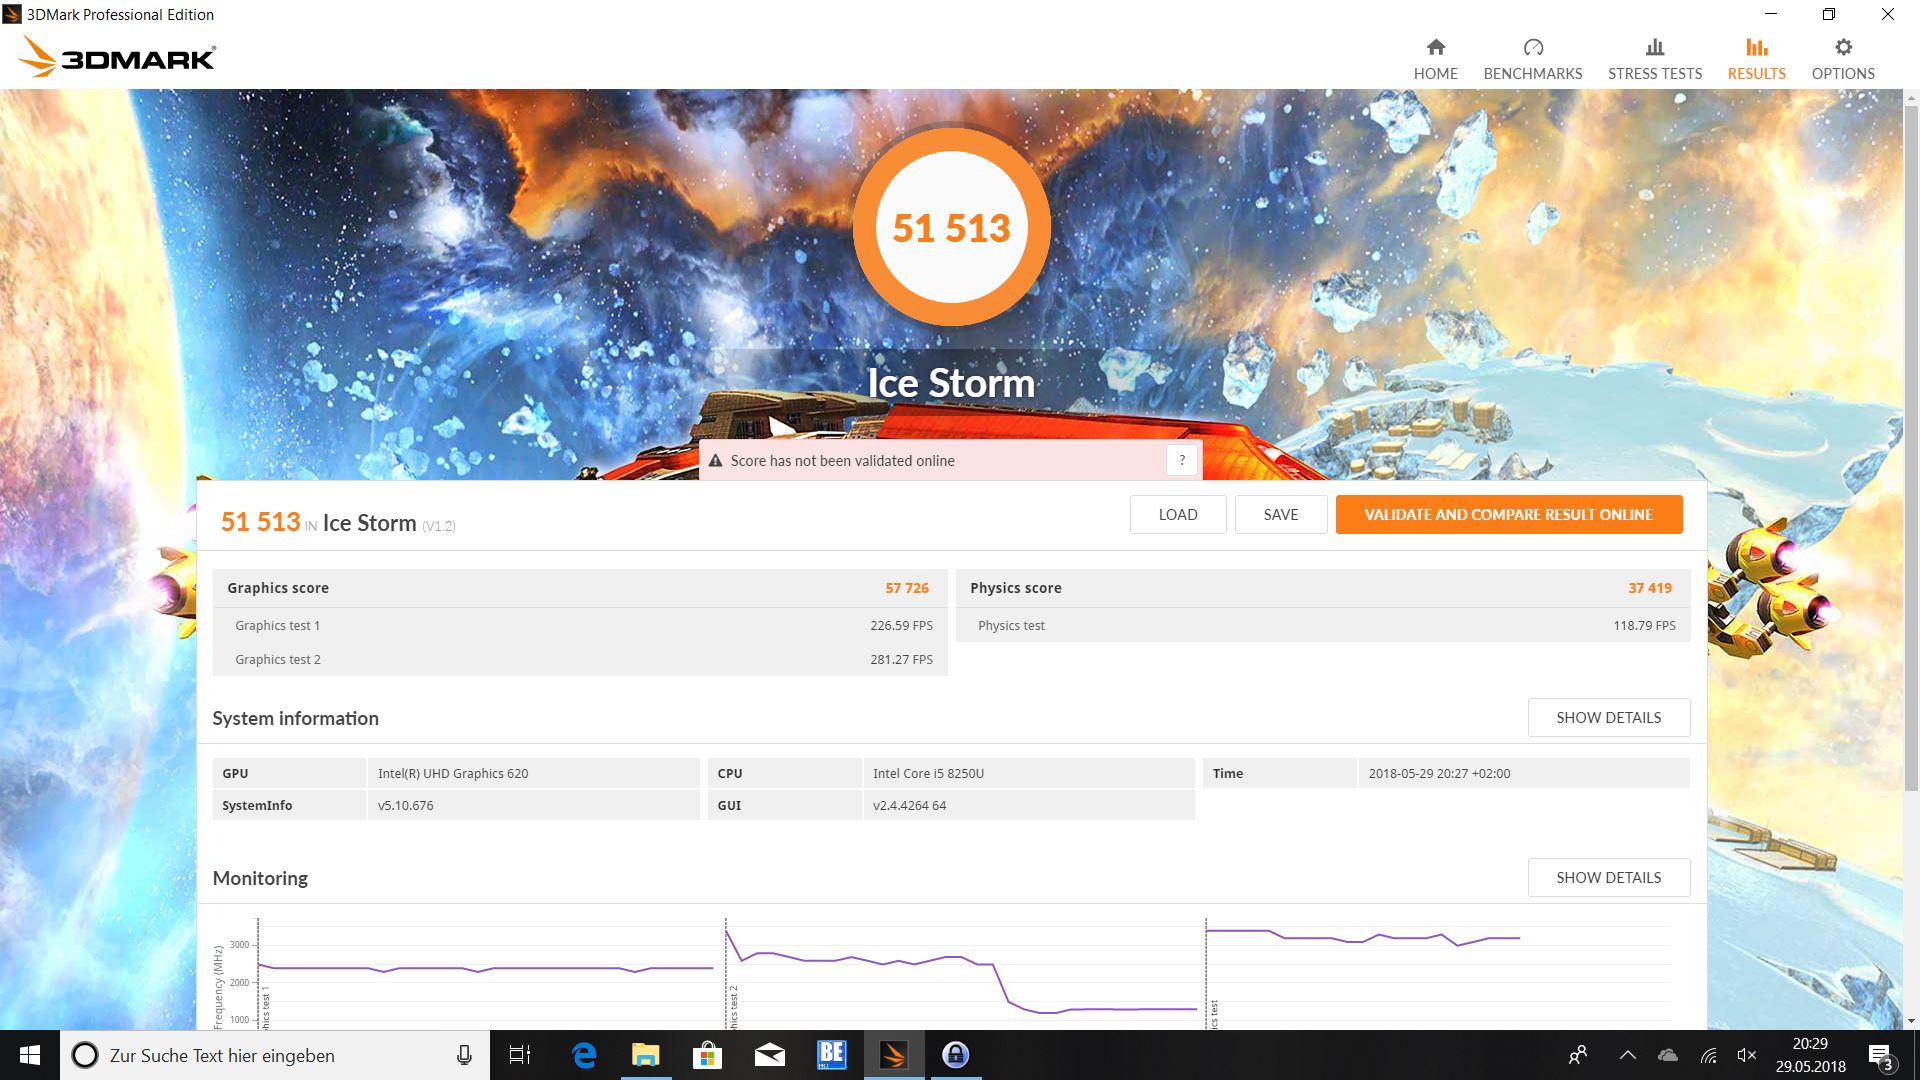
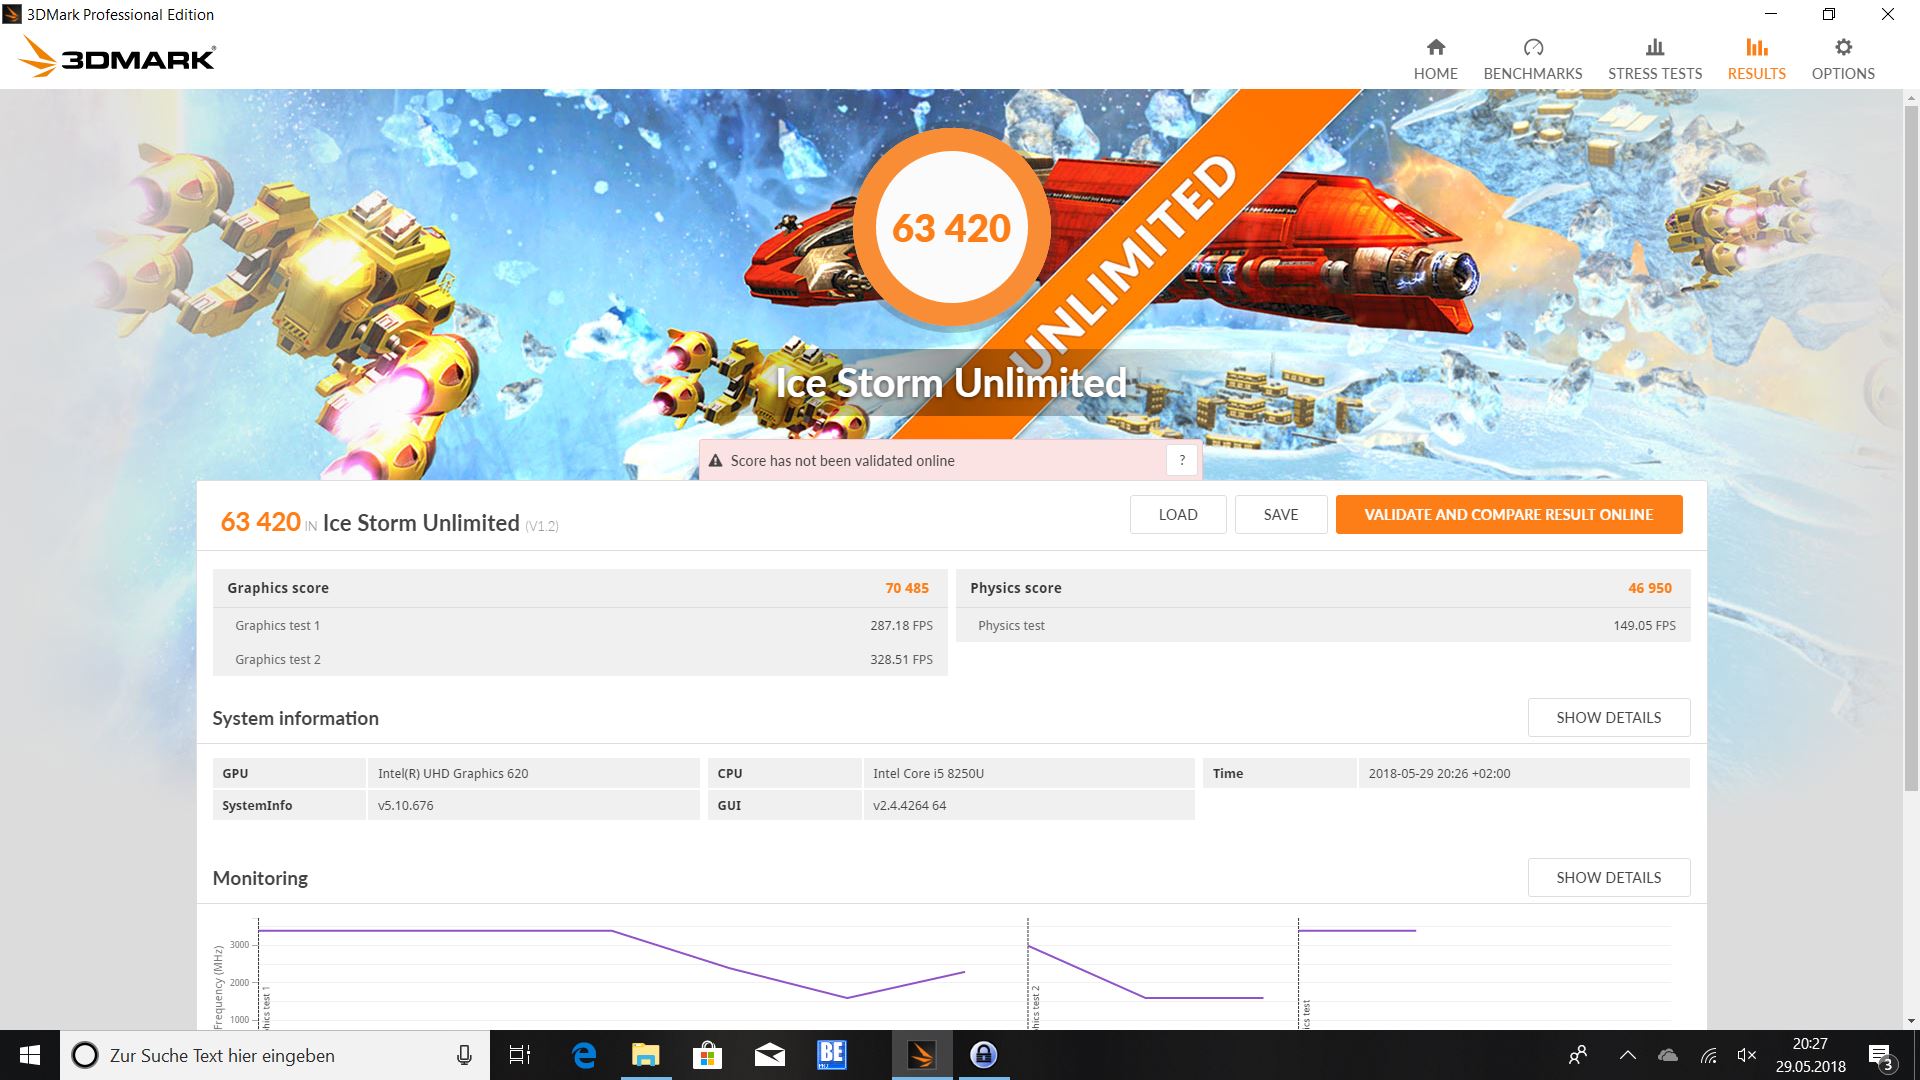
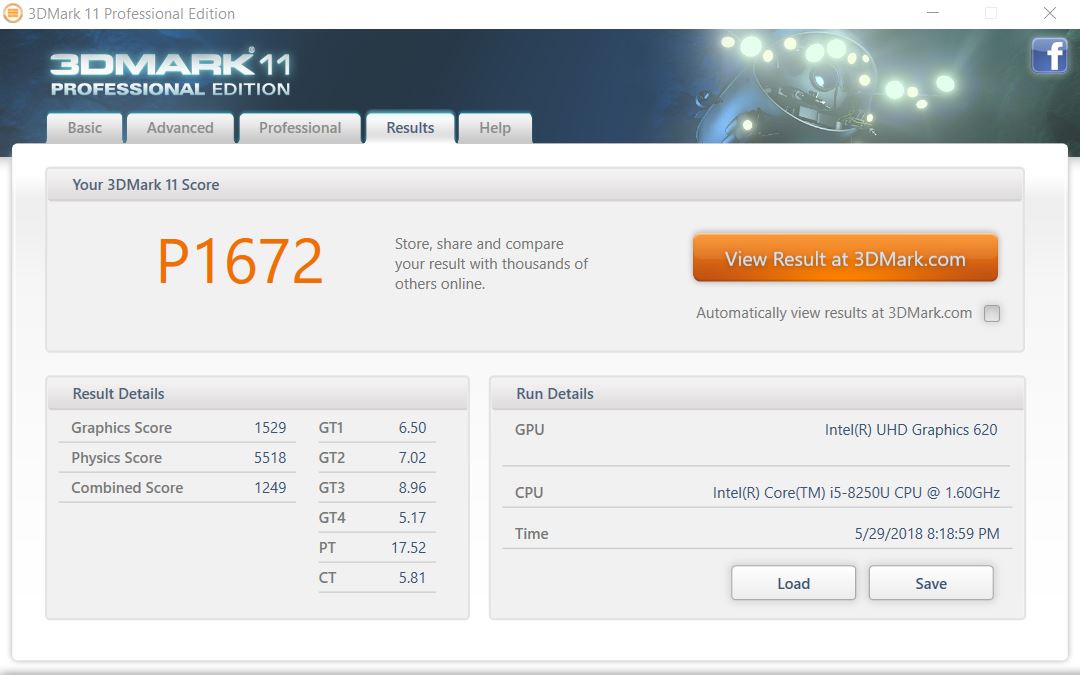
| 3DMark 11 Performance | 1672 pontos | |
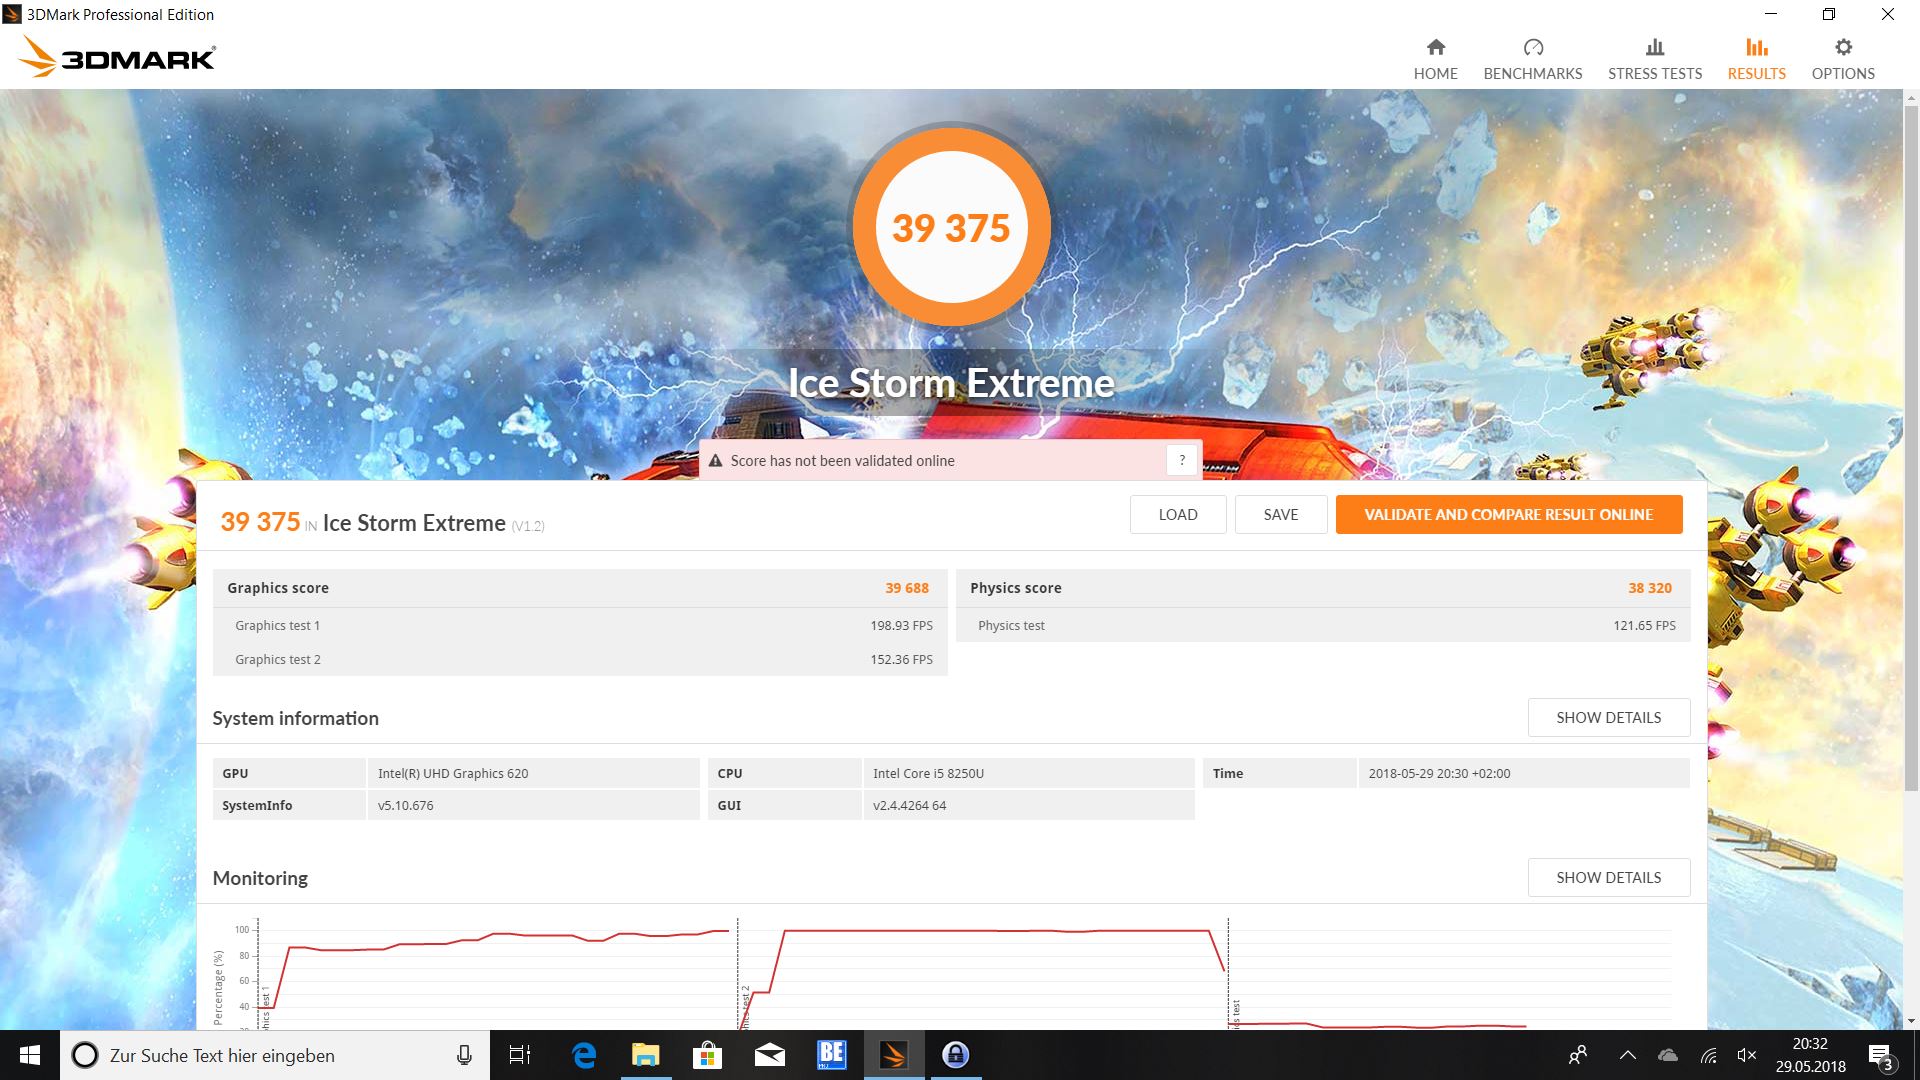
| 3DMark Ice Storm Standard Score | 51513 pontos | |
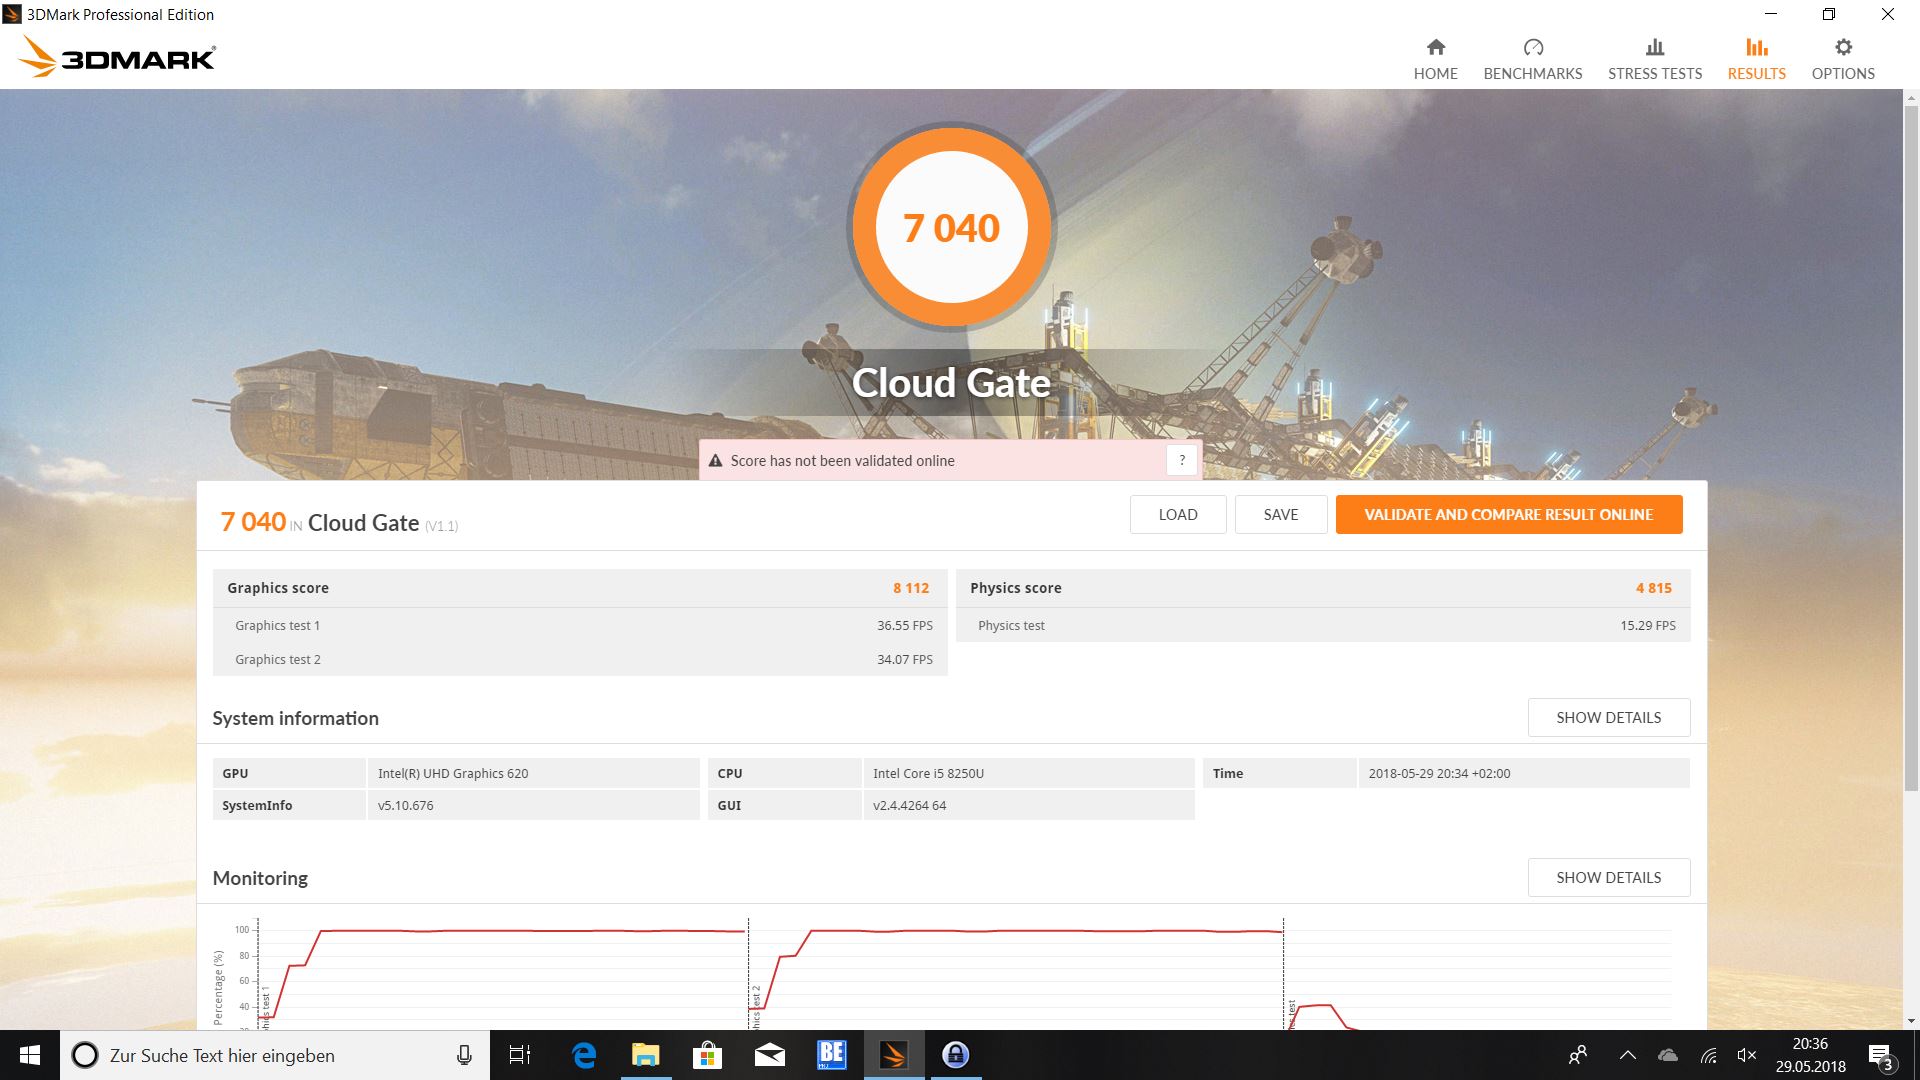
| 3DMark Cloud Gate Standard Score | 7040 pontos | |
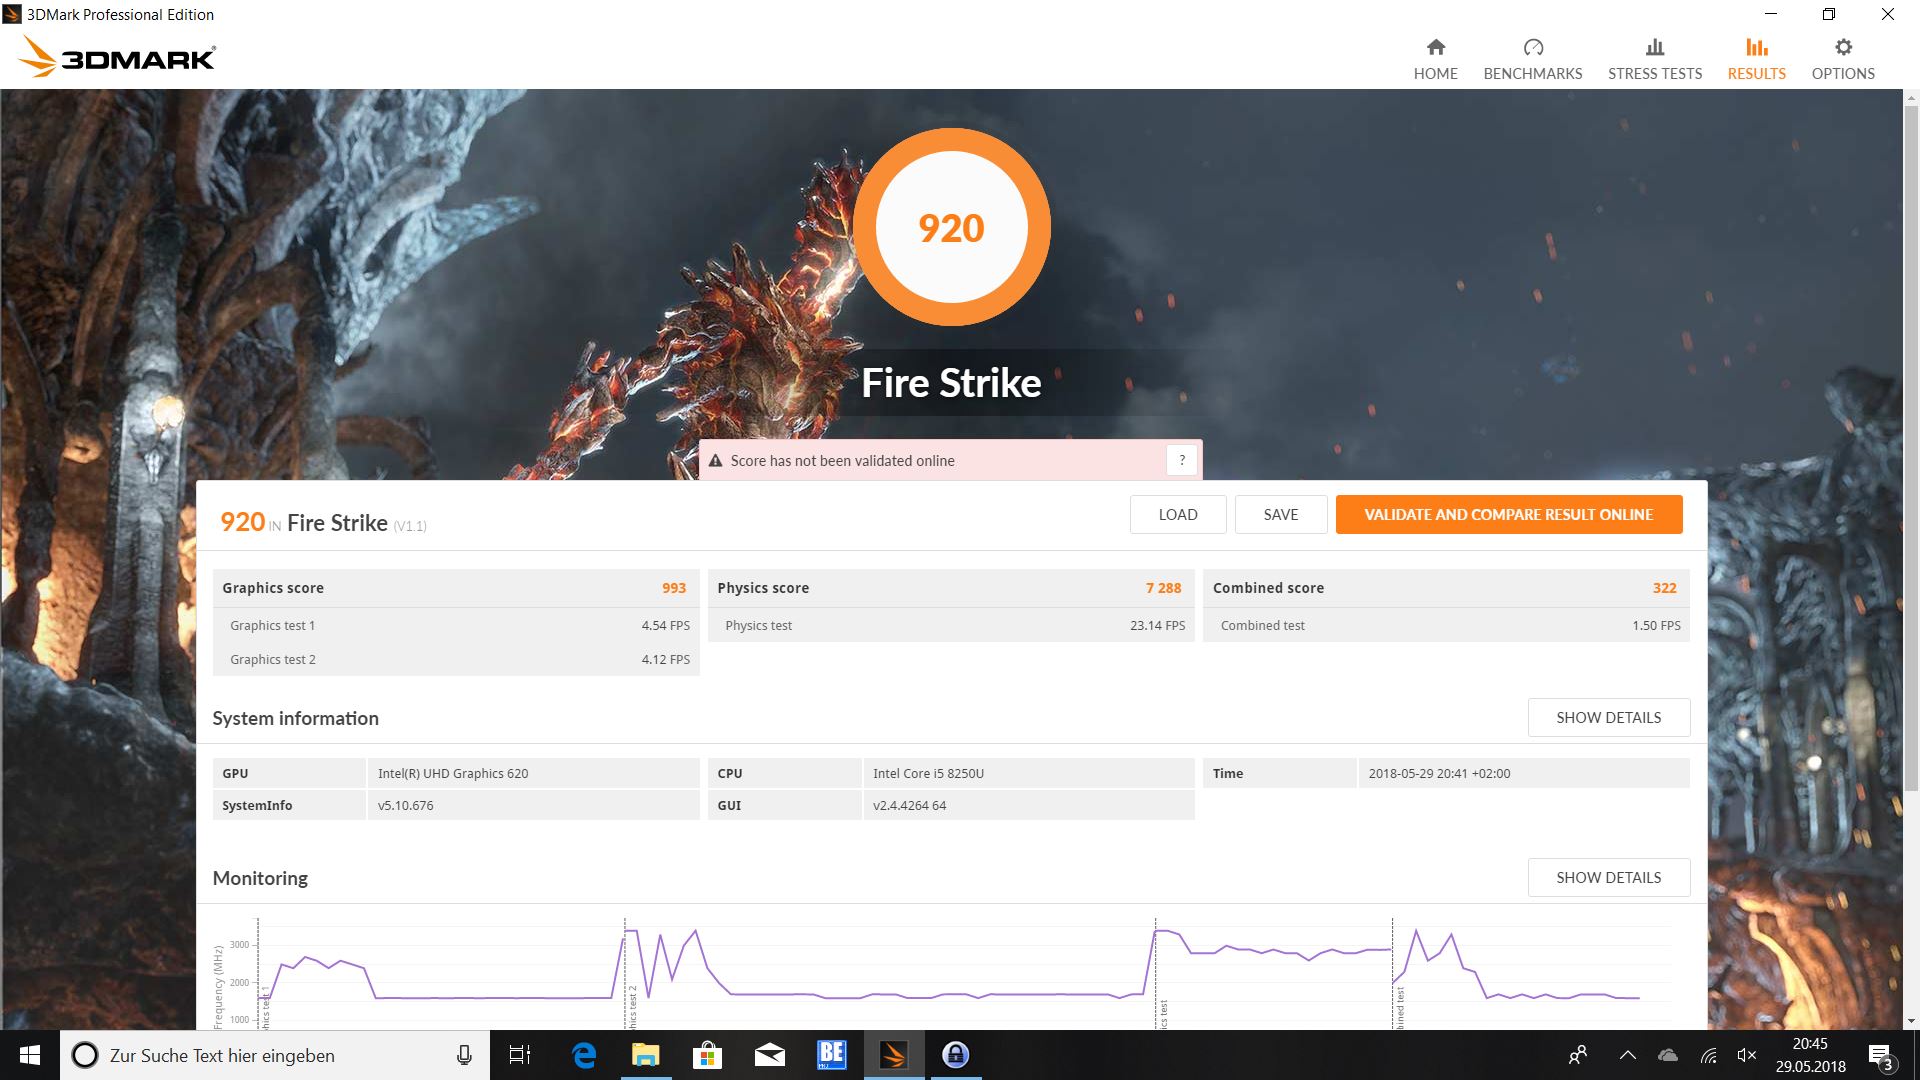
| 3DMark Fire Strike Score | 920 pontos | |
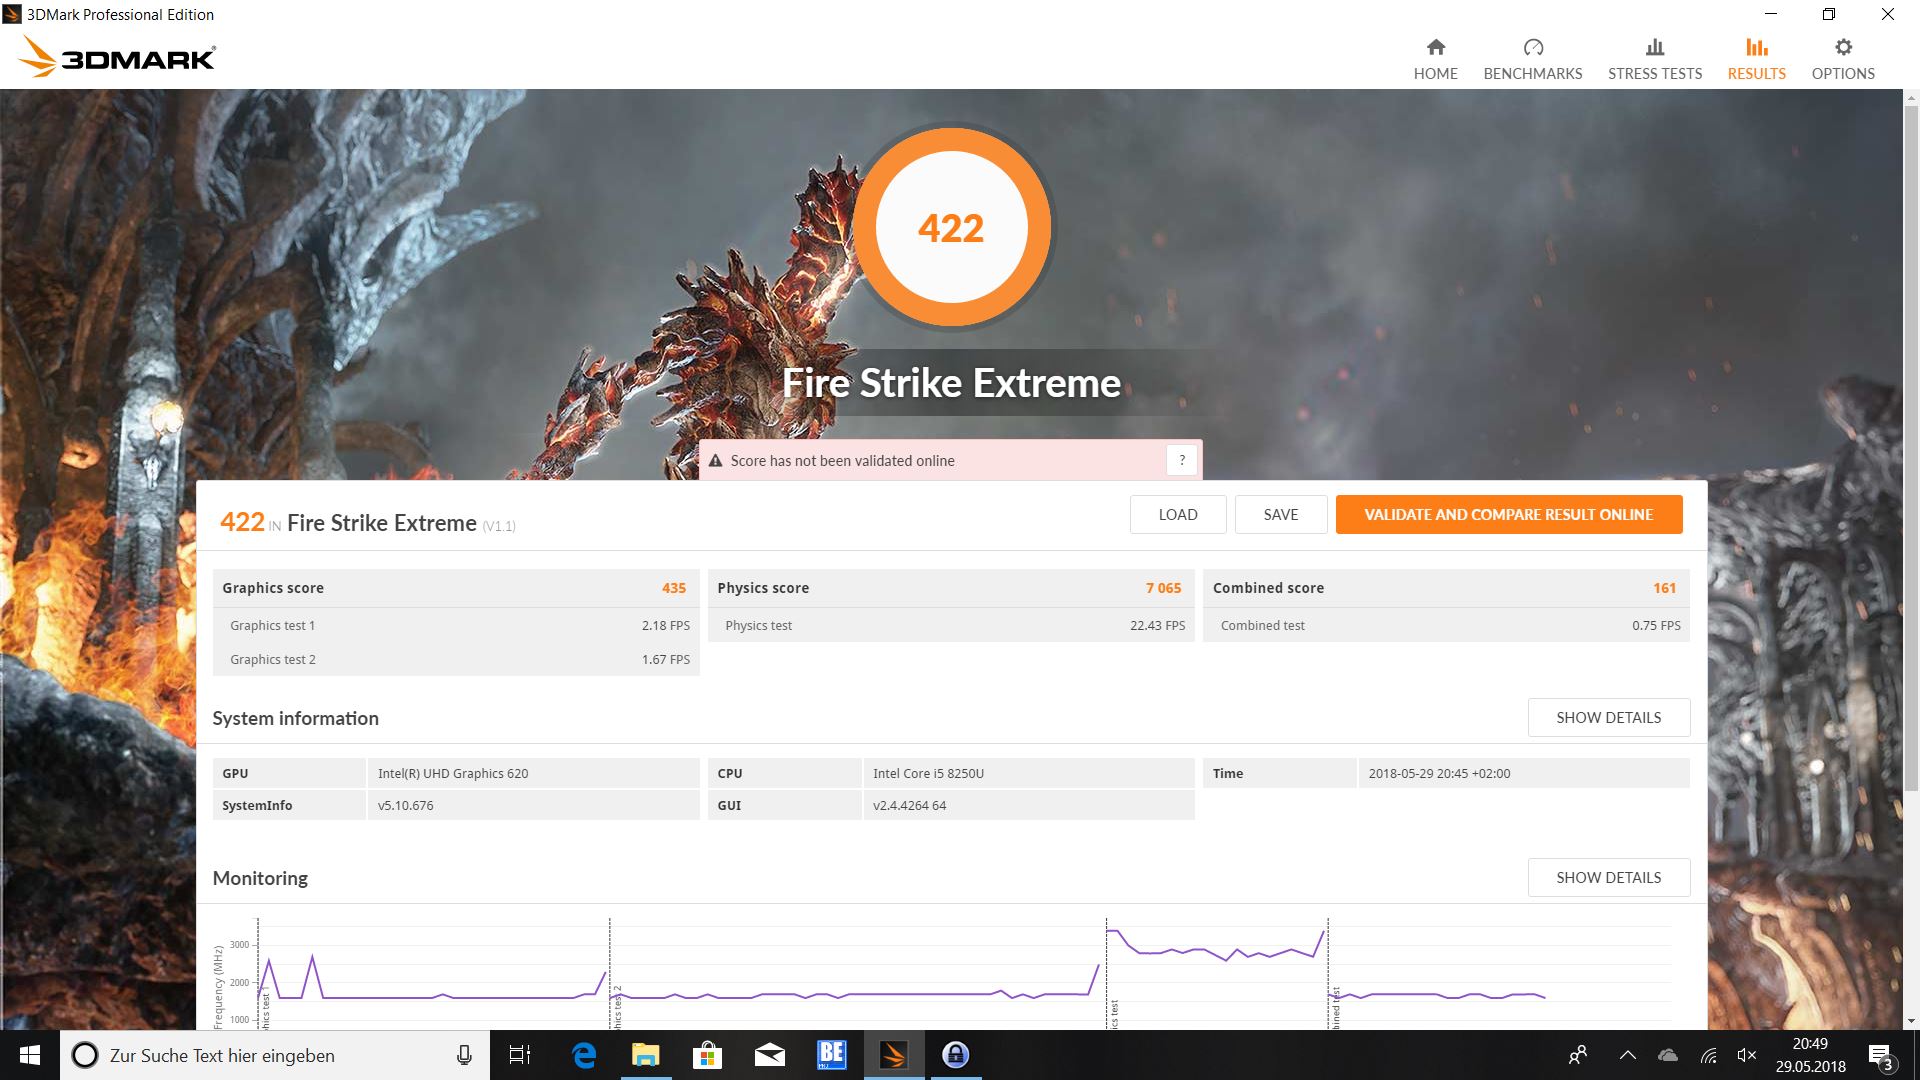
| 3DMark Fire Strike Extreme Score | 422 pontos | |
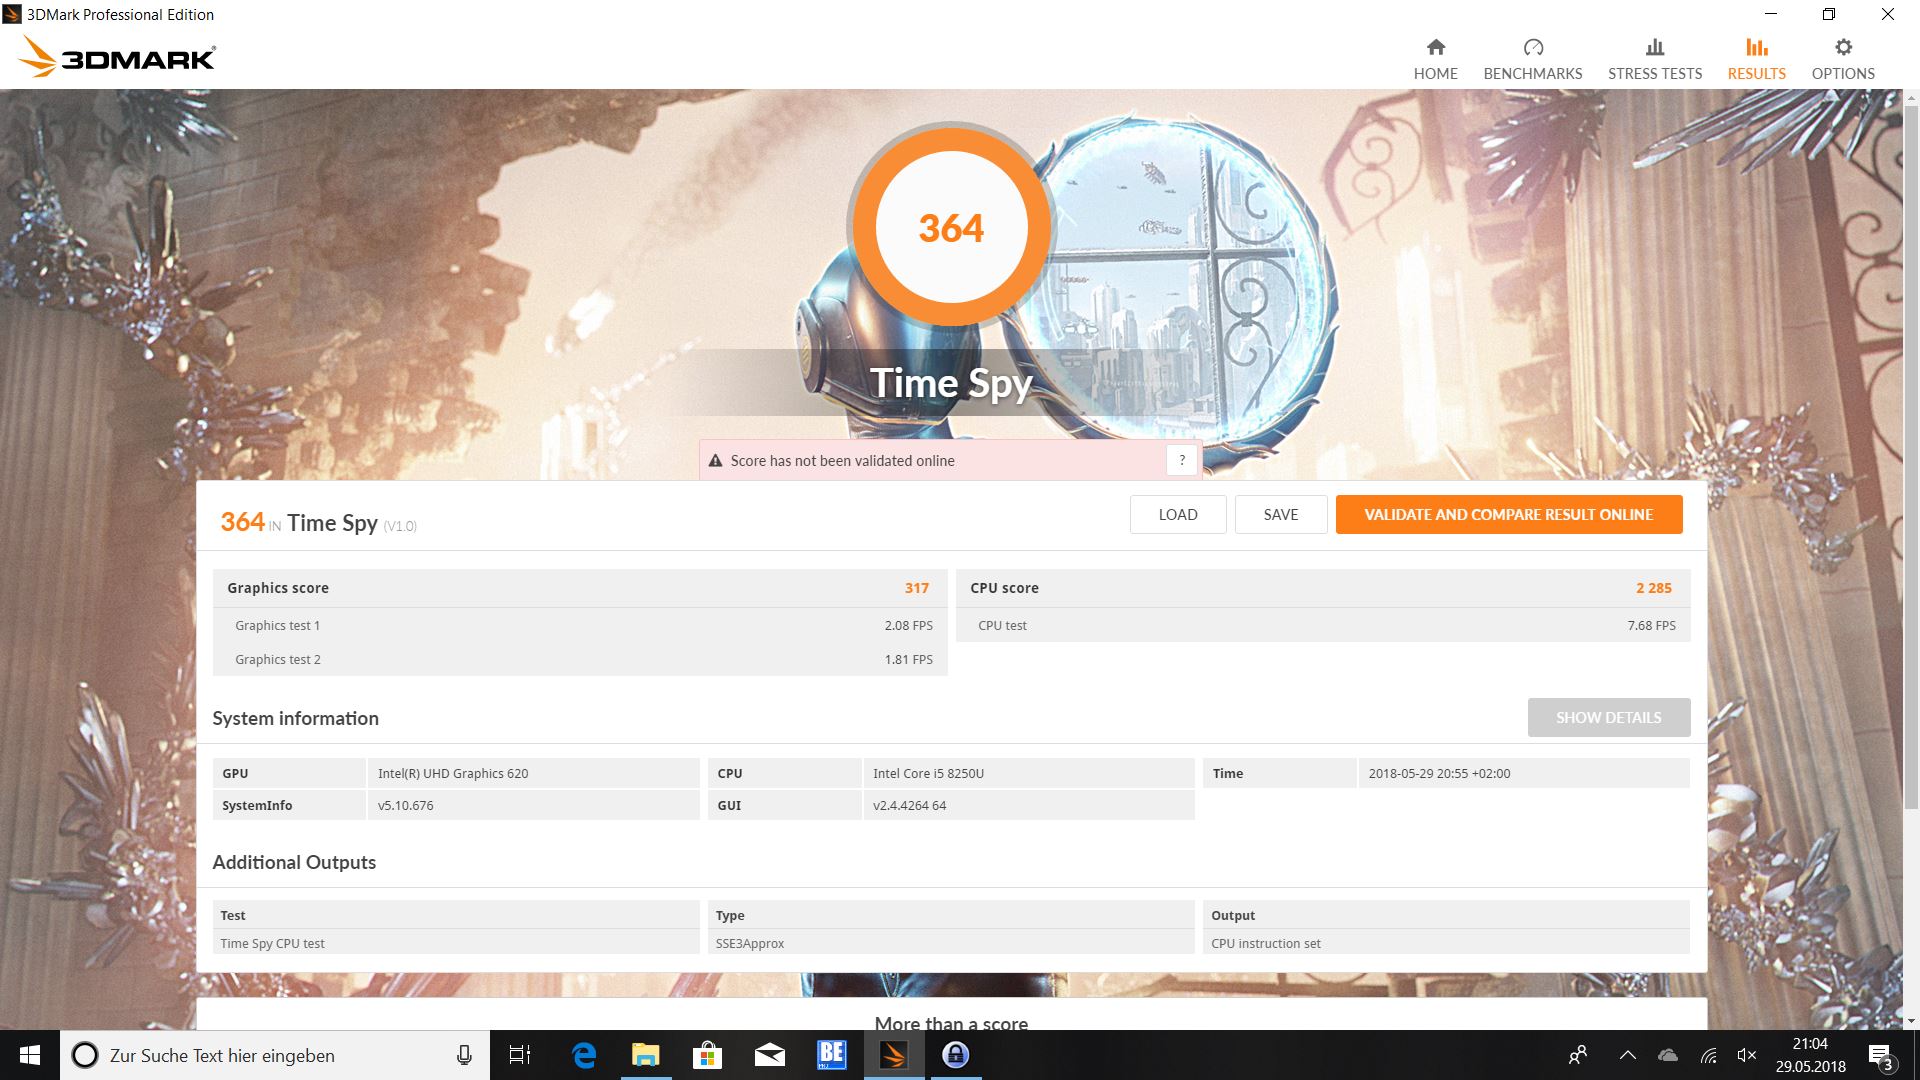
| 3DMark Time Spy Score | 364 pontos | |
Ajuda | ||
| baixo | média | alto | ultra | |
|---|---|---|---|---|
| BioShock Infinite (2013) | 48.1 | 27.1 | 22.4 | 7.4 |
| Battlefield 4 (2013) | 42.1 | 29.6 | 19.9 | 5.7 |
| The Witcher 3 (2015) | 15.2 | 9.9 | 5.5 | |
| Rise of the Tomb Raider (2016) | 18.6 | 11.4 | 6.5 | |
| Rocket League (2017) | 20.7 | 13.1 | ||
| FIFA 18 (2017) | 58.3 | 31.8 | 27.4 | 24.7 |
Barulho
| Ocioso |
| 30.4 / 30.4 / 31.2 dB |
| Carga |
| 31.5 / 31.5 dB |
 | ||
30 dB silencioso 40 dB(A) audível 50 dB(A) ruidosamente alto |
||
min: | ||
| Dell Inspiron 15 5579-9672 UHD Graphics 620, i5-8250U, SK hynix SC311 SATA | Dell Inspiron 15 5578-1777 2-in-1 HD Graphics 620, i5-7200U, SanDisk X400 256GB, SATA (SD8SB8U-256G) | HP Envy x360 15-bq102ng Vega 8, R5 2500U, Samsung PM961 MZVLW256HEHP | Asus VivoBook Flip 15 TP510UA-E8073T UHD Graphics 620, i5-8250U, SanDisk SD8SN8U128G1002 | Acer Spin 3 SP314-51-548L UHD Graphics 620, i5-8250U, Micron 1100 MTFDDAV256TBN | Lenovo ThinkPad L380 Yoga-20M7001BGE UHD Graphics 620, i5-8250U, Samsung PM961 MZVLW256HEHP | |
|---|---|---|---|---|---|---|
| Noise | -2% | -7% | -3% | -9% | -1% | |
| desligado / ambiente * (dB) | 30.4 | 30.6 -1% | 30.13 1% | 30.2 1% | 30 1% | 30.4 -0% |
| Idle Minimum * (dB) | 30.4 | 30.4 -0% | 30.13 1% | 30.9 -2% | 30 1% | 30.4 -0% |
| Idle Average * (dB) | 30.4 | 30.4 -0% | 30.13 1% | 30.9 -2% | 30 1% | 30.4 -0% |
| Idle Maximum * (dB) | 31.2 | 30.4 3% | 30.13 3% | 30.9 1% | 30 4% | 30.8 1% |
| Load Average * (dB) | 31.5 | 32.3 -3% | 38.8 -23% | 34.2 -9% | 38.5 -22% | 32.1 -2% |
| Load Maximum * (dB) | 31.5 | 35.2 -12% | 38.8 -23% | 34.2 -9% | 44 -40% | 32.9 -4% |
* ... menor é melhor
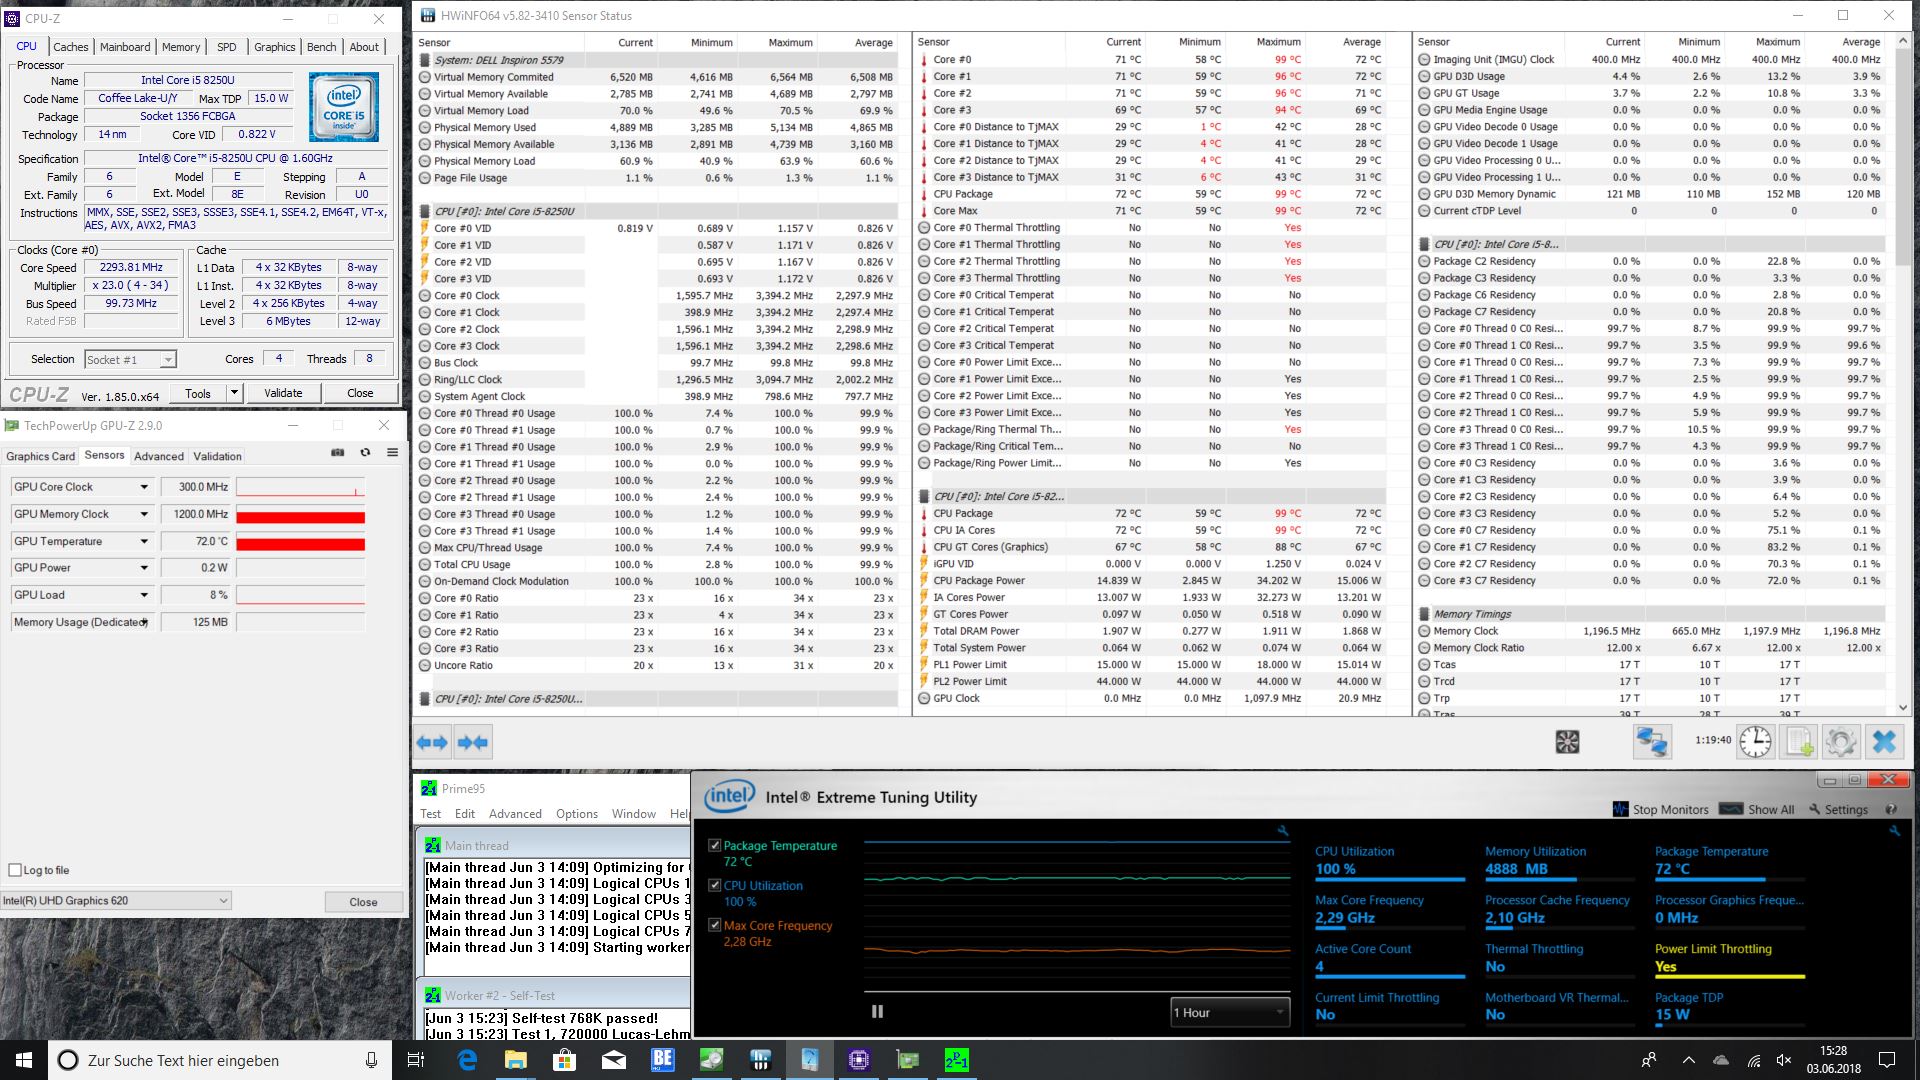
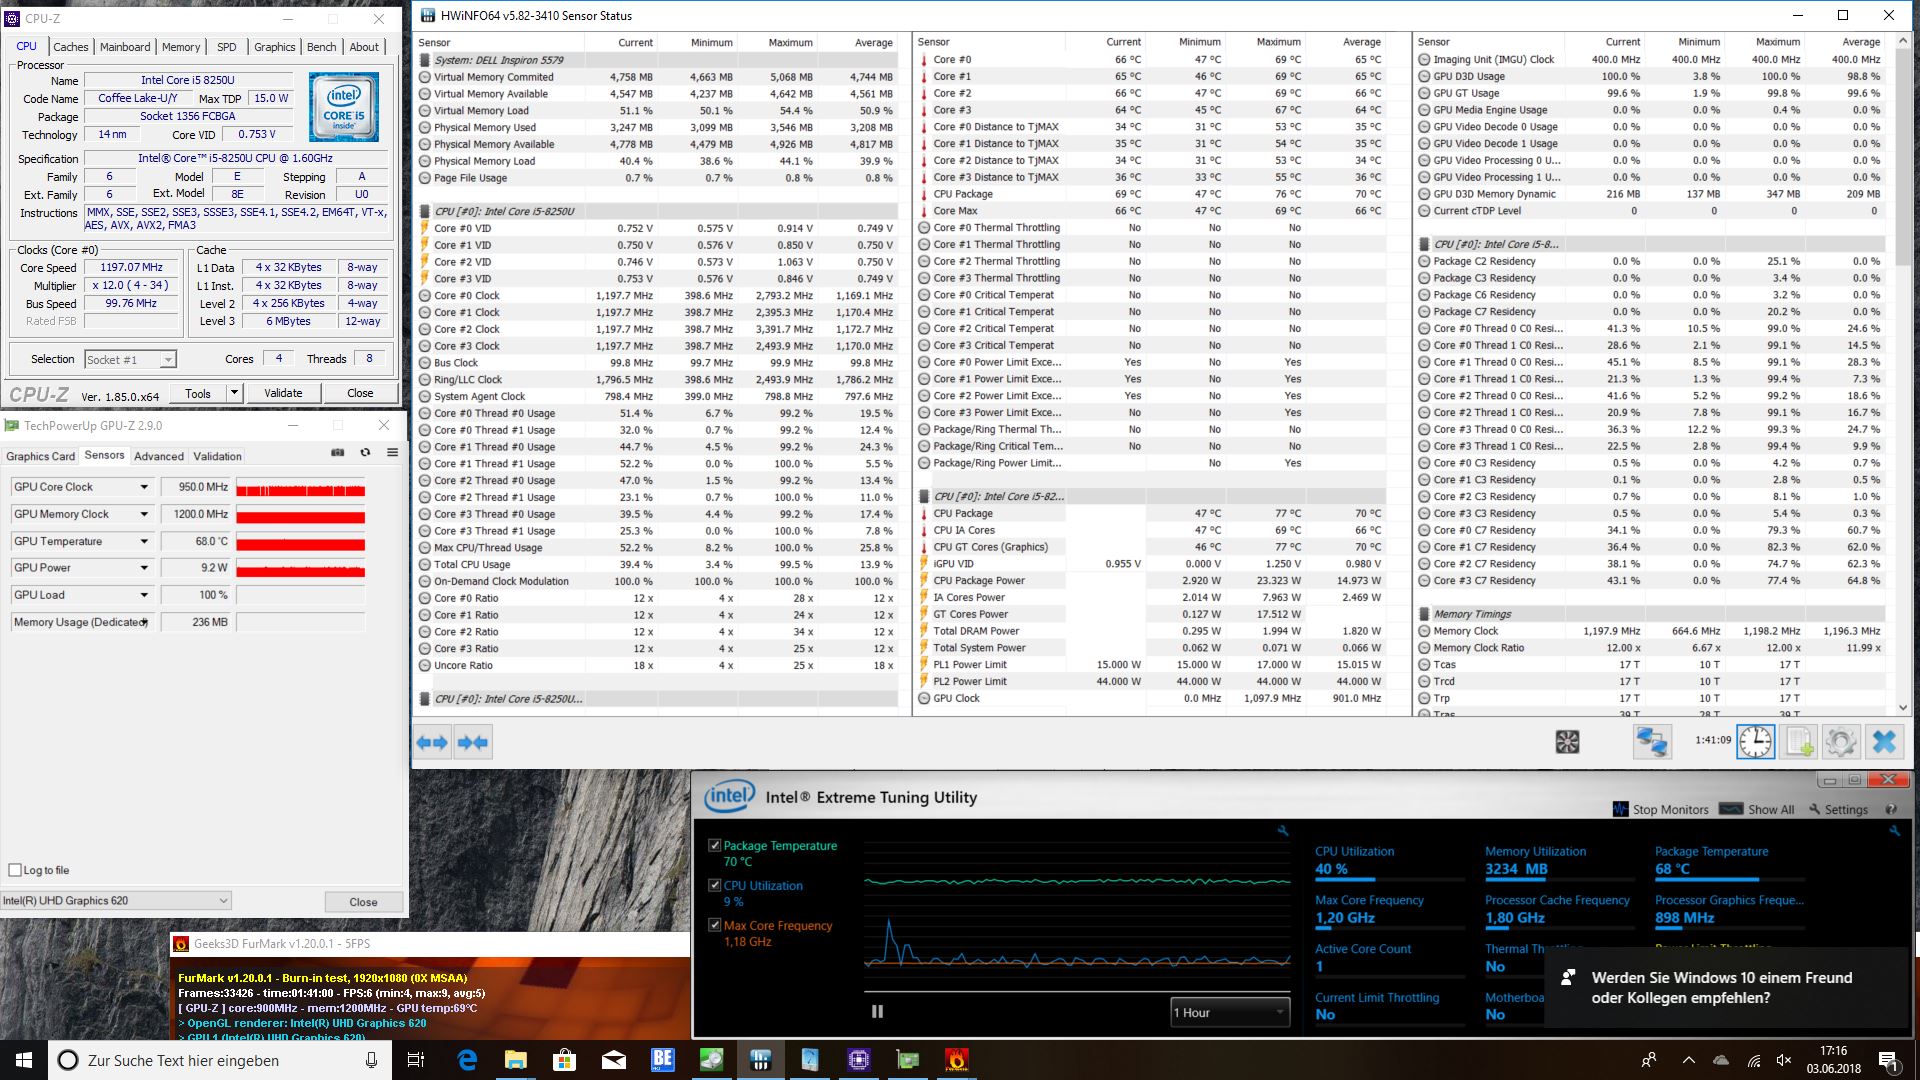

(±) A temperatura máxima no lado superior é 41.6 °C / 107 F, em comparação com a média de 35.4 °C / 96 F , variando de 19.6 a 60 °C para a classe Convertible.
(±) A parte inferior aquece até um máximo de 41.9 °C / 107 F, em comparação com a média de 36.9 °C / 98 F
(+) Em uso inativo, a temperatura média para o lado superior é 24.5 °C / 76 F, em comparação com a média do dispositivo de 30.3 °C / ### class_avg_f### F.
(+) Os apoios para as mãos e o touchpad são mais frios que a temperatura da pele, com um máximo de 25 °C / 77 F e, portanto, são frios ao toque.
(+) A temperatura média da área do apoio para as mãos de dispositivos semelhantes foi 28 °C / 82.4 F (+3 °C / 5.4 F).
| Dell Inspiron 15 5579-9672 UHD Graphics 620, i5-8250U, SK hynix SC311 SATA | Dell Inspiron 15 5578-1777 2-in-1 HD Graphics 620, i5-7200U, SanDisk X400 256GB, SATA (SD8SB8U-256G) | HP Envy x360 15-bq102ng Vega 8, R5 2500U, Samsung PM961 MZVLW256HEHP | Asus VivoBook Flip 15 TP510UA-E8073T UHD Graphics 620, i5-8250U, SanDisk SD8SN8U128G1002 | Acer Spin 3 SP314-51-548L UHD Graphics 620, i5-8250U, Micron 1100 MTFDDAV256TBN | Lenovo ThinkPad L380 Yoga-20M7001BGE UHD Graphics 620, i5-8250U, Samsung PM961 MZVLW256HEHP | |
|---|---|---|---|---|---|---|
| Heat | 0% | -11% | 7% | -3% | -5% | |
| Maximum Upper Side * (°C) | 41.6 | 37.3 10% | 38 9% | 36 13% | 44.1 -6% | 45 -8% |
| Maximum Bottom * (°C) | 41.9 | 43.3 -3% | 37.1 11% | 37 12% | 41.6 1% | 44.5 -6% |
| Idle Upper Side * (°C) | 26.1 | 26.8 -3% | 38.6 -48% | 25.6 2% | 25.6 2% | |
| Idle Bottom * (°C) | 25.7 | 26.6 -4% | 29.2 -14% | 25.7 -0% | 27.7 -8% |
* ... menor é melhor
Dell Inspiron 15 5579-9672 análise de áudio
(±) | o volume do alto-falante é médio, mas bom (###valor### dB)
Graves 100 - 315Hz
(-) | quase nenhum baixo - em média 20.7% menor que a mediana
(±) | a linearidade dos graves é média (11.9% delta para a frequência anterior)
Médios 400 - 2.000 Hz
(±) | médios mais altos - em média 7.8% maior que a mediana
(±) | a linearidade dos médios é média (11.2% delta para frequência anterior)
Altos 2 - 16 kHz
(±) | máximos mais altos - em média 5.1% maior que a mediana
(+) | os máximos são lineares (5.7% delta da frequência anterior)
Geral 100 - 16.000 Hz
(±) | a linearidade do som geral é média (25.6% diferença em relação à mediana)
Comparado com a mesma classe
» 78% de todos os dispositivos testados nesta classe foram melhores, 5% semelhantes, 17% piores
» O melhor teve um delta de 6%, a média foi 20%, o pior foi 57%
Comparado com todos os dispositivos testados
» 79% de todos os dispositivos testados foram melhores, 4% semelhantes, 17% piores
» O melhor teve um delta de 4%, a média foi 23%, o pior foi 134%
Lenovo ThinkPad L380 Yoga-20M7001BGE análise de áudio
(-) | alto-falantes não muito altos (###valor### dB)
Graves 100 - 315Hz
(-) | quase nenhum baixo - em média 17.5% menor que a mediana
(±) | a linearidade dos graves é média (13.8% delta para a frequência anterior)
Médios 400 - 2.000 Hz
(+) | médios equilibrados - apenas 2.9% longe da mediana
(+) | médios são lineares (5.1% delta para frequência anterior)
Altos 2 - 16 kHz
(+) | agudos equilibrados - apenas 2.4% longe da mediana
(±) | a linearidade dos máximos é média (8.7% delta para frequência anterior)
Geral 100 - 16.000 Hz
(±) | a linearidade do som geral é média (17.3% diferença em relação à mediana)
Comparado com a mesma classe
» 33% de todos os dispositivos testados nesta classe foram melhores, 8% semelhantes, 59% piores
» O melhor teve um delta de 6%, a média foi 20%, o pior foi 57%
Comparado com todos os dispositivos testados
» 33% de todos os dispositivos testados foram melhores, 8% semelhantes, 59% piores
» O melhor teve um delta de 4%, a média foi 23%, o pior foi 134%
| desligado | |
| Ocioso | |
| Carga |
|
Key:
min: | |
| Dell Inspiron 15 5579-9672 i5-8250U, UHD Graphics 620, SK hynix SC311 SATA, IPS, 1920x1080, 15.6" | Dell Inspiron 15 5578-1777 2-in-1 i5-7200U, HD Graphics 620, SanDisk X400 256GB, SATA (SD8SB8U-256G), IPS, 1920x1080, 15.6" | HP Envy x360 15-bq102ng R5 2500U, Vega 8, Samsung PM961 MZVLW256HEHP, IPS, 1920x1080, 15.6" | Asus VivoBook Flip 15 TP510UA-E8073T i5-8250U, UHD Graphics 620, SanDisk SD8SN8U128G1002, IPS, 1920x1080, 15.6" | Acer Spin 3 SP314-51-548L i5-8250U, UHD Graphics 620, Micron 1100 MTFDDAV256TBN, IPS, 1920x1080, 14" | Lenovo ThinkPad L380 Yoga-20M7001BGE i5-8250U, UHD Graphics 620, Samsung PM961 MZVLW256HEHP, IPS LED, 1920x1080, 13.3" | Média Intel UHD Graphics 620 | Média da turma Convertible | |
|---|---|---|---|---|---|---|---|---|
| Power Consumption | -5% | -20% | -7% | 21% | 6% | -11% | -32% | |
| Idle Minimum * (Watt) | 3.9 | 4.3 -10% | 4.8 -23% | 3.9 -0% | 2.9 26% | 3.44 12% | 3.81 ? 2% | 4.28 ? -10% |
| Idle Average * (Watt) | 6.6 | 7.6 -15% | 7 -6% | 7.2 -9% | 5.2 21% | 6.9 -5% | 6.94 ? -5% | 6.96 ? -5% |
| Idle Maximum * (Watt) | 9.3 | 9.8 -5% | 9.5 -2% | 9.5 -2% | 5.4 42% | 9.2 1% | 8.75 ? 6% | 8.67 ? 7% |
| Load Average * (Watt) | 30.2 | 32.6 -8% | 40.8 -35% | 36.8 -22% | 29.4 3% | 27.6 9% | 35 ? -16% | 45.1 ? -49% |
| Load Maximum * (Watt) | 33.2 | 28.4 14% | 44.3 -33% | 33.1 -0% | 29.6 11% | 29 13% | 47.5 ? -43% | 67.7 ? -104% |
* ... menor é melhor

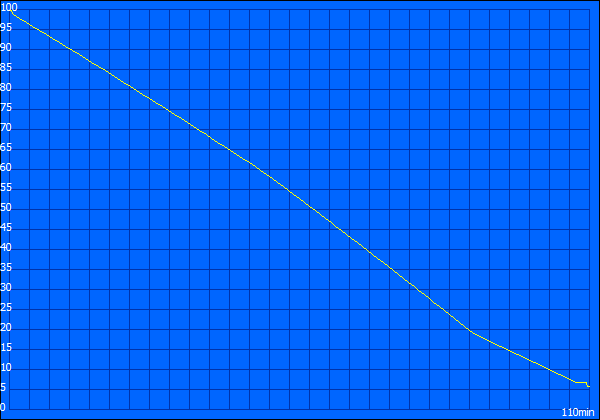
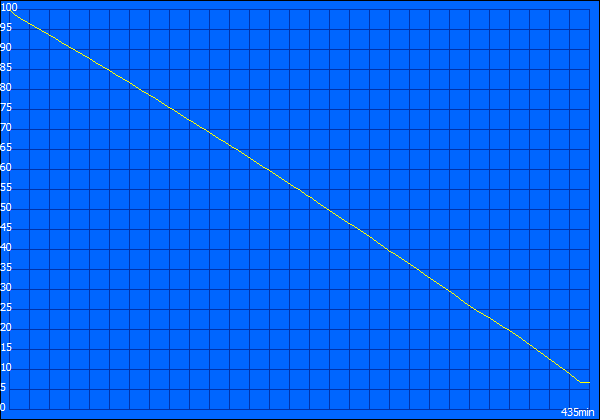
| Dell Inspiron 15 5579-9672 i5-8250U, UHD Graphics 620, 42 Wh | Dell Inspiron 15 5578-1777 2-in-1 i5-7200U, HD Graphics 620, 42 Wh | HP Envy x360 15-bq102ng R5 2500U, Vega 8, 55.8 Wh | Asus VivoBook Flip 15 TP510UA-E8073T i5-8250U, UHD Graphics 620, 42 Wh | Acer Spin 3 SP314-51-548L i5-8250U, UHD Graphics 620, 52.5 Wh | Lenovo ThinkPad L380 Yoga-20M7001BGE i5-8250U, UHD Graphics 620, 45 Wh | |
|---|---|---|---|---|---|---|
| Duração da bateria | -10% | -3% | -18% | 14% | 10% | |
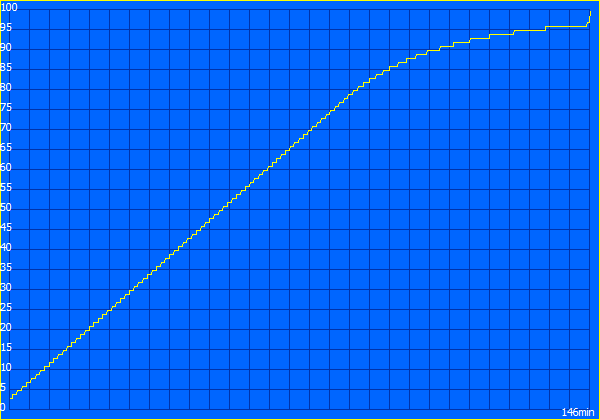
| Reader / Idle (h) | 11.2 | 13.9 24% | ||||
| H.264 (h) | 6.7 | 8.5 27% | ||||
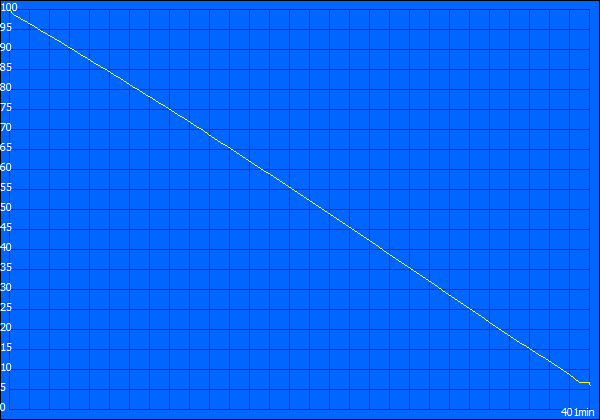
| WiFi v1.3 (h) | 7.3 | 6.6 -10% | 7.1 -3% | 6 -18% | 8.3 14% | 7 -4% |
| Load (h) | 1.8 | 1.7 -6% |
Pro
Contra
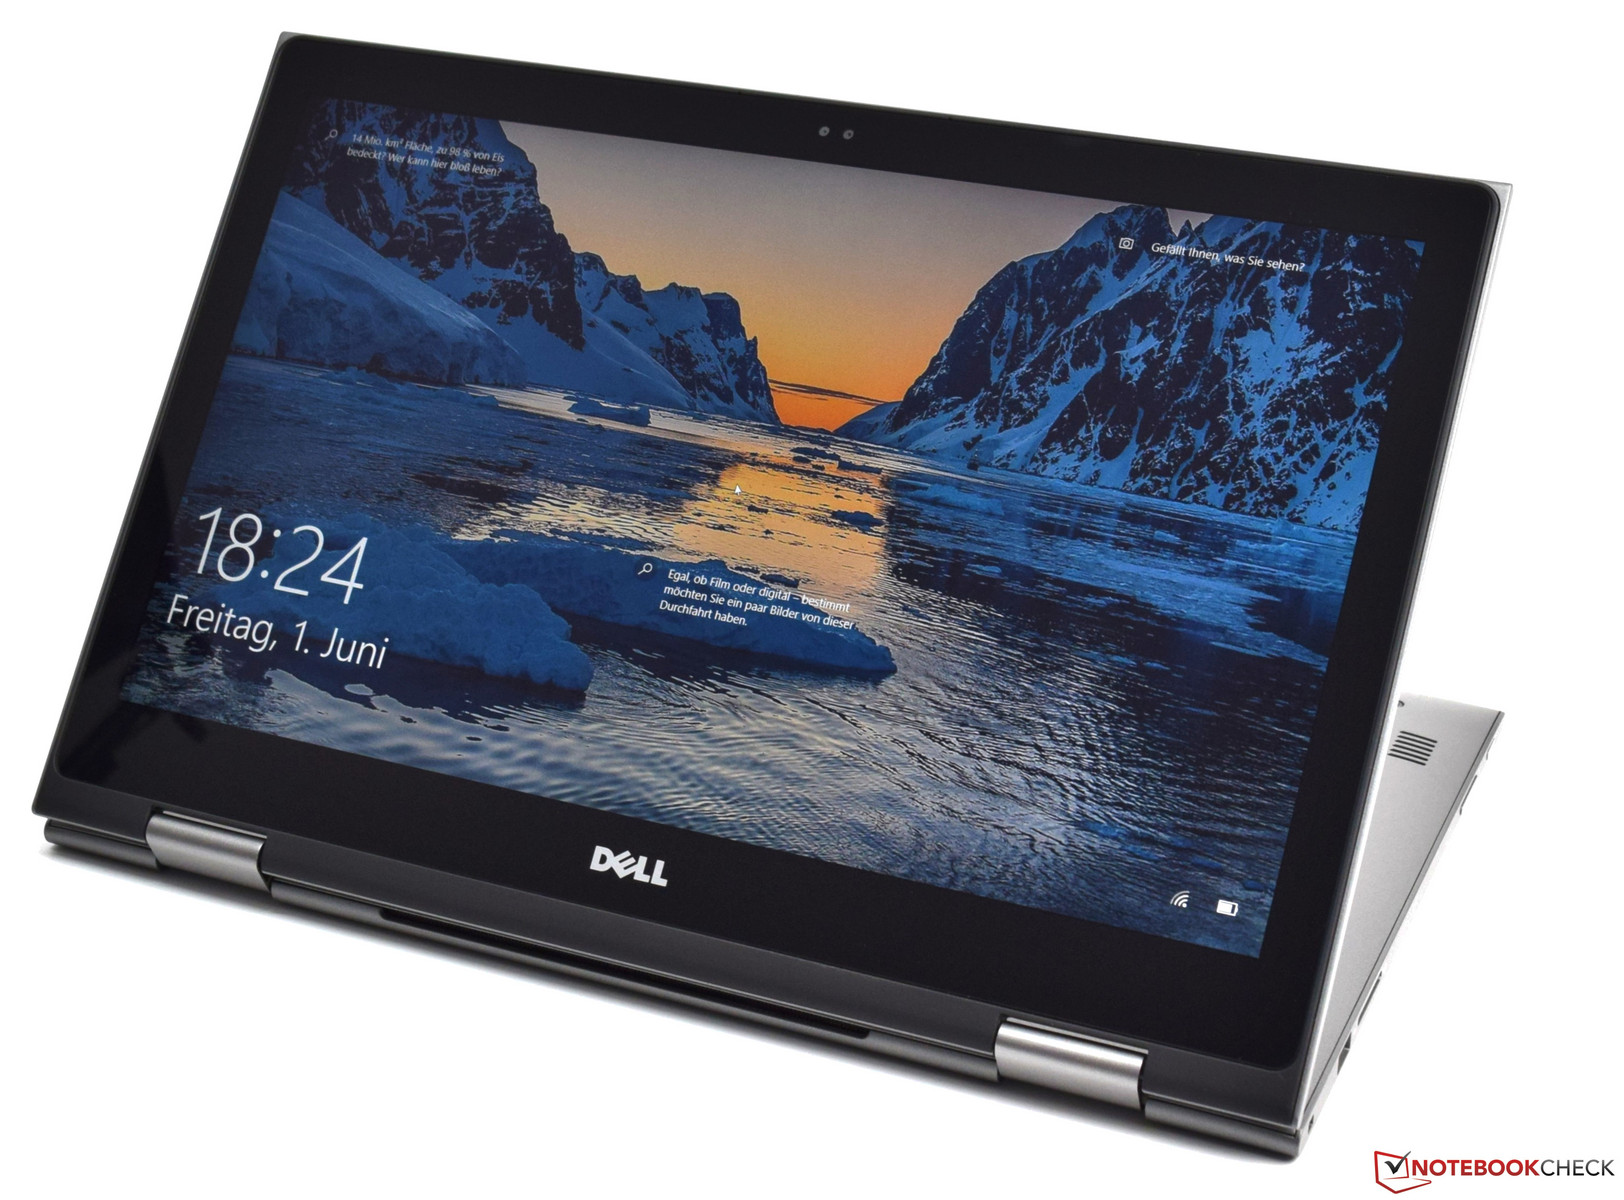
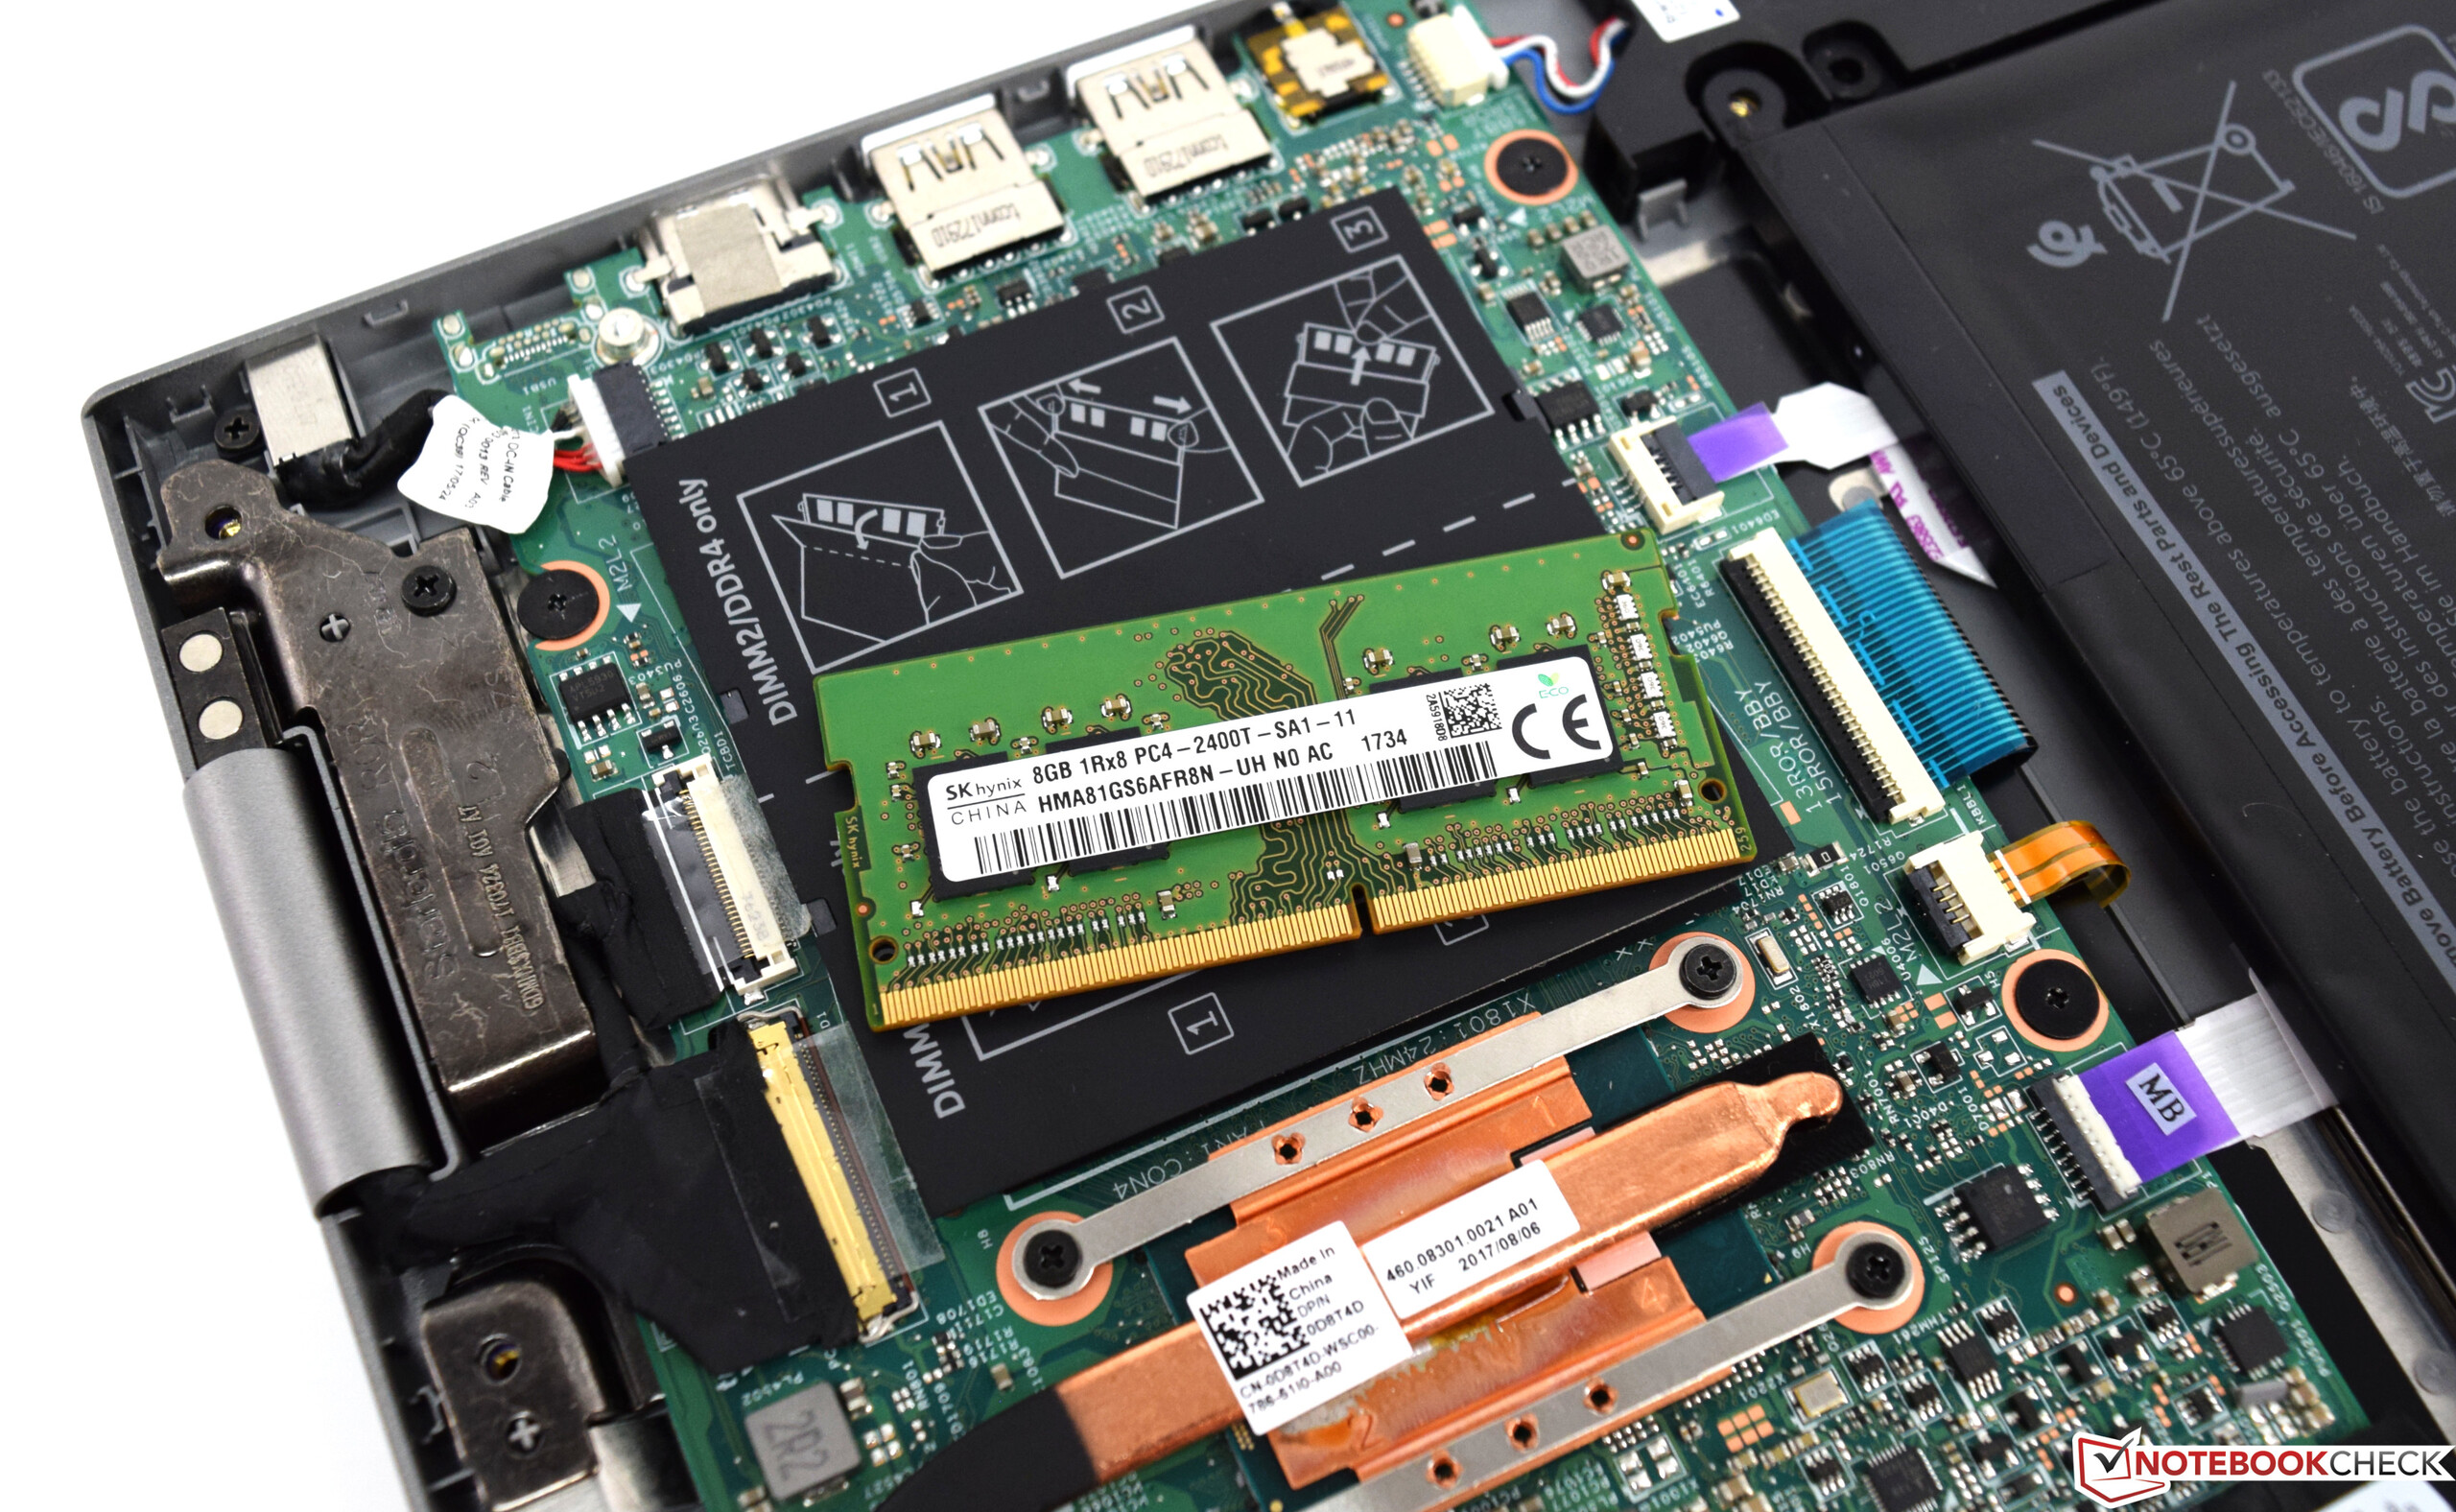
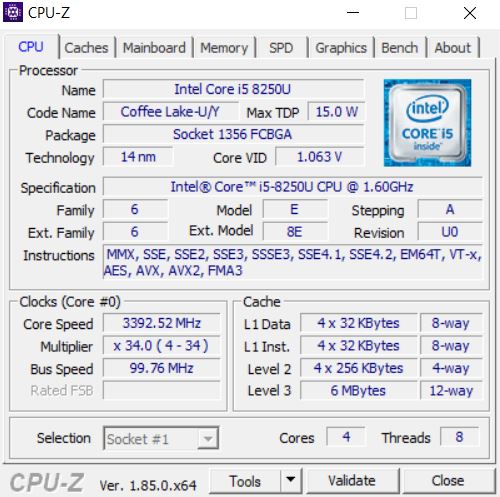
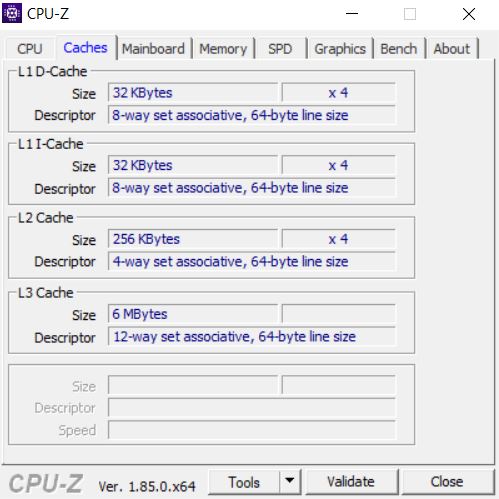
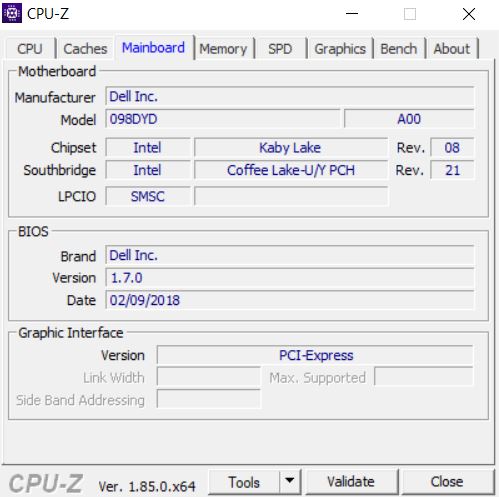
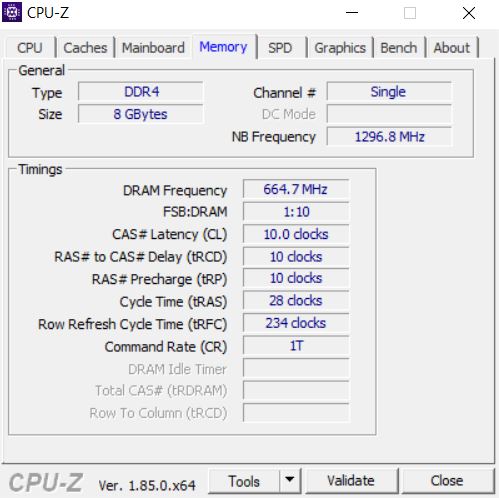
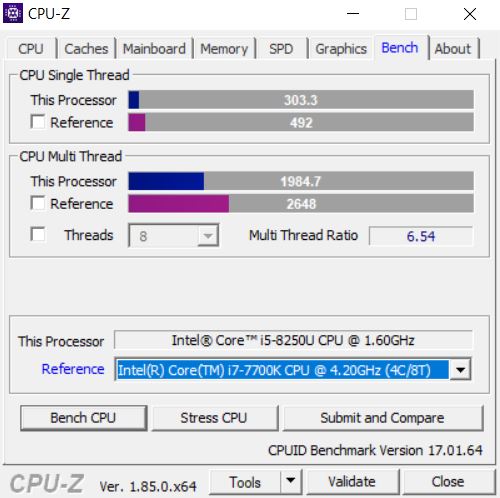
O Dell Inspiron 15 5579 é um conversível de 15,6 polegadas com apenas pequenas atualizações sobre o modelo anterior. Até parece idêntico ao predecessor do antecessor, o Dell Inspiron 15 5568.... No entanto, é mais poderoso do que nunca graças ao Core i5 2430M da Intel, e o desempenho do Wi-Fi também melhorou drasticamente e foi muito mais rápido que no Dell Inspiron 15 5578 do ano passado. Equipado com 8 GB de RAM DDR4 e um SSD grande de 256 GB, o 5579 atualmente é vendido por $749.
O preço é justo para o conversível de 15,6 polegadas, e os dispositivos de entrada decentes agradarão escritores prolíficos. No entanto, as desvantagens do portátil são a tela escura e a falta de suporte ao Active Pen.
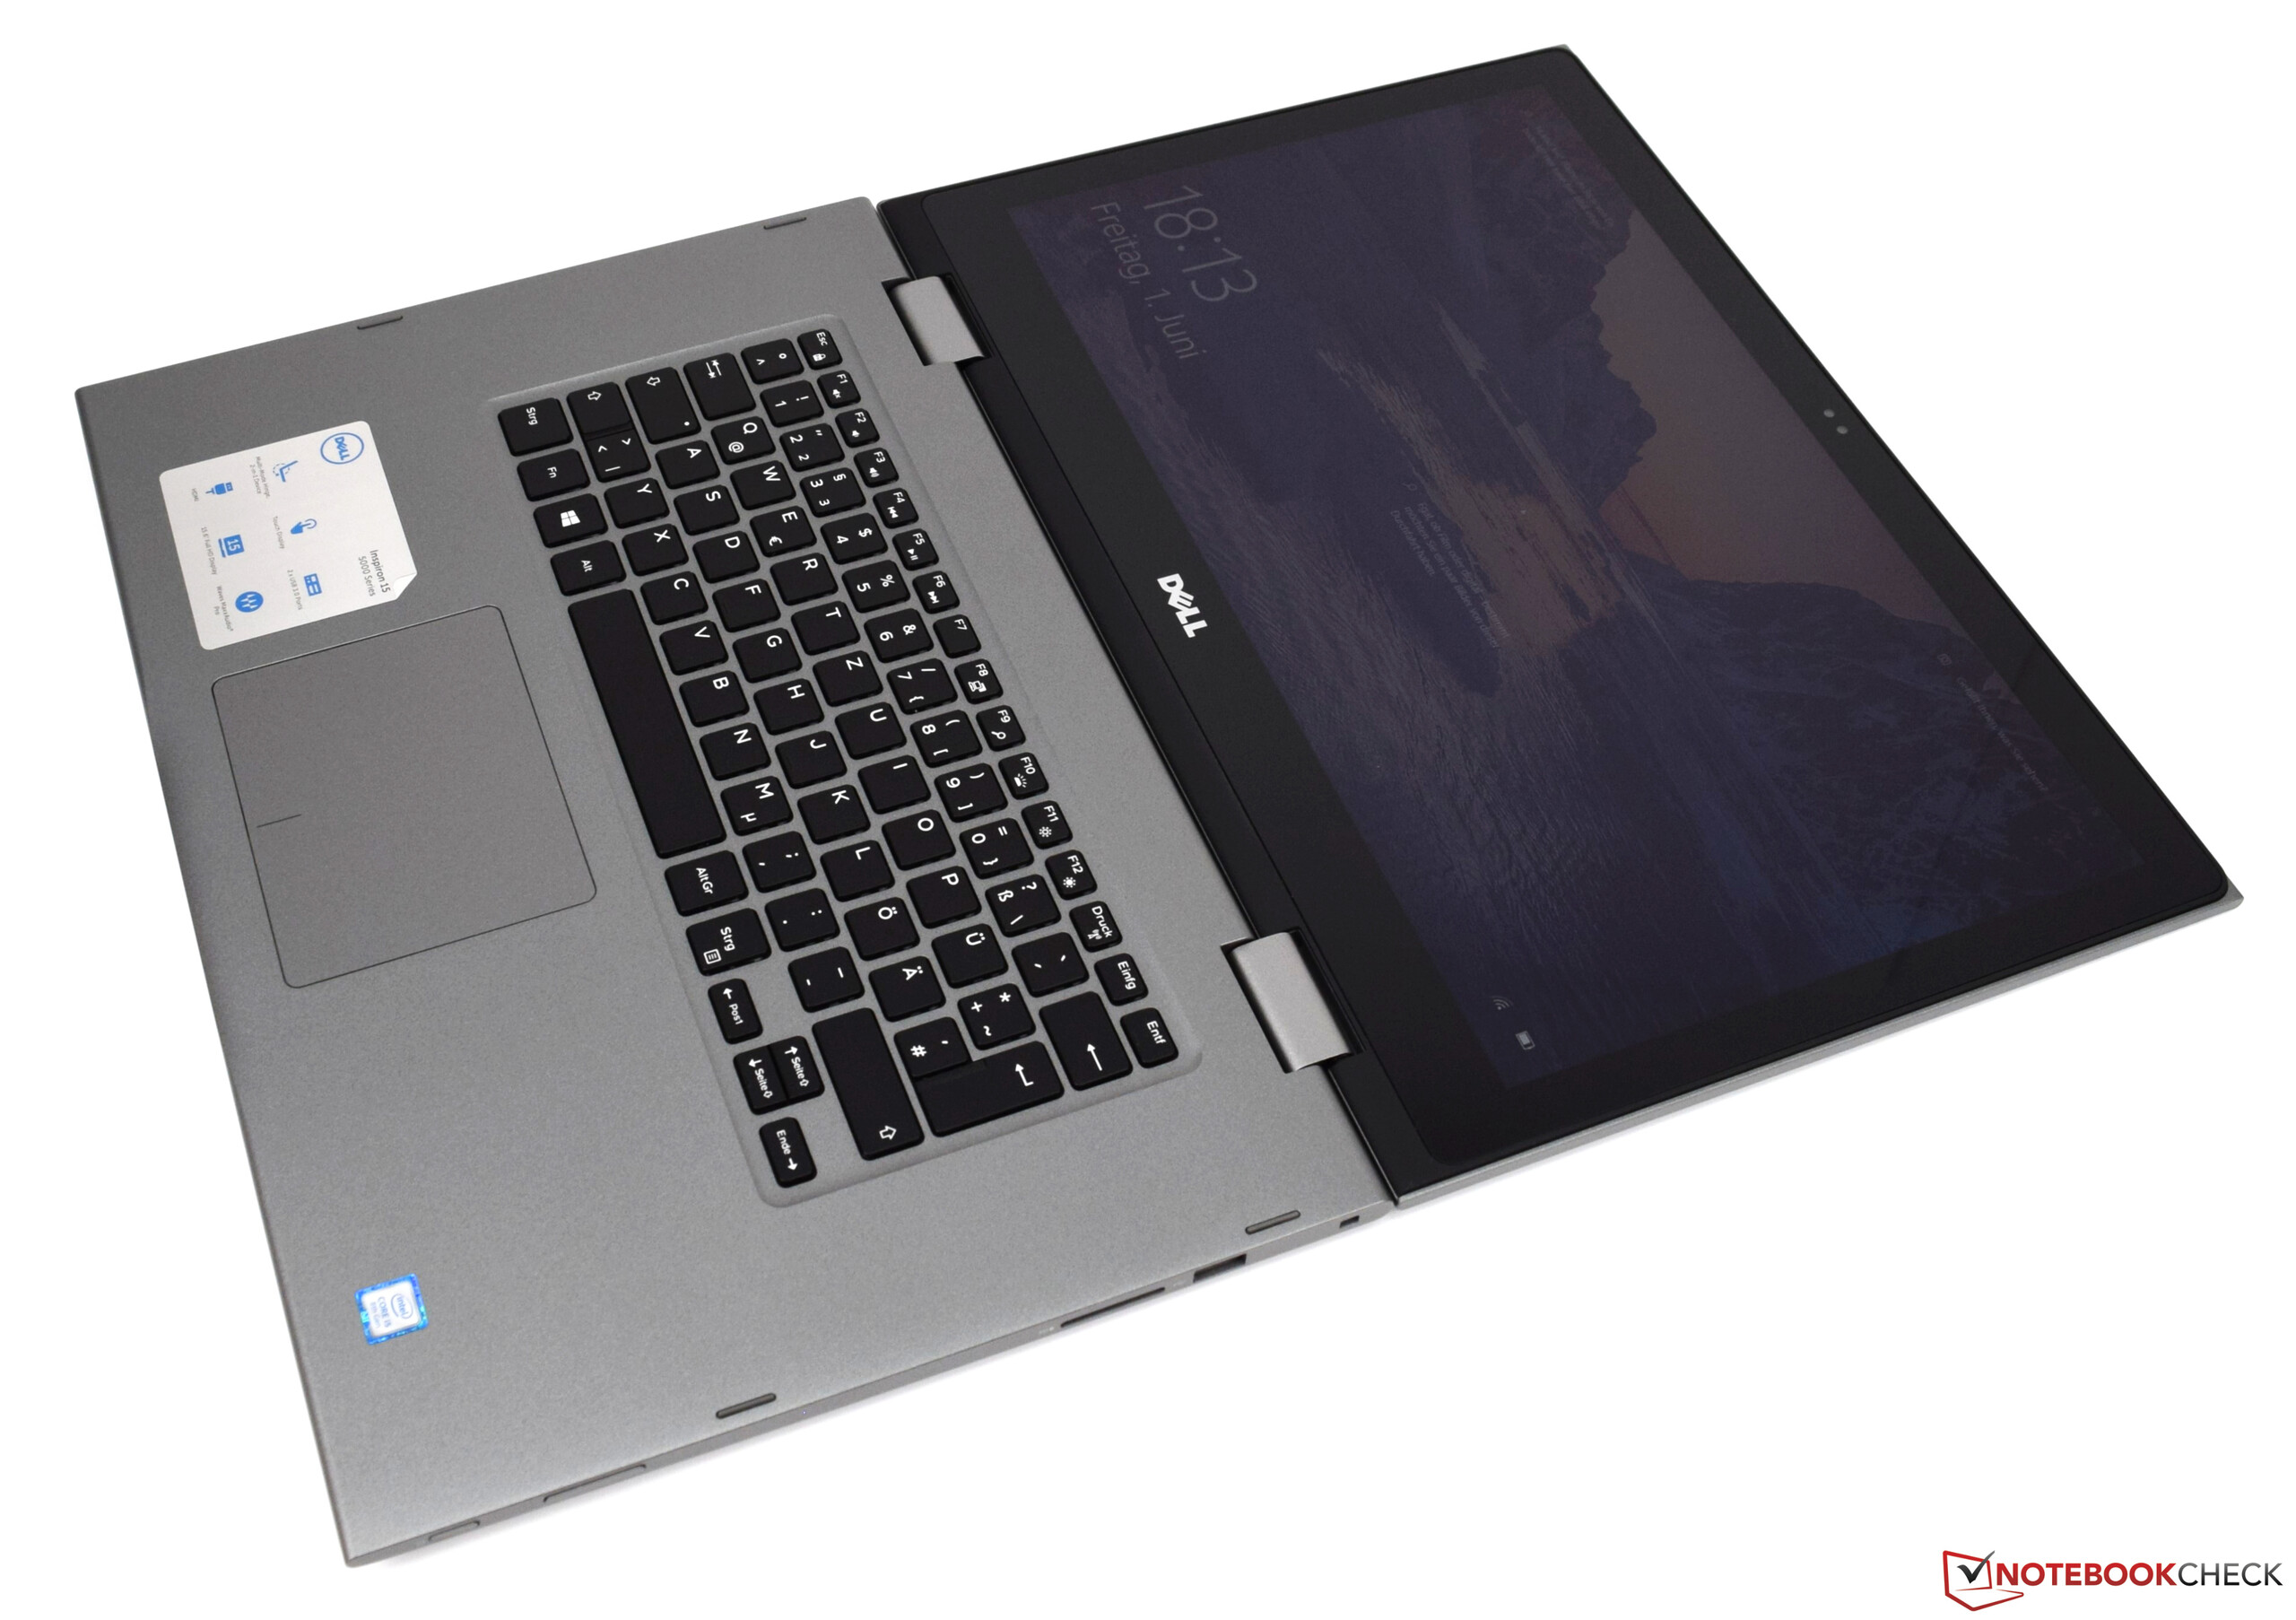
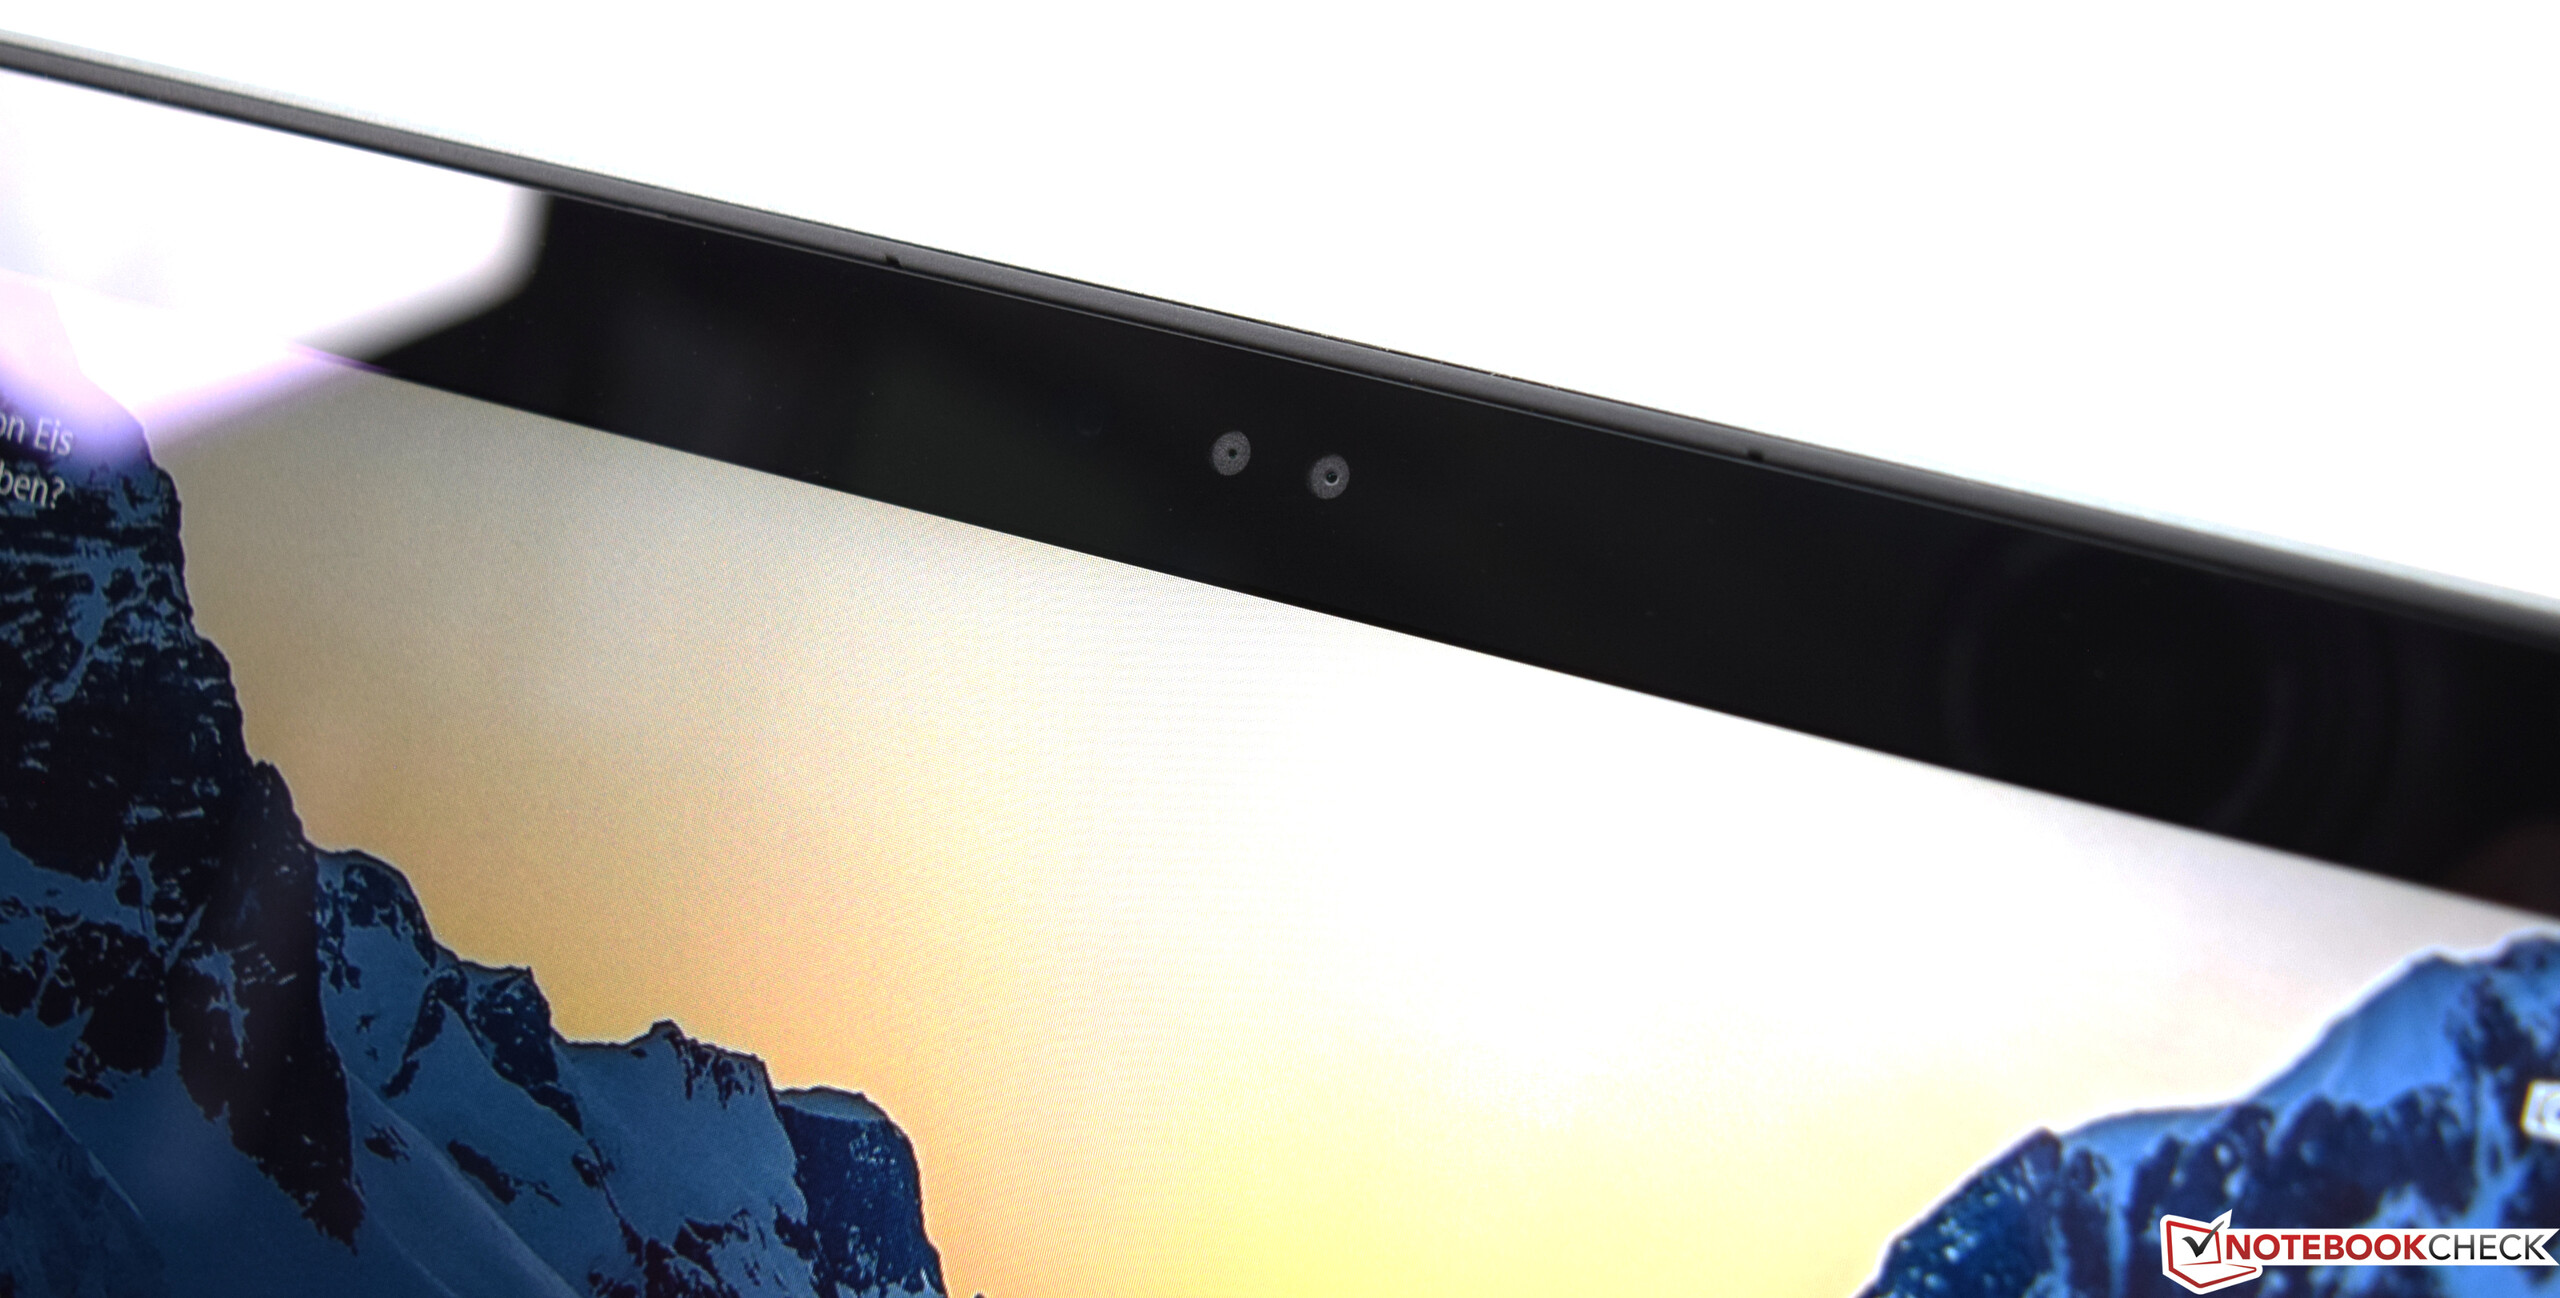
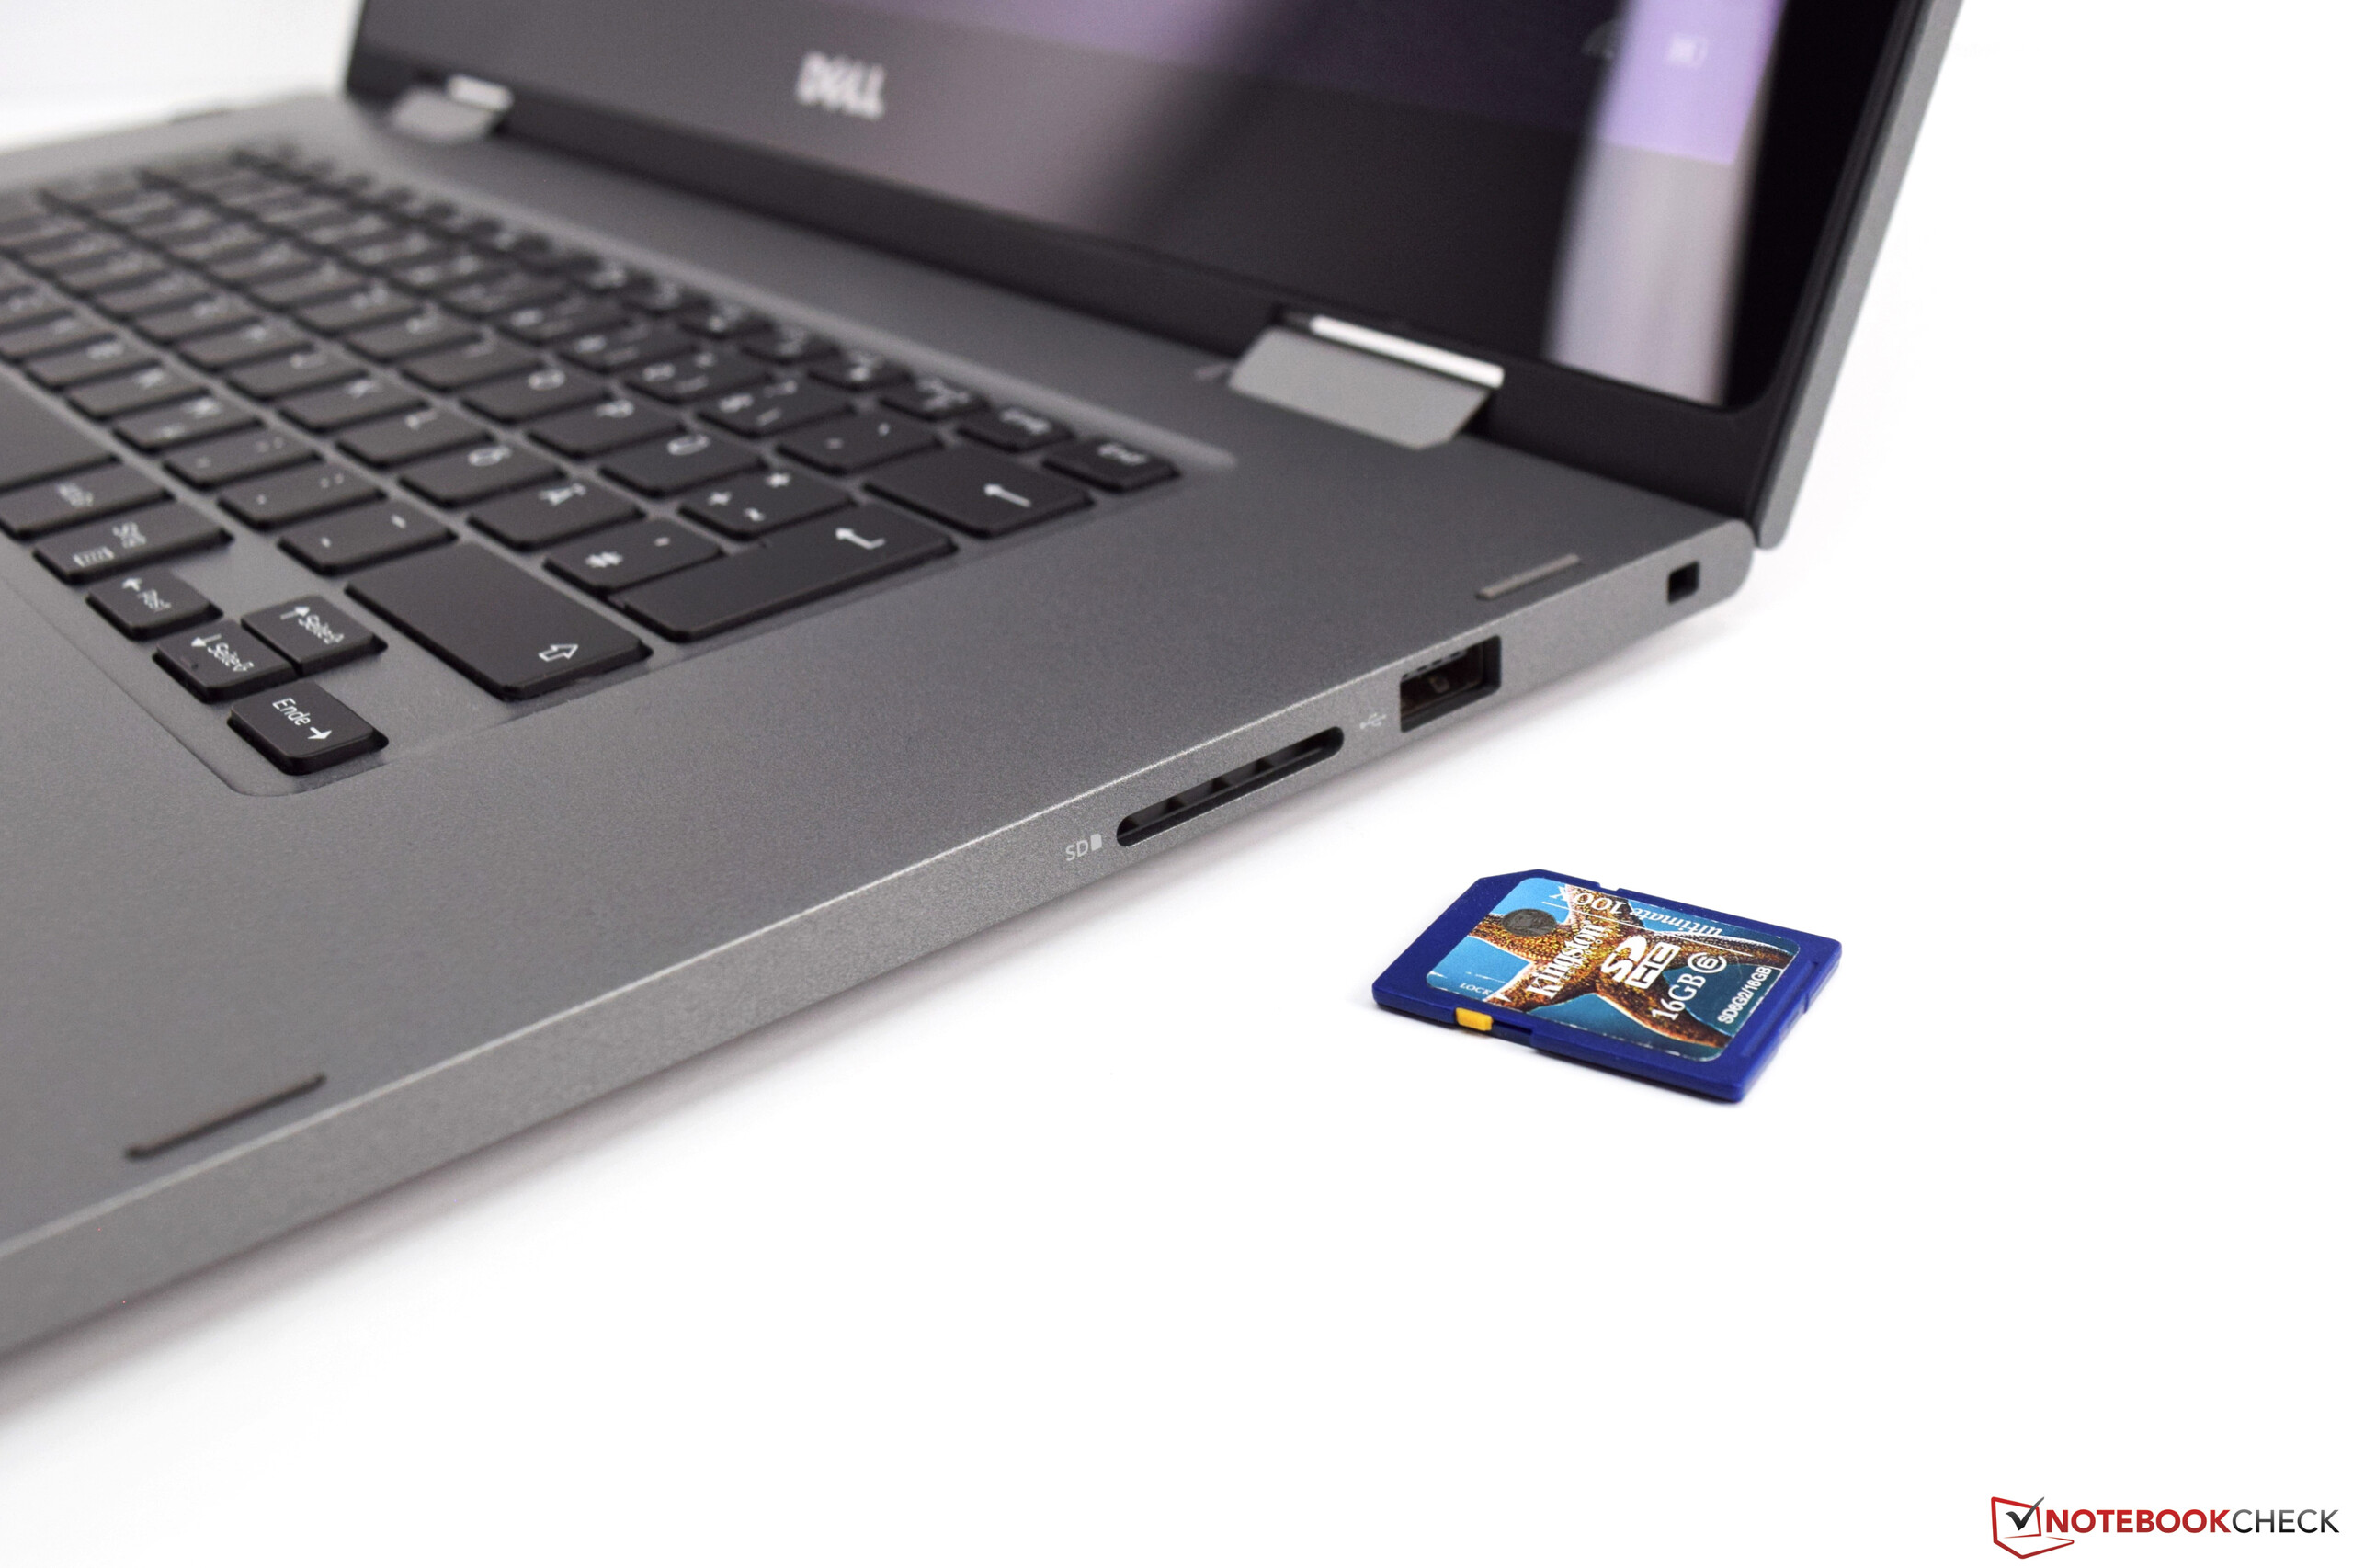
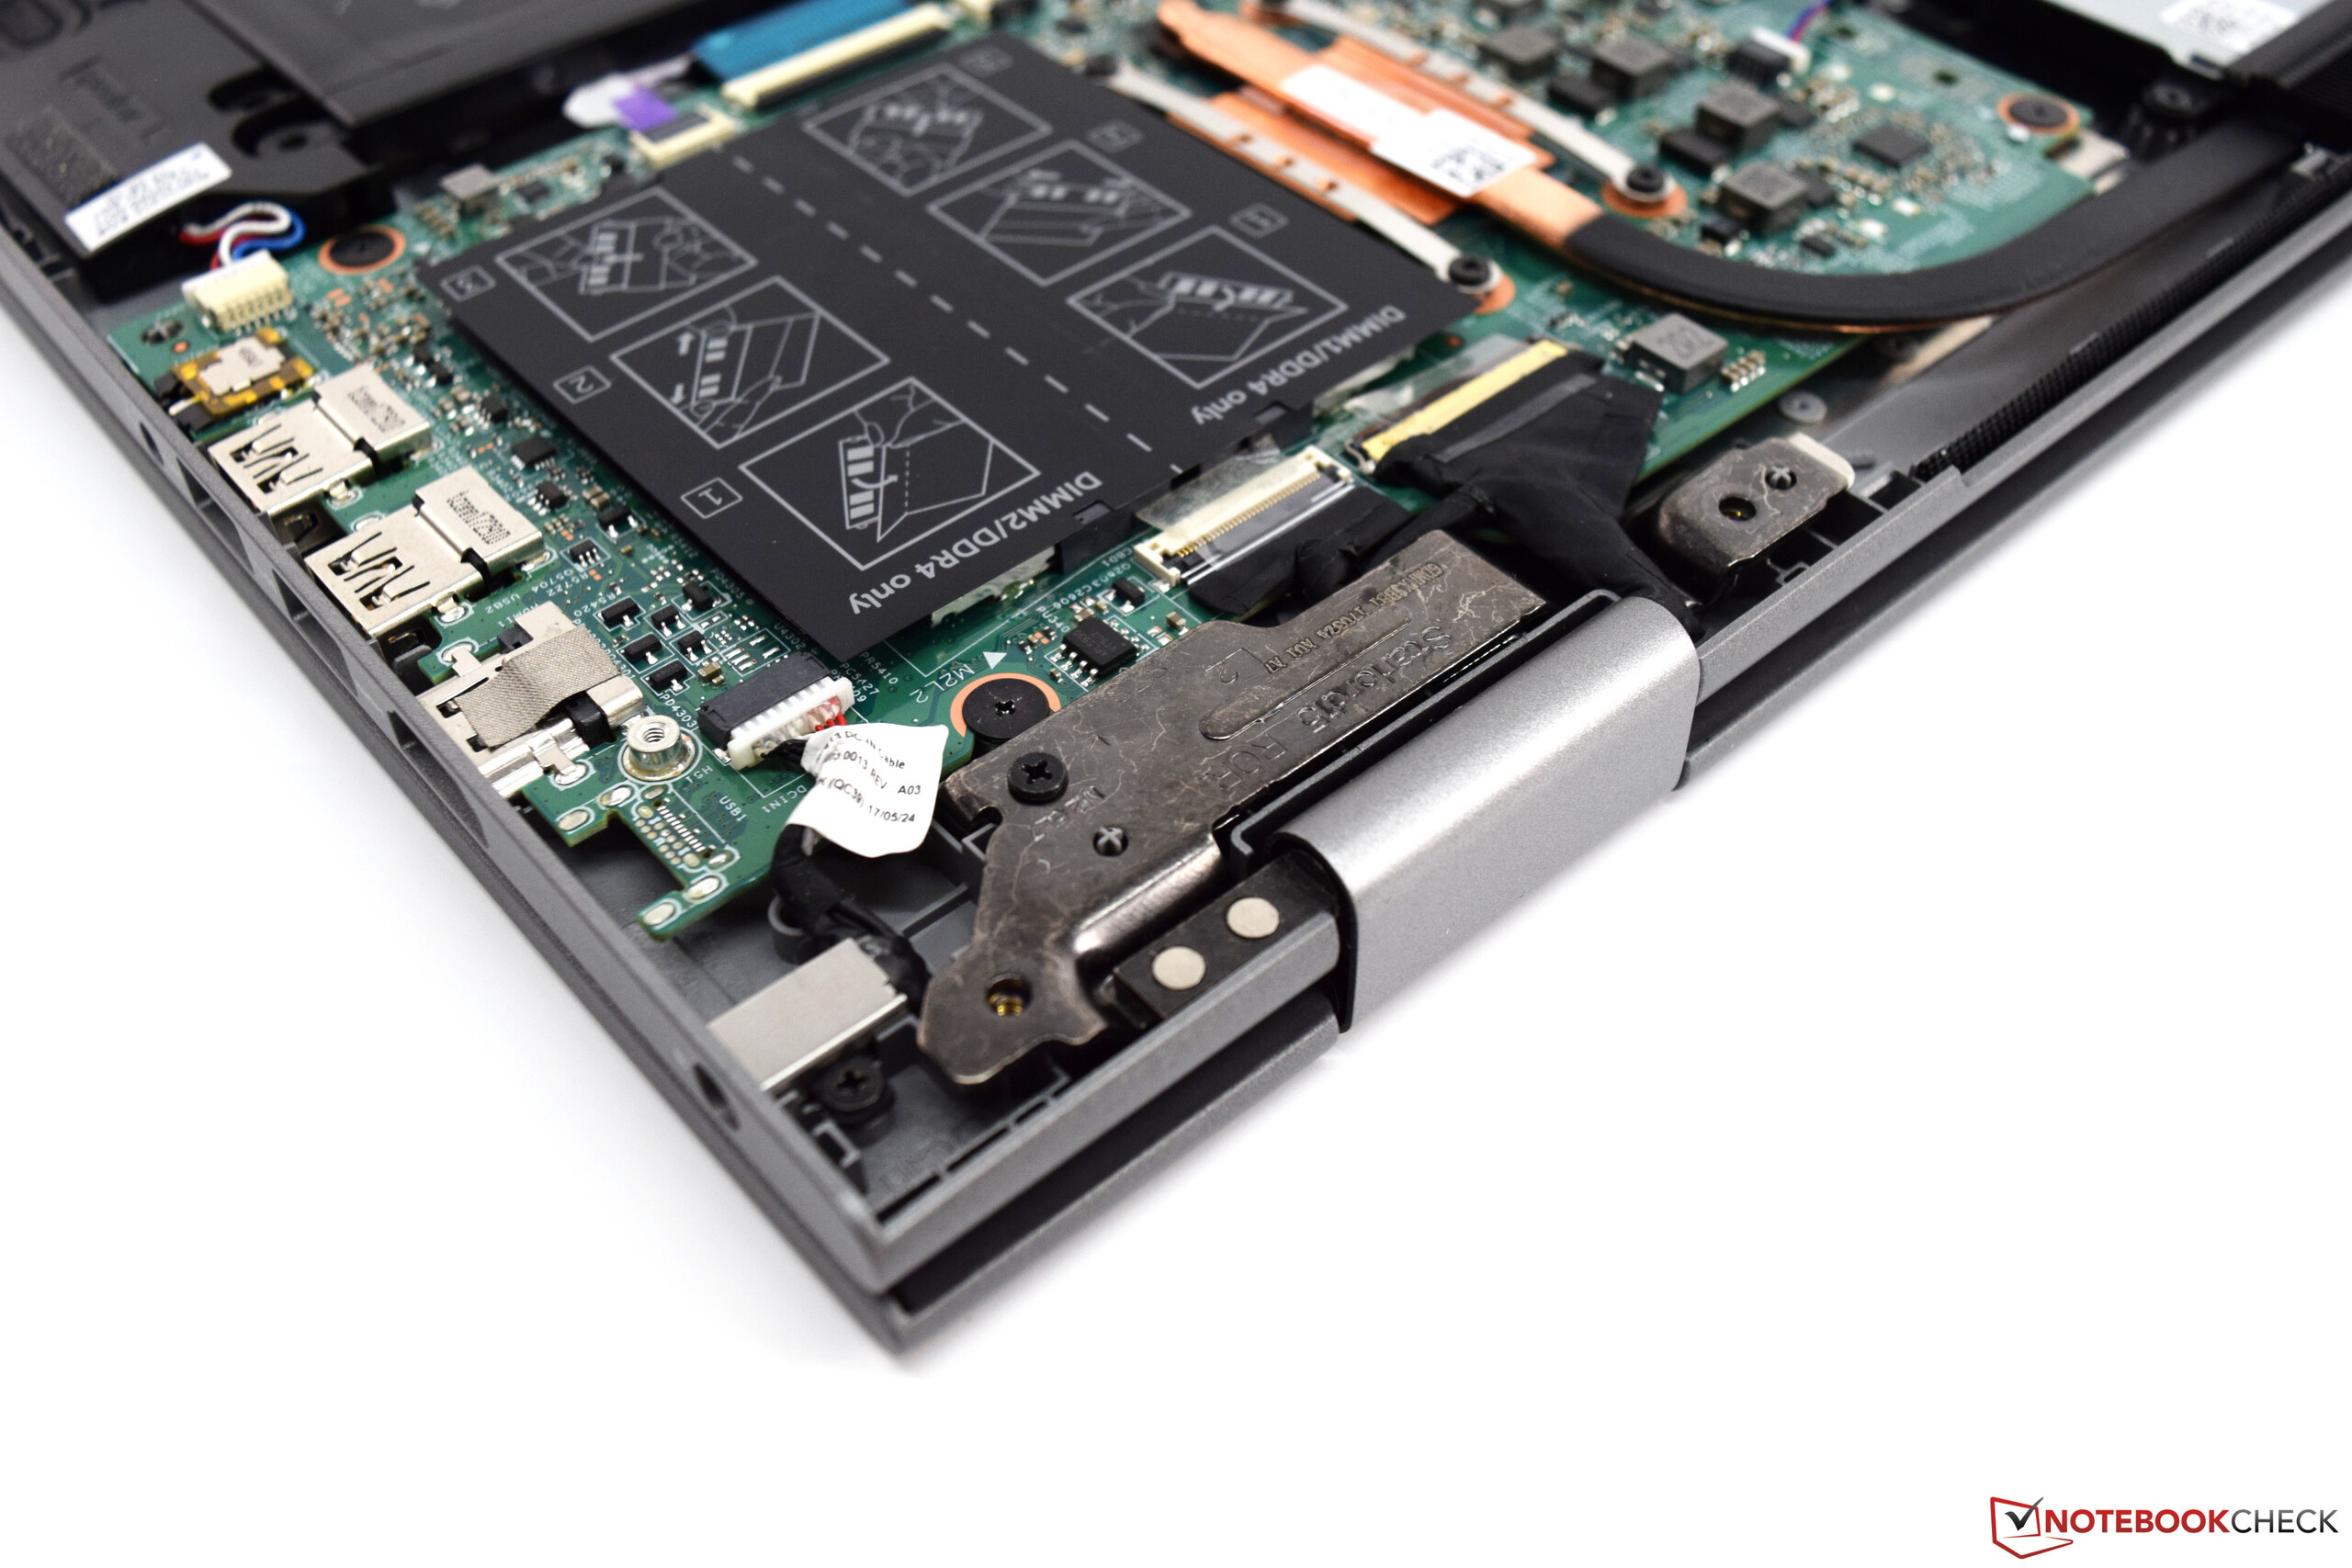
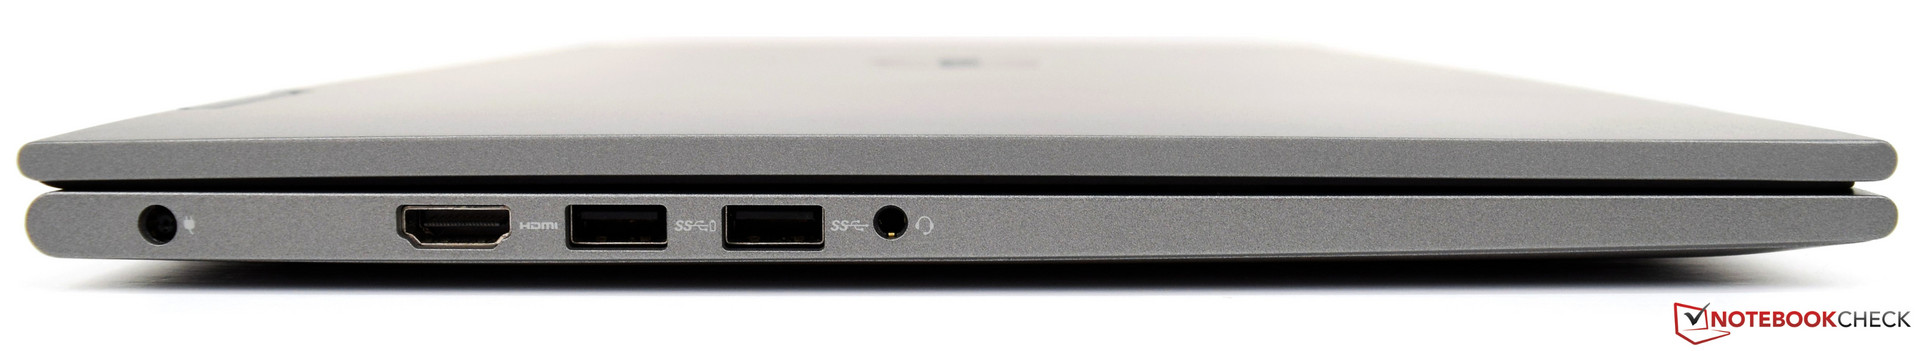
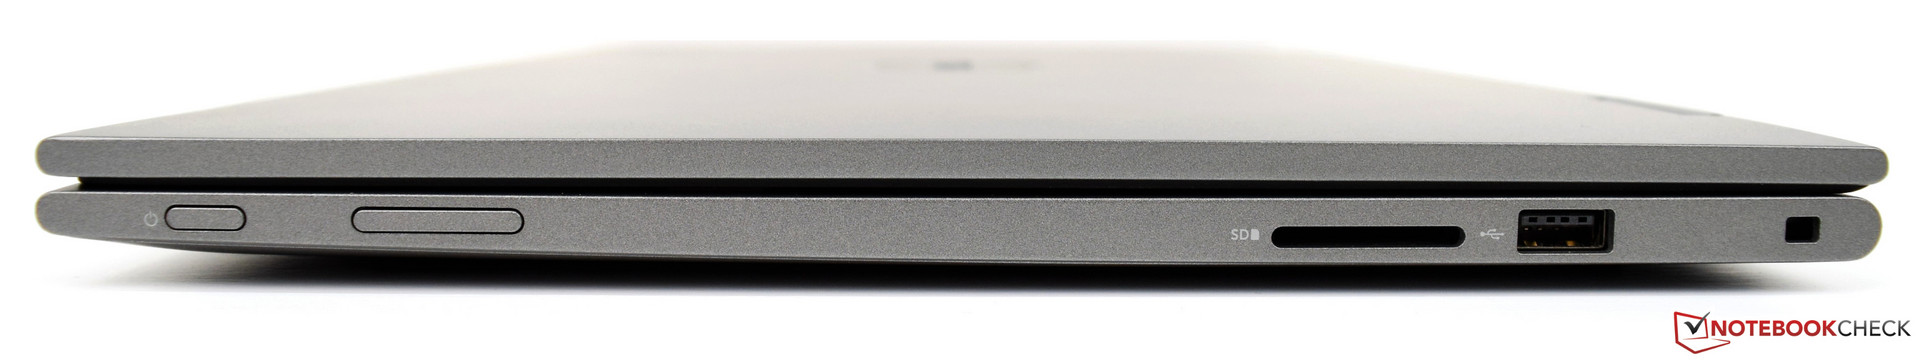
Infelizmente, muitos recursos modernos como USB-C ou DisplayPort ainda estão faltando de forma suspeita. Um leitor de cartão SD está presente, embora conectado via USB 2.0. Gostamos do modo de operação silencioso e da duração da bateria aceitável para o portátil A câmera infravermelha integrada é um ótimo bônus e acelera o acesso ao Windows significativamente.
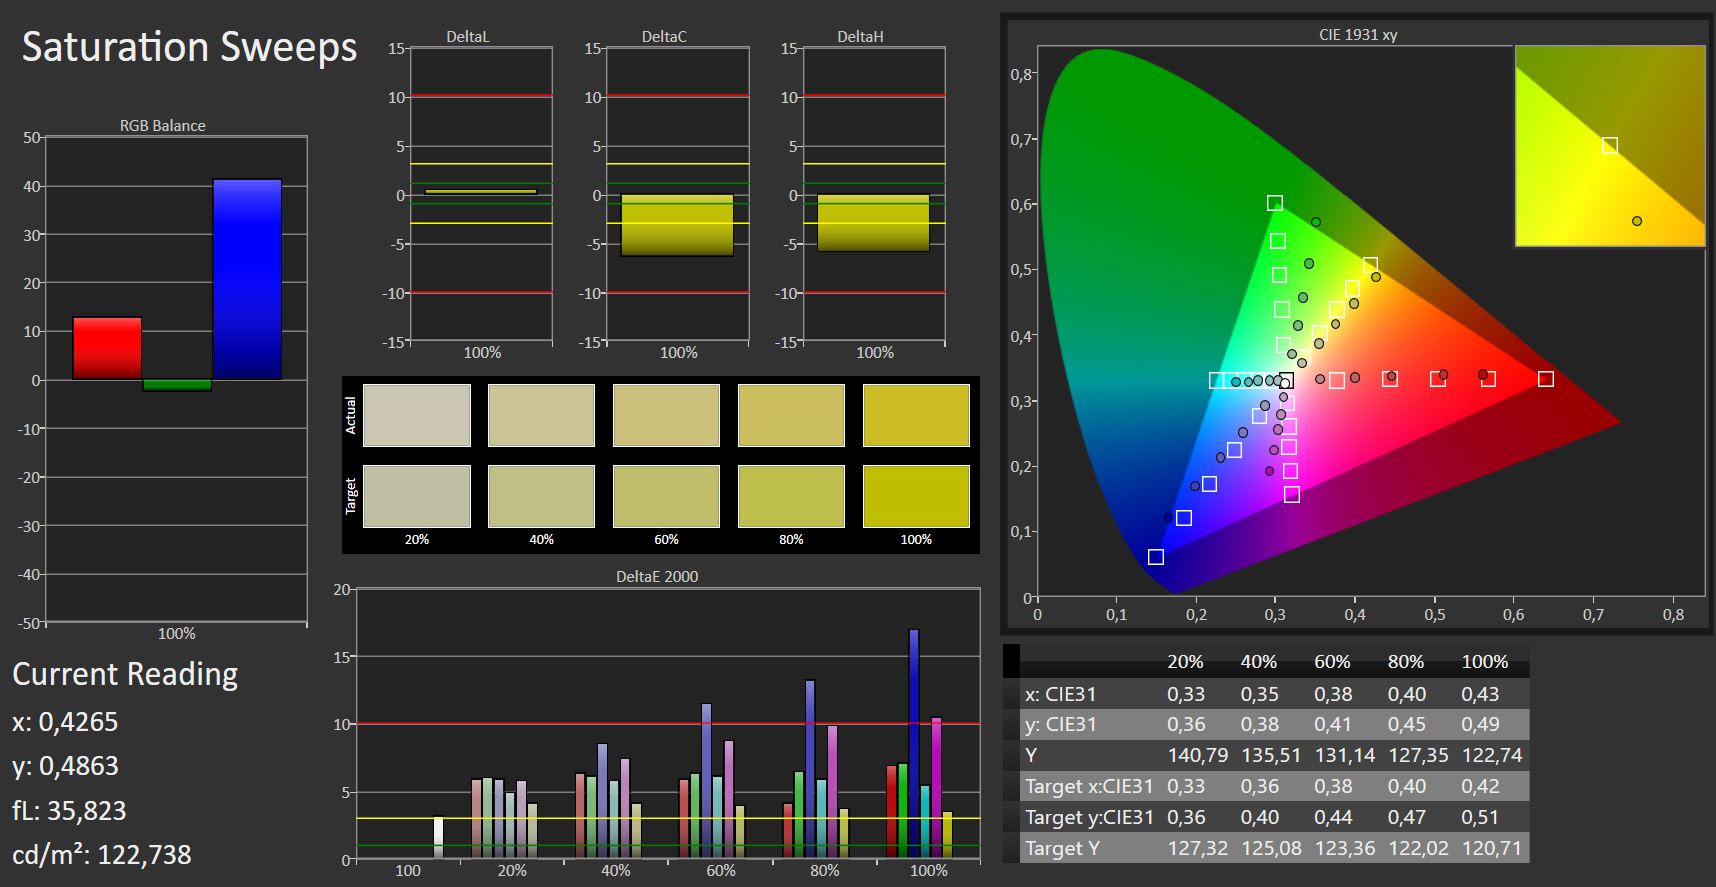
A tela, por outro lado, e um saco misturado: Por um lado, oferece uma relação de contraste muito alta e não recorre ao PWM para controle de brilho. Por outro lado, a cobertura do espaço de cores e o brilho são muito baixos.
Dell Inspiron 15 5579-9672
- 06/09/2018 v6 (old)
Sebastian Bade
Price comparison
