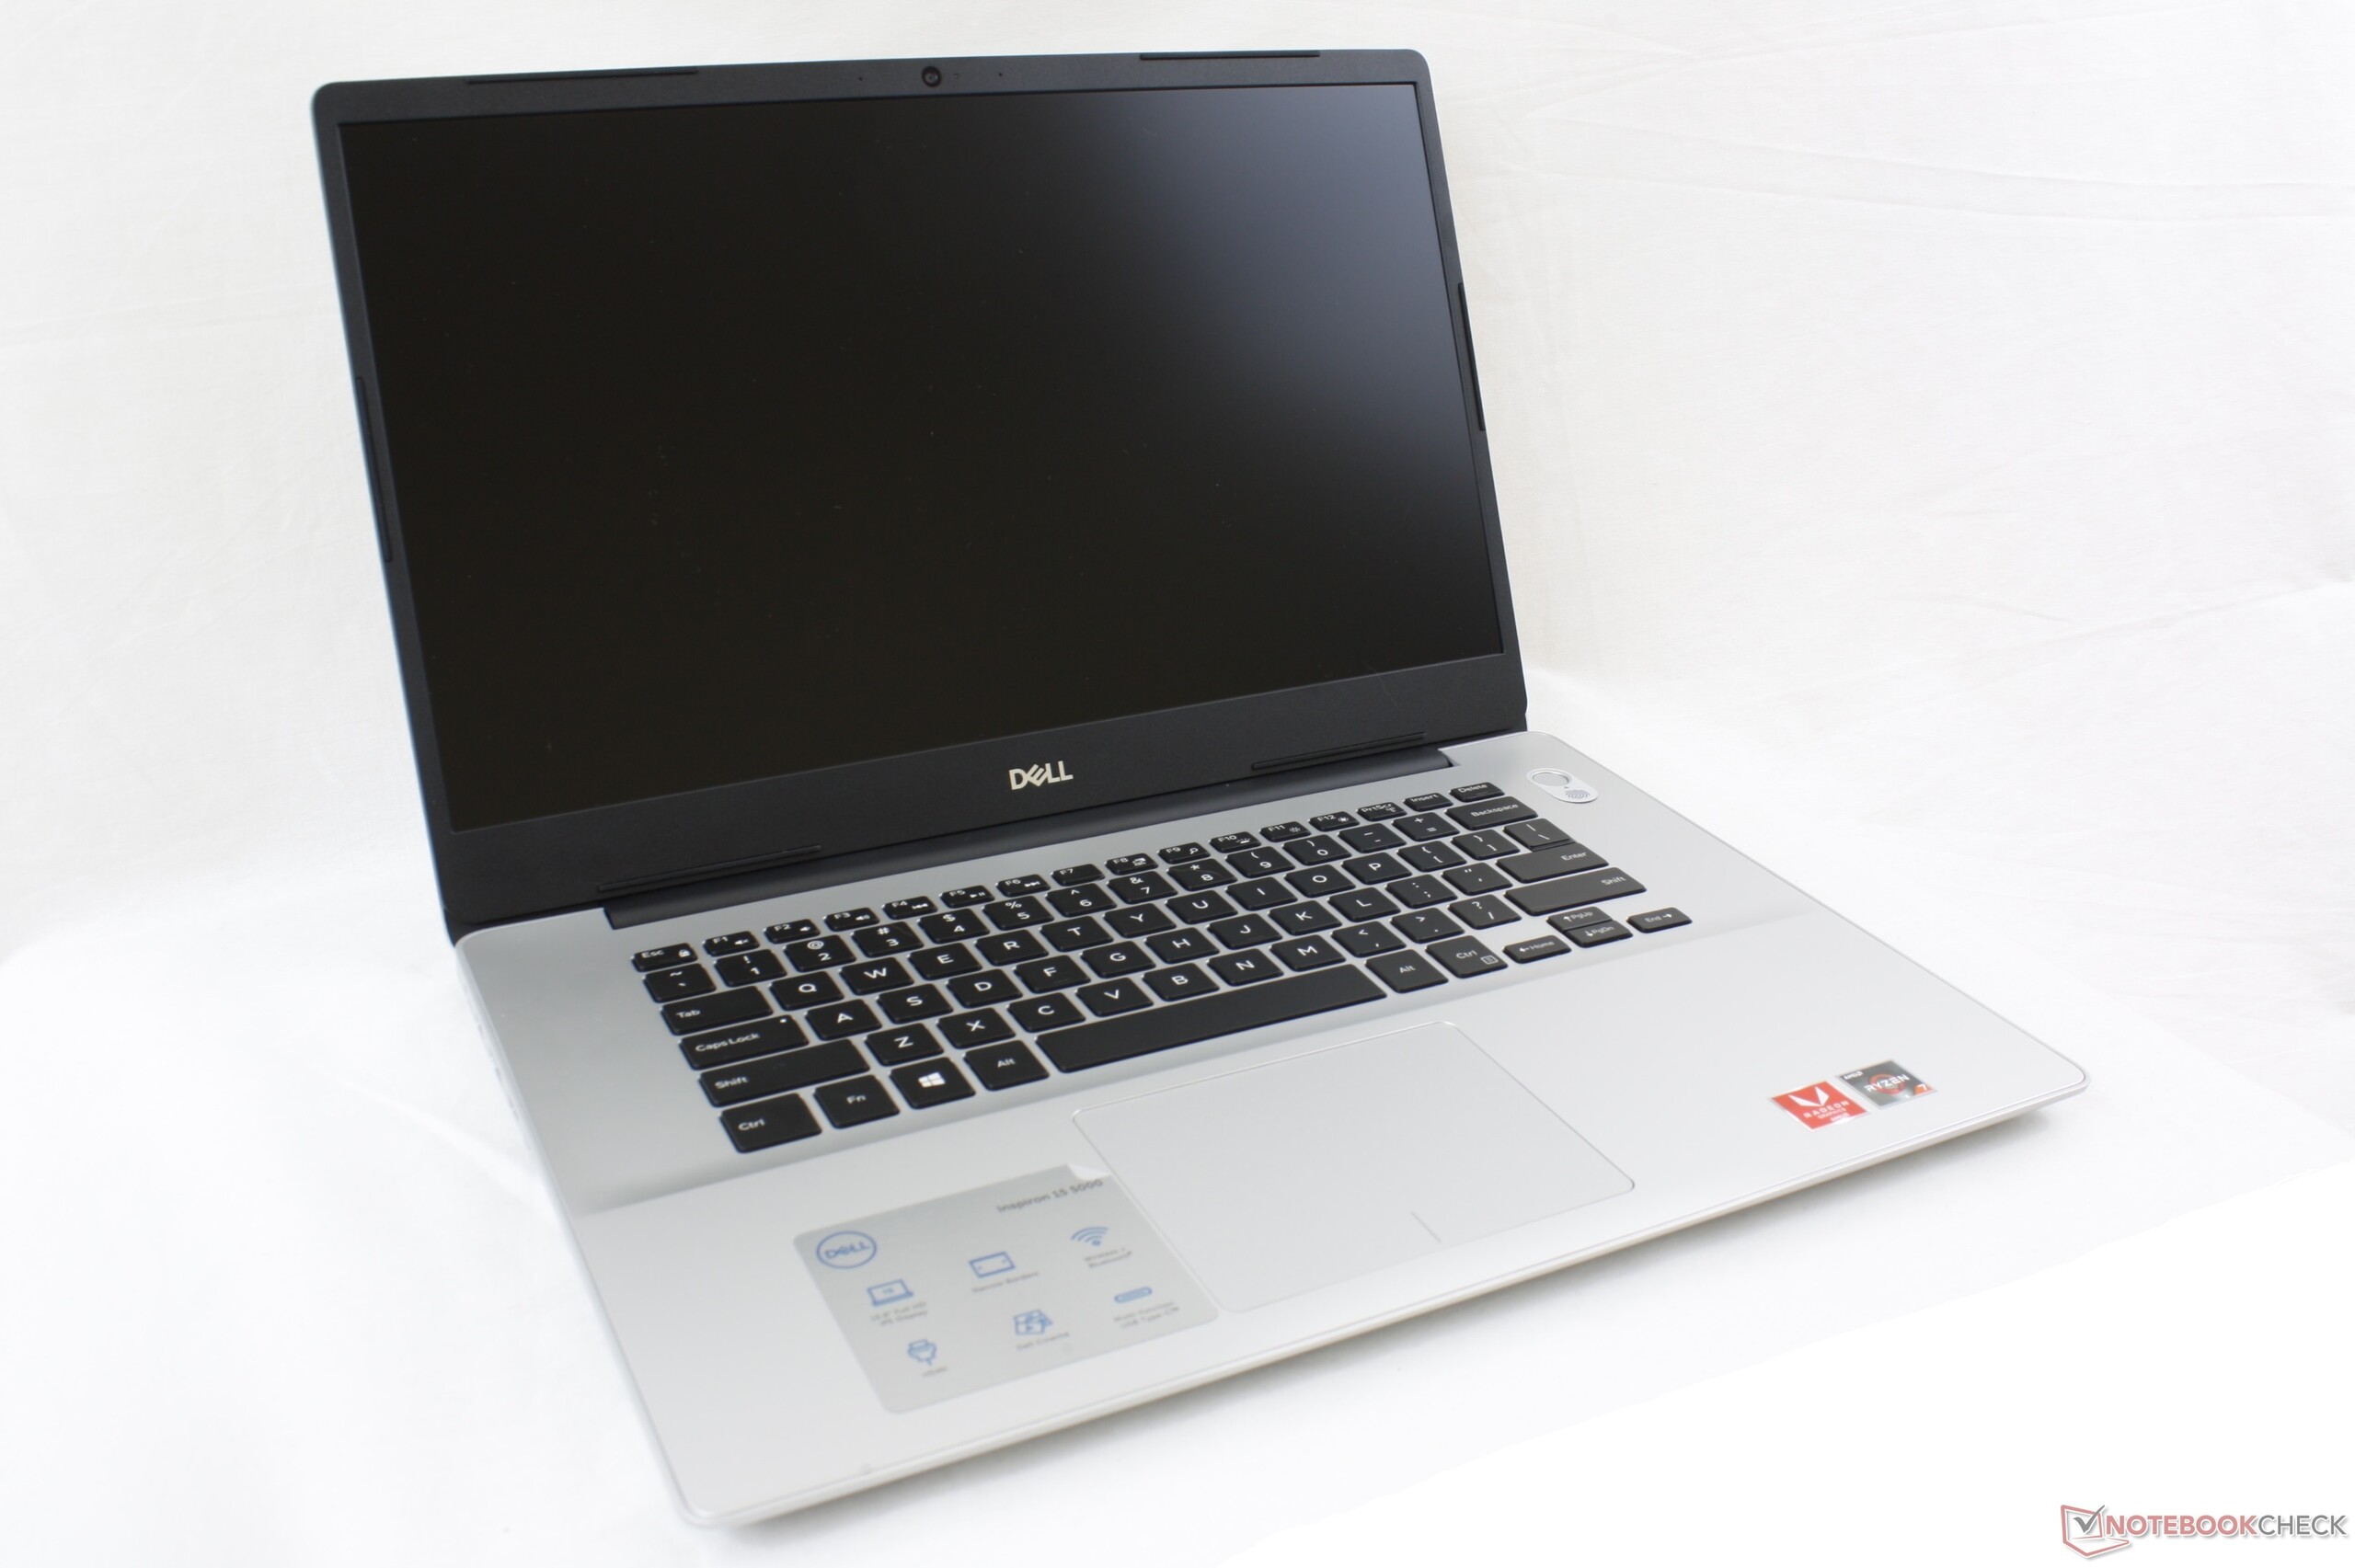
Breve Análise do Portátil Dell Inspiron 15 5000 5585: Uma excelente alternativa à Intel
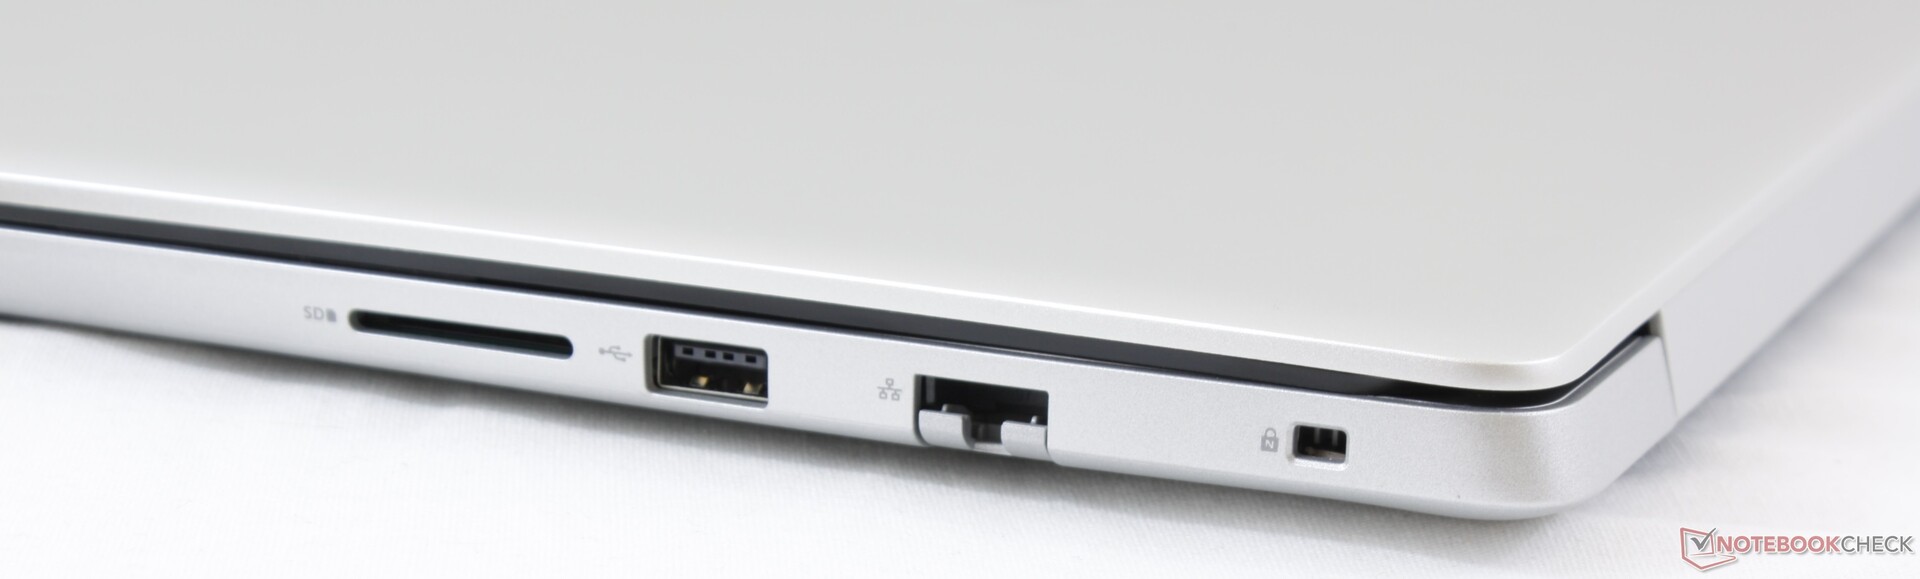
| SD Card Reader | |
| average JPG Copy Test (av. of 3 runs) | |
| Dell XPS 15 9570 Core i9 UHD (Toshiba Exceria Pro SDXC 64 GB UHS-II) | |
| Lenovo Ideapad 330S-15ARR-81FB00C7GE (Toshiba Exceria Pro SDXC 64 GB UHS-II) | |
| Dell Inspiron 15 5000 5585 (Toshiba Exceria Pro SDXC 64 GB UHS-II) | |
| Dell Inspiron 15 3585 (2300U, Vega 6) (Toshiba Exceria Pro SDXC 64 GB UHS-II) | |
| Dell Inspiron 15 5000 5584 (Toshiba Exceria Pro SDXC 64 GB UHS-II) | |
| maximum AS SSD Seq Read Test (1GB) | |
| Dell XPS 15 9570 Core i9 UHD (Toshiba Exceria Pro SDXC 64 GB UHS-II) | |
| Lenovo Ideapad 330S-15ARR-81FB00C7GE (Toshiba Exceria Pro SDXC 64 GB UHS-II) | |
| Dell Inspiron 15 5000 5585 (Toshiba Exceria Pro SDXC 64 GB UHS-II) | |
| Dell Inspiron 15 3585 (2300U, Vega 6) (Toshiba Exceria Pro SDXC 64 GB UHS-II) | |
| Dell Inspiron 15 5000 5584 (Toshiba Exceria Pro SDXC 64 GB UHS-II) | |
| |||||||||||||||||||||||||
iluminação: 84 %
iluminação com acumulador: 179.5 cd/m²
Contraste: 939:1 (Preto: 0.27 cd/m²)
ΔE ColorChecker Calman: 6.05 | ∀{0.5-29.43 Ø4.73}
calibrated: 4.97
ΔE Greyscale Calman: 3.2 | ∀{0.09-98 Ø4.97}
55.6% sRGB (Argyll 1.6.3 3D)
35.5% AdobeRGB 1998 (Argyll 1.6.3 3D)
38.55% AdobeRGB 1998 (Argyll 3D)
56.2% sRGB (Argyll 3D)
37.31% Display P3 (Argyll 3D)
Gamma: 2
CCT: 6820 K
| Dell Inspiron 15 5000 5585 LG Philips 156WFC, IPS, 15.6", 1920x1080 | Dell Inspiron 15 3585 (2300U, Vega 6) BOE0802, TN, 15.6", 1920x1080 | Dell Inspiron 15 5000 5584 AU Optronics AUO22ED, B156HAK, IPS, 15.6", 1920x1080 | Dell XPS 15 9570 Core i9 UHD LQ156D1, IPS, 15.6", 3840x2160 | Asus VivoBook S15 S532F LG Philips LP156WFC-SPD1, IPS, 15.6", 1920x1080 | Lenovo Ideapad 330S-15ARR-81FB00C7GE LG Philips LP156WFC-SPD1, IPS, 15.6", 1920x1080 | |
|---|---|---|---|---|---|---|
| Display | 5% | 5% | 98% | -1% | 2% | |
| Display P3 Coverage (%) | 37.31 | 39.22 5% | 39.17 5% | 79.6 113% | 37.12 -1% | 38.1 2% |
| sRGB Coverage (%) | 56.2 | 58.9 5% | 58.8 5% | 98.4 75% | 55.9 -1% | 57.2 2% |
| AdobeRGB 1998 Coverage (%) | 38.55 | 40.52 5% | 40.48 5% | 79.7 107% | 38.35 -1% | 39.4 2% |
| Response Times | 10% | -40% | -51% | 13% | -4% | |
| Response Time Grey 50% / Grey 80% * (ms) | 28.4 ? | 39 ? -37% | 48.8 ? -72% | 52.4 ? -85% | 24.8 ? 13% | 34 ? -20% |
| Response Time Black / White * (ms) | 27.2 ? | 12 ? 56% | 29.2 ? -7% | 31.6 ? -16% | 24 ? 12% | 24 ? 12% |
| PWM Frequency (Hz) | 250 ? | 1000 ? | ||||
| Screen | -48% | -8% | 22% | -7% | -2% | |
| Brightness middle (cd/m²) | 253.6 | 225 -11% | 227 -10% | 451.9 78% | 262.3 3% | 265 4% |
| Brightness (cd/m²) | 227 | 213 -6% | 230 1% | 414 82% | 250 10% | 242 7% |
| Brightness Distribution (%) | 84 | 88 5% | 92 10% | 81 -4% | 89 6% | 74 -12% |
| Black Level * (cd/m²) | 0.27 | 0.535 -98% | 0.21 22% | 0.36 -33% | 0.43 -59% | 0.215 20% |
| Contrast (:1) | 939 | 421 -55% | 1081 15% | 1255 34% | 610 -35% | 1233 31% |
| Colorchecker dE 2000 * | 6.05 | 10.37 -71% | 6.55 -8% | 5.62 7% | 5.81 4% | 6.16 -2% |
| Colorchecker dE 2000 max. * | 14.03 | 19.75 -41% | 23.45 -67% | 19.1 -36% | 14.7 -5% | 18 -28% |
| Colorchecker dE 2000 calibrated * | 4.97 | 3.89 22% | 4.61 7% | 2.69 46% | 5.36 -8% | 6.18 -24% |
| Greyscale dE 2000 * | 3.2 | 12.09 -278% | 5.2 -63% | 6.9 -116% | 2.8 13% | 3.79 -18% |
| Gamma | 2 110% | 2.72 81% | 2.66 83% | 2.2 100% | 2.15 102% | 2.34 94% |
| CCT | 6820 95% | 13335 49% | 6434 101% | 6254 104% | 7016 93% | 7258 90% |
| Color Space (Percent of AdobeRGB 1998) (%) | 35.5 | 37 4% | 37 4% | 71.8 102% | 35.2 -1% | 36 1% |
| Color Space (Percent of sRGB) (%) | 55.6 | 59 6% | 58.2 5% | 98.5 77% | 55.6 0% | 57 3% |
| Média Total (Programa/Configurações) | -11% /
-31% | -14% /
-9% | 23% /
27% | 2% /
-3% | -1% /
-1% |
* ... menor é melhor
Exibir tempos de resposta
| ↔ Tempo de resposta preto para branco | ||
|---|---|---|
| 27.2 ms ... ascensão ↗ e queda ↘ combinadas | ↗ 16.4 ms ascensão | 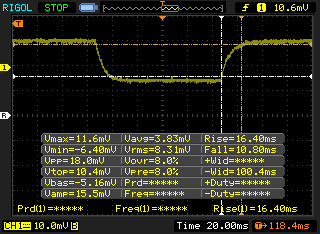 |
| ↘ 10.8 ms queda | ||
| A tela mostra taxas de resposta relativamente lentas em nossos testes e pode ser muito lenta para os jogadores. Em comparação, todos os dispositivos testados variam de 0.1 (mínimo) a 240 (máximo) ms. » 69 % de todos os dispositivos são melhores. Isso significa que o tempo de resposta medido é pior que a média de todos os dispositivos testados (19.9 ms). | ||
| ↔ Tempo de resposta 50% cinza a 80% cinza | ||
| 28.4 ms ... ascensão ↗ e queda ↘ combinadas | ↗ 10.4 ms ascensão | 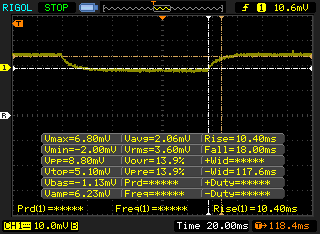 |
| ↘ 18 ms queda | ||
| A tela mostra taxas de resposta relativamente lentas em nossos testes e pode ser muito lenta para os jogadores. Em comparação, todos os dispositivos testados variam de 0.165 (mínimo) a 636 (máximo) ms. » 38 % de todos os dispositivos são melhores. Isso significa que o tempo de resposta medido é semelhante à média de todos os dispositivos testados (31.1 ms). | ||
Cintilação da tela / PWM (modulação por largura de pulso)
| Tela tremeluzindo / PWM não detectado | 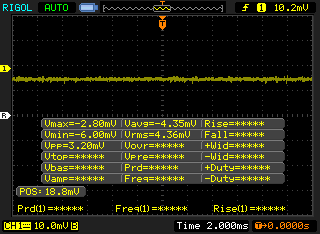 | ||
[pwm_comparison] Em comparação: 52 % de todos os dispositivos testados não usam PWM para escurecer a tela. Se PWM foi detectado, uma média de 7791 (mínimo: 5 - máximo: 343500) Hz foi medida. | |||
| Cinebench R10 | |
| Rendering Multiple CPUs 32Bit | |
| HP Omen 15-dc1020ng | |
| Lenovo Ideapad 330S-15ARR-81FB00C7GE | |
| Média AMD Ryzen 7 3700U (12881 - 18041, n=2) | |
| Rendering Single 32Bit | |
| HP Omen 15-dc1020ng | |
| Média AMD Ryzen 7 3700U (4045 - 4776, n=2) | |
| Lenovo Ideapad 330S-15ARR-81FB00C7GE | |
| PCMark 8 Home Score Accelerated v2 | 3504 pontos | |
| PCMark 8 Work Score Accelerated v2 | 4429 pontos | |
| PCMark 10 Score | 3903 pontos | |
Ajuda | ||
| Dell Inspiron 15 5000 5585 WDC PC SN520 SDAPNUW-512G | Dell Inspiron 15 3585 (2300U, Vega 6) Toshiba BG3 KBG30ZMS256G | Dell Inspiron 15 5000 5584 Toshiba BG3 KBG30ZMS512G | Dell XPS 15 9570 Core i9 UHD Samsung SSD PM981 MZVLB1T0HALR | Asus VivoBook S15 S532F WDC PC SN520 SDAPNUW-256G | Lenovo Ideapad 330S-15ARR-81FB00C7GE WDC PC SN520 SDAPNUW-256G | |
|---|---|---|---|---|---|---|
| AS SSD | -73% | -12% | 77% | 24% | -6% | |
| Seq Read (MB/s) | 398.9 | 1291 224% | 1115 180% | 1320 231% | 1147 188% | 1530 284% |
| Seq Write (MB/s) | 884 | 688 -22% | 841 -5% | 1500 70% | 752 -15% | 1087 23% |
| 4K Read (MB/s) | 34.54 | 21.87 -37% | 46.39 34% | 30.73 -11% | 41.52 20% | 34.7 0% |
| 4K Write (MB/s) | 82.1 | 35.62 -57% | 87.6 7% | 94.4 15% | 149.7 82% | 79.9 -3% |
| 4K-64 Read (MB/s) | 647 | 632 -2% | 904 40% | 1453 125% | 605 -6% | 464.7 -28% |
| 4K-64 Write (MB/s) | 985 | 221.2 -78% | 326.5 -67% | 1815 84% | 453.2 -54% | 326.1 -67% |
| Access Time Read * (ms) | 0.072 | 0.33 -358% | 0.048 33% | 0.061 15% | 0.073 -1% | 0.102 -42% |
| Access Time Write * (ms) | 0.047 | 0.234 -398% | 0.24 -411% | 0.044 6% | 0.025 47% | 0.047 -0% |
| Score Read (Points) | 721 | 783 9% | 1062 47% | 1616 124% | 761 6% | 652 -10% |
| Score Write (Points) | 1155 | 326 -72% | 498 -57% | 2059 78% | 678 -41% | 515 -55% |
| Score Total (Points) | 2279 | 1489 -35% | 2100 -8% | 4507 98% | 1821 -20% | 1489 -35% |
| Copy ISO MB/s (MB/s) | 862 | 432.6 -50% | 1090 26% | 2577 199% | 1093 27% | 690 -20% |
| Copy Program MB/s (MB/s) | 457 | 95.6 -79% | 618 35% | 515 13% | 775 70% | 153.9 -66% |
| Copy Game MB/s (MB/s) | 902 | 263.4 -71% | 750 -17% | 1120 24% | 1196 33% | 339.7 -62% |
* ... menor é melhor

| 3DMark | |
| 1280x720 Cloud Gate Standard Graphics | |
| Dell XPS 15 9570 Core i9 UHD | |
| Asus VivoBook S15 S532F | |
| Dell Inspiron 15 5000 5585 | |
| Asus Zenbook 14 UX433FN-A6023T | |
| Lenovo Ideapad 330S-15ARR-81FB00C7GE | |
| Dell Inspiron 15 3585 (2300U, Vega 6) | |
| Média AMD Radeon RX Vega 10 (9364 - 20784, n=16) | |
| Apple MacBook Pro 13 2018 Touchbar i5 | |
| Acer Aspire 5 A515-51G-509A | |
| Dell Inspiron 15 5000 5584 | |
| 1920x1080 Fire Strike Graphics | |
| Dell XPS 15 9570 Core i9 UHD | |
| Asus VivoBook S15 S532F | |
| Dell Inspiron 15 5000 5585 | |
| Asus Zenbook 14 UX433FN-A6023T | |
| Lenovo Ideapad 330S-15ARR-81FB00C7GE | |
| Acer Aspire 5 A515-51G-509A | |
| Média AMD Radeon RX Vega 10 (1567 - 2999, n=17) | |
| Apple MacBook Pro 13 2018 Touchbar i5 | |
| Dell Inspiron 15 3585 (2300U, Vega 6) | |
| Dell Inspiron 15 5000 5584 | |
| 2560x1440 Time Spy Graphics | |
| Asus VivoBook S15 S532F | |
| Asus Zenbook 14 UX433FN-A6023T | |
| Dell Inspiron 15 5000 5585 | |
| Média AMD Radeon RX Vega 10 (578 - 852, n=7) | |
| Lenovo Ideapad 330S-15ARR-81FB00C7GE | |
| Acer Aspire 5 A515-51G-509A | |
| Apple MacBook Pro 13 2018 Touchbar i5 | |
| Dell Inspiron 15 3585 (2300U, Vega 6) | |
| 3DMark 11 Performance | 4318 pontos | |
| 3DMark Ice Storm Standard Score | 70349 pontos | |
| 3DMark Cloud Gate Standard Score | 11390 pontos | |
| 3DMark Fire Strike Score | 2694 pontos | |
| 3DMark Time Spy Score | 955 pontos | |
Ajuda | ||
| baixo | média | alto | ultra | |
|---|---|---|---|---|
| BioShock Infinite (2013) | 123.7 | 21.3 | ||
| The Witcher 3 (2015) | 53.8 | 18.8 | 11.5 | |
| Rocket League (2017) | 119.7 | 59.9 | 38.9 | |
| Shadow of the Tomb Raider (2018) | 38 | 15 | 13 |
| Dell Inspiron 15 5000 5585 Vega 10, R7 3700U, WDC PC SN520 SDAPNUW-512G | Dell Inspiron 15 3585 (2300U, Vega 6) Vega 6, R3 2300U, Toshiba BG3 KBG30ZMS256G | Dell Inspiron 15 5000 5584 UHD Graphics 620, i7-8565U, Toshiba BG3 KBG30ZMS512G | Dell XPS 15 9570 Core i9 UHD GeForce GTX 1050 Ti Max-Q, i9-8950HK, Samsung SSD PM981 MZVLB1T0HALR | Asus VivoBook S15 S532F GeForce MX250, i7-8565U, WDC PC SN520 SDAPNUW-256G | Lenovo Ideapad 330S-15ARR-81FB00C7GE Vega 8, R5 2500U, WDC PC SN520 SDAPNUW-256G | |
|---|---|---|---|---|---|---|
| Noise | -8% | 4% | -7% | -5% | -5% | |
| desligado / ambiente * (dB) | 28.3 | 30.6 -8% | 28.4 -0% | 28.2 -0% | 28 1% | 30.6 -8% |
| Idle Minimum * (dB) | 28.3 | 30.6 -8% | 28.4 -0% | 28.5 -1% | 28 1% | 30.6 -8% |
| Idle Average * (dB) | 28.3 | 30.6 -8% | 28.4 -0% | 28.6 -1% | 28 1% | 31.3 -11% |
| Idle Maximum * (dB) | 28.3 | 30.6 -8% | 28.4 -0% | 28.8 -2% | 30 -6% | 31.3 -11% |
| Load Average * (dB) | 31.4 | 36.7 -17% | 28.9 8% | 36.2 -15% | 41.4 -32% | 33.2 -6% |
| Witcher 3 ultra * (dB) | 41.4 | 47.6 -15% | 41.5 -0% | |||
| Load Maximum * (dB) | 41.4 | 41.1 1% | 36 13% | 47.6 -15% | 41.5 -0% | 35.2 15% |
* ... menor é melhor
Barulho
| Ocioso |
| 28.3 / 28.3 / 28.3 dB |
| Carga |
| 31.4 / 41.4 dB |
 | ||
30 dB silencioso 40 dB(A) audível 50 dB(A) ruidosamente alto |
||
min: | ||
(±) A temperatura máxima no lado superior é 41 °C / 106 F, em comparação com a média de 36.8 °C / 98 F , variando de 21 a 71 °C para a classe Multimedia.
(-) A parte inferior aquece até um máximo de 47 °C / 117 F, em comparação com a média de 39.1 °C / 102 F
(+) Em uso inativo, a temperatura média para o lado superior é 25.6 °C / 78 F, em comparação com a média do dispositivo de 31.3 °C / ### class_avg_f### F.
(±) Jogando The Witcher 3, a temperatura média para o lado superior é 34.7 °C / 94 F, em comparação com a média do dispositivo de 31.3 °C / ## #class_avg_f### F.
(+) Os apoios para as mãos e o touchpad são mais frios que a temperatura da pele, com um máximo de 28.6 °C / 83.5 F e, portanto, são frios ao toque.
(±) A temperatura média da área do apoio para as mãos de dispositivos semelhantes foi 28.7 °C / 83.7 F (+0.1 °C / 0.2 F).
Dell Inspiron 15 5000 5585 análise de áudio
(±) | o volume do alto-falante é médio, mas bom (###valor### dB)
Graves 100 - 315Hz
(±) | graves reduzidos - em média 12.4% menor que a mediana
(±) | a linearidade dos graves é média (13.1% delta para a frequência anterior)
Médios 400 - 2.000 Hz
(+) | médios equilibrados - apenas 3.5% longe da mediana
(±) | a linearidade dos médios é média (9.6% delta para frequência anterior)
Altos 2 - 16 kHz
(+) | agudos equilibrados - apenas 2.4% longe da mediana
(±) | a linearidade dos máximos é média (11.1% delta para frequência anterior)
Geral 100 - 16.000 Hz
(±) | a linearidade do som geral é média (17.2% diferença em relação à mediana)
Comparado com a mesma classe
» 49% de todos os dispositivos testados nesta classe foram melhores, 7% semelhantes, 44% piores
» O melhor teve um delta de 5%, a média foi 17%, o pior foi 45%
Comparado com todos os dispositivos testados
» 32% de todos os dispositivos testados foram melhores, 8% semelhantes, 60% piores
» O melhor teve um delta de 4%, a média foi 24%, o pior foi 134%
Apple MacBook 12 (Early 2016) 1.1 GHz análise de áudio
(+) | os alto-falantes podem tocar relativamente alto (###valor### dB)
Graves 100 - 315Hz
(±) | graves reduzidos - em média 11.3% menor que a mediana
(±) | a linearidade dos graves é média (14.2% delta para a frequência anterior)
Médios 400 - 2.000 Hz
(+) | médios equilibrados - apenas 2.4% longe da mediana
(+) | médios são lineares (5.5% delta para frequência anterior)
Altos 2 - 16 kHz
(+) | agudos equilibrados - apenas 2% longe da mediana
(+) | os máximos são lineares (4.5% delta da frequência anterior)
Geral 100 - 16.000 Hz
(+) | o som geral é linear (10.2% diferença em relação à mediana)
Comparado com a mesma classe
» 7% de todos os dispositivos testados nesta classe foram melhores, 2% semelhantes, 91% piores
» O melhor teve um delta de 5%, a média foi 18%, o pior foi 53%
Comparado com todos os dispositivos testados
» 5% de todos os dispositivos testados foram melhores, 1% semelhantes, 94% piores
» O melhor teve um delta de 4%, a média foi 24%, o pior foi 134%
| desligado | |
| Ocioso | |
| Carga |
|
Key:
min: | |
| Dell Inspiron 15 5000 5585 R7 3700U, Vega 10, WDC PC SN520 SDAPNUW-512G, IPS, 1920x1080, 15.6" | Dell Inspiron 15 3585 (2300U, Vega 6) R3 2300U, Vega 6, Toshiba BG3 KBG30ZMS256G, TN, 1920x1080, 15.6" | Dell Inspiron 15 5000 5584 i7-8565U, UHD Graphics 620, Toshiba BG3 KBG30ZMS512G, IPS, 1920x1080, 15.6" | Dell XPS 15 9570 Core i9 UHD i9-8950HK, GeForce GTX 1050 Ti Max-Q, Samsung SSD PM981 MZVLB1T0HALR, IPS, 3840x2160, 15.6" | Asus VivoBook S15 S532F i7-8565U, GeForce MX250, WDC PC SN520 SDAPNUW-256G, IPS, 1920x1080, 15.6" | Lenovo Ideapad 330S-15ARR-81FB00C7GE R5 2500U, Vega 8, WDC PC SN520 SDAPNUW-256G, IPS, 1920x1080, 15.6" | |
|---|---|---|---|---|---|---|
| Power Consumption | -26% | -5% | -138% | -64% | -15% | |
| Idle Minimum * (Watt) | 4.2 | 6.3 -50% | 3.6 14% | 7.1 -69% | 6 -43% | 5.2 -24% |
| Idle Average * (Watt) | 6.8 | 9.2 -35% | 7.4 -9% | 13.6 -100% | 10.3 -51% | 8.3 -22% |
| Idle Maximum * (Watt) | 7 | 9.6 -37% | 8.3 -19% | 14.1 -101% | 10.5 -50% | 8.2 -17% |
| Load Average * (Watt) | 36.5 | 38 -4% | 38 -4% | 103.9 -185% | 69.1 -89% | 38 -4% |
| Witcher 3 ultra * (Watt) | 37.9 | 103 -172% | 57.8 -53% | |||
| Load Maximum * (Watt) | 44 | 46 -5% | 47.9 -9% | 130.9 -198% | 88 -100% | 46.6 -6% |
* ... menor é melhor
| Dell Inspiron 15 5000 5585 R7 3700U, Vega 10, 42 Wh | Dell Inspiron 15 3585 (2300U, Vega 6) R3 2300U, Vega 6, 42 Wh | Dell Inspiron 15 5000 5584 i7-8565U, UHD Graphics 620, 42 Wh | Dell XPS 15 9570 Core i9 UHD i9-8950HK, GeForce GTX 1050 Ti Max-Q, 97 Wh | Asus VivoBook S15 S532F i7-8565U, GeForce MX250, 42 Wh | Lenovo Ideapad 330S-15ARR-81FB00C7GE R5 2500U, Vega 8, 30 Wh | |
|---|---|---|---|---|---|---|
| Duração da bateria | -15% | -17% | -0% | -17% | -28% | |
| Reader / Idle (h) | 14.3 | 7.3 -49% | 15.3 7% | 15 5% | 10.9 -24% | 7.3 -49% |
| WiFi v1.3 (h) | 7 | 5.3 -24% | 3.5 -50% | 8.6 23% | 5.1 -27% | 4.1 -41% |
| Load (h) | 1.4 | 1.8 29% | 1.3 -7% | 1 -29% | 1.4 0% | 1.5 7% |
Pro
Contra
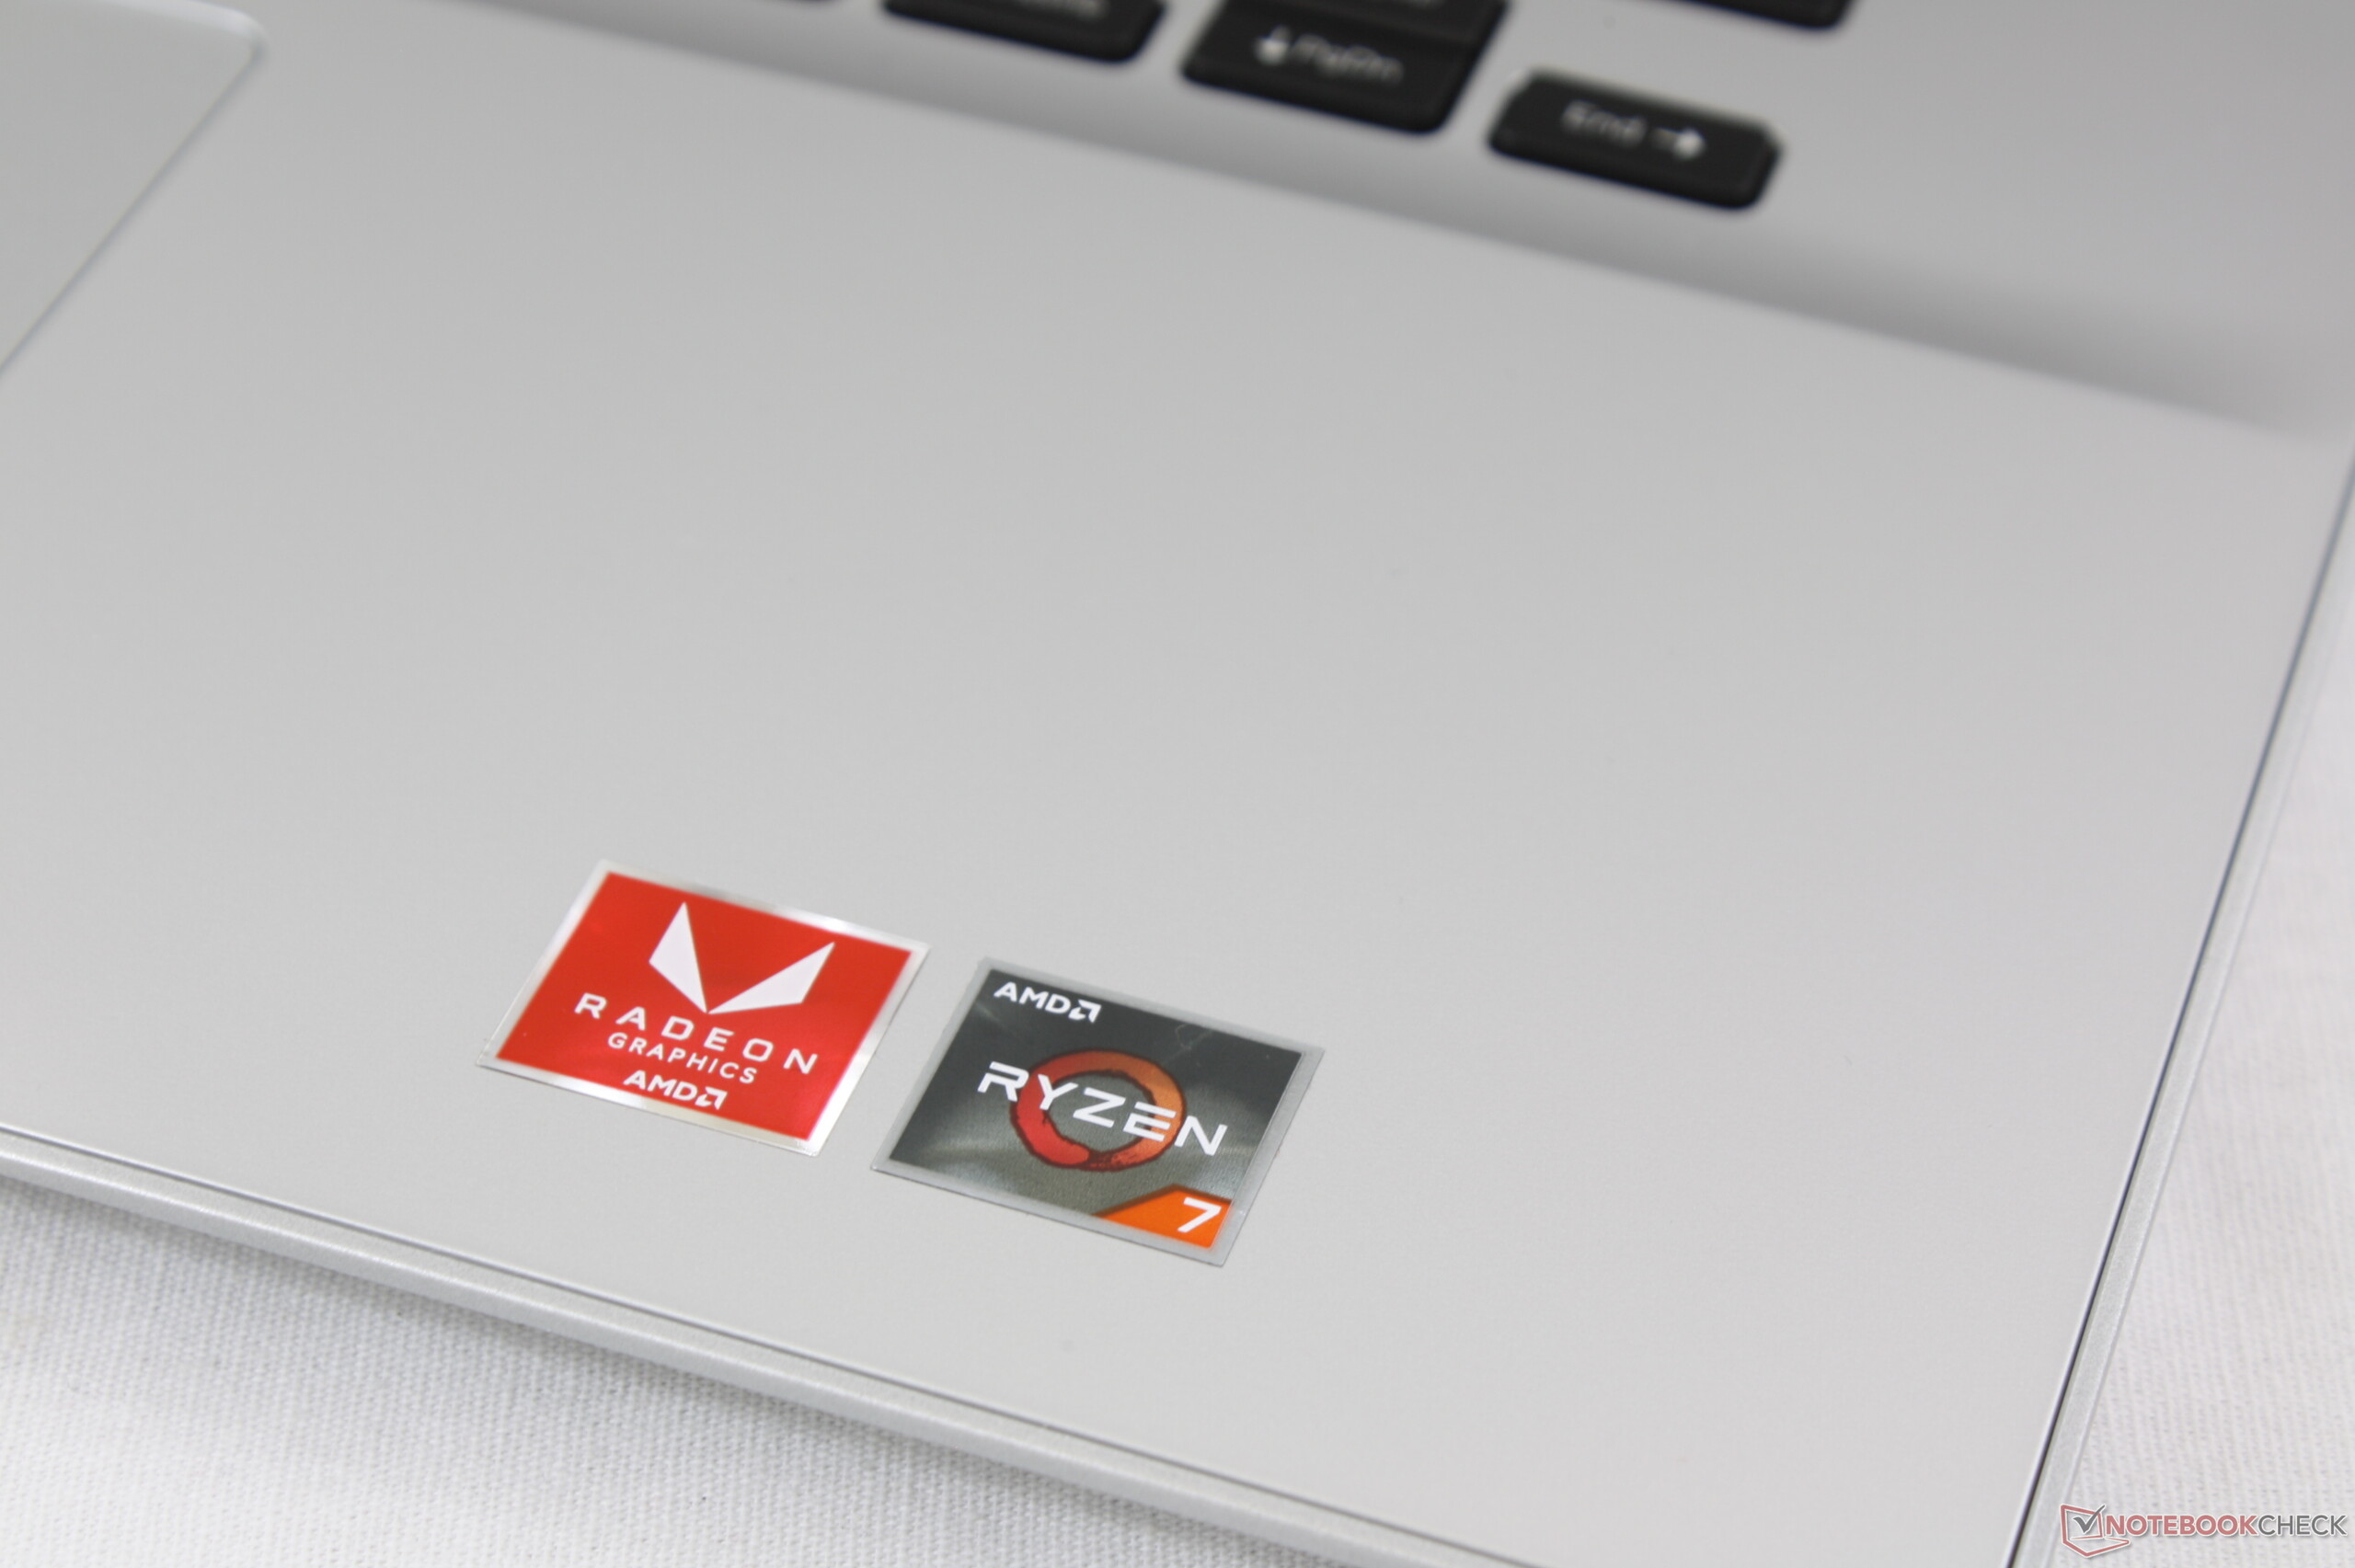
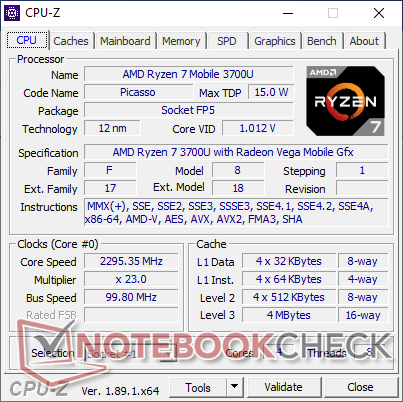
Não estávamos esperando muito de um Inspiron ao entrar nesta análise, mas estamos agradavelmente surpresos com o desempenho do sistema. O processador AMD, em particular, oferece desempenho de CPU similar ao do Core i7-8565U, além de ser significativamente mais rápido no desempenho da GPU. Jogadores casuais que gostam de jogar um ou dois jogos de Rocket League ou LoL entre aulas, descobrirão que o AMD Inspiron é muito mais poderoso para as suas necessidades quando comparado ao mais caro XPS 13 ou HP Spectre x360 13.
Infelizmente, o impressionante processador está dentro de um chassi não tão impressionante. Este é um portátil econômico, afinal, o que significa que a tela é relativamente fraca, as cores são superficiais e os plásticos são tudo menos luxuosos. A duração da bateria é mais longa do que no Intel Inspiron 15 5584 e a resposta do teclado é realmente muito boa, o qual temos certeza que o público-alvo consciente do orçamento apreciará. Se a Dell lança um sucessor eventual, acreditamos que o Inspiron poderia ser melhorado incorporando uma tela mais brilhante e fazendo o salto completo para o carregamento universal USB Tipo-C.
Uma CPU AMD digna de um XPS, mas preso em um Inspiron. Em outras palavras, você está obtendo o desempenho de Ultrabook carro-chefe com desempenho gráfico integrado surpreendentemente decente em um chassi de baixo custo.
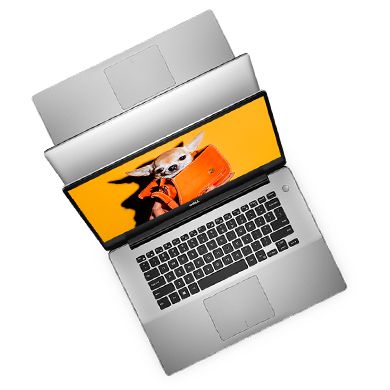
Dell Inspiron 15 5000 5585
- 08/08/2019 v6 (old)
Allen Ngo
Price comparison
