Breve Análise do Conversível Dell Latitude 5289 (i5, 256GB, 8GB)
| Networking | |
| iperf3 transmit AX12 | |
| Lenovo ThinkPad Yoga 370-20JJS00100 | |
| Dell Latitude 5289 | |
| HP EliteBook x360 1030 G2 | |
| iperf3 receive AX12 | |
| Lenovo ThinkPad Yoga 370-20JJS00100 | |
| HP EliteBook x360 1030 G2 | |
| Dell Latitude 5289 | |
| |||||||||||||||||||||||||
iluminação: 90 %
iluminação com acumulador: 336 cd/m²
Contraste: 988:1 (Preto: 0.34 cd/m²)
ΔE ColorChecker Calman: 3.45 | ∀{0.5-29.43 Ø4.71}
ΔE Greyscale Calman: 1.68 | ∀{0.09-98 Ø4.96}
64% sRGB (Argyll 1.6.3 3D)
41% AdobeRGB 1998 (Argyll 1.6.3 3D)
44.21% AdobeRGB 1998 (Argyll 3D)
64.3% sRGB (Argyll 3D)
42.79% Display P3 (Argyll 3D)
Gamma: 2.49
CCT: 6782 K
| Dell Latitude 5289 BOE NV12N51, , 1920x1080, 12.5" | Lenovo ThinkPad Yoga 370-20JJS00100 Sharp LQ133M1JX15, , 1920x1080, 13.3" | HP EliteBook x360 1030 G2 CMN1374, , 1920x1080, 13.3" | Dell XPS 13-9365 2-in-1 1920x1080, 13.3" | HP Spectre x360 13-w023dx Chi Mei CMN1367, , 1920x1080, 13.3" | Lenovo Yoga 910-13IKB-80VF004CGE AU Optronics AUO323D / B139HAN03.2, , 3840x2160, 13.9" | |
|---|---|---|---|---|---|---|
| Display | 56% | 46% | 11% | 48% | 43% | |
| Display P3 Coverage (%) | 42.79 | 67.9 59% | 65.5 53% | 47.32 11% | 65.4 53% | 62.2 45% |
| sRGB Coverage (%) | 64.3 | 97.3 51% | 88.8 38% | 71.1 11% | 90.4 41% | 90.1 40% |
| AdobeRGB 1998 Coverage (%) | 44.21 | 69.9 58% | 64.9 47% | 48.83 10% | 65.8 49% | 63.5 44% |
| Response Times | -3% | -10% | -10% | 16% | 7% | |
| Response Time Grey 50% / Grey 80% * (ms) | 42 ? | 42 ? -0% | 55.2 ? -31% | 48 ? -14% | 33.2 ? 21% | 46 ? -10% |
| Response Time Black / White * (ms) | 31 ? | 32.8 ? -6% | 27.2 ? 12% | 32.8 ? -6% | 28 ? 10% | 24 ? 23% |
| PWM Frequency (Hz) | 531 ? | 217.4 ? | 1042 ? | |||
| Screen | -20% | -28% | -41% | -40% | -45% | |
| Brightness middle (cd/m²) | 336 | 374 11% | 262 -22% | 322.6 -4% | 334.6 0% | 348 4% |
| Brightness (cd/m²) | 320 | 356 11% | 256 -20% | 306 -4% | 319 0% | 310 -3% |
| Brightness Distribution (%) | 90 | 87 -3% | 83 -8% | 91 1% | 90 0% | 80 -11% |
| Black Level * (cd/m²) | 0.34 | 0.33 3% | 0.25 26% | 0.19 44% | 0.336 1% | 0.25 26% |
| Contrast (:1) | 988 | 1133 15% | 1048 6% | 1698 72% | 996 1% | 1392 41% |
| Colorchecker dE 2000 * | 3.45 | 4.7 -36% | 5.13 -49% | 7.7 -123% | 6.21 -80% | 7.86 -128% |
| Colorchecker dE 2000 max. * | 7.95 | 9.5 -19% | 9.46 -19% | 11.1 -40% | 12 -51% | 13.43 -69% |
| Greyscale dE 2000 * | 1.68 | 6.5 -287% | 6.23 -271% | 7.9 -370% | 7.71 -359% | 8.25 -391% |
| Gamma | 2.49 88% | 2.19 100% | 2.45 90% | 2.88 76% | 2.36 93% | 2.05 107% |
| CCT | 6782 96% | 7086 92% | 6413 101% | 7044 92% | 6458 101% | 6834 95% |
| Color Space (Percent of AdobeRGB 1998) (%) | 41 | 63.1 54% | 57.84 41% | 44.1 8% | 58.6 43% | 58 41% |
| Color Space (Percent of sRGB) (%) | 64 | 97.2 52% | 88.57 38% | 69.9 9% | 90 41% | 90 41% |
| Média Total (Programa/Configurações) | 11% /
-2% | 3% /
-11% | -13% /
-26% | 8% /
-15% | 2% /
-20% |
* ... menor é melhor
Exibir tempos de resposta
| ↔ Tempo de resposta preto para branco | ||
|---|---|---|
| 31 ms ... ascensão ↗ e queda ↘ combinadas | ↗ 18 ms ascensão | 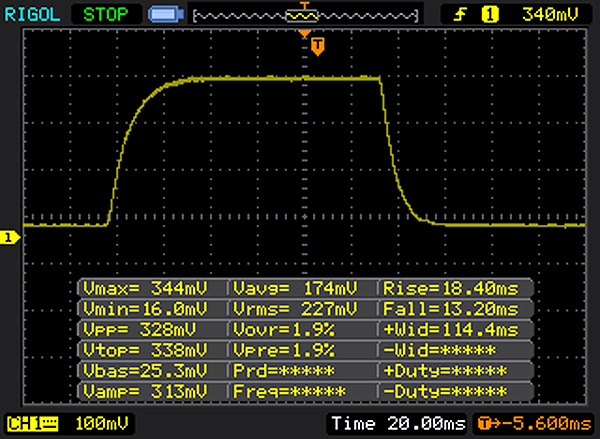 |
| ↘ 13 ms queda | ||
| A tela mostra taxas de resposta lentas em nossos testes e será insatisfatória para os jogadores. Em comparação, todos os dispositivos testados variam de 0.1 (mínimo) a 240 (máximo) ms. » 84 % de todos os dispositivos são melhores. Isso significa que o tempo de resposta medido é pior que a média de todos os dispositivos testados (19.8 ms). | ||
| ↔ Tempo de resposta 50% cinza a 80% cinza | ||
| 42 ms ... ascensão ↗ e queda ↘ combinadas | ↗ 22 ms ascensão | 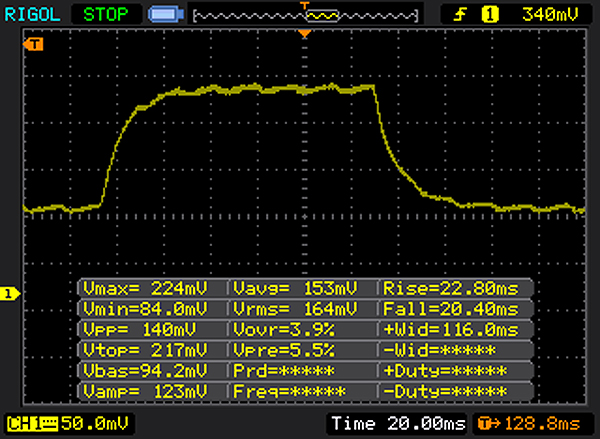 |
| ↘ 20 ms queda | ||
| A tela mostra taxas de resposta lentas em nossos testes e será insatisfatória para os jogadores. Em comparação, todos os dispositivos testados variam de 0.165 (mínimo) a 636 (máximo) ms. » 67 % de todos os dispositivos são melhores. Isso significa que o tempo de resposta medido é pior que a média de todos os dispositivos testados (30.9 ms). | ||
Cintilação da tela / PWM (modulação por largura de pulso)
| Tela tremeluzindo/PWM detectado | 531 Hz | ≤ 90 % configuração de brilho | 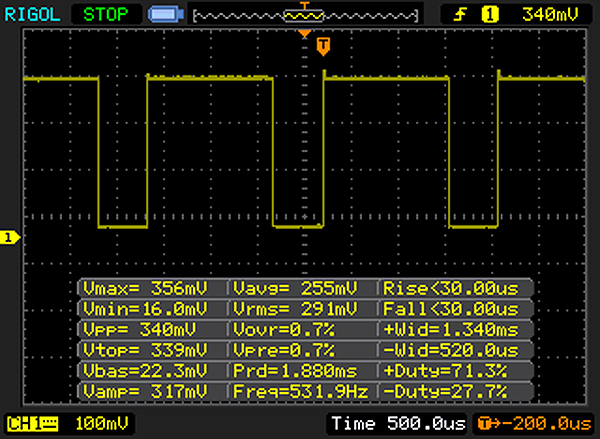 |
A luz de fundo da tela pisca em 531 Hz (pior caso, por exemplo, utilizando PWM) Cintilação detectada em uma configuração de brilho de 90 % e abaixo. Não deve haver cintilação ou PWM acima desta configuração de brilho. A frequência de 531 Hz é bastante alta, então a maioria dos usuários sensíveis ao PWM não deve notar nenhuma oscilação. [pwm_comparison] Em comparação: 52 % de todos os dispositivos testados não usam PWM para escurecer a tela. Se PWM foi detectado, uma média de 7748 (mínimo: 5 - máximo: 343500) Hz foi medida. | |||
| PCMark 8 Home Score Accelerated v2 | 3554 pontos | |
| PCMark 8 Work Score Accelerated v2 | 4681 pontos | |
Ajuda | ||
| Dell Latitude 5289 SanDisk X400 256GB, SATA (SD8SB8U-256G) | Lenovo ThinkPad Yoga 370-20JJS00100 Toshiba NVMe THNSF5512GPUK | HP EliteBook x360 1030 G2 Sandisk SD8TN8U-256G-1006 | Dell XPS 13-9365 2-in-1 Toshiba NVMe THNSN5256GPUK | HP Spectre x360 13-w023dx Samsung PM951 NVMe MZVLV512 | Lenovo Yoga 910-13IKB-80VF004CGE Samsung PM951 NVMe MZVLV512 | |
|---|---|---|---|---|---|---|
| CrystalDiskMark 3.0 | 128% | 33% | 130% | 154% | 179% | |
| Read Seq (MB/s) | 423.7 | 1070 153% | 467.1 10% | 1206 185% | 1376 225% | 1412 233% |
| Write Seq (MB/s) | 406.4 | 484.5 19% | 443.6 9% | 629 55% | 571 41% | 578 42% |
| Read 512 (MB/s) | 260.8 | 680 161% | 312.3 20% | 966 270% | 679 160% | 701 169% |
| Write 512 (MB/s) | 255.6 | 483.1 89% | 372.5 46% | 410.7 61% | 571 123% | 580 127% |
| Read 4k (MB/s) | 22.73 | 30.55 34% | 29.43 29% | 32.93 45% | 42.66 88% | 43.5 91% |
| Write 4k (MB/s) | 27.92 | 127.3 356% | 56.5 102% | 121.2 334% | 137.9 394% | 159.7 472% |
| Read 4k QD32 (MB/s) | 306.2 | 460.8 50% | 311.3 2% | 411 34% | 535 75% | 570 86% |
| Write 4k QD32 (MB/s) | 158.8 | 414.5 161% | 225.2 42% | 250.2 58% | 361.2 127% | 488.7 208% |

| 3DMark 11 - 1280x720 Performance GPU | |
| Dell Latitude 5289 | |
| Lenovo Yoga 910-13IKB-80VF004CGE | |
| HP Spectre x360 13-w023dx | |
| HP EliteBook x360 1030 G2 | |
| Dell XPS 13-9365 2-in-1 | |
| Lenovo ThinkPad Yoga 370-20JJS00100 | |
| 3DMark 11 Performance | 1787 pontos | |
| 3DMark Cloud Gate Standard Score | 6359 pontos | |
| 3DMark Fire Strike Score | 931 pontos | |
Ajuda | ||
| baixo | média | alto | ultra | |
|---|---|---|---|---|
| BioShock Infinite (2013) | 53.6 | 32.6 | 27.7 | 8.6 |
| Company of Heroes 2 (2013) | 22.6 | |||
| Rise of the Tomb Raider (2016) | 20.8 |
Barulho
| Ocioso |
| 30.5 / 30.5 / 30.5 dB |
| Carga |
| 36 / 34.6 dB |
 | ||
30 dB silencioso 40 dB(A) audível 50 dB(A) ruidosamente alto |
||
min: | ||
(-) A temperatura máxima no lado superior é 49 °C / 120 F, em comparação com a média de 35.4 °C / 96 F , variando de 19.6 a 60 °C para a classe Convertible.
(±) A parte inferior aquece até um máximo de 44.4 °C / 112 F, em comparação com a média de 36.9 °C / 98 F
(+) Em uso inativo, a temperatura média para o lado superior é 26.4 °C / 80 F, em comparação com a média do dispositivo de 30.3 °C / ### class_avg_f### F.
(+) Os apoios para as mãos e o touchpad são mais frios que a temperatura da pele, com um máximo de 30.2 °C / 86.4 F e, portanto, são frios ao toque.
(-) A temperatura média da área do apoio para as mãos de dispositivos semelhantes foi 28 °C / 82.4 F (-2.2 °C / -4 F).
Dell Latitude 5289 análise de áudio
(-) | alto-falantes não muito altos (###valor### dB)
Graves 100 - 315Hz
(-) | quase nenhum baixo - em média 19.6% menor que a mediana
(±) | a linearidade dos graves é média (11.1% delta para a frequência anterior)
Médios 400 - 2.000 Hz
(+) | médios equilibrados - apenas 3.2% longe da mediana
(±) | a linearidade dos médios é média (7.7% delta para frequência anterior)
Altos 2 - 16 kHz
(±) | máximos mais altos - em média 5.2% maior que a mediana
(±) | a linearidade dos máximos é média (9.5% delta para frequência anterior)
Geral 100 - 16.000 Hz
(±) | a linearidade do som geral é média (23.2% diferença em relação à mediana)
Comparado com a mesma classe
» 70% de todos os dispositivos testados nesta classe foram melhores, 5% semelhantes, 25% piores
» O melhor teve um delta de 6%, a média foi 20%, o pior foi 57%
Comparado com todos os dispositivos testados
» 70% de todos os dispositivos testados foram melhores, 5% semelhantes, 25% piores
» O melhor teve um delta de 4%, a média foi 23%, o pior foi 134%
Apple MacBook 12 (Early 2016) 1.1 GHz análise de áudio
(+) | os alto-falantes podem tocar relativamente alto (###valor### dB)
Graves 100 - 315Hz
(±) | graves reduzidos - em média 11.3% menor que a mediana
(±) | a linearidade dos graves é média (14.2% delta para a frequência anterior)
Médios 400 - 2.000 Hz
(+) | médios equilibrados - apenas 2.4% longe da mediana
(+) | médios são lineares (5.5% delta para frequência anterior)
Altos 2 - 16 kHz
(+) | agudos equilibrados - apenas 2% longe da mediana
(+) | os máximos são lineares (4.5% delta da frequência anterior)
Geral 100 - 16.000 Hz
(+) | o som geral é linear (10.2% diferença em relação à mediana)
Comparado com a mesma classe
» 7% de todos os dispositivos testados nesta classe foram melhores, 2% semelhantes, 90% piores
» O melhor teve um delta de 5%, a média foi 18%, o pior foi 53%
Comparado com todos os dispositivos testados
» 5% de todos os dispositivos testados foram melhores, 1% semelhantes, 94% piores
» O melhor teve um delta de 4%, a média foi 23%, o pior foi 134%
| desligado | |
| Ocioso | |
| Carga |
|
Key:
min: | |
| Dell Latitude 5289 i5-7300U, HD Graphics 620, SanDisk X400 256GB, SATA (SD8SB8U-256G), IPS LED, 1920x1080, 12.5" | Lenovo ThinkPad Yoga 370-20JJS00100 i5-7200U, HD Graphics 620, Toshiba NVMe THNSF5512GPUK, IPS LED, 1920x1080, 13.3" | HP EliteBook x360 1030 G2 i5-7300U, HD Graphics 620, Sandisk SD8TN8U-256G-1006, IPS, 1920x1080, 13.3" | Dell XPS 13-9365 2-in-1 i7-7Y75, HD Graphics 615, Toshiba NVMe THNSN5256GPUK, IPS, 1920x1080, 13.3" | HP Spectre x360 13-w023dx i7-7500U, HD Graphics 620, Samsung PM951 NVMe MZVLV512, IPS, 1920x1080, 13.3" | Lenovo Yoga 910-13IKB-80VF004CGE i7-7500U, HD Graphics 620, Samsung PM951 NVMe MZVLV512, IPS, 3840x2160, 13.9" | |
|---|---|---|---|---|---|---|
| Power Consumption | -17% | -9% | 17% | -30% | -20% | |
| Idle Minimum * (Watt) | 2.7 | 3.6 -33% | 3.2 -19% | 3.1 -15% | 5.5 -104% | 4.3 -59% |
| Idle Average * (Watt) | 5.1 | 7.2 -41% | 5.5 -8% | 4.3 16% | 6.7 -31% | 6.3 -24% |
| Idle Maximum * (Watt) | 7.6 | 8.4 -11% | 6.5 14% | 4.9 36% | 7.1 7% | 9 -18% |
| Load Average * (Watt) | 33 | 29.9 9% | 29.7 10% | 24.3 26% | 33.1 -0% | 32.7 1% |
| Load Maximum * (Watt) | 29 | 32.2 -11% | 41.3 -42% | 22.8 21% | 35.2 -21% | 28.8 1% |
* ... menor é melhor
| Dell Latitude 5289 i5-7300U, HD Graphics 620, 60 Wh | Lenovo ThinkPad Yoga 370-20JJS00100 i5-7200U, HD Graphics 620, 51 Wh | HP EliteBook x360 1030 G2 i5-7300U, HD Graphics 620, 57 Wh | Dell XPS 13-9365 2-in-1 i7-7Y75, HD Graphics 615, 46 Wh | HP Spectre x360 13-w023dx i7-7500U, HD Graphics 620, 57.8 Wh | Lenovo Yoga 910-13IKB-80VF004CGE i7-7500U, HD Graphics 620, 78 Wh | |
|---|---|---|---|---|---|---|
| Duração da bateria | -24% | 16% | -7% | -21% | -7% | |
| Reader / Idle (h) | 28.8 | 19.4 -33% | 23.1 -20% | 16.2 -44% | 20.6 -28% | 17.8 -38% |
| WiFi v1.3 (h) | 11.8 | 8.1 -31% | 10.5 -11% | 11.4 -3% | 9.3 -21% | 10.7 -9% |
| Load (h) | 2.3 | 2.1 -9% | 4.1 78% | 2.9 26% | 2 -13% | 2.9 26% |
| H.264 (h) | 9.6 | 11 |
Pro
Contra
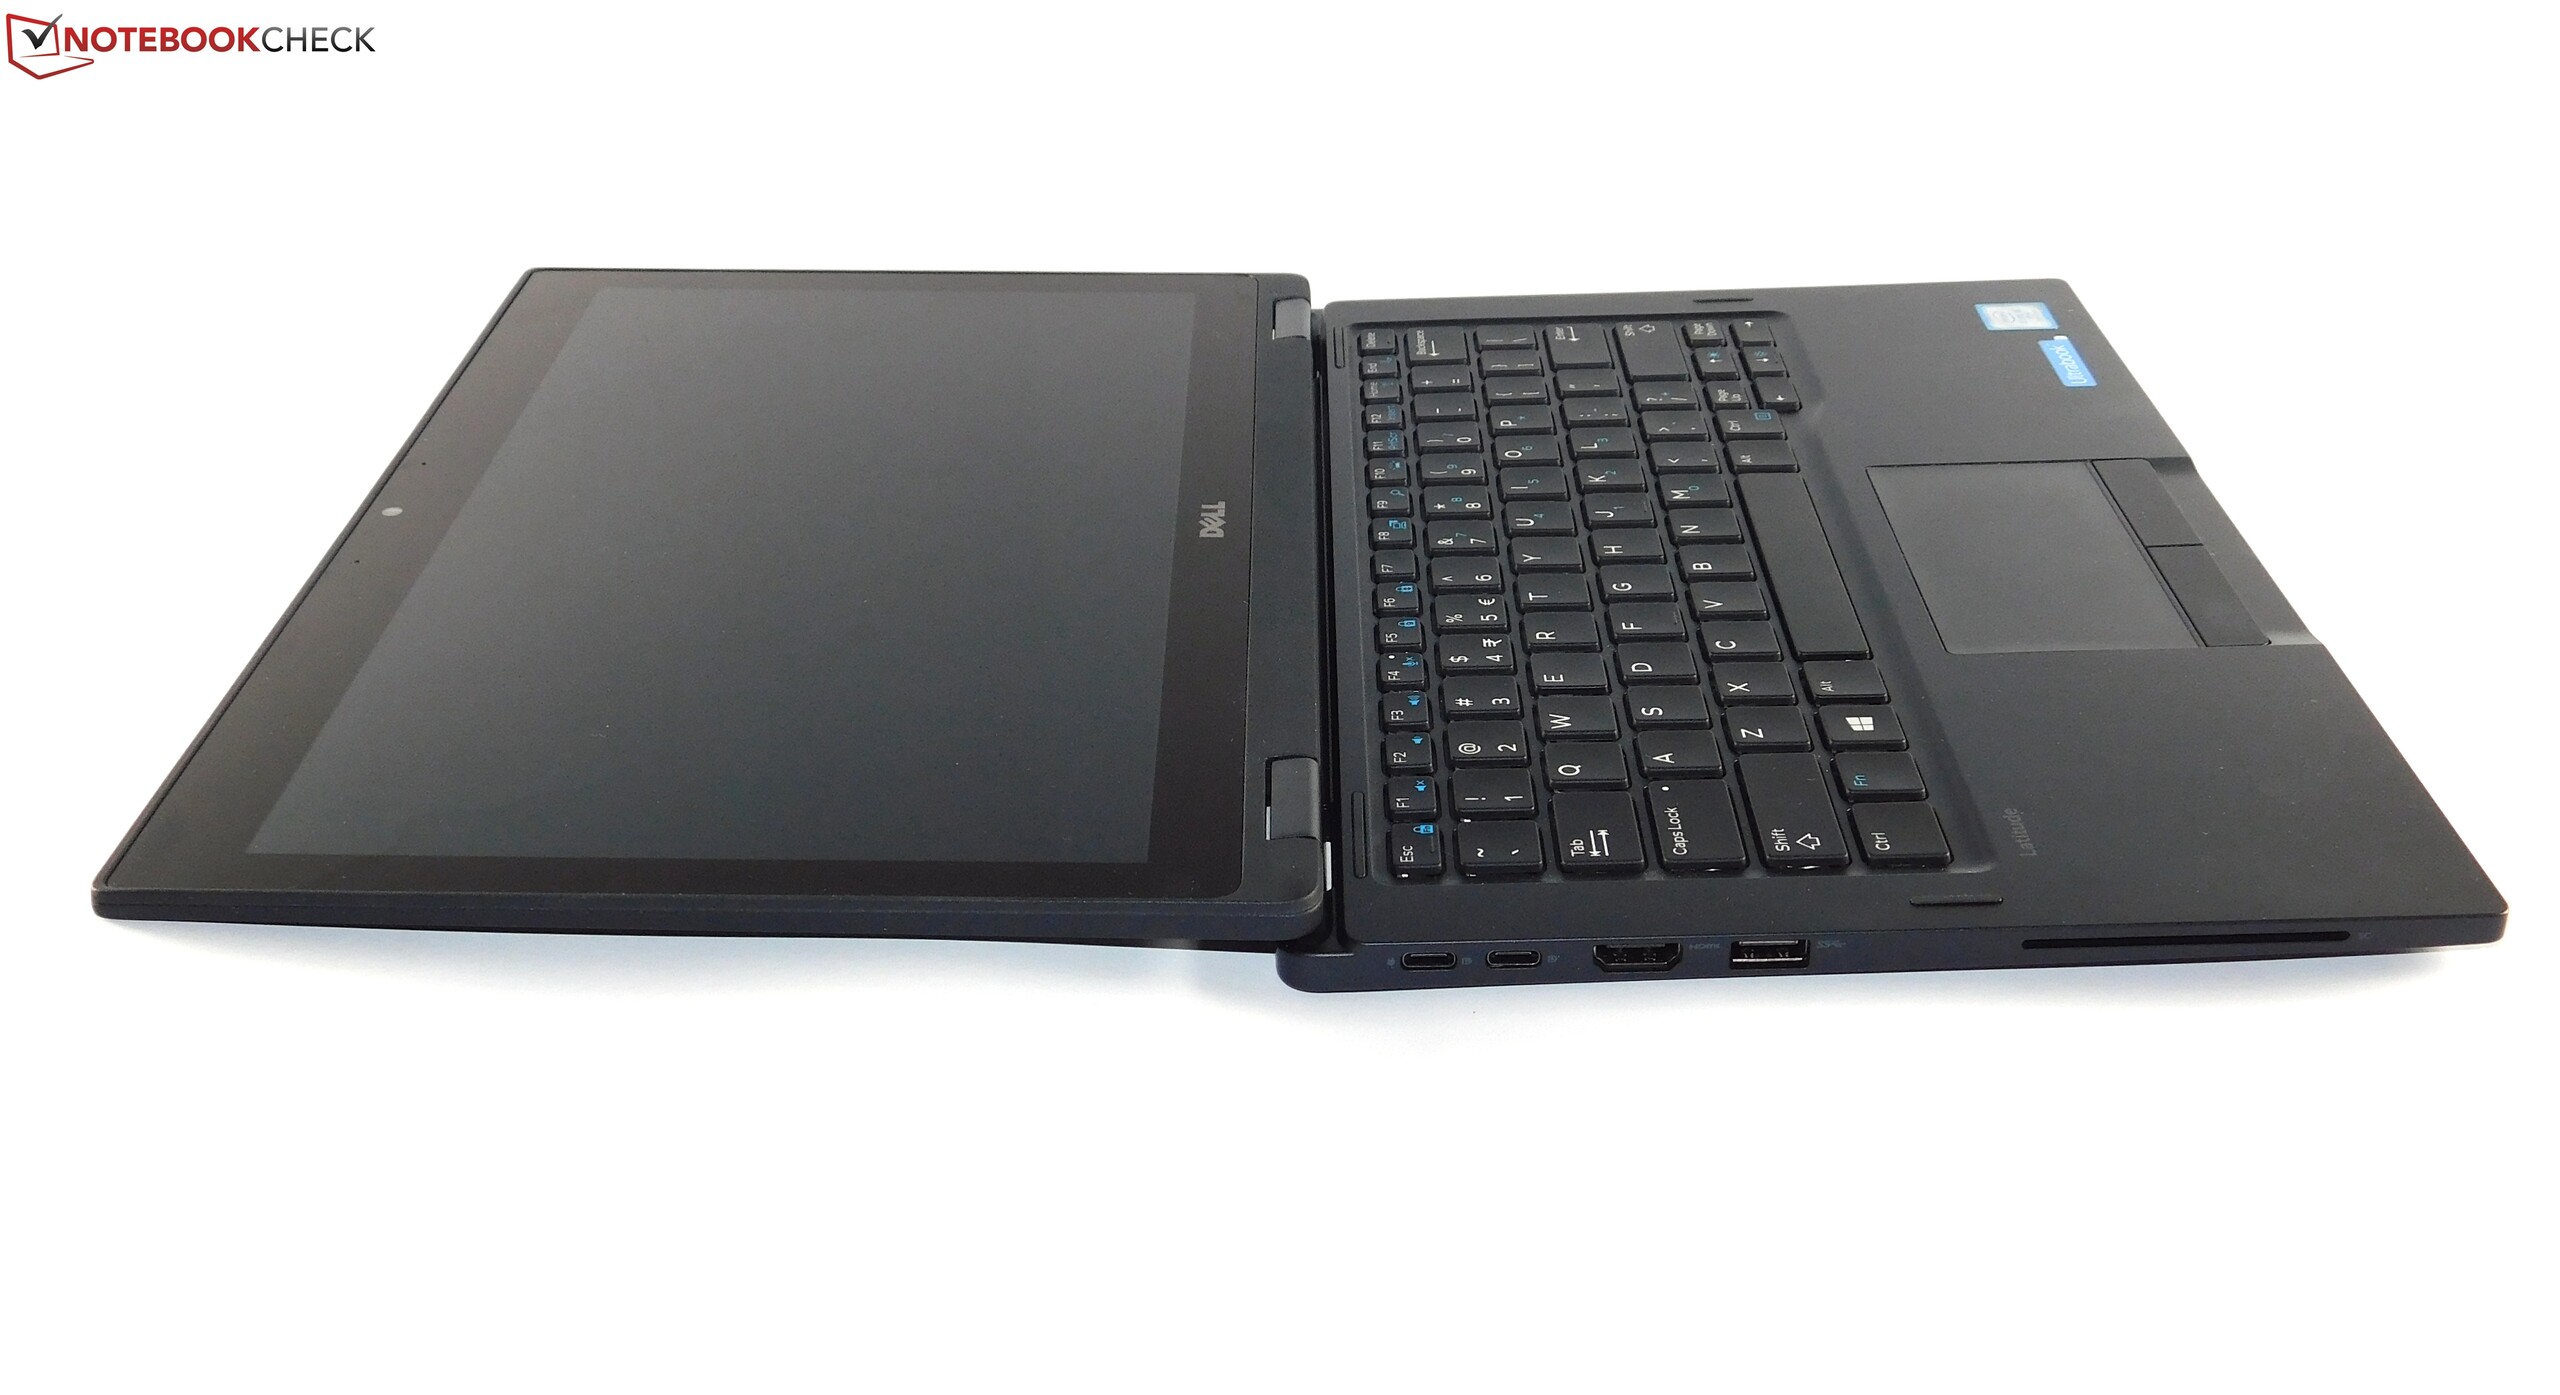
Escolher um conversível empresarial não é fácil. Depois de tudo o ThinkPad Yoga 370 e o EliteBook x360 são duas boas alternativas. Com o Latitude 5289, a Dell contribuiu com um concorrente interessante. A maior vantagem da unidade de teste: sua duração de bateria. Graças ao baixo consumo de energia e a uma bateria muito grande, o Latitude é o melhor aparelho nesta área. A carcaça robusta e o confortável teclado também merecem ser considerados. A ventoinha de resfriamento do Latitude 5289 permanece em silêncio graças à sua CPU ULV. A seleção das portas é adequada para um aparelho empresarial, o que nos leva para os aspectos negativos.
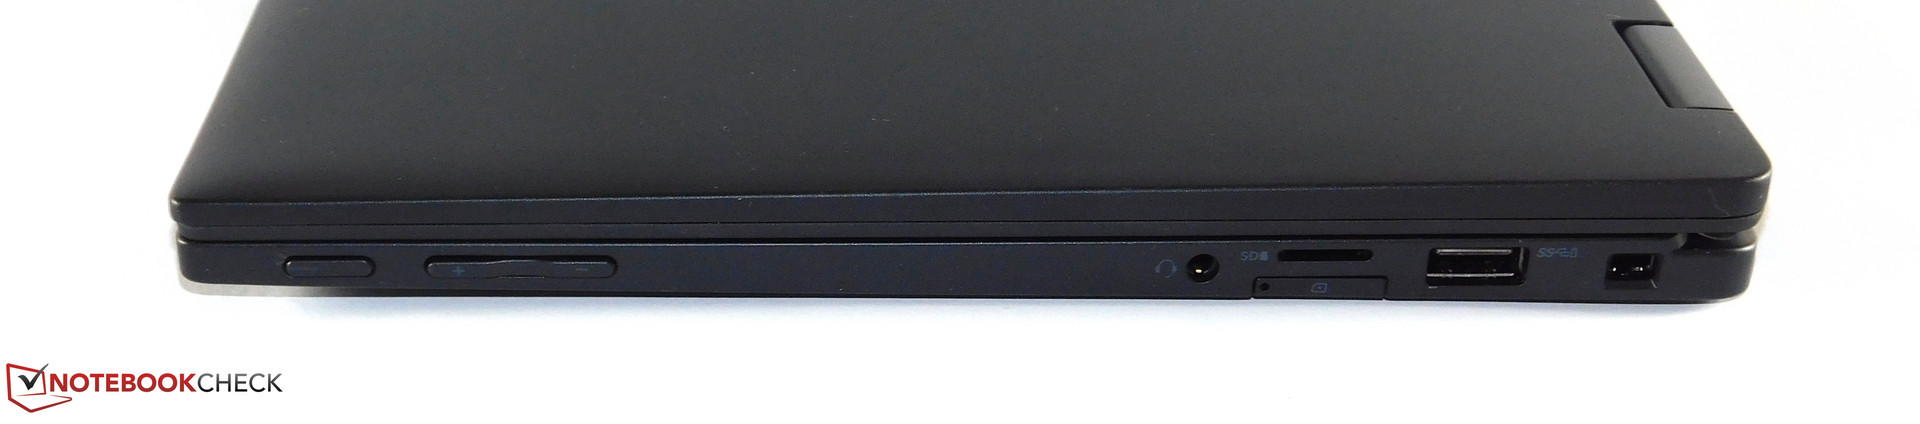
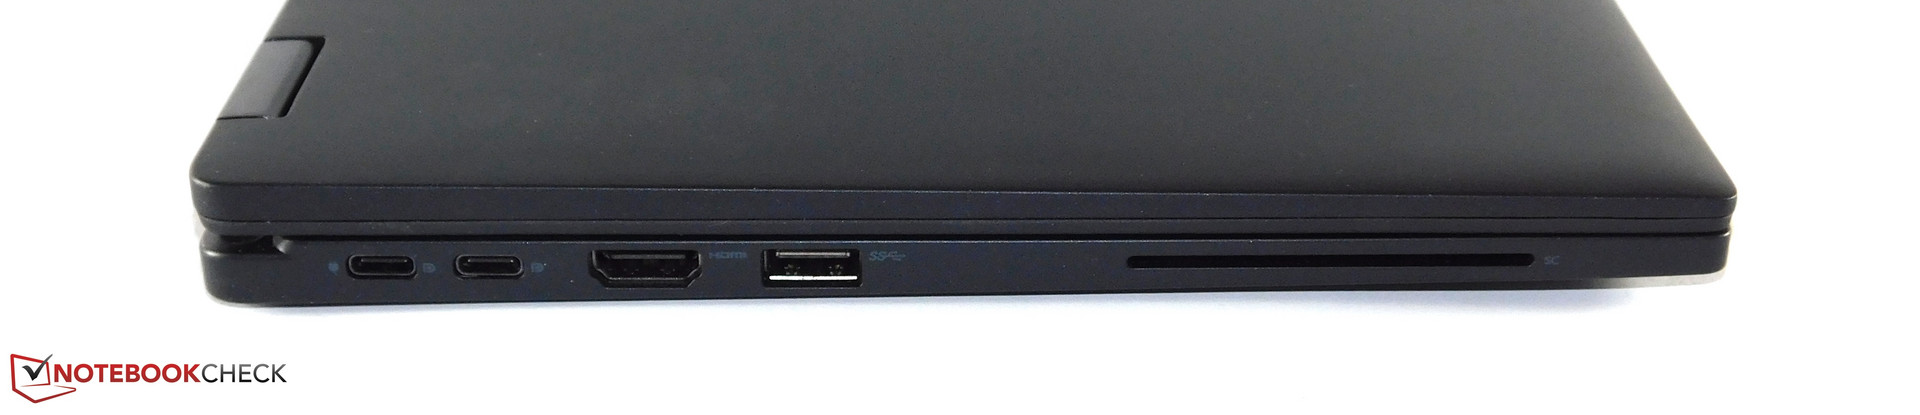
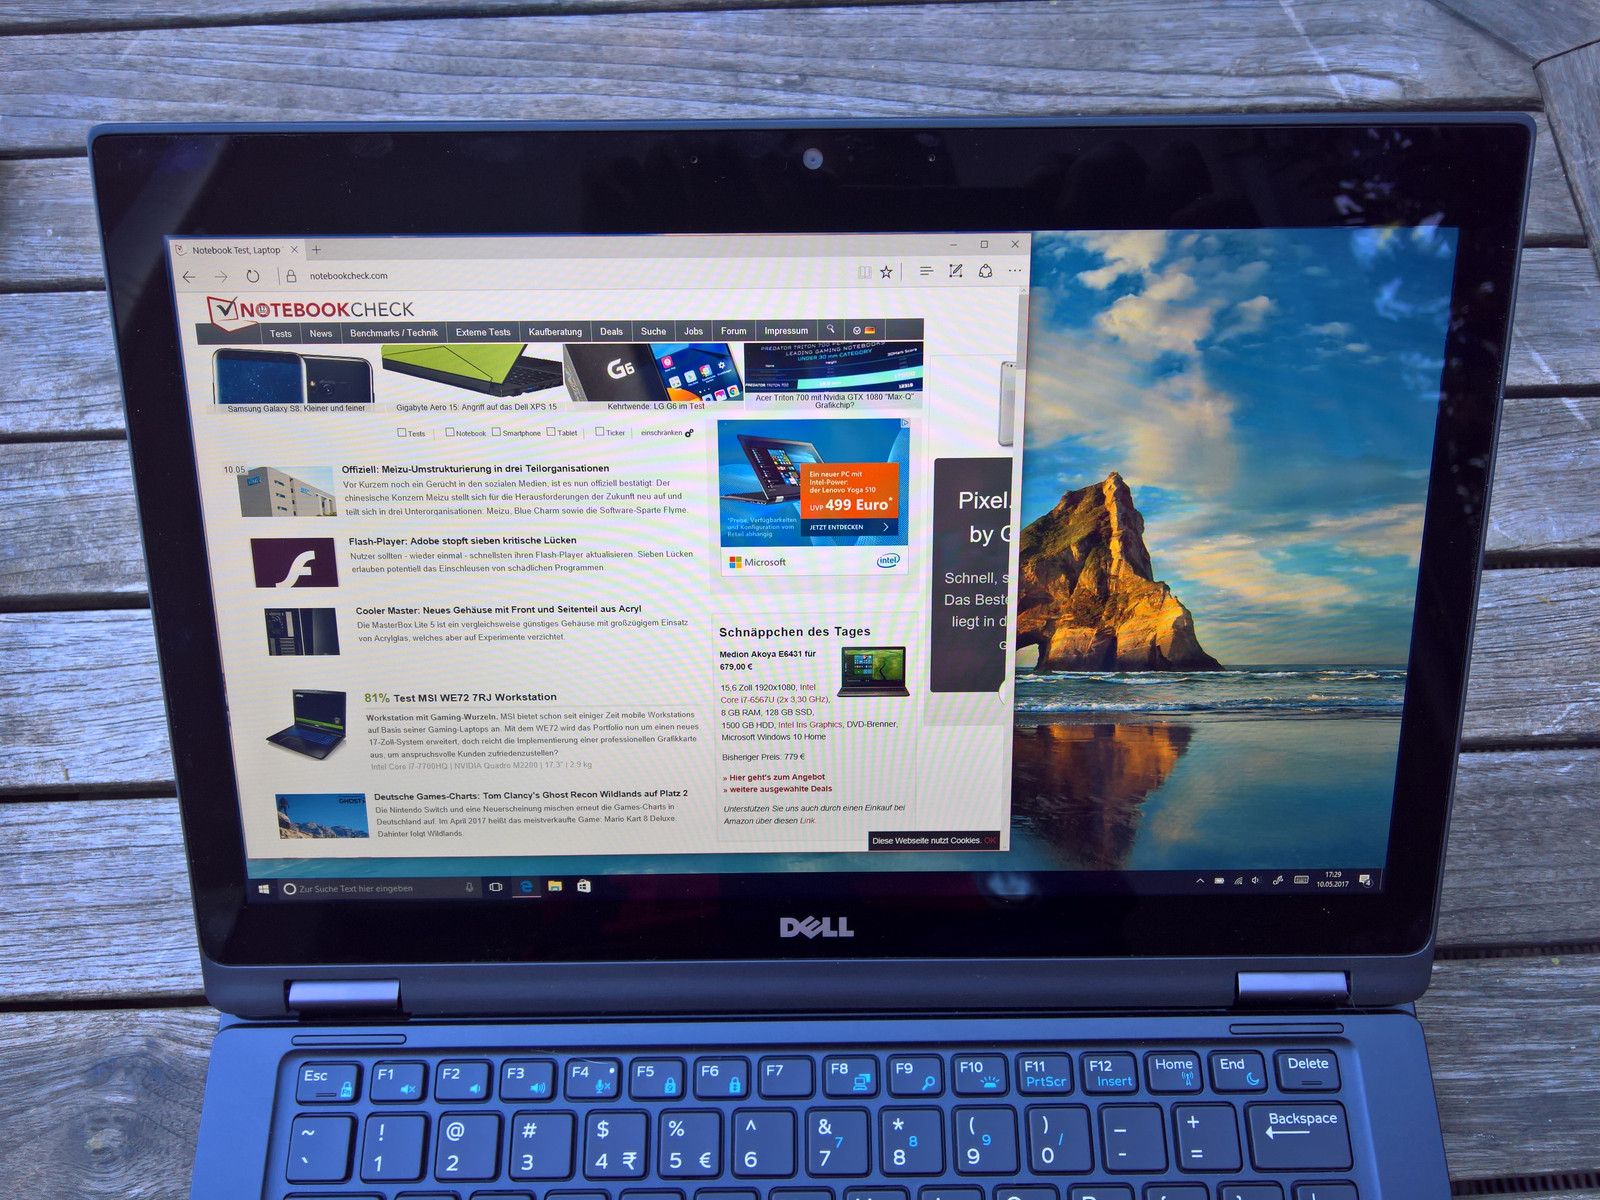
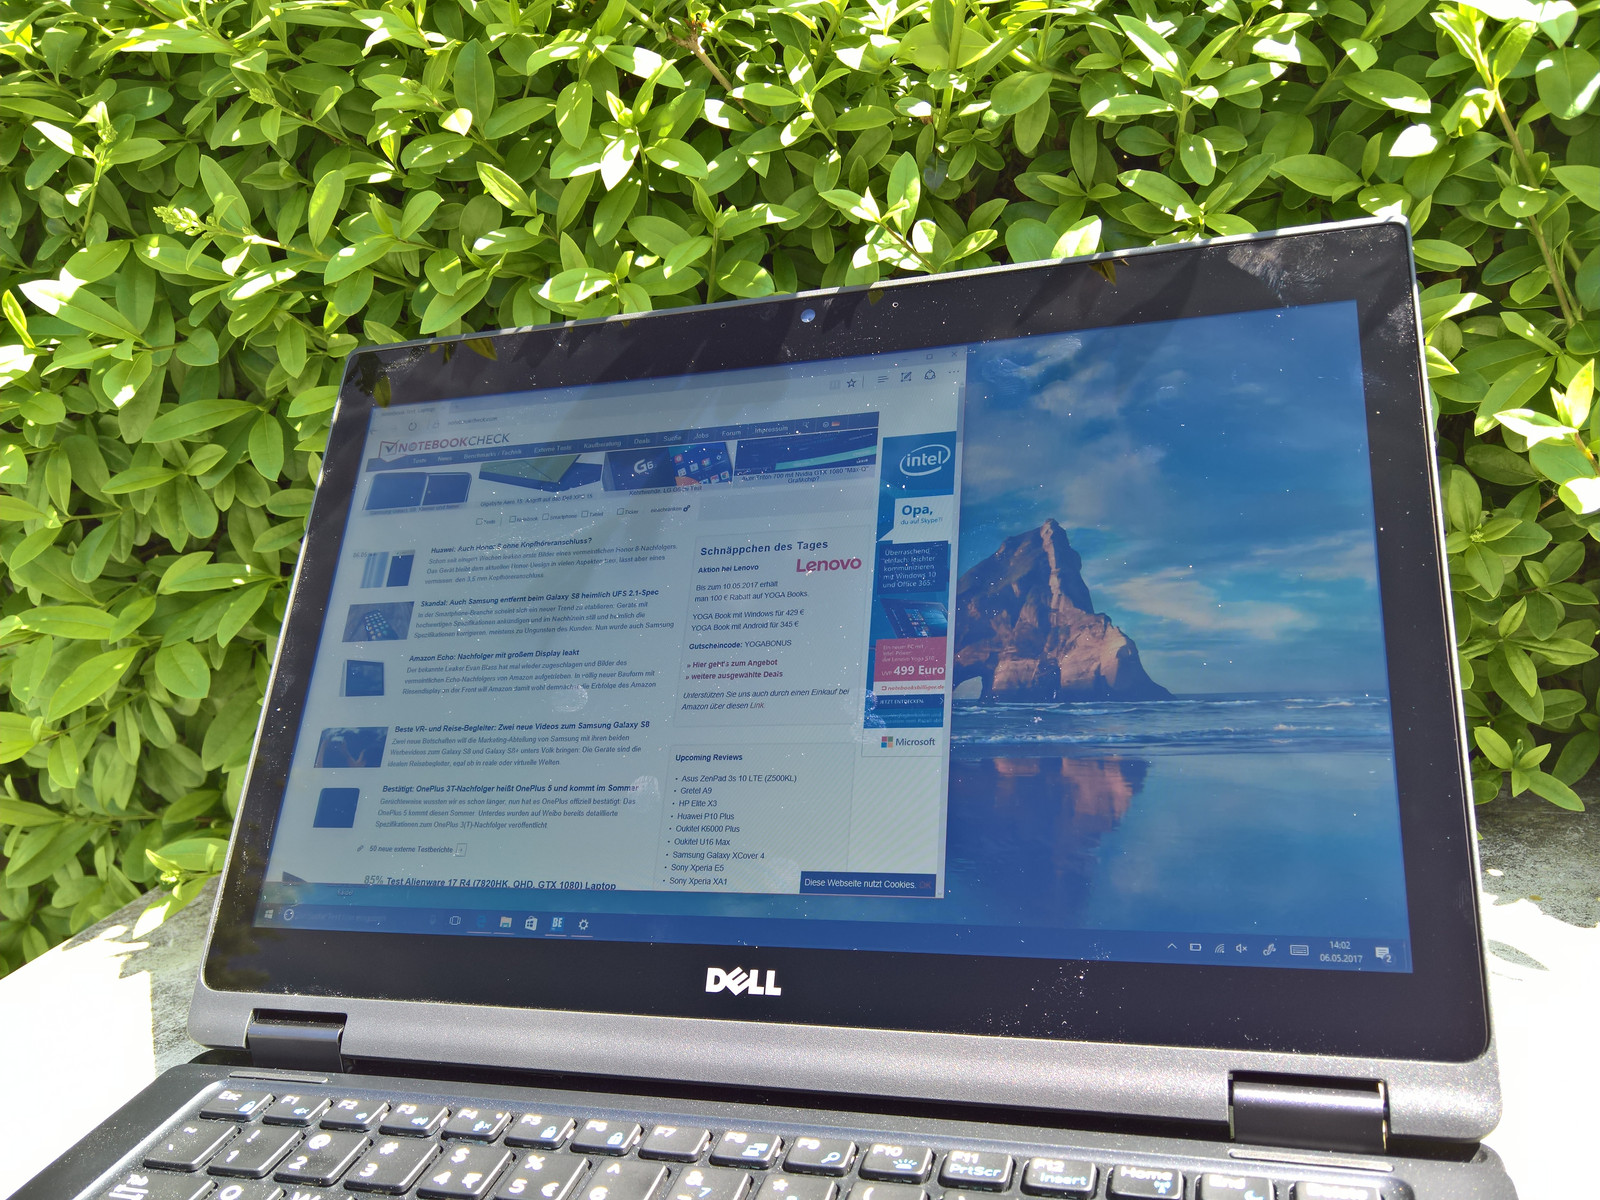
Um aparelho claramente acima da marca dos $ 1.000 deve estar equipado com Thunderbolt 3 e todos seus concorrentes possuem a porta. A ventoinha de resfriamento não funciona com muita frequência, mas a Dell não conseguiu se livrar do ruído da bobina. O teclado é bom; o touchpad, no entanto, não é impressionante; especialmente em comparação com os concorrentes da HP e Lenovo, o touchpad que a Dell escolheu não é ótimo. Ao contrário da Lenovo e da HP, a Dell escolheu manter a tela de 12,5 polegadas. Isso pode ser uma vantagem ou uma desvantagem: você tem menos superfície de trabalho, mas também menos peso. Uma desvantagem típica das telas de 12,5 polegadas é a falta de cobertura de espaço de cores. Além disso, a tela exibe um forte "bleeding" da iluminação de fundo. Pelo menos, é suficientemente brilhante para usar em exteriores.
A Dell criou um bom conversível: sua longa duração da bateria é particularmente cativante. Mas não é fácil manter-se neste mercado altamente competitivo, e a Dell cometeu alguns erros.
O Latitude 5289 definitivamente não é um conversível ruim. Se você está procurando por um portátil conversível com a maior duração de bateria possível, este pode até ser uma escolha recomendável. No entanto, as alternativas - ThinkPad Yoga 370 e EliteBook x360 - igualmente possuem seus pontos fortes. O modelo de nível de entrada do Latitude custa menos, mas você também recebe uma configuração pior, com apenas 4 GB de memória de trabalho soldada. No geral, o Latitude tem dificuldade em se afirmar contra seus concorrentes. Poderia vencê-los com uma melhor tela de 13,3 polegadas e um touchpad melhorado. Em vez disso, ele permanece em terceiro lugar, apesar da ótimo duração da bateria, especialmente porque os modelos da Lenovo e da HP também oferecem boas durações de bateria.
Dell Latitude 5289
- 05/16/2017 v6 (old)
Benjamin Herzig