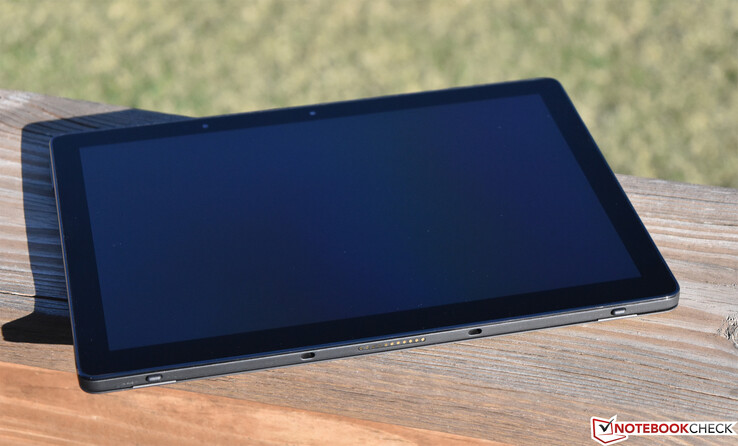
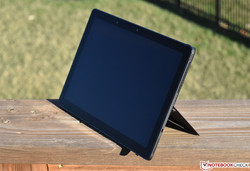
Breve Análise do Conversível Dell Latitude 5290 2-in-1 (i5-8350U)
Os Top 10
» Os Top 10 Portáteis Multimídia
» Os Top 10 Portáteis de Jogos
» Os Top 10 Portáteis Leves para Jogos
» Os Top 10 Portáteis Acessíveis de Escritório/Empresariais
» Os Top 10 Portáteis Premium de Escritório/Empresariais
» Os Top 10 dos Portáteis Workstation
» Os Top 10 Subportáteis
» Os Top 10 Ultrabooks
» Os Top 10 Conversíveis
» Os Top 10 Tablets
» Os Top 10 Smartphones
» A melhores Telas de Portáteis Analisadas Pela Notebookcheck
» Top 10 dos portáteis abaixo dos 500 Euros da Notebookcheck
» Top 10 dos Portáteis abaixo dos 300 Euros
| SD Card Reader | |
| average JPG Copy Test (av. of 3 runs) | |
| Dell Latitude 5290 2-in-1 (Toshiba Exceria Pro M501 UHS-II) | |
| HP Elite x2 1012 G2-1LV76EA (Toshiba Exceria Pro M501) | |
| Lenovo ThinkPad X1 Tablet Gen 2 (Toshiba Exceria Pro SDXC 64 GB UHS-II) | |
| Dell Latitude 12 5285 2-in-1 (Toshiba THN-M401S0640E2) | |
| Microsoft Surface Pro (2017) i7 (Toshiba Exceria Pro M401 64 GB) | |
| Média da turma Office (22.4 - 198.5, n=29, últimos 2 anos) | |
| maximum AS SSD Seq Read Test (1GB) | |
| Dell Latitude 5290 2-in-1 (Toshiba Exceria Pro M501 UHS-II) | |
| Lenovo ThinkPad X1 Tablet Gen 2 (Toshiba Exceria Pro SDXC 64 GB UHS-II) | |
| HP Elite x2 1012 G2-1LV76EA (Toshiba Exceria Pro M501) | |
| Dell Latitude 12 5285 2-in-1 (Toshiba THN-M401S0640E2) | |
| Microsoft Surface Pro (2017) i7 (Toshiba Exceria Pro M401 64 GB) | |
| Média da turma Office (25 - 249, n=27, últimos 2 anos) | |
| |||||||||||||||||||||||||
iluminação: 86 %
iluminação com acumulador: 548 cd/m²
Contraste: 1075:1 (Preto: 0.51 cd/m²)
ΔE ColorChecker Calman: 3.65 | ∀{0.5-29.43 Ø4.77}
calibrated: 1.81
ΔE Greyscale Calman: 5.5 | ∀{0.09-98 Ø5}
99.1% sRGB (Argyll 1.6.3 3D)
65.2% AdobeRGB 1998 (Argyll 1.6.3 3D)
71.5% AdobeRGB 1998 (Argyll 3D)
98.6% sRGB (Argyll 3D)
70.5% Display P3 (Argyll 3D)
Gamma: 2.154
CCT: 7052 K
| Dell Latitude 5290 2-in-1 SHP1479, IPS, 12.3", 1920x1280 | Dell Latitude 12 5285 2-in-1 BOE06DC, IPS, 12.3", 1920x1280 | Microsoft Surface Pro (2017) i7 LG Display LP123WQ112604, IPS, 12.3", 2736x1824 | HP Elite x2 1012 G2-1LV76EA Samsung SDC4A49, IPS, 12.3", 2716x1824 | Lenovo ThinkPad X1 Tablet Gen 2 LSN120QL01L01, IPS, 12", 2160x1440 | Toshiba Portege Z20t-C-121 Toshiba TOS508F, IPS, 12.5", 1920x1080 | |
|---|---|---|---|---|---|---|
| Display | -9% | -4% | -3% | -38% | ||
| Display P3 Coverage (%) | 70.5 | 62.8 -11% | 66.6 -6% | 66.7 -5% | 42.51 -40% | |
| sRGB Coverage (%) | 98.6 | 94 -5% | 96.5 -2% | 98 -1% | 63.7 -35% | |
| AdobeRGB 1998 Coverage (%) | 71.5 | 64.7 -10% | 67.8 -5% | 68.7 -4% | 43.95 -39% | |
| Response Times | 20% | 33% | 30% | 44% | -4% | |
| Response Time Grey 50% / Grey 80% * (ms) | 56.8 ? | 42.4 ? 25% | 37 ? 35% | 45.6 ? 20% | 28.4 ? 50% | 61 ? -7% |
| Response Time Black / White * (ms) | 36 ? | 30.8 ? 14% | 25 ? 31% | 21.6 ? 40% | 22.8 ? 37% | 36 ? -0% |
| PWM Frequency (Hz) | 1852 ? | 210.1 ? | 22130 ? | 2119 ? | 221.2 ? | |
| Screen | -1% | -1% | 10% | -14% | -49% | |
| Brightness middle (cd/m²) | 548 | 523.2 -5% | 482 -12% | 443 -19% | 388.1 -29% | 354 -35% |
| Brightness (cd/m²) | 545 | 522 -4% | 466 -14% | 446 -18% | 344 -37% | 330 -39% |
| Brightness Distribution (%) | 86 | 88 2% | 92 7% | 88 2% | 78 -9% | 86 0% |
| Black Level * (cd/m²) | 0.51 | 0.42 18% | 0.395 23% | 0.41 20% | 0.39 24% | 0.63 -24% |
| Contrast (:1) | 1075 | 1246 16% | 1220 13% | 1080 0% | 995 -7% | 562 -48% |
| Colorchecker dE 2000 * | 3.65 | 4 -10% | 4 -10% | 2.6 29% | 4.6 -26% | 8.28 -127% |
| Colorchecker dE 2000 max. * | 7.15 | 8.6 -20% | 7.2 -1% | 4 44% | 9.1 -27% | 12.71 -78% |
| Colorchecker dE 2000 calibrated * | 1.81 | |||||
| Greyscale dE 2000 * | 5.5 | 5.5 -0% | 5.7 -4% | 3 45% | 6.1 -11% | 9.15 -66% |
| Gamma | 2.154 102% | 2.16 102% | 2.28 96% | 2.38 92% | 2.07 106% | 2.73 81% |
| CCT | 7052 92% | 7546 86% | 7950 82% | 6780 96% | 7104 91% | 5953 109% |
| Color Space (Percent of AdobeRGB 1998) (%) | 65.2 | 64.86 -1% | 62 -5% | 62.6 -4% | 59 -10% | 40 -39% |
| Color Space (Percent of sRGB) (%) | 99.1 | 93.97 -5% | 96 -3% | 98 -1% | 91 -8% | 63 -36% |
| Média Total (Programa/Configurações) | 3% /
0% | 9% /
3% | 12% /
10% | 15% /
-4% | -30% /
-41% |
* ... menor é melhor
Exibir tempos de resposta
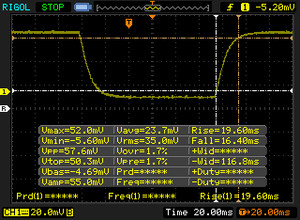
| ↔ Tempo de resposta preto para branco | ||
|---|---|---|
| 36 ms ... ascensão ↗ e queda ↘ combinadas | ↗ 19.6 ms ascensão | |
| ↘ 16.4 ms queda | ||
| A tela mostra taxas de resposta lentas em nossos testes e será insatisfatória para os jogadores. Em comparação, todos os dispositivos testados variam de 0.1 (mínimo) a 240 (máximo) ms. » 93 % de todos os dispositivos são melhores. Isso significa que o tempo de resposta medido é pior que a média de todos os dispositivos testados (20.2 ms). | ||
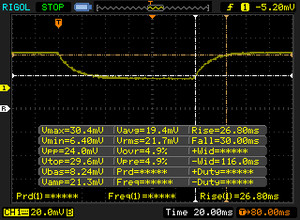
| ↔ Tempo de resposta 50% cinza a 80% cinza | ||
| 56.8 ms ... ascensão ↗ e queda ↘ combinadas | ↗ 26.8 ms ascensão | |
| ↘ 30 ms queda | ||
| A tela mostra taxas de resposta lentas em nossos testes e será insatisfatória para os jogadores. Em comparação, todos os dispositivos testados variam de 0.165 (mínimo) a 636 (máximo) ms. » 94 % de todos os dispositivos são melhores. Isso significa que o tempo de resposta medido é pior que a média de todos os dispositivos testados (31.5 ms). | ||
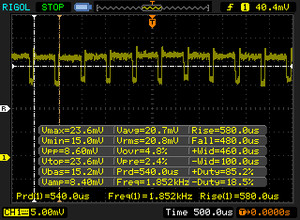
Cintilação da tela / PWM (modulação por largura de pulso)
| Tela tremeluzindo/PWM detectado | 1852 Hz | ≤ 98 % configuração de brilho | |
A luz de fundo da tela pisca em 1852 Hz (pior caso, por exemplo, utilizando PWM) Cintilação detectada em uma configuração de brilho de 98 % e abaixo. Não deve haver cintilação ou PWM acima desta configuração de brilho. A frequência de 1852 Hz é bastante alta, então a maioria dos usuários sensíveis ao PWM não deve notar nenhuma oscilação. [pwm_comparison] Em comparação: 53 % de todos os dispositivos testados não usam PWM para escurecer a tela. Se PWM foi detectado, uma média de 8070 (mínimo: 5 - máximo: 343500) Hz foi medida. | |||
* ... menor é melhor
| PCMark 8 Home Score Accelerated v2 | 3776 pontos | |
| PCMark 8 Creative Score Accelerated v2 | 4961 pontos | |
| PCMark 8 Work Score Accelerated v2 | 4764 pontos | |
| PCMark 10 Score | 3737 pontos | |
Ajuda | ||
| Dell Latitude 5290 2-in-1 Toshiba XG5 KXG50ZNV256G | Dell Latitude 12 5285 2-in-1 Samsung PM961 MZVLW256HEHP | Microsoft Surface Pro (2017) i7 Samsung PM971 KUS040202M | HP Elite x2 1012 G2-1LV76EA Samsung PM961 MZVLW256HEHP | Média Toshiba XG5 KXG50ZNV256G | |
|---|---|---|---|---|---|
| AS SSD | -239% | -1002% | 108% | -24% | |
| Copy Game MB/s (MB/s) | 317.3 | 585 84% | 582 83% | 379.9 20% | 354 ? 12% |
| Copy Program MB/s (MB/s) | 226.9 | 286.5 26% | 386 70% | 198.2 -13% | 224 ? -1% |
| Copy ISO MB/s (MB/s) | 512 | 1146 124% | 1036 102% | 791 54% | 506 ? -1% |
| Score Total (Points) | 1469 | 2760 88% | 1774 21% | 4653 217% | 1404 ? -4% |
| Score Write (Points) | 544 | 150 -72% | 52 -90% | 879 62% | 479 ? -12% |
| Score Read (Points) | 642 | 1768 175% | 1164 81% | 2545 296% | 650 ? 1% |
| Access Time Write * (ms) | 0.053 | 2.08 -3825% | 7.6 -14240% | 0.027 49% | 0.2029 ? -283% |
| Access Time Read * (ms) | 0.082 | 0.06 27% | 0.04 51% | 0.041 50% | 0.1329 ? -62% |
| 4K-64 Write (MB/s) | 411.2 | 126.1 -69% | 34 -92% | 657 60% | 351 ? -15% |
| 4K-64 Read (MB/s) | 472.7 | 1607 240% | 1015 115% | 2280 382% | 445 ? -6% |
| 4K Write (MB/s) | 102.7 | 1.23 -99% | 0.2 -100% | 132.2 29% | 91 ? -11% |
| 4K Read (MB/s) | 30.97 | 27.6 -11% | 41 32% | 45.24 46% | 28.1 ? -9% |
| Seq Write (MB/s) | 302.1 | 223.1 -26% | 171 -43% | 897 197% | 369 ? 22% |
| Seq Read (MB/s) | 1385 | 1328 -4% | 1070 -23% | 2197 59% | 1768 ? 28% |
* ... menor é melhor
| 3DMark 06 Standard Score | 10387 pontos | |
| 3DMark 11 Performance | 1847 pontos | |
| 3DMark Ice Storm Standard Score | 66347 pontos | |
| 3DMark Cloud Gate Standard Score | 8236 pontos | |
| 3DMark Fire Strike Score | 1086 pontos | |
| 3DMark Fire Strike Extreme Score | 517 pontos | |
| 3DMark Time Spy Score | 398 pontos | |
Ajuda | ||
| baixo | média | alto | ultra | |
|---|---|---|---|---|
| BioShock Infinite (2013) | 60 | 34 | 28 | 9 |
Barulho
| Ocioso |
| 28.5 / 28.5 / 28.5 dB |
| Carga |
| 28.5 / 41.6 dB |
 | ||
30 dB silencioso 40 dB(A) audível 50 dB(A) ruidosamente alto |
||
min: | ||
| Dell Latitude 5290 2-in-1 UHD Graphics 620, i5-8350U, Toshiba XG5 KXG50ZNV256G | Dell Latitude 12 5285 2-in-1 HD Graphics 620, i7-7600U, Samsung PM961 MZVLW256HEHP | Microsoft Surface Pro (2017) i7 Iris Plus Graphics 640, i7-7660U, Samsung PM971 KUS040202M | HP Elite x2 1012 G2-1LV76EA HD Graphics 620, i5-7200U, Samsung PM961 MZVLW256HEHP | |
|---|---|---|---|---|
| Noise | 3% | -3% | -0% | |
| desligado / ambiente * (dB) | 28.5 | 28.2 1% | 29.6 -4% | 29.5 -4% |
| Idle Minimum * (dB) | 28.5 | 28.2 1% | 29.6 -4% | 29.5 -4% |
| Idle Average * (dB) | 28.5 | 28.2 1% | 29.6 -4% | 29.5 -4% |
| Idle Maximum * (dB) | 28.5 | 28.2 1% | 29.6 -4% | 29.5 -4% |
| Load Average * (dB) | 28.5 | 30.4 -7% | 33.4 -17% | 30.6 -7% |
| Load Maximum * (dB) | 41.6 | 34 18% | 34.1 18% | 32.5 22% |
| Witcher 3 ultra * (dB) | 33.4 |
* ... menor é melhor
(±) A temperatura máxima no lado superior é 44.4 °C / 112 F, em comparação com a média de 34.3 °C / 94 F , variando de 21.2 a 62.5 °C para a classe Office.
(-) A parte inferior aquece até um máximo de 52 °C / 126 F, em comparação com a média de 36.8 °C / 98 F
(+) Em uso inativo, a temperatura média para o lado superior é 26.3 °C / 79 F, em comparação com a média do dispositivo de 29.5 °C / ### class_avg_f### F.
(+) Os apoios para as mãos e o touchpad são mais frios que a temperatura da pele, com um máximo de 29 °C / 84.2 F e, portanto, são frios ao toque.
(±) A temperatura média da área do apoio para as mãos de dispositivos semelhantes foi 27.5 °C / 81.5 F (-1.5 °C / -2.7 F).
Dell Latitude 5290 2-in-1 análise de áudio
(±) | o volume do alto-falante é médio, mas bom (###valor### dB)
Graves 100 - 315Hz
(-) | quase nenhum baixo - em média 15.5% menor que a mediana
(±) | a linearidade dos graves é média (8.5% delta para a frequência anterior)
Médios 400 - 2.000 Hz
(+) | médios equilibrados - apenas 3.6% longe da mediana
(±) | a linearidade dos médios é média (8.7% delta para frequência anterior)
Altos 2 - 16 kHz
(+) | agudos equilibrados - apenas 3.5% longe da mediana
(±) | a linearidade dos máximos é média (7.1% delta para frequência anterior)
Geral 100 - 16.000 Hz
(±) | a linearidade do som geral é média (20.4% diferença em relação à mediana)
Comparado com a mesma classe
» 44% de todos os dispositivos testados nesta classe foram melhores, 10% semelhantes, 46% piores
» O melhor teve um delta de 7%, a média foi 21%, o pior foi 53%
Comparado com todos os dispositivos testados
» 53% de todos os dispositivos testados foram melhores, 8% semelhantes, 39% piores
» O melhor teve um delta de 4%, a média foi 24%, o pior foi 134%
HP Elite x2 1012 G2-1LV76EA análise de áudio
(-) | alto-falantes não muito altos (###valor### dB)
Graves 100 - 315Hz
(-) | quase nenhum baixo - em média 21.3% menor que a mediana
(±) | a linearidade dos graves é média (10% delta para a frequência anterior)
Médios 400 - 2.000 Hz
(+) | médios equilibrados - apenas 4.2% longe da mediana
(±) | a linearidade dos médios é média (7.9% delta para frequência anterior)
Altos 2 - 16 kHz
(±) | máximos mais altos - em média 8.9% maior que a mediana
(-) | os máximos não são lineares (16.8% delta da frequência anterior)
Geral 100 - 16.000 Hz
(-) | o som geral não é linear (35.1% diferença em relação à mediana)
Comparado com a mesma classe
» 94% de todos os dispositivos testados nesta classe foram melhores, 2% semelhantes, 4% piores
» O melhor teve um delta de 6%, a média foi 20%, o pior foi 57%
Comparado com todos os dispositivos testados
» 93% de todos os dispositivos testados foram melhores, 1% semelhantes, 6% piores
» O melhor teve um delta de 4%, a média foi 24%, o pior foi 134%
| desligado | |
| Ocioso | |
| Carga |
|
Key:
min: | |
| Dell Latitude 5290 2-in-1 i5-8350U, UHD Graphics 620, Toshiba XG5 KXG50ZNV256G, IPS, 1920x1280, 12.3" | Dell Latitude 12 5285 2-in-1 i7-7600U, HD Graphics 620, Samsung PM961 MZVLW256HEHP, IPS, 1920x1280, 12.3" | Microsoft Surface Pro (2017) i7 i7-7660U, Iris Plus Graphics 640, Samsung PM971 KUS040202M, IPS, 2736x1824, 12.3" | HP Elite x2 1012 G2-1LV76EA i5-7200U, HD Graphics 620, Samsung PM961 MZVLW256HEHP, IPS, 2716x1824, 12.3" | Lenovo ThinkPad X1 Tablet Gen 2 i5-7Y54, HD Graphics 615, Samsung PM961 MZVLW256HEHP, IPS, 2160x1440, 12" | Toshiba Portege Z20t-C-121 6Y75, HD Graphics 515, Samsung SSD PM871 MZNLN512HCJH, IPS, 1920x1080, 12.5" | |
|---|---|---|---|---|---|---|
| Power Consumption | 11% | -22% | -19% | 13% | 18% | |
| Idle Minimum * (Watt) | 3 | 2.85 5% | 4.2 -40% | 4.1 -37% | 5 -67% | 4.3 -43% |
| Idle Average * (Watt) | 7.2 | 6.76 6% | 10.1 -40% | 9.2 -28% | 6.3 12% | 6.1 15% |
| Idle Maximum * (Watt) | 10 | 6.91 31% | 14 -40% | 11.1 -11% | 7.8 22% | 8.9 11% |
| Load Average * (Watt) | 37.1 | 32.88 11% | 37.4 -1% | 33.8 9% | 19.5 47% | 16.3 56% |
| Load Maximum * (Watt) | 38.2 | 37.41 2% | 34 11% | 49.2 -29% | 19.6 49% | 18.6 51% |
| Witcher 3 ultra * (Watt) | 38.1 |
* ... menor é melhor
| Dell Latitude 5290 2-in-1 i5-8350U, UHD Graphics 620, 42 Wh | Dell Latitude 12 5285 2-in-1 i7-7600U, HD Graphics 620, 42 Wh | Microsoft Surface Pro (2017) i7 i7-7660U, Iris Plus Graphics 640, 45 Wh | HP Elite x2 1012 G2-1LV76EA i5-7200U, HD Graphics 620, 47 Wh | Lenovo ThinkPad X1 Tablet Gen 2 i5-7Y54, HD Graphics 615, 37 Wh | Toshiba Portege Z20t-C-121 6Y75, HD Graphics 515, 72 Wh | |
|---|---|---|---|---|---|---|
| Duração da bateria | 46% | 50% | 45% | 53% | 168% | |
| WiFi v1.3 (h) | 5 | 8.1 62% | 8.2 64% | 6.3 26% | 7.4 48% | 13.4 168% |
| Load (h) | 1.4 | 1.8 29% | 1.9 36% | 2.3 64% | 2.2 57% | |
| Witcher 3 ultra (h) | 1.9 |
Pro
Contra
De muitas maneiras, o 2-em-um Latitude 5290 é o Surface Pro para o mundo dos negócios. Tudo, desde sua aparência discreta, manutenção relativamente conveniente, opções de segurança robustas, operação silenciosa e seleção de portas acima da média se ajusta perfeitamente aos requisitos diários do escritório. Além de tudo isso, ainda colhemos os benefícios de uma construção de liga de magnésio extremamente robusta, uma tela extremamente brilhante e vívida, desempenho de CPU muito veloz e um bom teclado/touchpad (no acessório Teclado de Viagem de US $ 150, vendido separadamente). Finalmente, o Active Pen ($60) opcional da Dell satisfaz as demandas de um subconjunto exclusivo de usuários que precisam de uma entrada precisa da caneta ativa sensível à pressão da Wacom.
De muitas maneiras, o 2-em-1 Latitude 5290 é o Surface Pro para o mundo dos negócios; sua combinação cuidadosa de luxo de nível de consumidor e sensibilidade de nível empresarial contribuem a um conversível exclusivo que atende a um conjunto muito específico de requisitos.
Mas não há dispositivos perfeitos e o Latitude 5290 vem com sua parcela de compromissos notáveis. A principal delas é a duração da bateria, em que o Latitude cai drasticamente atrás de alguns concorrentes recentes que usam SoCs Kaby Lake. Ele também é sobrecarregado por altas temperaturas de operação (superficiais e internas) sob uso intenso, embora o calor tenha sido redistribuído um pouco para longe das bordas do dispositivo (onde as mãos normalmente descansariam). A garantia padrão é decepcionantemente curta para um dispositivo com um preço tão significativo. A falta de Thunderbolt provavelmente irritará alguns usuários que desejam soluções docking versáteis. E, finalmente, voltando ao preço alto mencionado: $1.932 para a configuração atual (que, para ser justo, inclui pelo menos a capa do Travel Keyboard e o Active Pen).
Os principais concorrentes continuam sendo o Latitude 5285 do ano passado (que, pelo menos oferece uma melhor duração de bateria que o 5290), o Microsoft Surface Pro 2017 (que é muito bom no geral, mas impossível de atualizar e manter desde uma perspectiva de hardware), o HP Elite x2 1012 G2 (que é um dispositivo muito completo, mas notavelmente mais difícil de manter), e o Lenovo ThinkPad X1 Tablet Gen 2 (que é um bom concorrente, mas prejudicado pelas restrições do resfriamento passivo e outros aborrecimentos, como o PWM). Todos esses dispositivos apresentam seus próprios conjuntos de pontos fortes e fracos, por isso, antes de decidir sobre um conversível empresarial, sugerimos fortemente que você analise todos eles. No entanto, desde que a funcionalidade 2-em-1 (e talvez as entradas da caneta sensível à pressão) seja uma necessidade absoluta, há poucos dispositivos que gerenciam um desempenho geral tão forte quanto o Latitude 5290.
Dell Latitude 5290 2-in-1
- 03/30/2018 v6 (old)
Steve Schardein


