Breve Análise do Conversível Dell XPS 13 9365 (7Y54, QHD+)
| Networking | |
| iperf3 transmit AX12 | |
| Dell XPS 13-9365 2-in-1 | |
| HP Spectre x360 13-ac033dx | |
| Dell XPS 13 9365-4537 2-in-1 | |
| iperf3 receive AX12 | |
| HP Spectre x360 13-ac033dx | |
| Dell XPS 13-9365 2-in-1 | |
| Dell XPS 13 9365-4537 2-in-1 | |
| |||||||||||||||||||||||||
iluminação: 78 %
iluminação com acumulador: 348 cd/m²
Contraste: 1740:1 (Preto: 0.2 cd/m²)
ΔE ColorChecker Calman: 2.79 | ∀{0.5-29.43 Ø4.73}
ΔE Greyscale Calman: 3.47 | ∀{0.09-98 Ø4.97}
93% sRGB (Argyll 1.6.3 3D)
60% AdobeRGB 1998 (Argyll 1.6.3 3D)
66.1% AdobeRGB 1998 (Argyll 3D)
92.9% sRGB (Argyll 3D)
64.4% Display P3 (Argyll 3D)
Gamma: 2.54
CCT: 6564 K
| Dell XPS 13 9365-4537 2-in-1 IPS, 3200x1800, 13.3" | Dell XPS 13-9365 2-in-1 IPS, 1920x1080, 13.3" | HP Spectre x360 13-ac033dx IPS, 3840x2160, 13.3" | Lenovo Yoga 910-13IKB-80VF004CGE IPS, 3840x2160, 13.9" | |
|---|---|---|---|---|
| Display | -25% | 7% | -3% | |
| Display P3 Coverage (%) | 64.4 | 47.32 -27% | 69.4 8% | 62.2 -3% |
| sRGB Coverage (%) | 92.9 | 71.1 -23% | 96.8 4% | 90.1 -3% |
| AdobeRGB 1998 Coverage (%) | 66.1 | 48.83 -26% | 71.1 8% | 63.5 -4% |
| Response Times | -9% | -1% | 9% | |
| Response Time Grey 50% / Grey 80% * (ms) | 48 ? | 48 ? -0% | 42 ? 12% | 46 ? 4% |
| Response Time Black / White * (ms) | 28 ? | 32.8 ? -17% | 32 ? -14% | 24 ? 14% |
| PWM Frequency (Hz) | 1042 ? | |||
| Screen | -44% | -1% | -51% | |
| Brightness middle (cd/m²) | 348 | 322.6 -7% | 302.6 -13% | 348 0% |
| Brightness (cd/m²) | 306 | 306 0% | 282 -8% | 310 1% |
| Brightness Distribution (%) | 78 | 91 17% | 83 6% | 80 3% |
| Black Level * (cd/m²) | 0.2 | 0.19 5% | 0.25 -25% | 0.25 -25% |
| Contrast (:1) | 1740 | 1698 -2% | 1210 -30% | 1392 -20% |
| Colorchecker dE 2000 * | 2.79 | 7.7 -176% | 2.4 14% | 7.86 -182% |
| Colorchecker dE 2000 max. * | 5.53 | 11.1 -101% | 4.9 11% | 13.43 -143% |
| Greyscale dE 2000 * | 3.47 | 7.9 -128% | 2.8 19% | 8.25 -138% |
| Gamma | 2.54 87% | 2.88 76% | 2.2 100% | 2.05 107% |
| CCT | 6564 99% | 7044 92% | 6333 103% | 6834 95% |
| Color Space (Percent of AdobeRGB 1998) (%) | 60 | 44.1 -26% | 65.5 9% | 58 -3% |
| Color Space (Percent of sRGB) (%) | 93 | 69.9 -25% | 97.1 4% | 90 -3% |
| Média Total (Programa/Configurações) | -26% /
-36% | 2% /
0% | -15% /
-33% |
* ... menor é melhor
Cintilação da tela / PWM (modulação por largura de pulso)
| Tela tremeluzindo / PWM não detectado | ||
[pwm_comparison] Em comparação: 52 % de todos os dispositivos testados não usam PWM para escurecer a tela. Se PWM foi detectado, uma média de 7798 (mínimo: 5 - máximo: 343500) Hz foi medida. | ||
Exibir tempos de resposta
| ↔ Tempo de resposta preto para branco | ||
|---|---|---|
| 28 ms ... ascensão ↗ e queda ↘ combinadas | ↗ 16 ms ascensão | 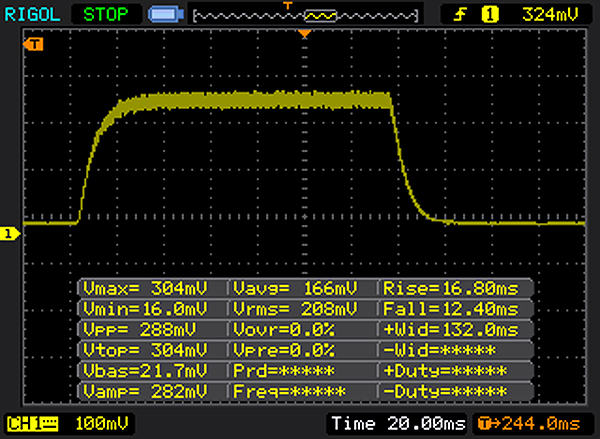 |
| ↘ 12 ms queda | ||
| A tela mostra taxas de resposta relativamente lentas em nossos testes e pode ser muito lenta para os jogadores. Em comparação, todos os dispositivos testados variam de 0.1 (mínimo) a 240 (máximo) ms. » 71 % de todos os dispositivos são melhores. Isso significa que o tempo de resposta medido é pior que a média de todos os dispositivos testados (19.9 ms). | ||
| ↔ Tempo de resposta 50% cinza a 80% cinza | ||
| 48 ms ... ascensão ↗ e queda ↘ combinadas | ↗ 26 ms ascensão | 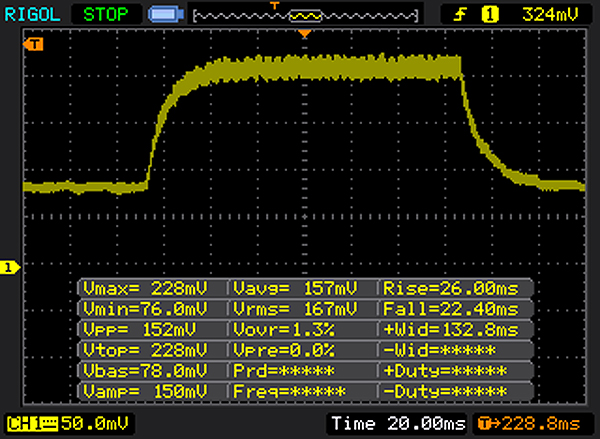 |
| ↘ 22 ms queda | ||
| A tela mostra taxas de resposta lentas em nossos testes e será insatisfatória para os jogadores. Em comparação, todos os dispositivos testados variam de 0.165 (mínimo) a 636 (máximo) ms. » 82 % de todos os dispositivos são melhores. Isso significa que o tempo de resposta medido é pior que a média de todos os dispositivos testados (31.1 ms). | ||
| Cinebench R10 | |
| Rendering Multiple CPUs 32Bit | |
| HP Spectre x360 13-ac033dx | |
| Dell XPS 13-9365 2-in-1 | |
| Dell XPS 13 9365-4537 2-in-1 | |
| Rendering Single 32Bit | |
| HP Spectre x360 13-ac033dx | |
| Dell XPS 13-9365 2-in-1 | |
| Dell XPS 13 9365-4537 2-in-1 | |
| Geekbench 3 | |
| 32 Bit Multi-Core Score | |
| Dell XPS 13 9365-4537 2-in-1 | |
| 32 Bit Single-Core Score | |
| Dell XPS 13 9365-4537 2-in-1 | |
| Geekbench 4.0 | |
| 64 Bit Multi-Core Score | |
| Dell XPS 13 9365-4537 2-in-1 | |
| 64 Bit Single-Core Score | |
| Dell XPS 13 9365-4537 2-in-1 | |
| Geekbench 4.4 | |
| 64 Bit Multi-Core Score | |
| Dell XPS 13 9365-4537 2-in-1 | |
| 64 Bit Single-Core Score | |
| Dell XPS 13 9365-4537 2-in-1 | |
| JetStream 1.1 - 1.1 Total | |
| Lenovo Yoga 910-13IKB-80VF004CGE | |
| HP Spectre x360 13-ac033dx | |
| Dell XPS 13 9365-4537 2-in-1 | |
| Dell XPS 13-9365 2-in-1 | |
| PCMark 8 Home Score Accelerated v2 | 2706 pontos | |
Ajuda | ||
| PCMark 8 - Home Score Accelerated v2 | |
| Lenovo Yoga 910-13IKB-80VF004CGE | |
| Dell XPS 13-9365 2-in-1 | |
| HP Spectre x360 13-ac033dx | |
| Dell XPS 13 9365-4537 2-in-1 | |

| Dell XPS 13 9365-4537 2-in-1 Toshiba NVMe THNSN5256GPUK | Dell XPS 13-9365 2-in-1 Toshiba NVMe THNSN5256GPUK | HP Spectre x360 13-ac033dx Samsung PM961 NVMe MZVLW512HMJP | Lenovo Yoga 910-13IKB-80VF004CGE Samsung PM951 NVMe MZVLV512 | |
|---|---|---|---|---|
| CrystalDiskMark 3.0 | 31% | 114% | 58% | |
| Read Seq (MB/s) | 1159 | 1206 4% | 2065 78% | 1412 22% |
| Write Seq (MB/s) | 324.1 | 629 94% | 1550 378% | 578 78% |
| Read 512 (MB/s) | 528 | 966 83% | 865 64% | 701 33% |
| Write 512 (MB/s) | 373.7 | 410.7 10% | 1229 229% | 580 55% |
| Read 4k (MB/s) | 29.26 | 32.93 13% | 54.7 87% | 43.5 49% |
| Write 4k (MB/s) | 108.3 | 121.2 12% | 139.4 29% | 159.7 47% |
| Read 4k QD32 (MB/s) | 335.9 | 411 22% | 518 54% | 570 70% |
| Write 4k QD32 (MB/s) | 234.1 | 250.2 7% | 225.6 -4% | 488.7 109% |
| 3DMark 11 Performance | 1272 pontos | |
Ajuda | ||
| 3DMark 11 - 1280x720 Performance GPU | |
| Lenovo Yoga 910-13IKB-80VF004CGE | |
| HP Spectre x360 13-ac033dx | |
| Dell XPS 13-9365 2-in-1 | |
| Dell XPS 13 9365-4537 2-in-1 | |
| baixo | média | alto | ultra | |
|---|---|---|---|---|
| Diablo III (2012) | 55.8 | 36.3 | 30.1 | 17.8 |
| Counter-Strike: GO (2012) | 99.9 | 57.3 | 39.5 | 21.9 |
| BioShock Infinite (2013) | 31.4 | 20.4 | 19.3 | 6.1 |
| GRID: Autosport (2014) | 74.9 | 24.6 | ||
| F1 2014 (2014) | 55 | 34 | ||
| GTA V (2015) | 19.9 | 16.7 | ||
| World of Warships (2015) | 49.9 | 30.2 | ||
| Anno 2205 (2015) | 15.9 | 10.2 | ||
| Rainbow Six Siege (2015) | 24.6 | 16.2 | ||
| Far Cry Primal (2016) | 12 | 5 | ||
| Mirror's Edge Catalyst (2016) | 15.5 | 9 | ||
| Civilization 6 (2016) | 20.6 | 9.2 | ||
| Farming Simulator 17 (2016) | 70.2 | 45.1 | ||
| Titanfall 2 (2016) | 19.9 | 15.9 | ||
| Resident Evil 7 (2017) | 22.2 | 9.5 | ||
| For Honor (2017) | 16.8 | 6.2 | ||
| Ghost Recon Wildlands (2017) | 9.8 | 4 | ||
| Warhammer 40.000: Dawn of War III (2017) | 11.6 | 4 | ||
| Prey (2017) | 14.3 | 6.6 |
(±) A temperatura máxima no lado superior é 43.1 °C / 110 F, em comparação com a média de 35.4 °C / 96 F , variando de 19.6 a 60 °C para a classe Convertible.
(±) A parte inferior aquece até um máximo de 41.7 °C / 107 F, em comparação com a média de 36.9 °C / 98 F
(+) Em uso inativo, a temperatura média para o lado superior é 22.7 °C / 73 F, em comparação com a média do dispositivo de 30.3 °C / ### class_avg_f### F.
(+) Os apoios para as mãos e o touchpad são mais frios que a temperatura da pele, com um máximo de 26.8 °C / 80.2 F e, portanto, são frios ao toque.
(±) A temperatura média da área do apoio para as mãos de dispositivos semelhantes foi 28 °C / 82.4 F (+1.2 °C / 2.2 F).
Dell XPS 13 9365-4537 2-in-1 análise de áudio
(±) | o volume do alto-falante é médio, mas bom (###valor### dB)
Graves 100 - 315Hz
(±) | graves reduzidos - em média 14.8% menor que a mediana
(+) | o baixo é linear (4.5% delta para a frequência anterior)
Médios 400 - 2.000 Hz
(±) | médios mais altos - em média 5.2% maior que a mediana
(+) | médios são lineares (5.1% delta para frequência anterior)
Altos 2 - 16 kHz
(+) | agudos equilibrados - apenas 3.4% longe da mediana
(±) | a linearidade dos máximos é média (7.4% delta para frequência anterior)
Geral 100 - 16.000 Hz
(±) | a linearidade do som geral é média (17.4% diferença em relação à mediana)
Comparado com a mesma classe
» 33% de todos os dispositivos testados nesta classe foram melhores, 8% semelhantes, 59% piores
» O melhor teve um delta de 6%, a média foi 20%, o pior foi 57%
Comparado com todos os dispositivos testados
» 33% de todos os dispositivos testados foram melhores, 8% semelhantes, 59% piores
» O melhor teve um delta de 4%, a média foi 24%, o pior foi 134%
Apple MacBook 12 (Early 2016) 1.1 GHz análise de áudio
(+) | os alto-falantes podem tocar relativamente alto (###valor### dB)
Graves 100 - 315Hz
(±) | graves reduzidos - em média 11.3% menor que a mediana
(±) | a linearidade dos graves é média (14.2% delta para a frequência anterior)
Médios 400 - 2.000 Hz
(+) | médios equilibrados - apenas 2.4% longe da mediana
(+) | médios são lineares (5.5% delta para frequência anterior)
Altos 2 - 16 kHz
(+) | agudos equilibrados - apenas 2% longe da mediana
(+) | os máximos são lineares (4.5% delta da frequência anterior)
Geral 100 - 16.000 Hz
(+) | o som geral é linear (10.2% diferença em relação à mediana)
Comparado com a mesma classe
» 7% de todos os dispositivos testados nesta classe foram melhores, 2% semelhantes, 91% piores
» O melhor teve um delta de 5%, a média foi 18%, o pior foi 53%
Comparado com todos os dispositivos testados
» 5% de todos os dispositivos testados foram melhores, 1% semelhantes, 94% piores
» O melhor teve um delta de 4%, a média foi 24%, o pior foi 134%
| desligado | |
| Ocioso | |
| Carga |
|
Key:
min: | |
| Battery Runtime - WiFi Websurfing | |
| Dell XPS 13-9365 2-in-1 | |
| Lenovo Yoga 910-13IKB-80VF004CGE | |
| HP Spectre x360 13-ac033dx | |
| Dell XPS 13 9365-4537 2-in-1 | |
Pro
Contra
O modelo Dell XPS 13 que estamos testando, tem um processador Core i5-7Y54 abordo. Este não é de modo algum inferior ao processador Core-i7 nominalmente mais forte que é incorporado no modelo irmão que já testamos. Dado que ambas as CPUs dificilmente atingem suas velocidades máximas devido ao resfriamento passivo, seus resultados nos testes de CPU estão, em grande parte, no mesmo nível. Apenas uma ligeira vantagem que dificilmente pode ser notada durante a operação diária, pode ser atestada para o Core i7. A taxa extra cobrada pelo processador Core-i7 realmente não vale a pena.
Como não há ventoinha, o computador sempre funciona silenciosamente. Mesmo assim, não esquenta muito. Um SSD NVMe garante um sistema veloz. Substituir o SSD pode ser possível. Para fazer isso, você precisaria remover a parte inferior da carcaça do computador. O teclado do conversível deixou uma boa impressão geral.
A tela IPS agrada com ângulos de visão estáveis e um contraste muito bom. O valor do brilho também é favorável, embora poderia ser ainda mais alto, dado que o dispositivo será usado em vários locais sob várias condições de iluminação.
A nítida tela QHD + tem um efeito negativo sobre a duração da bateria.
Em nosso teste WLAN praticamente relevante, a duração da bateria diminui em 5 horas em comparação com o modelo Full HD do XPS 13. Os usuários que precisam de uma duração de bateria que seja o mais longa possível devem escolher o modelo Full HD.
Dell XPS 13 9365-4537 2-in-1
- 05/26/2017 v6 (old)
Sascha Mölck