Breve Análise do Conversível HP Spectre x360 13 (7500U, 4K UHD)
| Networking | |
| iperf3 transmit AX12 | |
| Dell XPS 15 9560 (i7-7700HQ, UHD) | |
| Dell XPS 13-9365 2-in-1 | |
| HP Spectre x360 13-ac033dx | |
| iperf3 receive AX12 | |
| Dell XPS 15 9560 (i7-7700HQ, UHD) | |
| HP Spectre x360 13-ac033dx | |
| Dell XPS 13-9365 2-in-1 | |
| |||||||||||||||||||||||||
iluminação: 83 %
iluminação com acumulador: 302.6 cd/m²
Contraste: 1210:1 (Preto: 0.25 cd/m²)
ΔE ColorChecker Calman: 2.4 | ∀{0.5-29.43 Ø4.71}
ΔE Greyscale Calman: 2.8 | ∀{0.09-98 Ø4.96}
97.1% sRGB (Argyll 1.6.3 3D)
65.5% AdobeRGB 1998 (Argyll 1.6.3 3D)
71.1% AdobeRGB 1998 (Argyll 3D)
96.8% sRGB (Argyll 3D)
69.4% Display P3 (Argyll 3D)
Gamma: 2.2
CCT: 6333 K
| HP Spectre x360 13-ac033dx LG Philips LGD054D, IPS, 13.3", 3840x2160 | Apple MacBook Pro 13 2016 (2.9 GHz) APPA033, , 13.3", 2560x1600 | Dell XPS 13-9365 2-in-1 IPS, 13.3", 1920x1080 | Lenovo Yoga 910-13IKB-80VF004CGE AU Optronics AUO323D / B139HAN03.2, IPS, 13.9", 3840x2160 | HP Spectre 13-v131ng CMN1374, IPS UWVA, 13.3", 1920x1080 | HP Spectre x360 13-w023dx Chi Mei CMN1367, IPS, 13.3", 1920x1080 | |
|---|---|---|---|---|---|---|
| Display | 23% | -30% | -9% | -8% | -7% | |
| Display P3 Coverage (%) | 69.4 | 99.2 43% | 47.32 -32% | 62.2 -10% | 64.6 -7% | 65.4 -6% |
| sRGB Coverage (%) | 96.8 | 99.9 3% | 71.1 -27% | 90.1 -7% | 88.8 -8% | 90.4 -7% |
| AdobeRGB 1998 Coverage (%) | 71.1 | 87.6 23% | 48.83 -31% | 63.5 -11% | 64.8 -9% | 65.8 -7% |
| Response Times | -39% | -8% | 8% | -7% | 17% | |
| Response Time Grey 50% / Grey 80% * (ms) | 42 ? | 47.2 ? -12% | 48 ? -14% | 46 ? -10% | 46 ? -10% | 33.2 ? 21% |
| Response Time Black / White * (ms) | 32 ? | 53 ? -66% | 32.8 ? -2% | 24 ? 25% | 33 ? -3% | 28 ? 12% |
| PWM Frequency (Hz) | 1042 ? | |||||
| Screen | 19% | -50% | -58% | -33% | -52% | |
| Brightness middle (cd/m²) | 302.6 | 569 88% | 322.6 7% | 348 15% | 404 34% | 334.6 11% |
| Brightness (cd/m²) | 282 | 542 92% | 306 9% | 310 10% | 382 35% | 319 13% |
| Brightness Distribution (%) | 83 | 90 8% | 91 10% | 80 -4% | 91 10% | 90 8% |
| Black Level * (cd/m²) | 0.25 | 0.56 -124% | 0.19 24% | 0.25 -0% | 0.35 -40% | 0.336 -34% |
| Contrast (:1) | 1210 | 1016 -16% | 1698 40% | 1392 15% | 1154 -5% | 996 -18% |
| Colorchecker dE 2000 * | 2.4 | 1.4 42% | 7.7 -221% | 7.86 -228% | 5.37 -124% | 6.21 -159% |
| Colorchecker dE 2000 max. * | 4.9 | 2.9 41% | 11.1 -127% | 13.43 -174% | 9.46 -93% | 12 -145% |
| Greyscale dE 2000 * | 2.8 | 1.8 36% | 7.9 -182% | 8.25 -195% | 6.44 -130% | 7.71 -175% |
| Gamma | 2.2 100% | 2.16 102% | 2.88 76% | 2.05 107% | 2.52 87% | 2.36 93% |
| CCT | 6333 103% | 6877 95% | 7044 92% | 6834 95% | 6738 96% | 6458 101% |
| Color Space (Percent of AdobeRGB 1998) (%) | 65.5 | 78.4 20% | 44.1 -33% | 58 -11% | 58 -11% | 58.6 -11% |
| Color Space (Percent of sRGB) (%) | 97.1 | 99.3 2% | 69.9 -28% | 90 -7% | 89 -8% | 90 -7% |
| Média Total (Programa/Configurações) | 1% /
12% | -29% /
-40% | -20% /
-39% | -16% /
-25% | -14% /
-34% |
* ... menor é melhor
Exibir tempos de resposta
| ↔ Tempo de resposta preto para branco | ||
|---|---|---|
| 32 ms ... ascensão ↗ e queda ↘ combinadas | ↗ 18 ms ascensão | 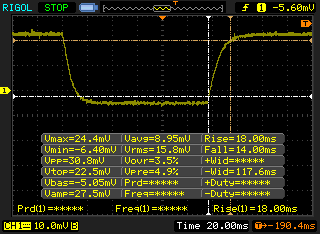 |
| ↘ 14 ms queda | ||
| A tela mostra taxas de resposta lentas em nossos testes e será insatisfatória para os jogadores. Em comparação, todos os dispositivos testados variam de 0.1 (mínimo) a 240 (máximo) ms. » 86 % de todos os dispositivos são melhores. Isso significa que o tempo de resposta medido é pior que a média de todos os dispositivos testados (19.8 ms). | ||
| ↔ Tempo de resposta 50% cinza a 80% cinza | ||
| 42 ms ... ascensão ↗ e queda ↘ combinadas | ↗ 20.8 ms ascensão | 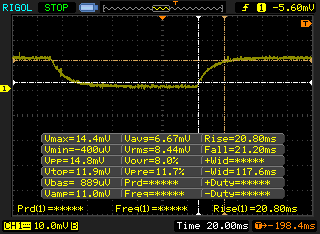 |
| ↘ 21.2 ms queda | ||
| A tela mostra taxas de resposta lentas em nossos testes e será insatisfatória para os jogadores. Em comparação, todos os dispositivos testados variam de 0.165 (mínimo) a 636 (máximo) ms. » 67 % de todos os dispositivos são melhores. Isso significa que o tempo de resposta medido é pior que a média de todos os dispositivos testados (31 ms). | ||
Cintilação da tela / PWM (modulação por largura de pulso)
| Tela tremeluzindo / PWM não detectado | 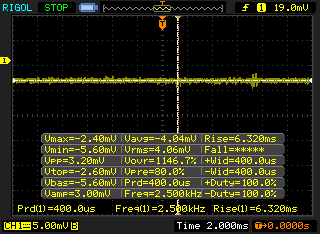 | ||
[pwm_comparison] Em comparação: 52 % de todos os dispositivos testados não usam PWM para escurecer a tela. Se PWM foi detectado, uma média de 7757 (mínimo: 5 - máximo: 343500) Hz foi medida. | |||
| wPrime 2.10 - 1024m | |
| Dell XPS 13-9365 2-in-1 | |
| Dell XPS 13 9360-4764 | |
| Dell Latitude 7280 | |
| HP Spectre x360 13-ac033dx | |
* ... menor é melhor
| PCMark 8 | |
| Home Score Accelerated v2 | |
| HP Spectre 13-v131ng | |
| Apple MacBook Air 13 inch 2015-03 | |
| Lenovo Yoga 910-13IKB-80VF004CGE | |
| Dell XPS 13-9365 2-in-1 | |
| HP Spectre x360 13-ac033dx | |
| Work Score Accelerated v2 | |
| HP Spectre 13-v131ng | |
| Dell XPS 13-9365 2-in-1 | |
| Apple MacBook Air 13 inch 2015-03 | |
| HP Spectre x360 13-ac033dx | |
| Creative Score Accelerated v2 | |
| HP Spectre 13-v131ng | |
| Apple MacBook Air 13 inch 2015-03 | |
| HP Spectre x360 13-ac033dx | |
| Dell XPS 13-9365 2-in-1 | |
| PCMark 8 Home Score Accelerated v2 | 3023 pontos | |
| PCMark 8 Creative Score Accelerated v2 | 4432 pontos | |
| PCMark 8 Work Score Accelerated v2 | 3706 pontos | |
Ajuda | ||
| HP Spectre x360 13-ac033dx Samsung PM961 NVMe MZVLW512HMJP | Apple MacBook Air 13 inch 2015-03 Apple SSD SD0256F | Dell XPS 13-9365 2-in-1 Toshiba NVMe THNSN5256GPUK | Lenovo Yoga 910-13IKB-80VF004CGE Samsung PM951 NVMe MZVLV512 | HP Spectre 13-v131ng Samsung PM961 NVMe MZVLW512HMJP | |
|---|---|---|---|---|---|
| CrystalDiskMark 3.0 | -25% | -27% | -6% | -4% | |
| Read Seq (MB/s) | 2065 | 1352 -35% | 1206 -42% | 1412 -32% | 1090 -47% |
| Write Seq (MB/s) | 1550 | 1111 -28% | 629 -59% | 578 -63% | 1088 -30% |
| Read 512 (MB/s) | 865 | 880 2% | 966 12% | 701 -19% | 753 -13% |
| Write 512 (MB/s) | 1229 | 1023 -17% | 410.7 -67% | 580 -53% | 911 -26% |
| Read 4k (MB/s) | 54.7 | 21.93 -60% | 32.93 -40% | 43.5 -20% | 57.5 5% |
| Write 4k (MB/s) | 139.4 | 30.94 -78% | 121.2 -13% | 159.7 15% | 140.2 1% |
| Read 4k QD32 (MB/s) | 518 | 339.5 -34% | 411 -21% | 570 10% | 497.1 -4% |
| Write 4k QD32 (MB/s) | 225.6 | 342.9 52% | 250.2 11% | 488.7 117% | 416 84% |

| 3DMark | |
| 1280x720 Cloud Gate Standard Graphics | |
| Apple MacBook Pro 13 2016 (2.9 GHz) | |
| Lenovo ThinkPad X1 Carbon 2017-20HQS03P00 | |
| Dell XPS 13-9365 2-in-1 | |
| Asus X302UV-FN016T | |
| HP Spectre x360 13-ac033dx | |
| HP EliteBook 820 G4 Z2V72ET | |
| Lenovo ThinkPad Yoga 370-20JJS00100 | |
| Acer TravelMate P249-M-5452 | |
| 1920x1080 Fire Strike Graphics | |
| Apple MacBook Pro 13 2016 (2.9 GHz) | |
| Asus X302UV-FN016T | |
| Lenovo ThinkPad X1 Carbon 2017-20HQS03P00 | |
| HP Spectre x360 13-ac033dx | |
| Dell XPS 13-9365 2-in-1 | |
| HP EliteBook 820 G4 Z2V72ET | |
| Lenovo ThinkPad Yoga 370-20JJS00100 | |
| Acer TravelMate P249-M-5452 | |
| 1920x1080 Ice Storm Extreme Graphics | |
| Asus X302UV-FN016T | |
| Dell XPS 13-9365 2-in-1 | |
| HP EliteBook 820 G4 Z2V72ET | |
| HP Spectre x360 13-ac033dx | |
| Acer TravelMate P249-M-5452 | |
| Lenovo ThinkPad Yoga 370-20JJS00100 | |
| 3DMark 11 Performance | 1735 pontos | |
| 3DMark Ice Storm Standard Score | 51912 pontos | |
| 3DMark Cloud Gate Standard Score | 6054 pontos | |
| 3DMark Fire Strike Score | 940 pontos | |
| 3DMark Fire Strike Extreme Score | 434 pontos | |
Ajuda | ||
Barulho
| Ocioso |
| 28.7 / 34.2 / 35.8 dB |
| Carga |
| 35.8 / 39.6 dB |
 | ||
30 dB silencioso 40 dB(A) audível 50 dB(A) ruidosamente alto |
||
min: | ||
| HP Spectre x360 13-ac033dx HD Graphics 620, i7-7500U, Samsung PM961 NVMe MZVLW512HMJP | Apple MacBook Pro 13 2016 (2.9 GHz) Iris Graphics 550, 6267U, Apple SSD AP0256 | Dell XPS 13-9365 2-in-1 HD Graphics 615, i7-7Y75, Toshiba NVMe THNSN5256GPUK | Lenovo Yoga 910-13IKB-80VF004CGE HD Graphics 620, i7-7500U, Samsung PM951 NVMe MZVLV512 | HP Spectre 13-v131ng HD Graphics 620, i7-7500U, Samsung PM961 NVMe MZVLW512HMJP | |
|---|---|---|---|---|---|
| Noise | 6% | 1% | 0% | ||
| desligado / ambiente * (dB) | 28.7 | 30.2 -5% | 31.7 -10% | 30.4 -6% | |
| Idle Minimum * (dB) | 28.7 | 30.2 -5% | 31.7 -10% | 30.4 -6% | |
| Idle Average * (dB) | 34.2 | 30.2 12% | 31.7 7% | 30.4 11% | |
| Idle Maximum * (dB) | 35.8 | 30.2 16% | 31.7 11% | 30.4 15% | |
| Load Average * (dB) | 35.8 | 33 8% | 38.4 -7% | 40 -12% | |
| Load Maximum * (dB) | 39.6 | 36.2 9% | 34.7 12% | 40 -1% |
* ... menor é melhor
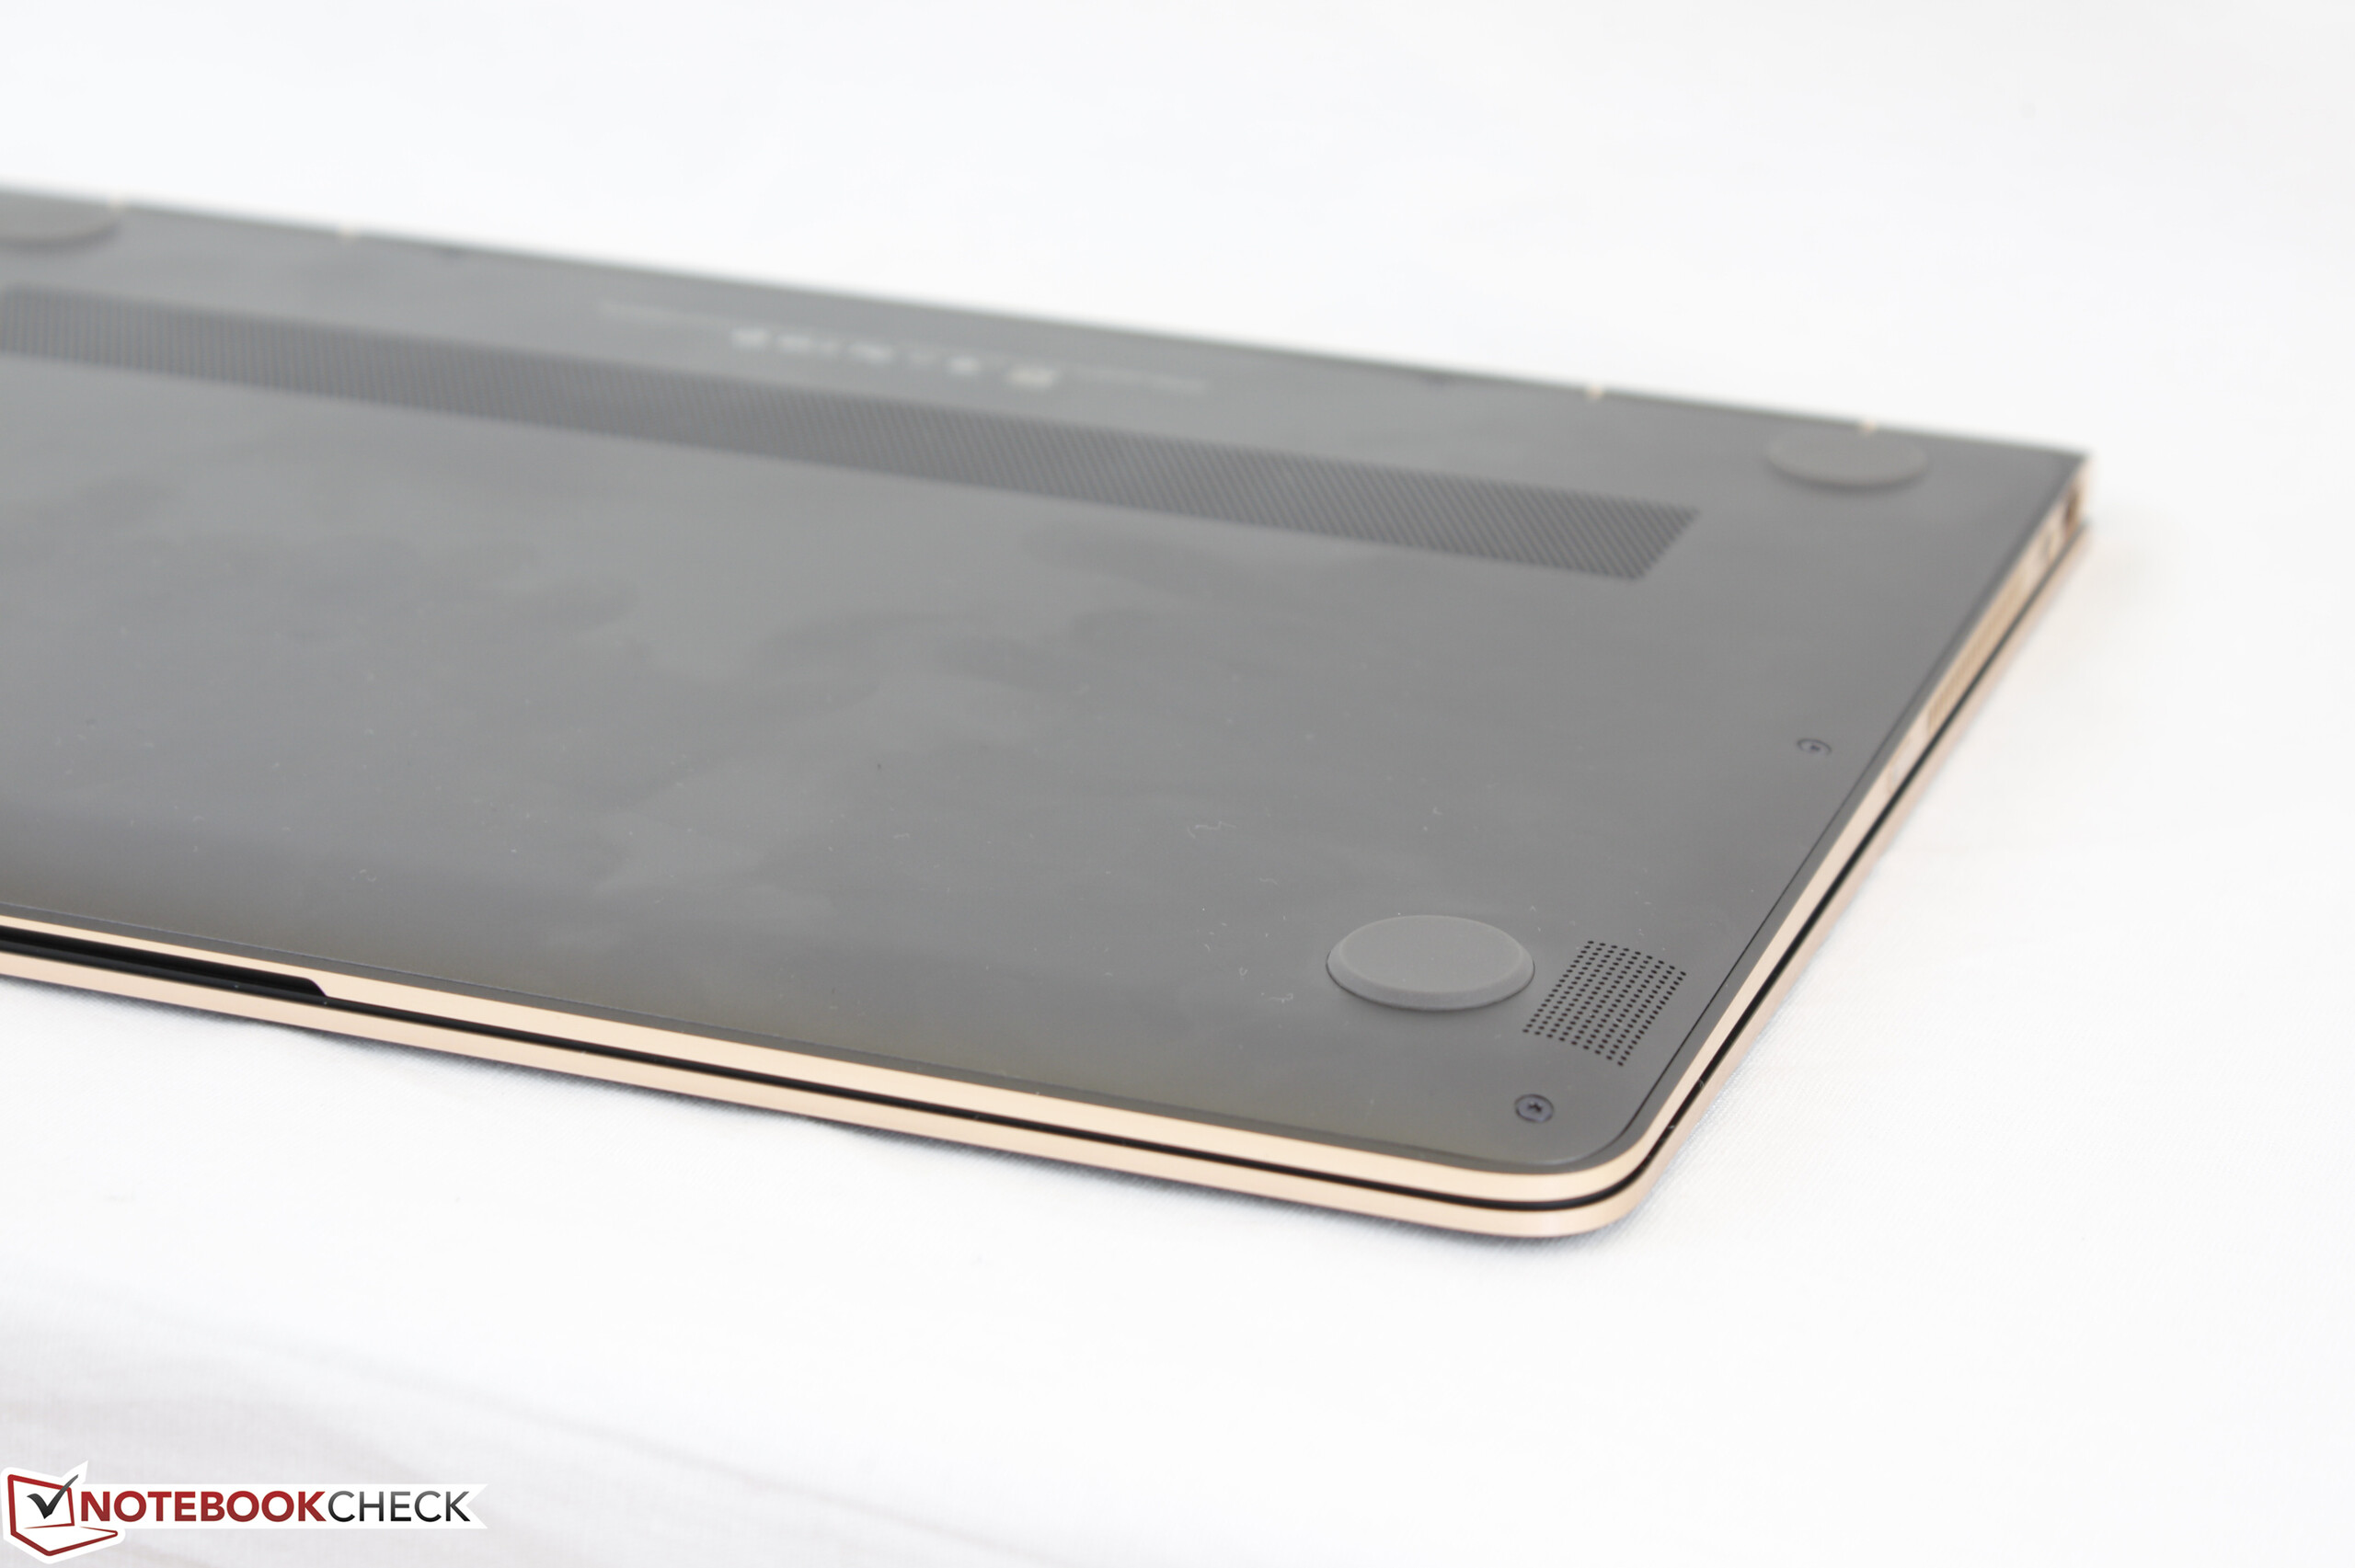
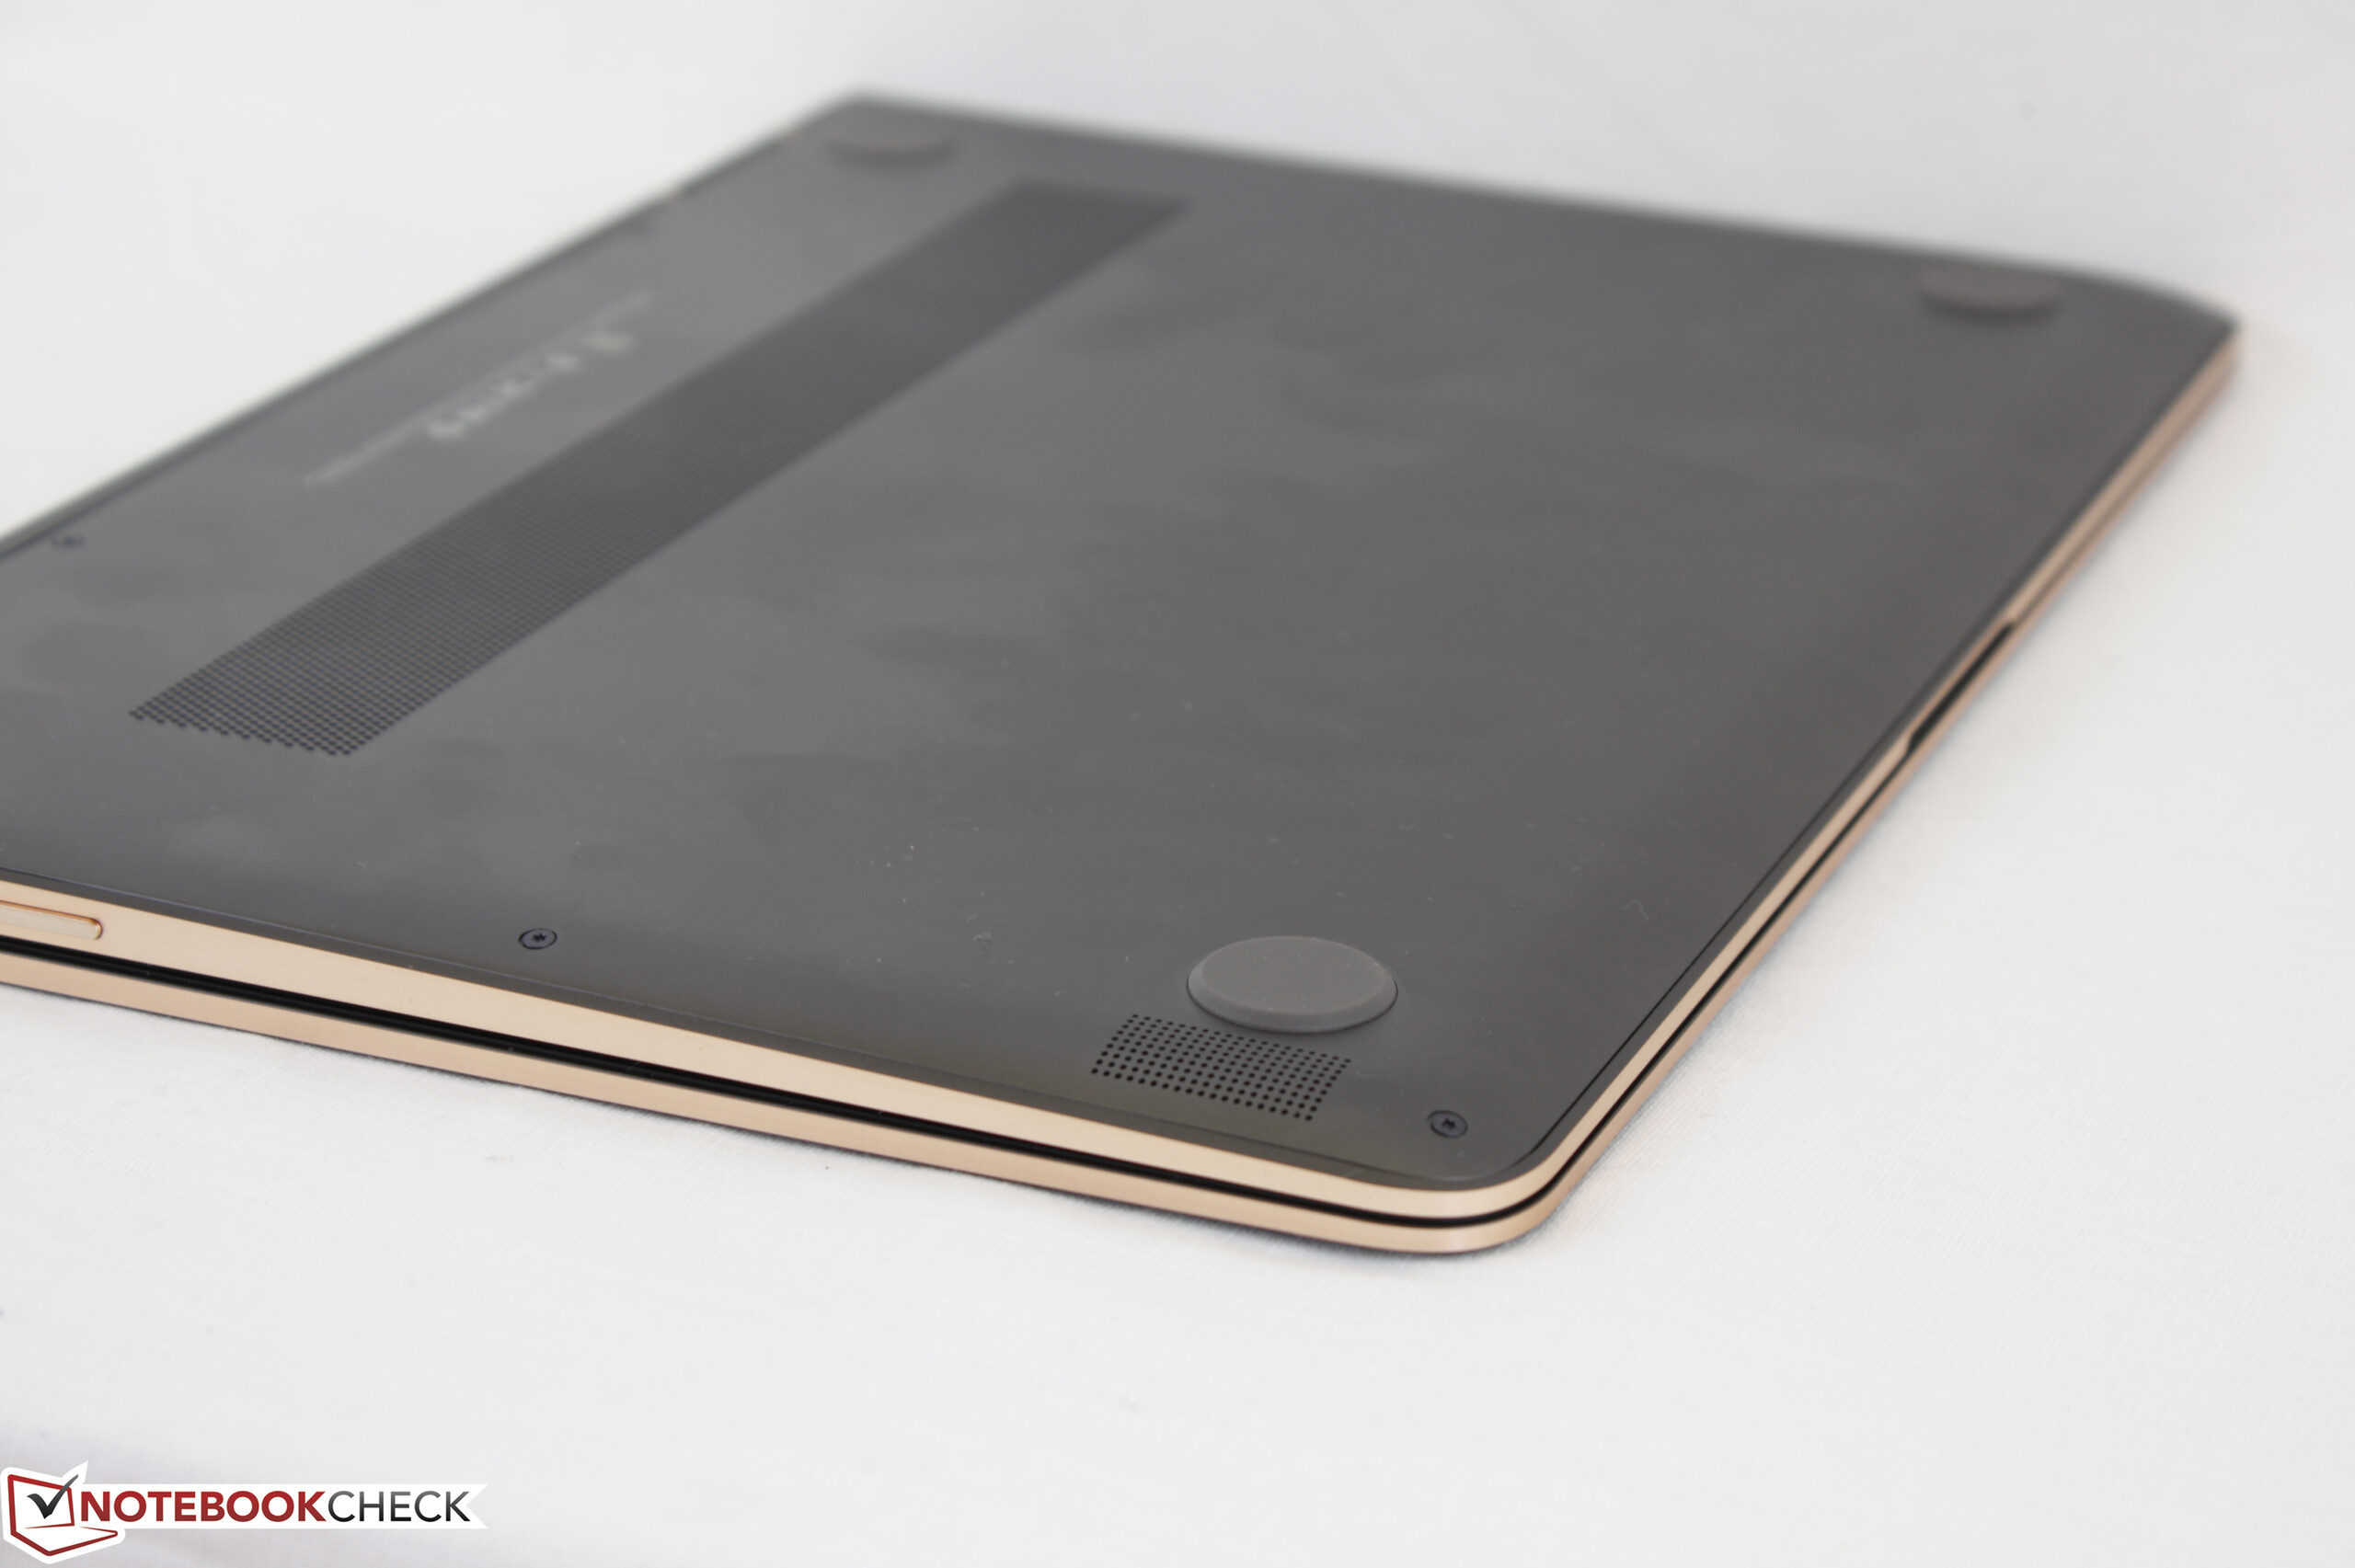
(-) A temperatura máxima no lado superior é 48 °C / 118 F, em comparação com a média de 35.4 °C / 96 F , variando de 19.6 a 60 °C para a classe Convertible.
(-) A parte inferior aquece até um máximo de 45.4 °C / 114 F, em comparação com a média de 36.9 °C / 98 F
(+) Em uso inativo, a temperatura média para o lado superior é 23.7 °C / 75 F, em comparação com a média do dispositivo de 30.3 °C / ### class_avg_f### F.
(+) Os apoios para as mãos e o touchpad são mais frios que a temperatura da pele, com um máximo de 31.6 °C / 88.9 F e, portanto, são frios ao toque.
(-) A temperatura média da área do apoio para as mãos de dispositivos semelhantes foi 28 °C / 82.4 F (-3.6 °C / -6.5 F).
HP Spectre x360 13-ac033dx análise de áudio
(-) | alto-falantes não muito altos (###valor### dB)
Graves 100 - 315Hz
(-) | quase nenhum baixo - em média 16.9% menor que a mediana
(-) | graves não são lineares (15.8% delta para frequência anterior)
Médios 400 - 2.000 Hz
(+) | médios equilibrados - apenas 3% longe da mediana
(+) | médios são lineares (6.9% delta para frequência anterior)
Altos 2 - 16 kHz
(+) | agudos equilibrados - apenas 3% longe da mediana
(±) | a linearidade dos máximos é média (9.5% delta para frequência anterior)
Geral 100 - 16.000 Hz
(±) | a linearidade do som geral é média (23.4% diferença em relação à mediana)
Comparado com a mesma classe
» 71% de todos os dispositivos testados nesta classe foram melhores, 5% semelhantes, 25% piores
» O melhor teve um delta de 6%, a média foi 20%, o pior foi 57%
Comparado com todos os dispositivos testados
» 70% de todos os dispositivos testados foram melhores, 6% semelhantes, 24% piores
» O melhor teve um delta de 4%, a média foi 23%, o pior foi 134%
Apple MacBook 12 (Early 2016) 1.1 GHz análise de áudio
(+) | os alto-falantes podem tocar relativamente alto (###valor### dB)
Graves 100 - 315Hz
(±) | graves reduzidos - em média 11.3% menor que a mediana
(±) | a linearidade dos graves é média (14.2% delta para a frequência anterior)
Médios 400 - 2.000 Hz
(+) | médios equilibrados - apenas 2.4% longe da mediana
(+) | médios são lineares (5.5% delta para frequência anterior)
Altos 2 - 16 kHz
(+) | agudos equilibrados - apenas 2% longe da mediana
(+) | os máximos são lineares (4.5% delta da frequência anterior)
Geral 100 - 16.000 Hz
(+) | o som geral é linear (10.2% diferença em relação à mediana)
Comparado com a mesma classe
» 7% de todos os dispositivos testados nesta classe foram melhores, 2% semelhantes, 90% piores
» O melhor teve um delta de 5%, a média foi 18%, o pior foi 53%
Comparado com todos os dispositivos testados
» 5% de todos os dispositivos testados foram melhores, 1% semelhantes, 94% piores
» O melhor teve um delta de 4%, a média foi 23%, o pior foi 134%
| desligado | |
| Ocioso | |
| Carga |
|
Key:
min: | |
| HP Spectre x360 13-ac033dx i7-7500U, HD Graphics 620, Samsung PM961 NVMe MZVLW512HMJP, IPS, 3840x2160, 13.3" | Apple MacBook Pro 13 2016 (2.9 GHz) 6267U, Iris Graphics 550, Apple SSD AP0256, , 2560x1600, 13.3" | Dell XPS 13-9365 2-in-1 i7-7Y75, HD Graphics 615, Toshiba NVMe THNSN5256GPUK, IPS, 1920x1080, 13.3" | Lenovo Yoga 910-13IKB-80VF004CGE i7-7500U, HD Graphics 620, Samsung PM951 NVMe MZVLV512, IPS, 3840x2160, 13.9" | HP Spectre 13-v131ng i7-7500U, HD Graphics 620, Samsung PM961 NVMe MZVLW512HMJP, IPS UWVA, 1920x1080, 13.3" | HP Spectre x360 13-w023dx i7-7500U, HD Graphics 620, Samsung PM951 NVMe MZVLV512, IPS, 1920x1080, 13.3" | |
|---|---|---|---|---|---|---|
| Power Consumption | -7% | 42% | 17% | 15% | 12% | |
| Idle Minimum * (Watt) | 5.3 | 2.1 60% | 3.1 42% | 4.3 19% | 3.6 32% | 5.5 -4% |
| Idle Average * (Watt) | 9.6 | 7.6 21% | 4.3 55% | 6.3 34% | 6.4 33% | 6.7 30% |
| Idle Maximum * (Watt) | 10.1 | 8.2 19% | 4.9 51% | 9 11% | 9.2 9% | 7.1 30% |
| Load Average * (Watt) | 34.4 | 56.4 -64% | 24.3 29% | 32.7 5% | 34 1% | 33.1 4% |
| Load Maximum * (Watt) | 34.8 | 59.8 -72% | 22.8 34% | 28.8 17% | 34.4 1% | 35.2 -1% |
* ... menor é melhor
| HP Spectre x360 13-ac033dx i7-7500U, HD Graphics 620, 57.8 Wh | Apple MacBook Pro 13 2016 (2.9 GHz) 6267U, Iris Graphics 550, 49.2 Wh | Dell XPS 13-9365 2-in-1 i7-7Y75, HD Graphics 615, 46 Wh | Lenovo Yoga 910-13IKB-80VF004CGE i7-7500U, HD Graphics 620, 78 Wh | HP Spectre 13-v131ng i7-7500U, HD Graphics 620, 38 Wh | HP Spectre x360 13-w023dx i7-7500U, HD Graphics 620, 57.8 Wh | |
|---|---|---|---|---|---|---|
| Duração da bateria | -19% | 34% | 36% | -23% | 21% | |
| Reader / Idle (h) | 13.2 | 16.2 23% | 17.8 35% | 12 -9% | 20.6 56% | |
| WiFi v1.3 (h) | 9 | 9.4 4% | 11.4 27% | 10.7 19% | 6.6 -27% | 9.3 3% |
| Load (h) | 1.9 | 1.1 -42% | 2.9 53% | 2.9 53% | 1.3 -32% | 2 5% |
Pro
Contra
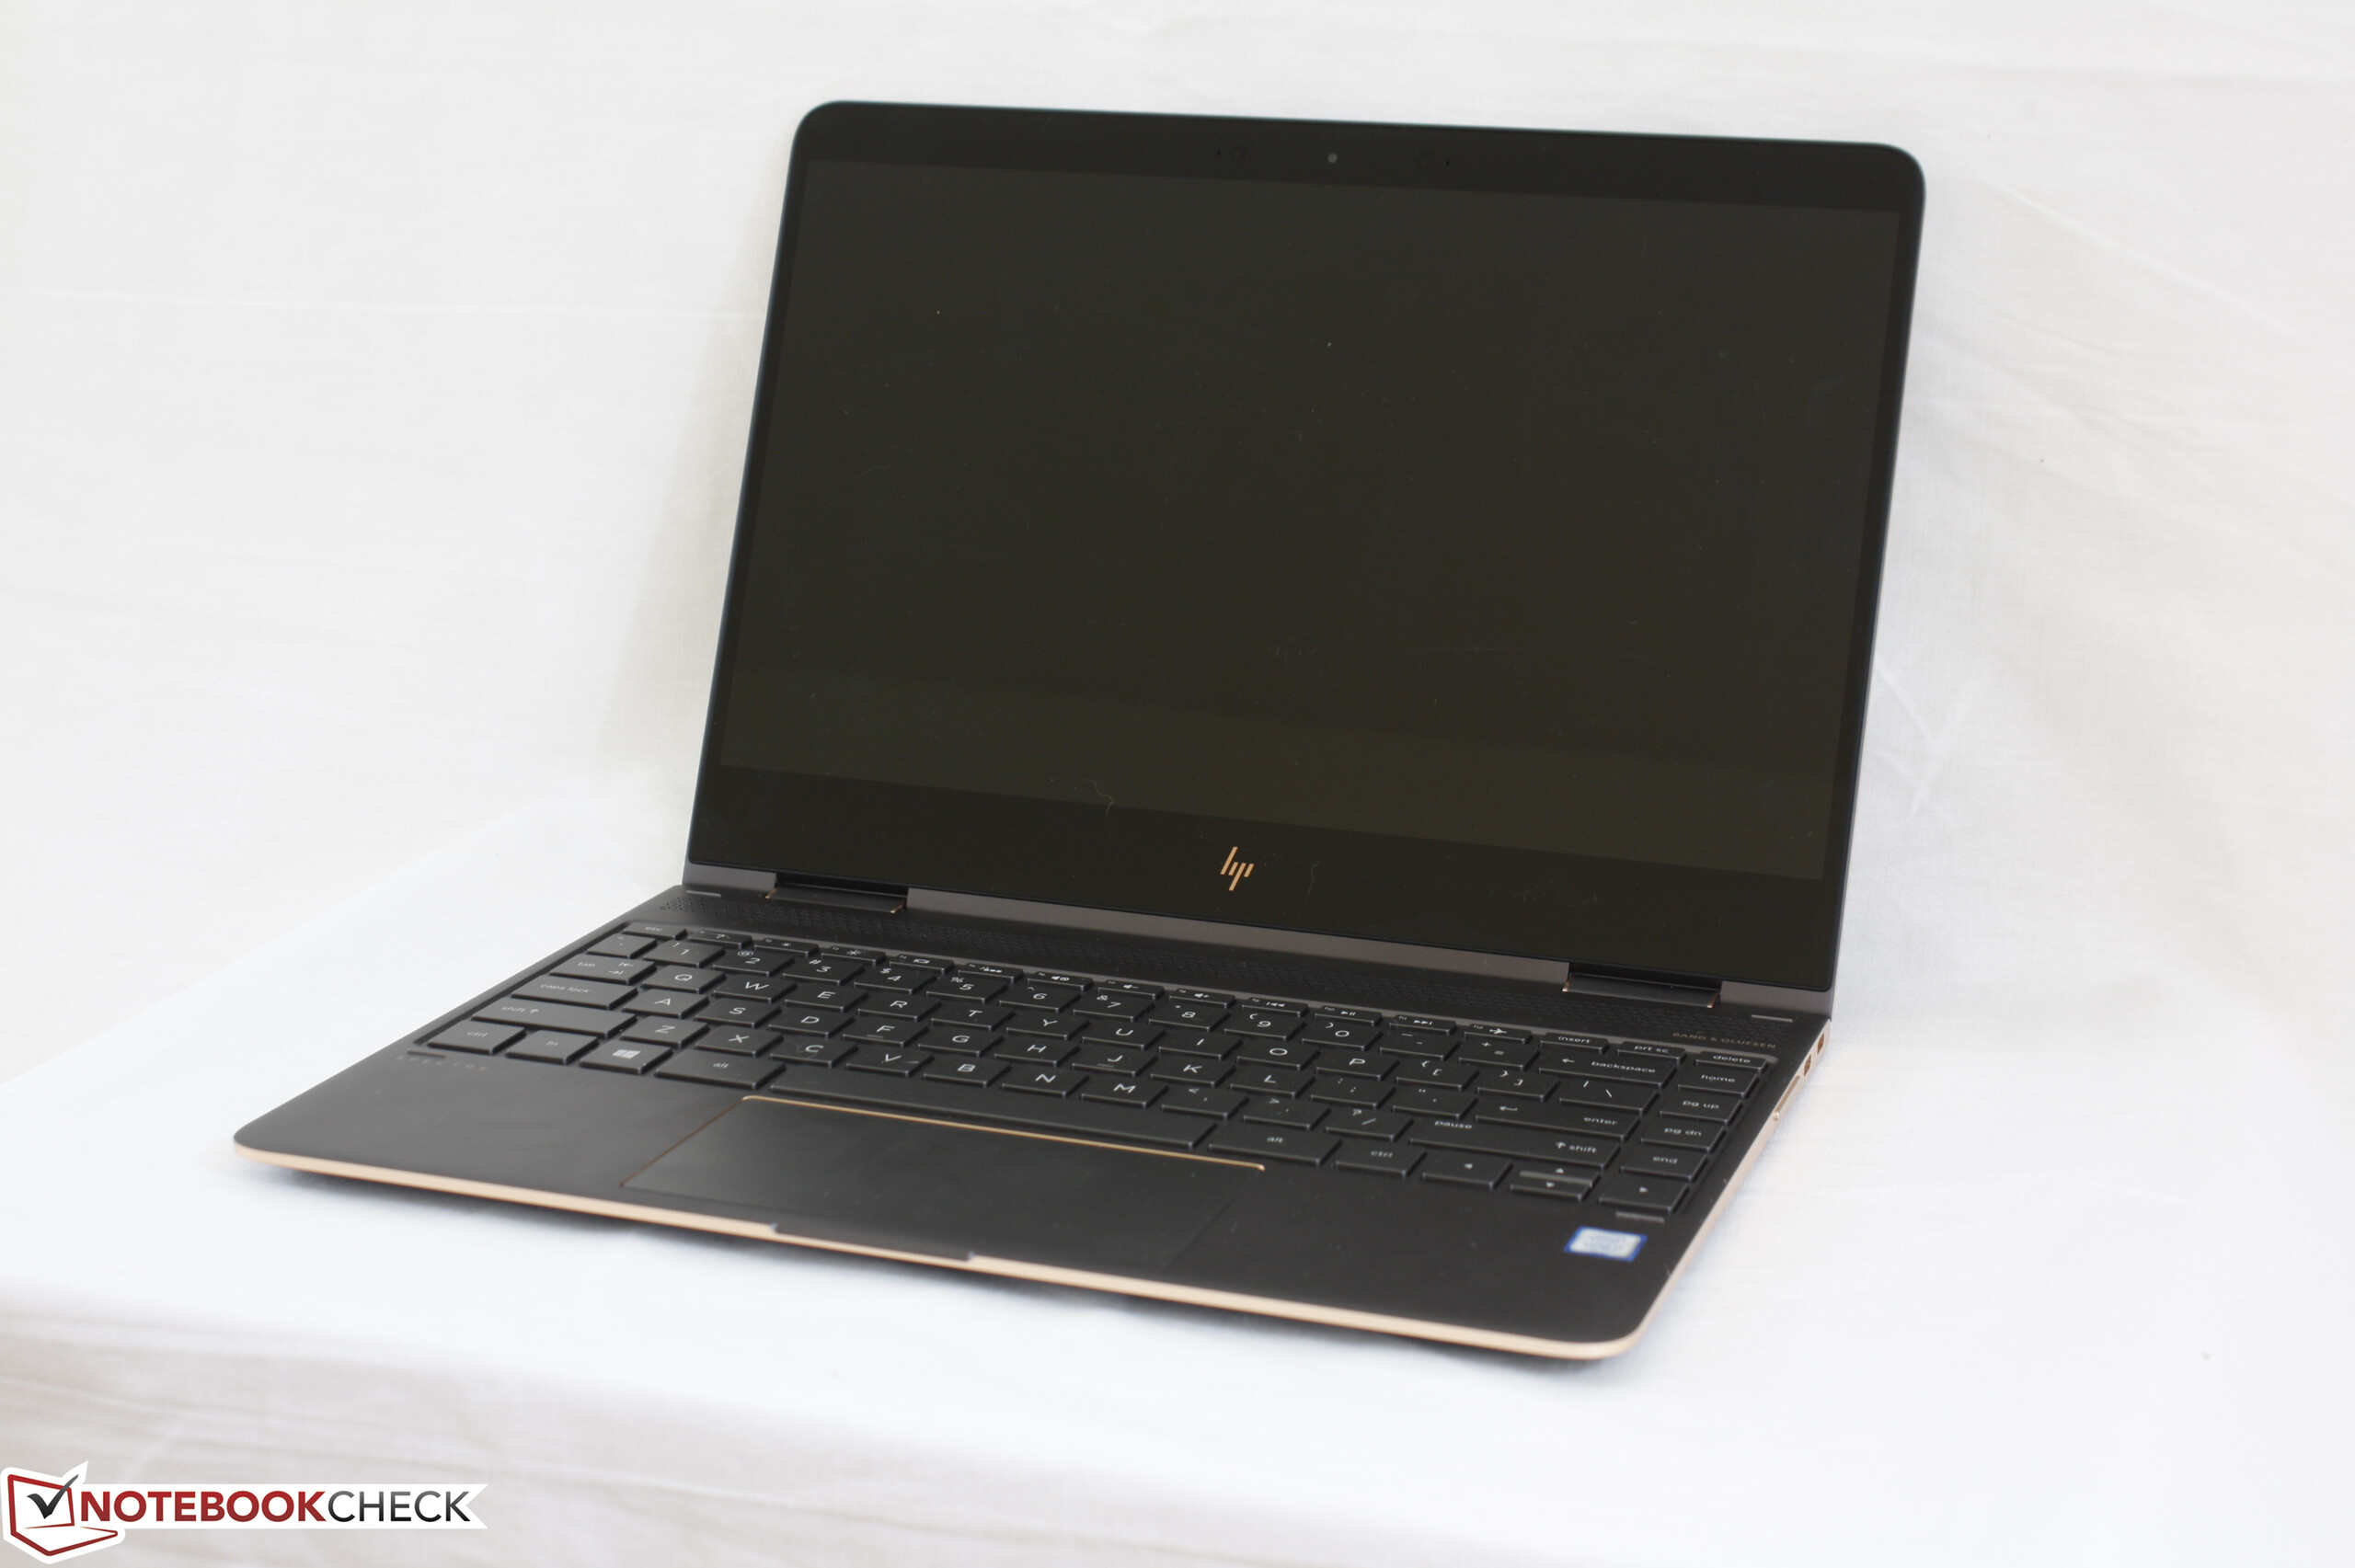
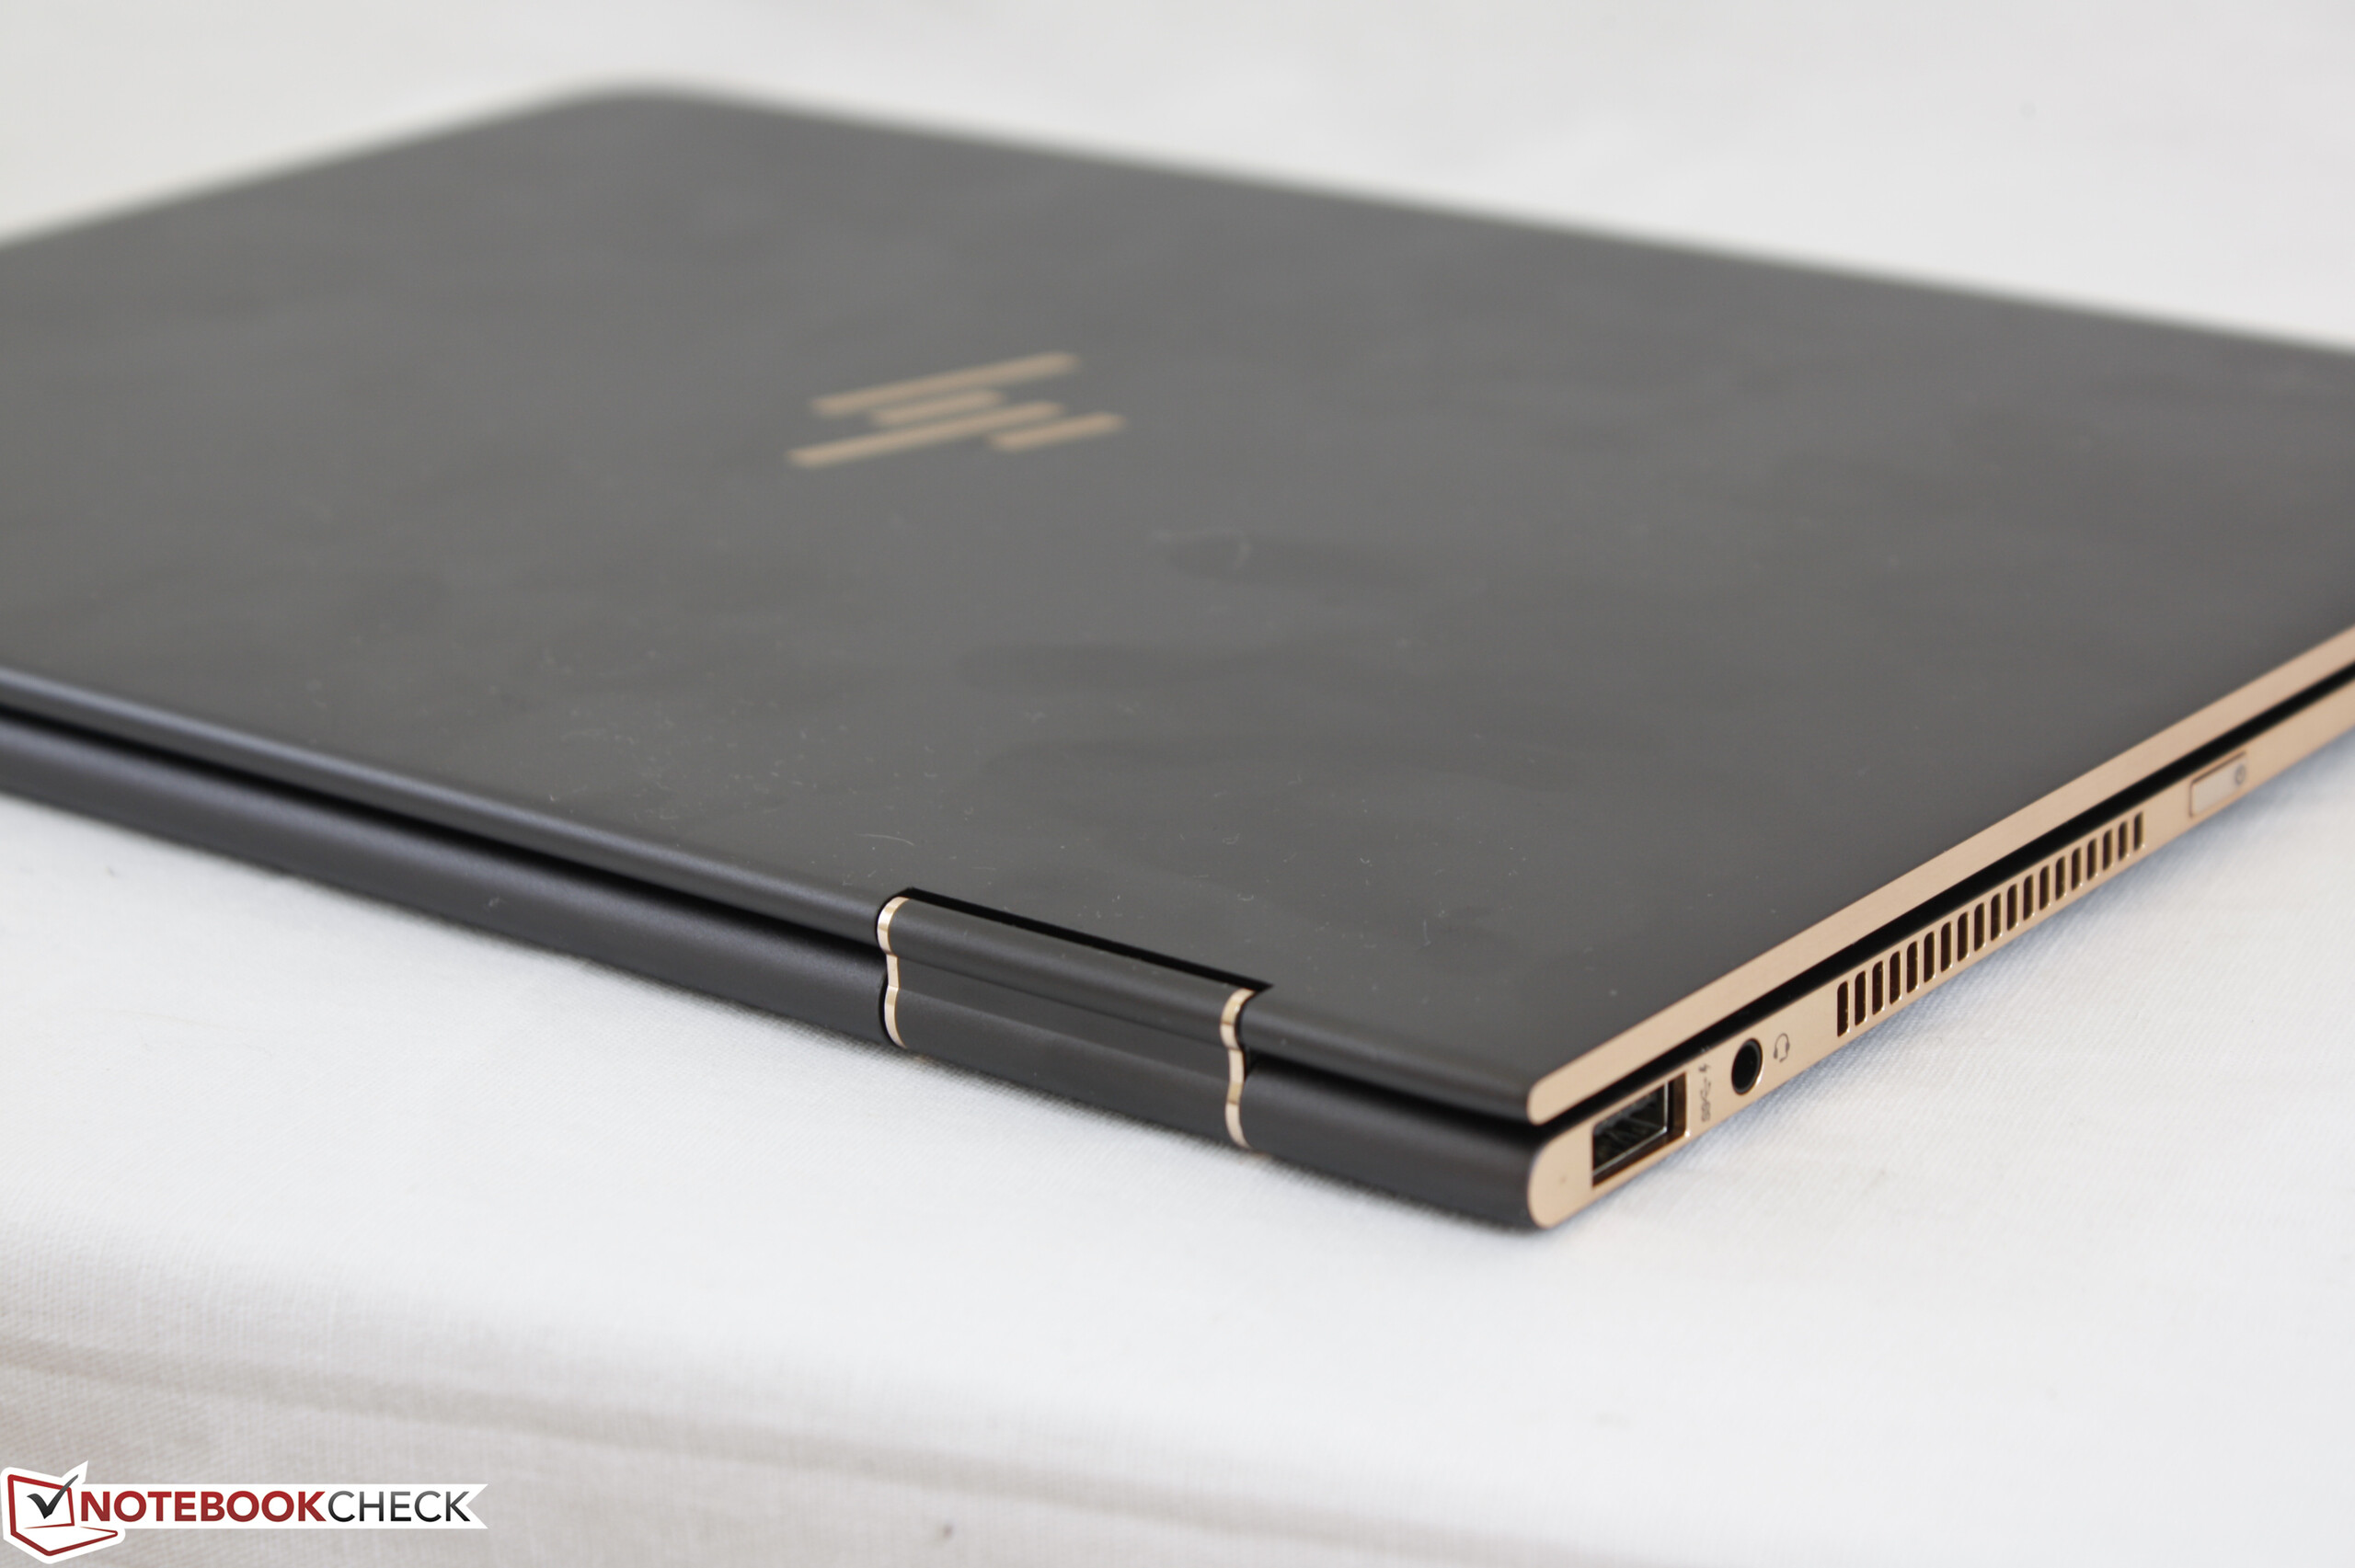
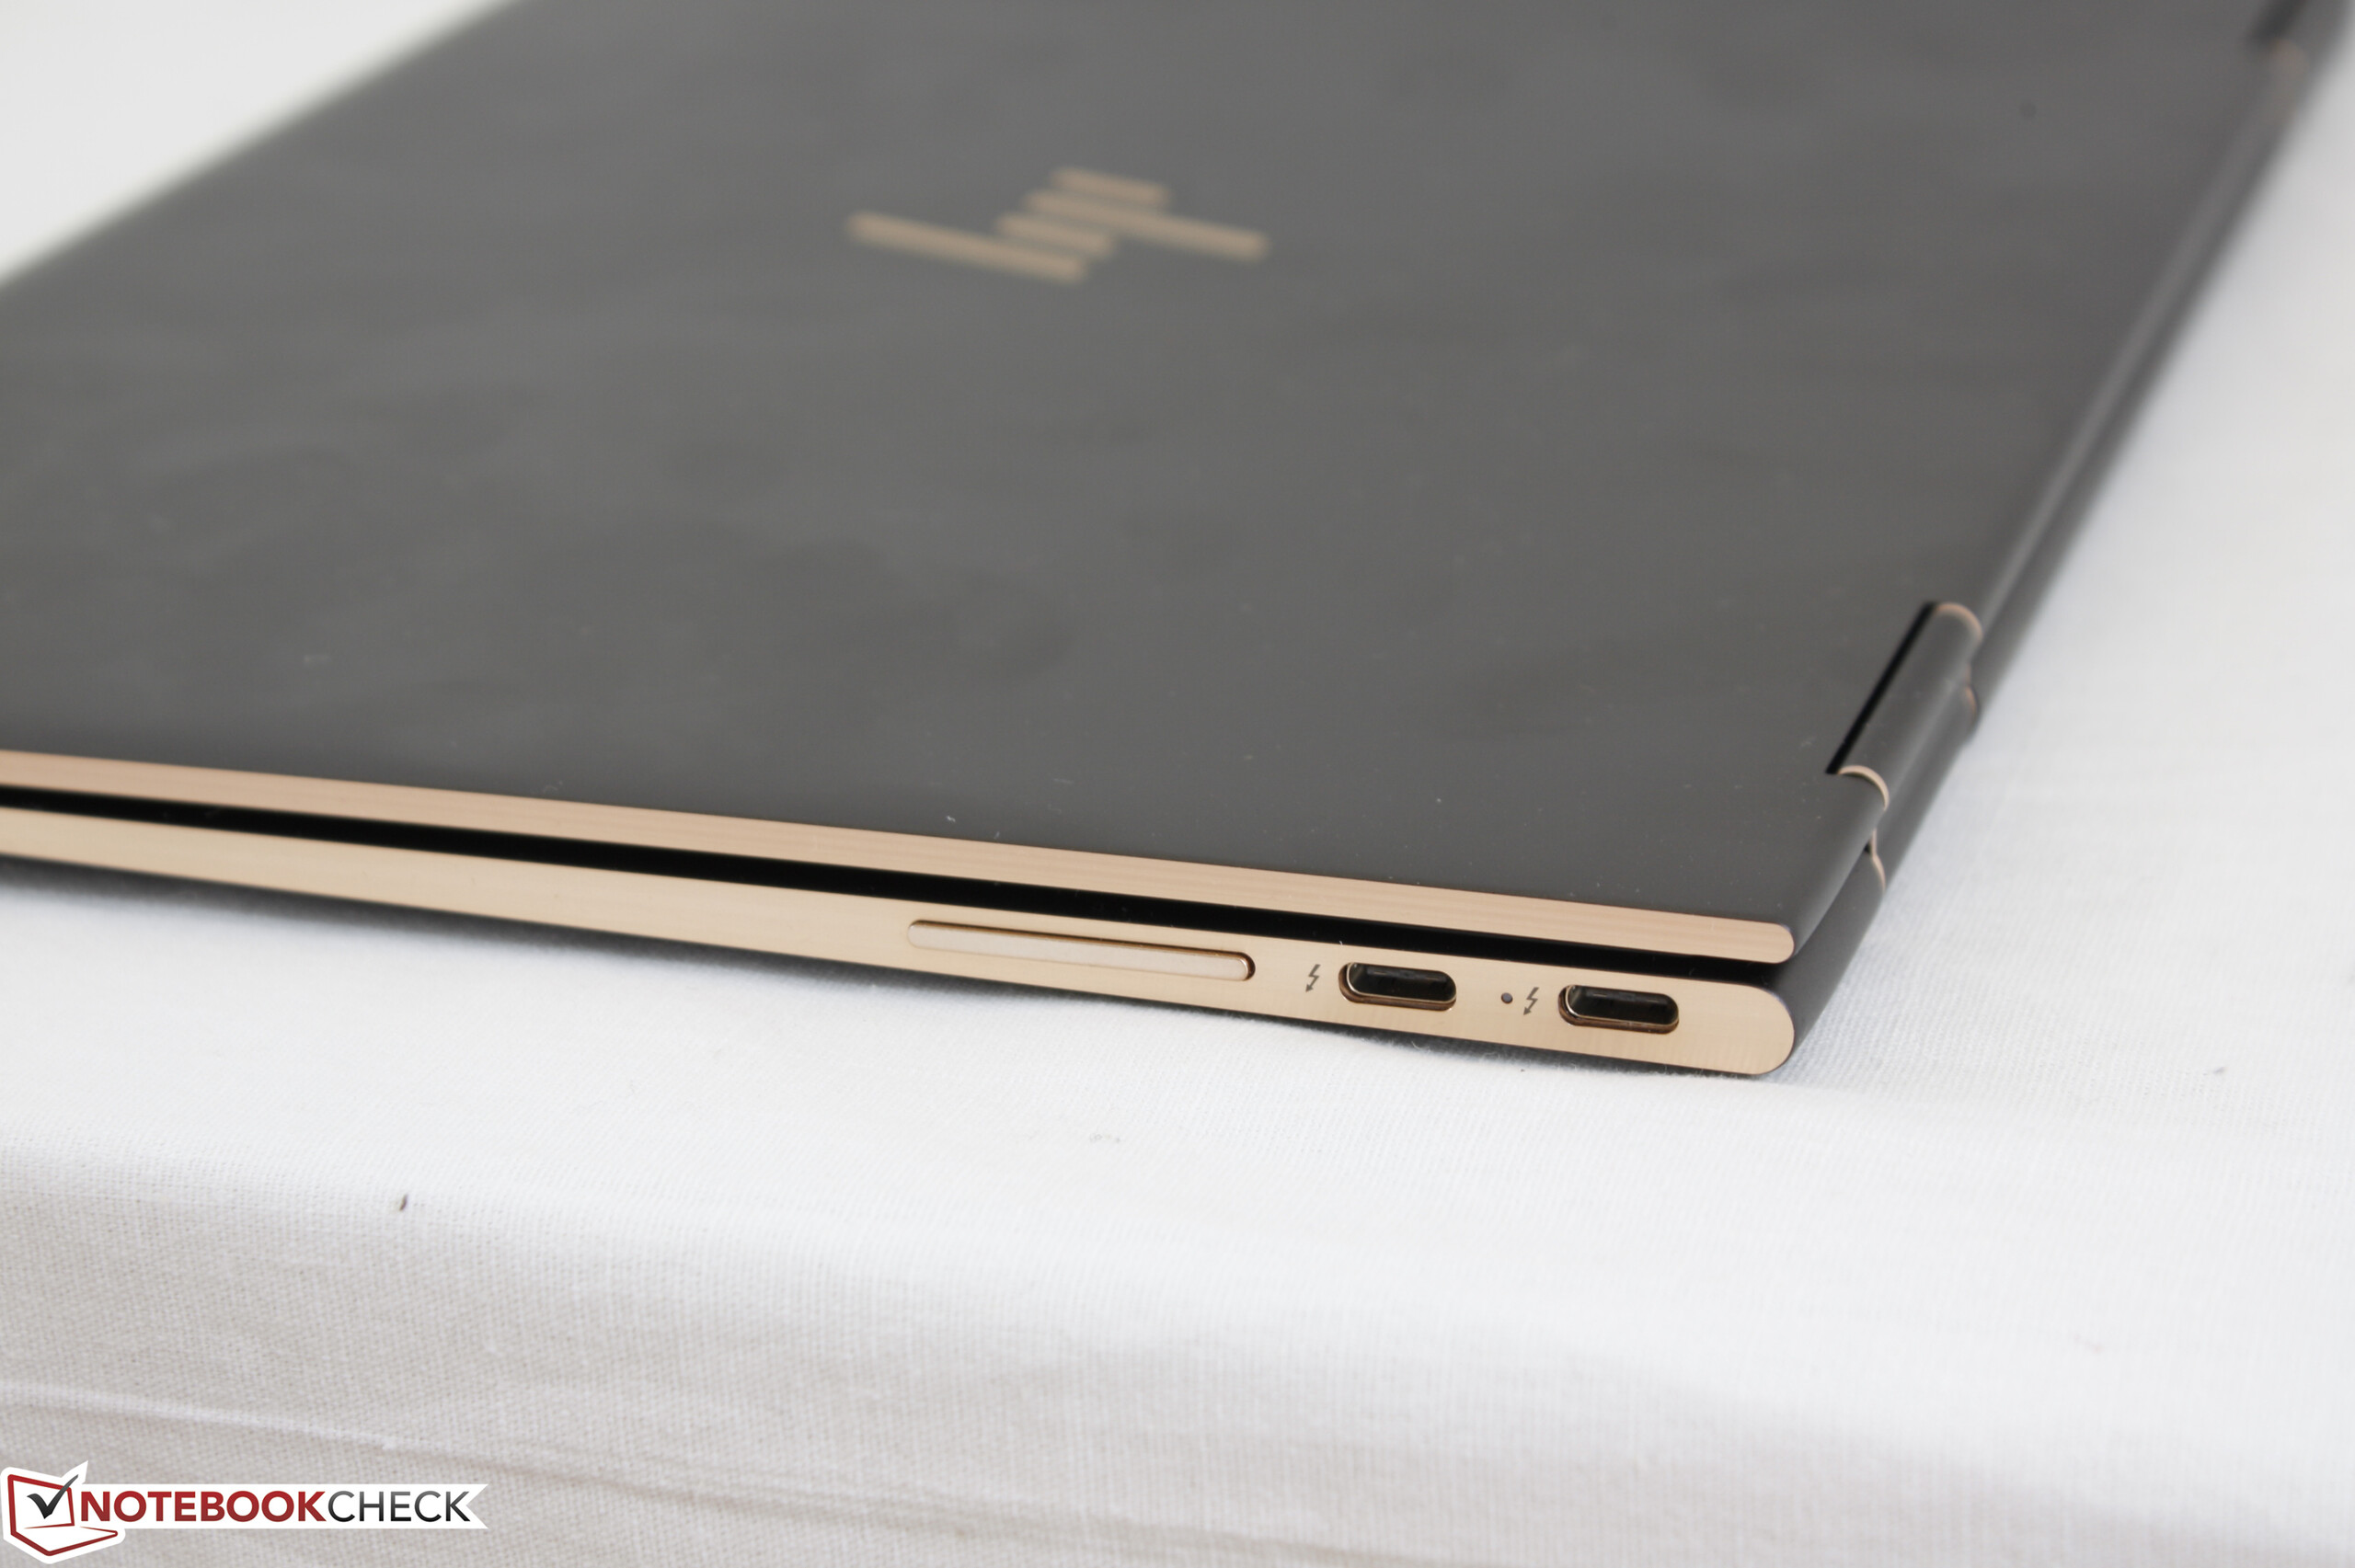
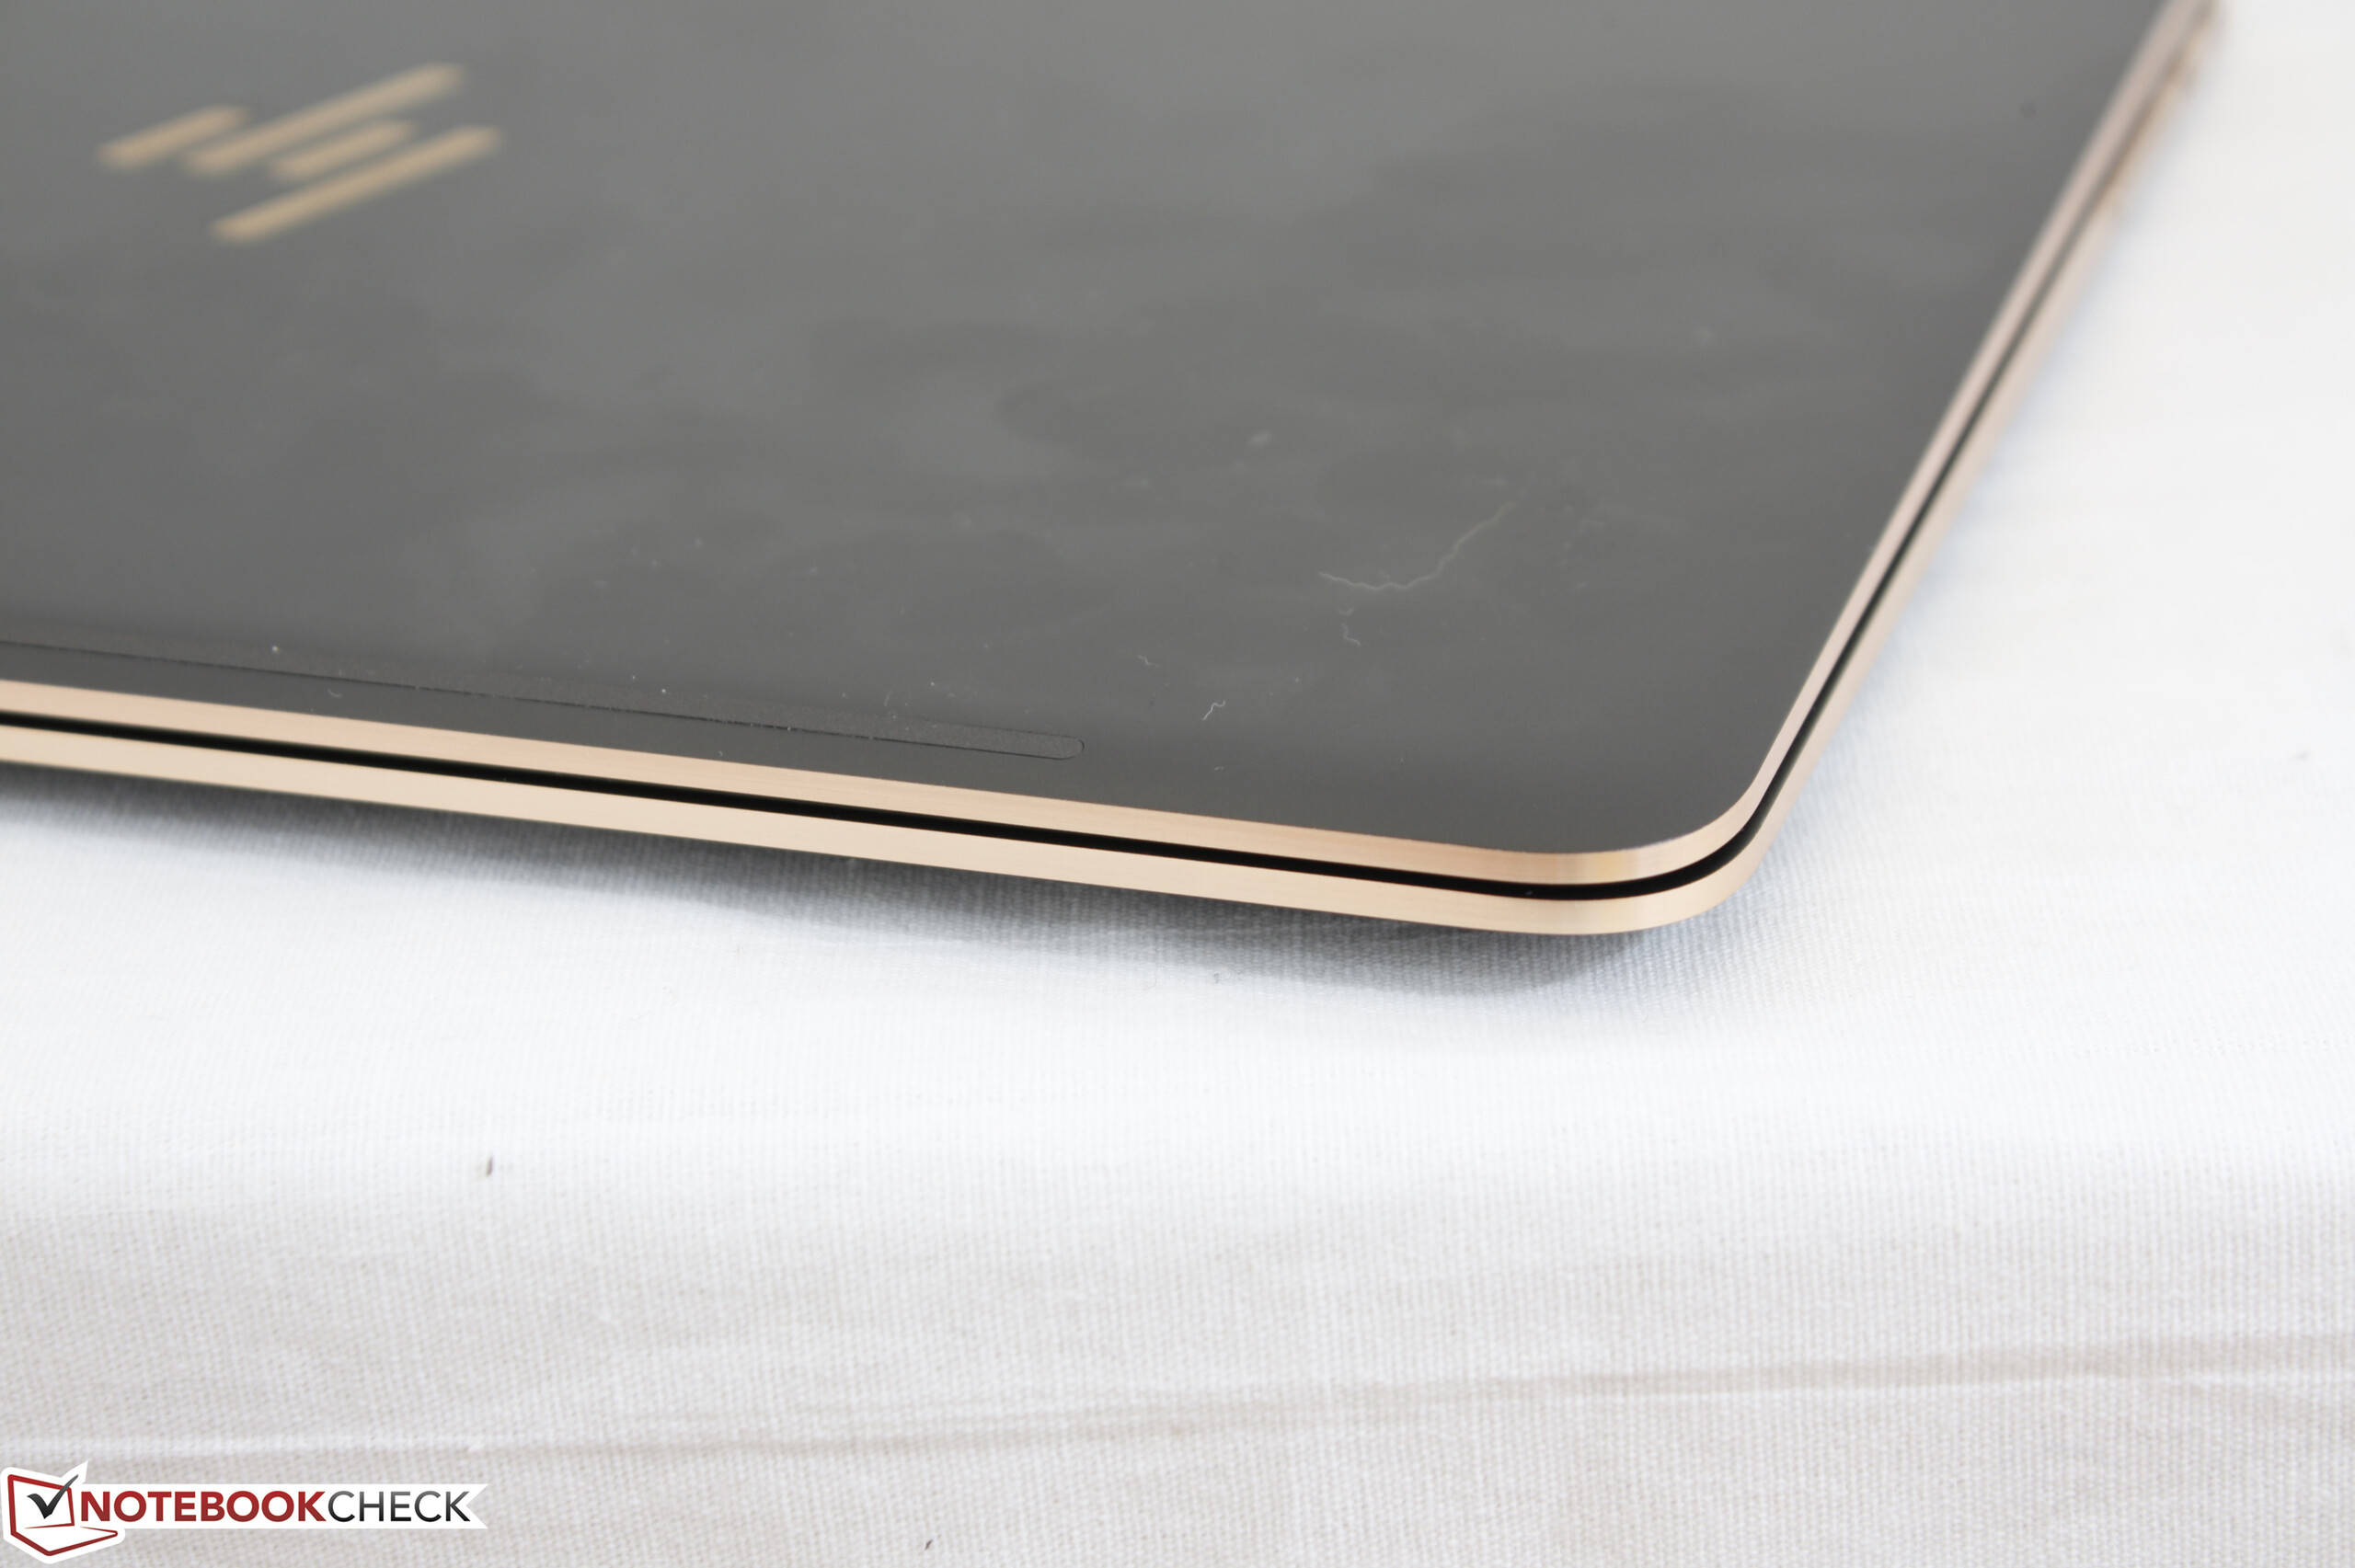
A HP melhorou ainda mais o seu Spectre x360 13 incorporando 4K UHD e suporte para "active pen" para uma experiência superior de tablet. Este ainda é o mesmo aparelho 2-em-1leve e fácil de manipular que fez com que o modelo de 2016 se destaque como u dos conversíveis mais práticos em sua categoria.
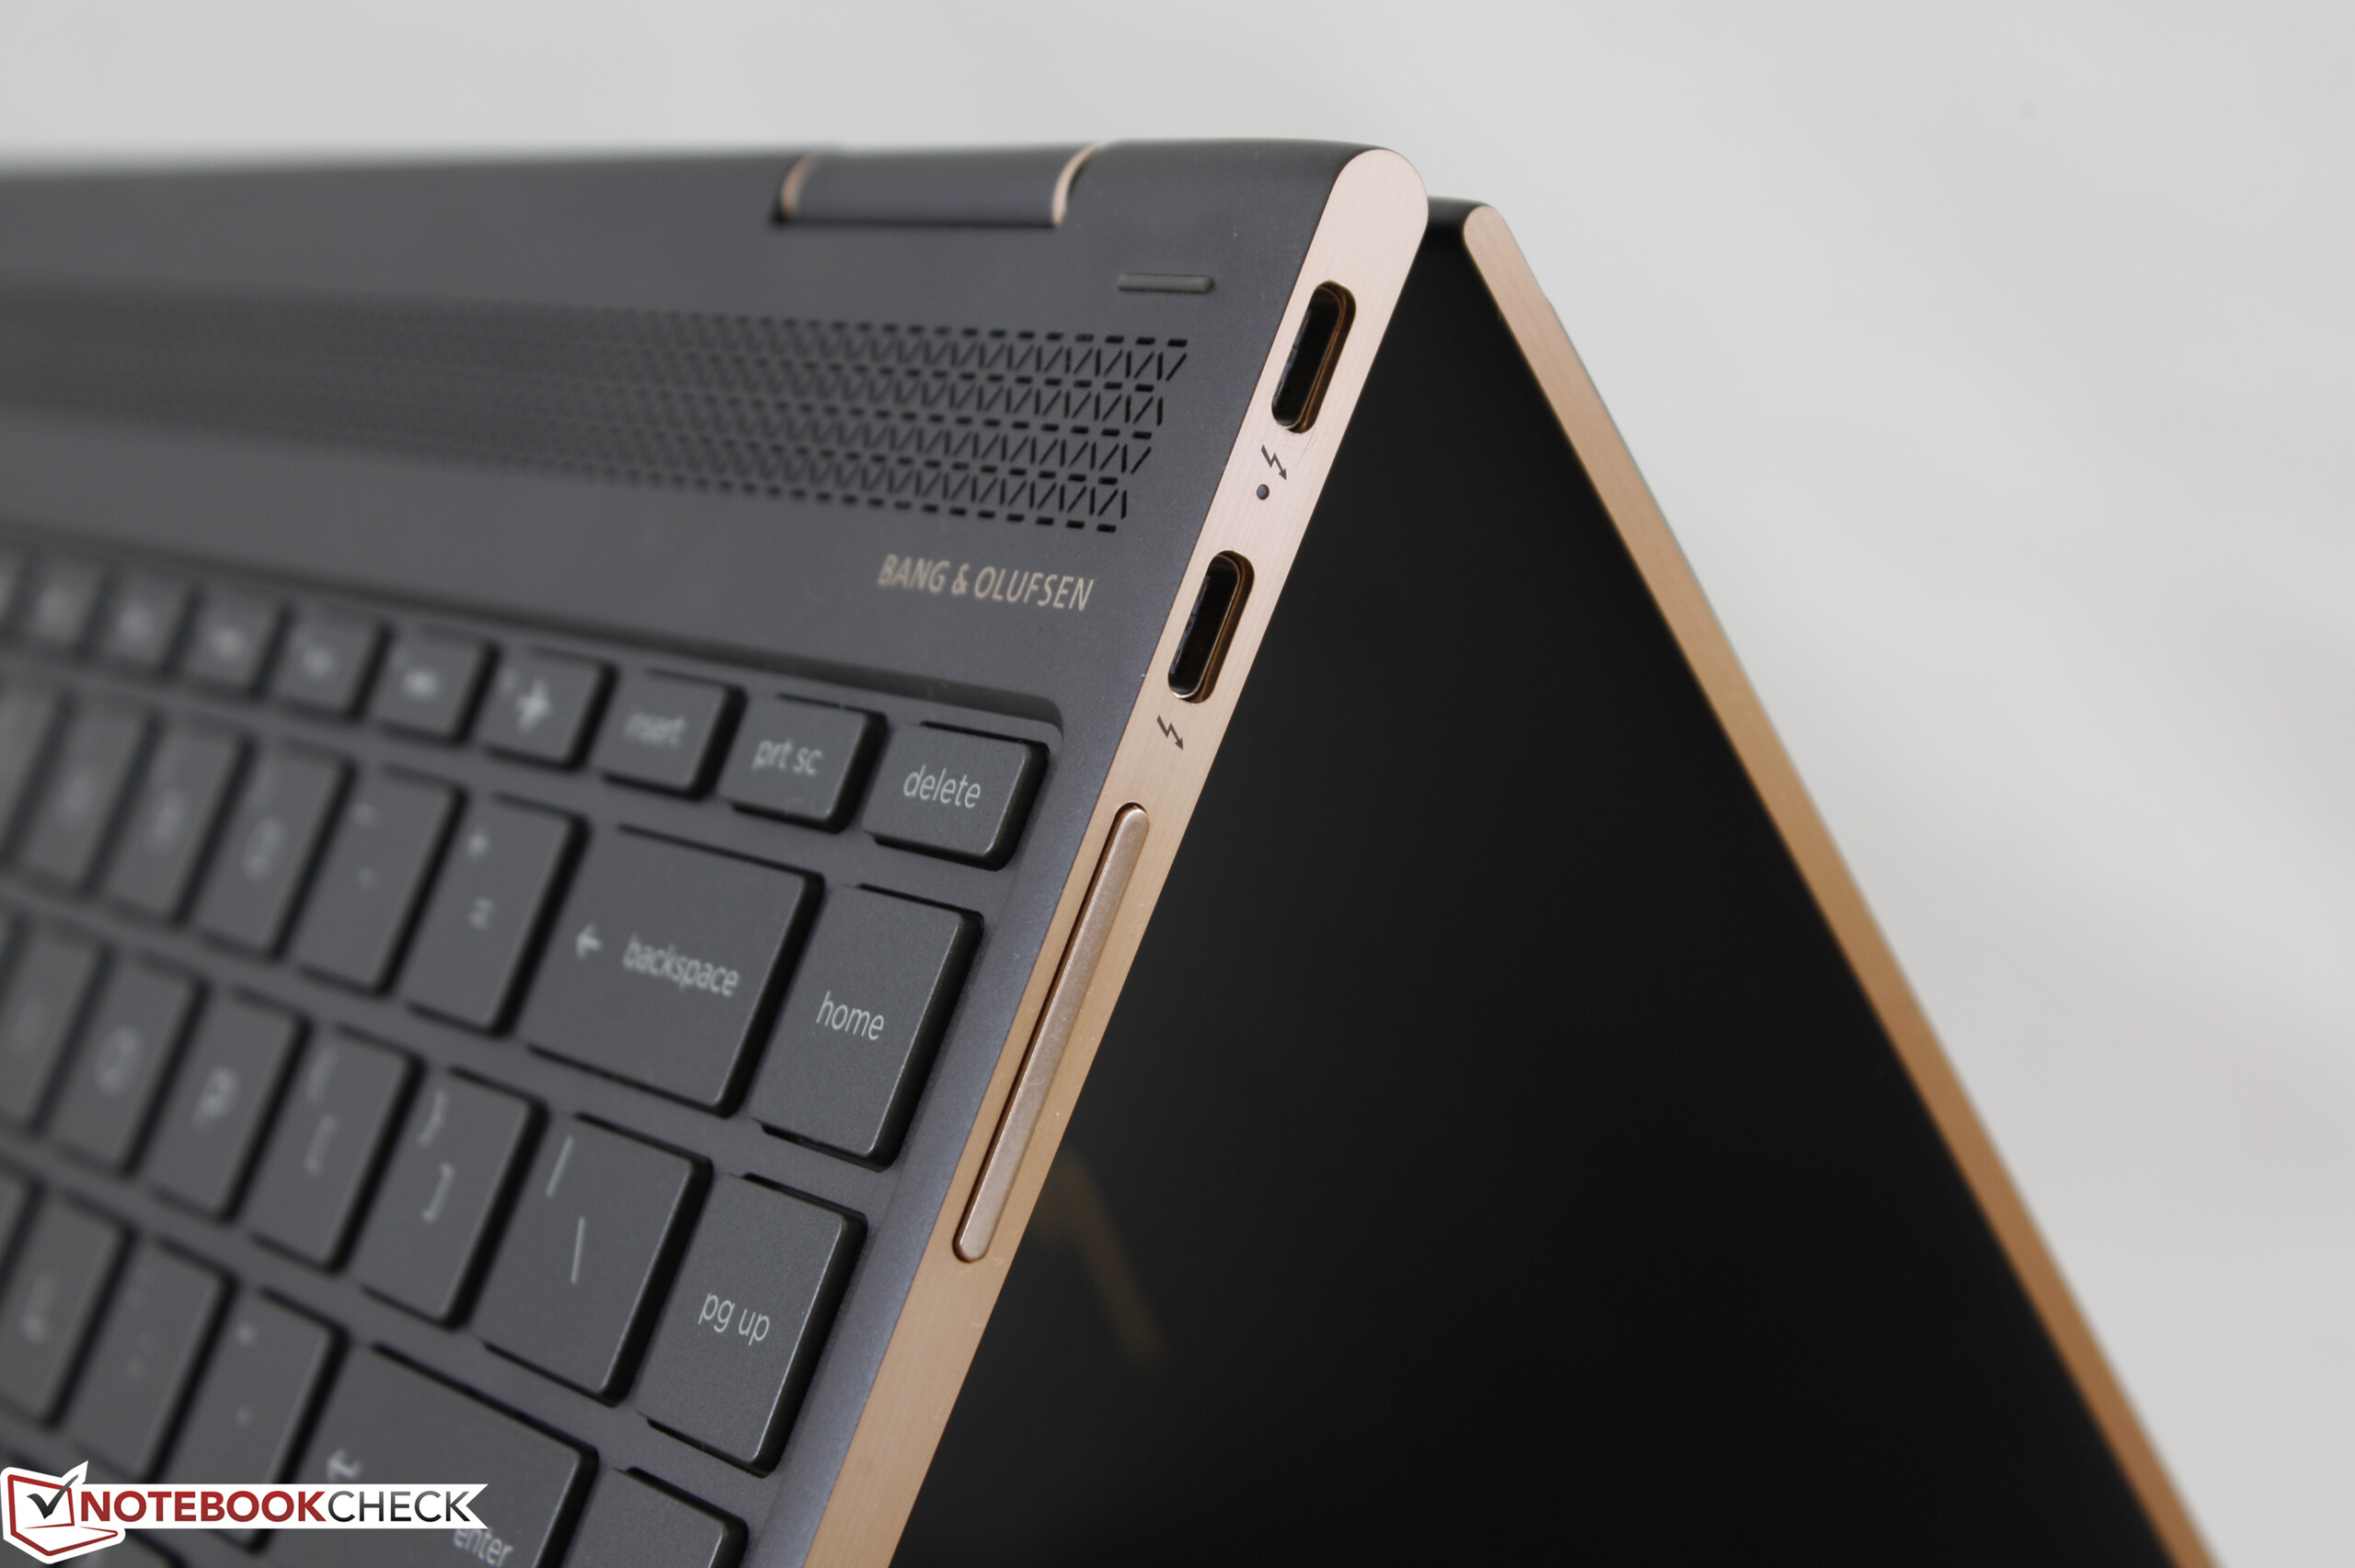
Fora o pequeno número de atualizações, no entanto, ficamos um pouco decepcionados de que a HP não tenha melhorado ainda mais a experiência. Por exemplo, a adição de um leitor de cartões SD, software de controle manual da ventoinha, e uma iluminação de tela mais brilhante teriam sido bem diferenciados nesta atualização da linha FHD de 2016. É tentador usar o Spectre x360 13 em exteriores especialmente agora que um stylus ativo é incluído na caixa, mas a iluminação de fundo não é tão brilhante como poderia ter sido.
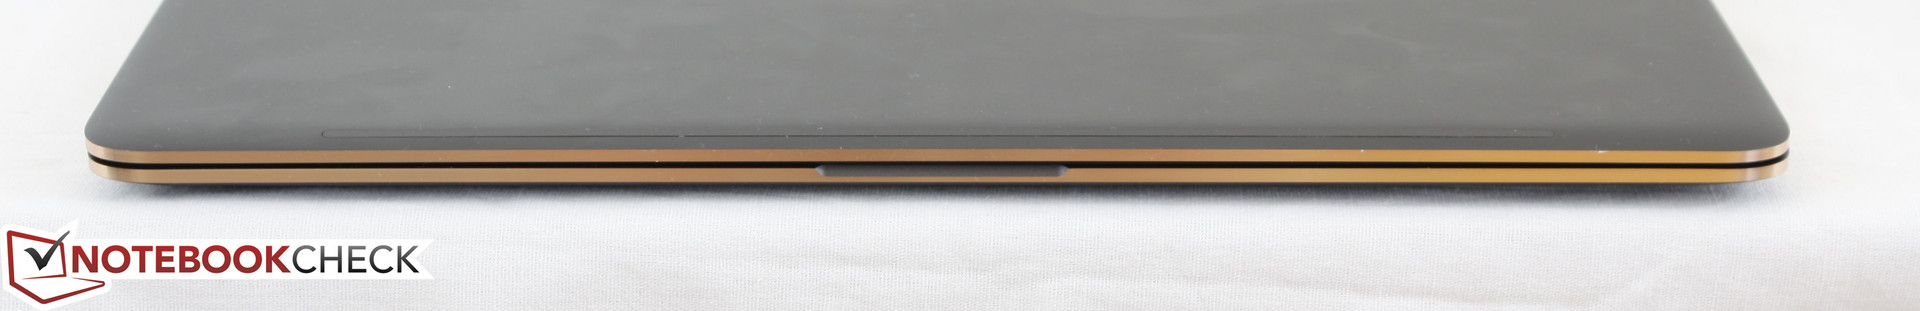
Tanto o XPS 13 9365 como o Yoga 910 estiveram amplamente disponíveis nos meses desde nossa análise inicial do 2016 Spectre x360 13 com vantagens e desvantagens para cada um. O Dell é, de fato, mais leve e menor, sem sacrificar o tamanho da tela, mas não existem opções 4K UHD e a CPU passivamente resfriada é mensuravelmente mais lenta. Por outro lado, o Yoga 910 é um pouco maior no tamanho da tela com 4K UHD e SKU i7-7500U, mas não suporta caneta ativa e é mais largo e mais pesado que o HP. Como uma opção média para os consumidores, o novo Spectre x360 13 é, atualmente, o melhor de ambos os mundos em termos de desempenho e portabilidade.
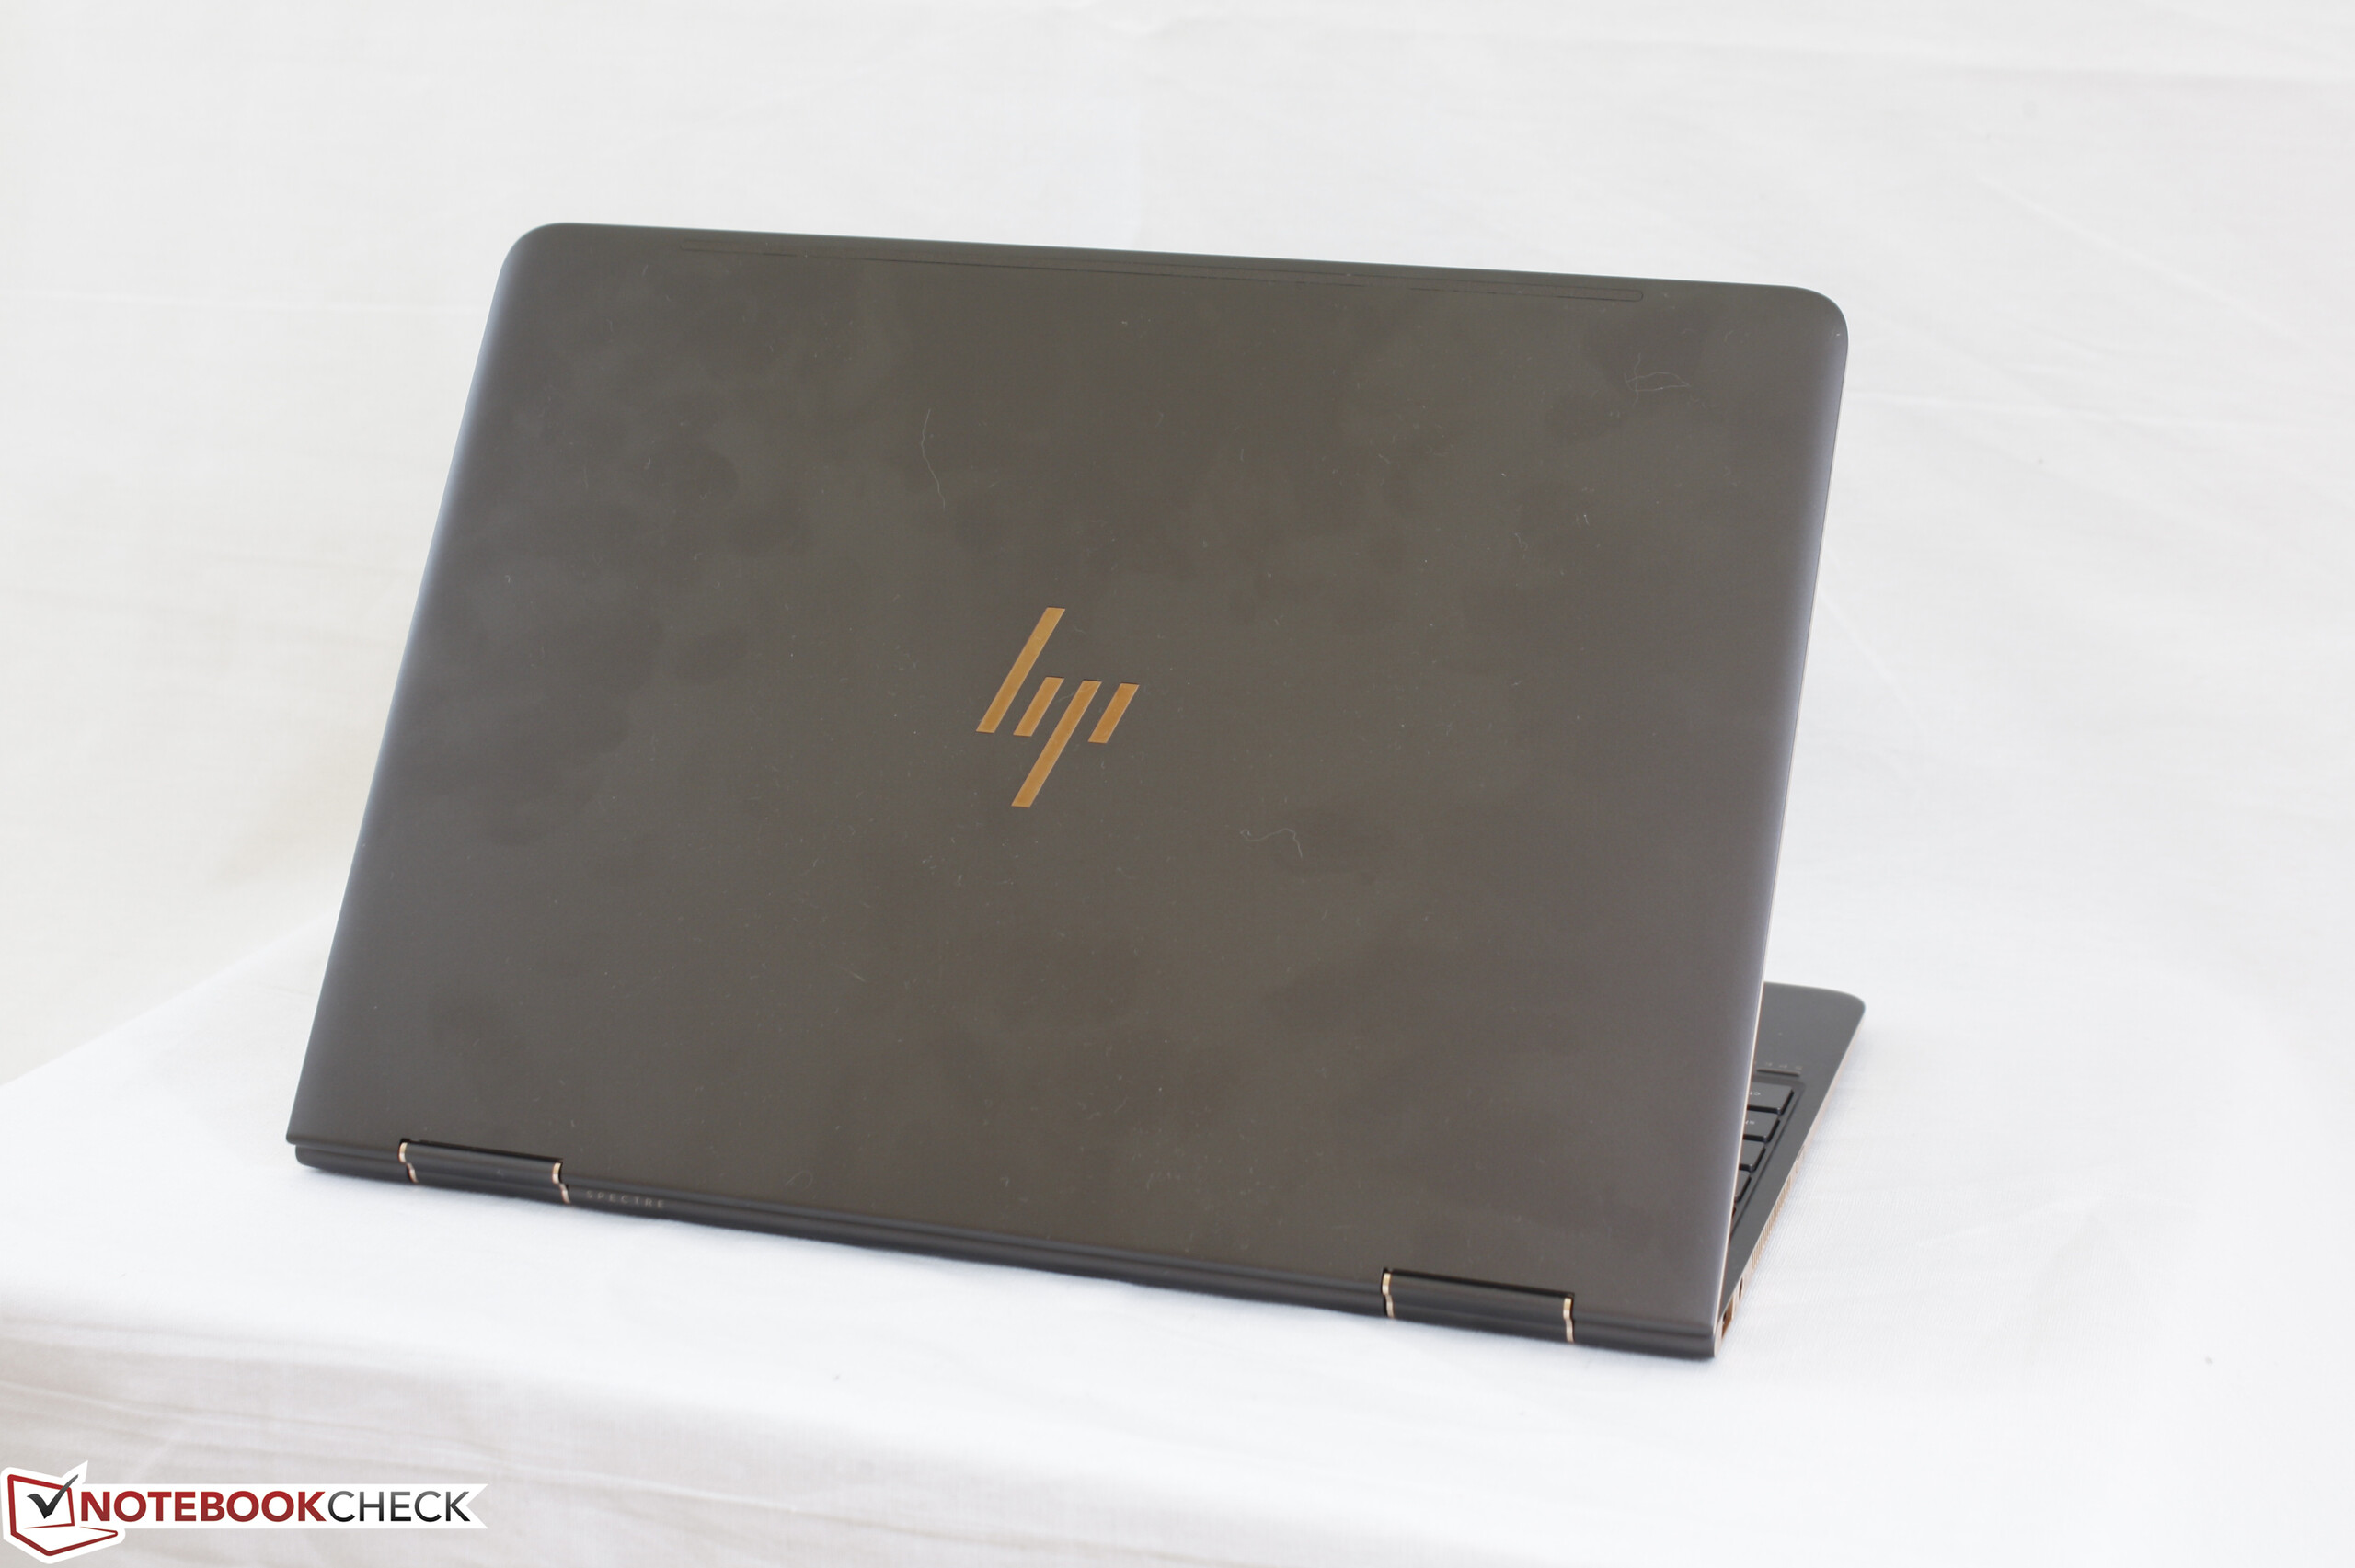
Esta atualização 2017 finalmente coloca 4K UHD e suporte para caneta ativa na admirada linha Spectre x360 13 do final de 2016. Não muito mais mudou, mas isso está bem - o conversível ainda atinge um excelente equilíbrio de tamanho e poder para o uso confortável em todos os modos.
HP Spectre x360 13-ac033dx
- 04/05/2017 v6 (old)
Allen Ngo
Price comparison
