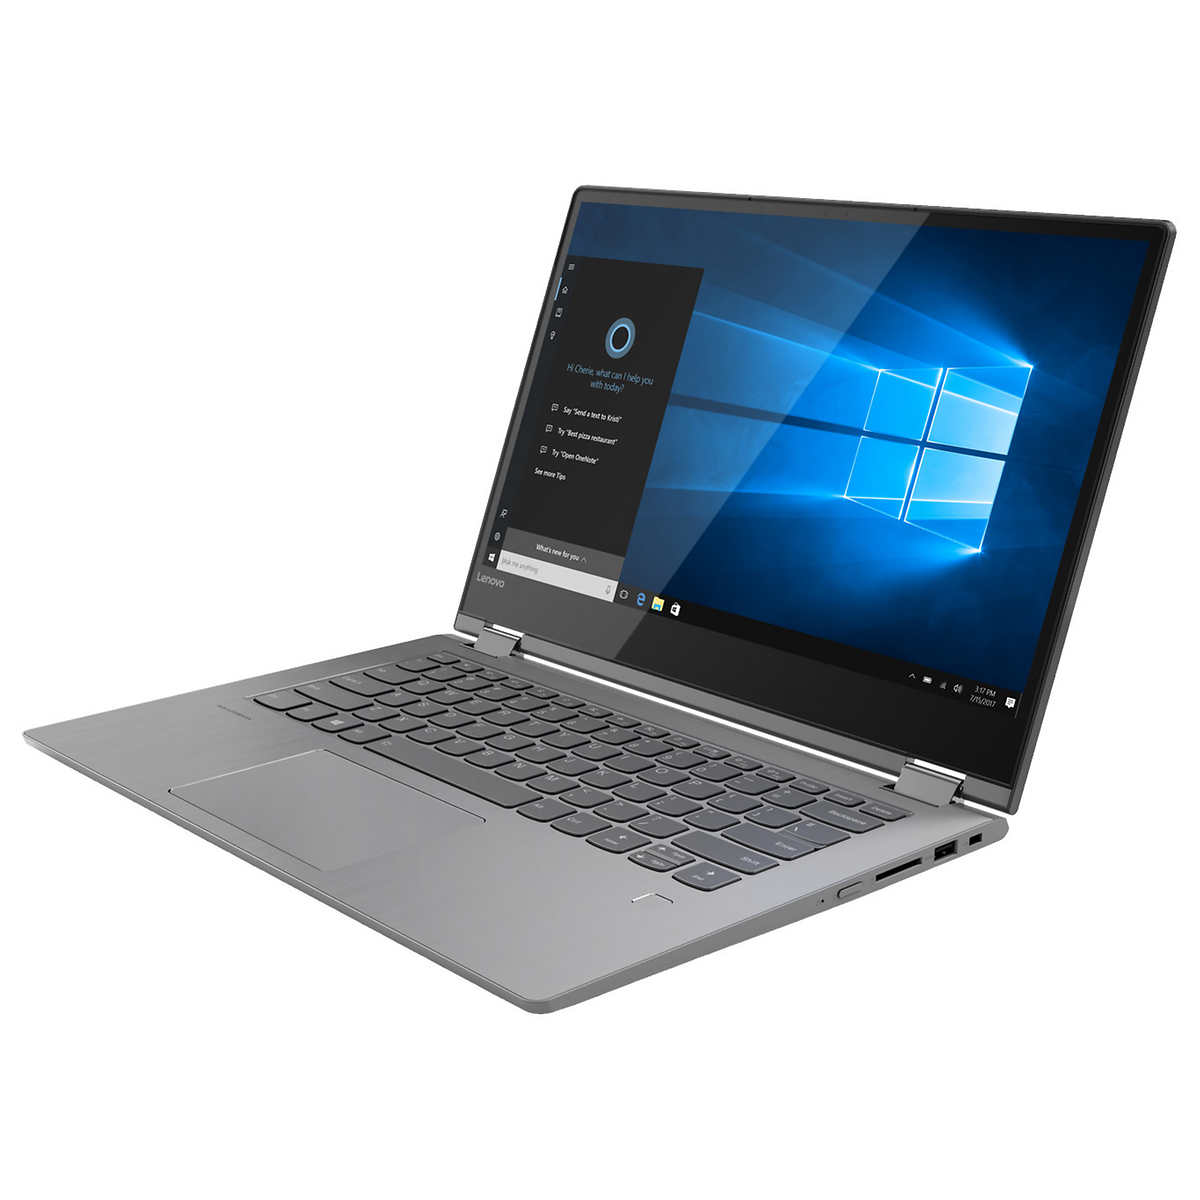
Breve Análise do Conversível Lenovo Flex 6-14IKB (i5 8250U, GeForce MX130)
| SD Card Reader | |
| average JPG Copy Test (av. of 3 runs) | |
| HP Pavilion x360 14-ba011ng (Toshiba Exceria Pro SDXC 64 GB UHS-II) | |
| Média da turma Convertible (29.4 - 186, n=21, últimos 2 anos) | |
| Lenovo Flex 6-14IKB (Toshiba Exceria Pro SDXC 64 GB UHS-II) | |
| Asus VivoBook Flip 14 TP401NA (Toshiba Exceria Pro M501 microSDXC 64GB) | |
| Acer Spin 3 SP314-51-548L (Toshiba Exceria Pro SDXC 64 GB UHS-II) | |
| maximum AS SSD Seq Read Test (1GB) | |
| Média da turma Convertible (67.5 - 254, n=20, últimos 2 anos) | |
| HP Pavilion x360 14-ba011ng (Toshiba Exceria Pro SDXC 64 GB UHS-II) | |
| Asus VivoBook Flip 14 TP401NA (Toshiba Exceria Pro M501 microSDXC 64GB) | |
| Lenovo Flex 6-14IKB (Toshiba Exceria Pro SDXC 64 GB UHS-II) | |
| Acer Spin 3 SP314-51-548L (Toshiba Exceria Pro SDXC 64 GB UHS-II) | |
| Networking | |
| iperf3 transmit AX12 | |
| Lenovo Flex 6-14IKB | |
| Lenovo Yoga 920-13IKB-80Y7 | |
| HP Pavilion x360 14-ba011ng | |
| Acer Spin 3 SP314-51-548L | |
| Asus VivoBook Flip 14 TP401NA | |
| iperf3 receive AX12 | |
| Lenovo Yoga 920-13IKB-80Y7 | |
| Lenovo Flex 6-14IKB | |
| Acer Spin 3 SP314-51-548L | |
| Asus VivoBook Flip 14 TP401NA | |
| HP Pavilion x360 14-ba011ng | |
| |||||||||||||||||||||||||
iluminação: 91 %
iluminação com acumulador: 251.7 cd/m²
Contraste: 1398:1 (Preto: 0.18 cd/m²)
ΔE ColorChecker Calman: 5.17 | ∀{0.5-29.43 Ø4.71}
calibrated: 3.83
ΔE Greyscale Calman: 3.3 | ∀{0.09-98 Ø4.96}
60.4% sRGB (Argyll 1.6.3 3D)
38.6% AdobeRGB 1998 (Argyll 1.6.3 3D)
41.86% AdobeRGB 1998 (Argyll 3D)
60.5% sRGB (Argyll 3D)
40.49% Display P3 (Argyll 3D)
Gamma: 1.943
CCT: 6179 K
| Lenovo Flex 6-14IKB M140NWF5 R2, IPS, 14", 1920x1080 | Asus VivoBook Flip 14 TP401NA BOE CQ NV140FHM-N49, IPS, 14", 1920x1080 | Acer Spin 3 SP314-51-548L BOE CQ NV140FHM-N41, IPS, 14", 1920x1080 | HP Pavilion x360 14-ba011ng Chi Mei, IPS, 14", 1920x1080 | Lenovo Yoga 920-13IKB-80Y7 AU Optronics B139HAN03.0, IPS, 13.9", 1920x1080 | |
|---|---|---|---|---|---|
| Display | -1% | -2% | 3% | 53% | |
| Display P3 Coverage (%) | 40.49 | 40.21 -1% | 39.68 -2% | 41.82 3% | 62.5 54% |
| sRGB Coverage (%) | 60.5 | 59.6 -1% | 58.9 -3% | 61.6 2% | 91.7 52% |
| AdobeRGB 1998 Coverage (%) | 41.86 | 41.54 -1% | 41 -2% | 43.33 4% | 64.1 53% |
| Response Times | -8% | -11% | 15% | -8% | |
| Response Time Grey 50% / Grey 80% * (ms) | 43.2 ? | 42 ? 3% | 43 ? -0% | 41 ? 5% | 46 ? -6% |
| Response Time Black / White * (ms) | 28.8 ? | 34 ? -18% | 35 ? -22% | 22 ? 24% | 31.6 ? -10% |
| PWM Frequency (Hz) | 510 ? | 960 ? | 1000 | 25000 ? | |
| Screen | 3% | 7% | -17% | -10% | |
| Brightness middle (cd/m²) | 251.7 | 253 1% | 220 -13% | 252 0% | 297.9 18% |
| Brightness (cd/m²) | 249 | 239 -4% | 221 -11% | 237 -5% | 278 12% |
| Brightness Distribution (%) | 91 | 76 -16% | 78 -14% | 90 -1% | 81 -11% |
| Black Level * (cd/m²) | 0.18 | 0.21 -17% | 0.18 -0% | 0.21 -17% | 0.44 -144% |
| Contrast (:1) | 1398 | 1205 -14% | 1222 -13% | 1200 -14% | 677 -52% |
| Colorchecker dE 2000 * | 5.17 | 4.29 17% | 3.98 23% | 7.29 -41% | 5.1 1% |
| Colorchecker dE 2000 max. * | 26.18 | 8.74 67% | 7.69 71% | 17.55 33% | 11 58% |
| Colorchecker dE 2000 calibrated * | 3.83 | 5.93 -55% | 4 -4% | ||
| Greyscale dE 2000 * | 3.3 | 1.49 55% | 1.68 49% | 7.48 -127% | 6.7 -103% |
| Gamma | 1.943 113% | 2.29 96% | 2.37 93% | 2.45 90% | 2.9 76% |
| CCT | 6179 105% | 6611 98% | 6382 102% | 6953 93% | 6839 95% |
| Color Space (Percent of AdobeRGB 1998) (%) | 38.6 | 38 -2% | 38 -2% | 40 4% | 64.1 66% |
| Color Space (Percent of sRGB) (%) | 60.4 | 59 -2% | 58 -4% | 61 1% | 91.7 52% |
| Média Total (Programa/Configurações) | -2% /
1% | -2% /
3% | 0% /
-9% | 12% /
3% |
* ... menor é melhor
Exibir tempos de resposta
| ↔ Tempo de resposta preto para branco | ||
|---|---|---|
| 28.8 ms ... ascensão ↗ e queda ↘ combinadas | ↗ 14.8 ms ascensão | 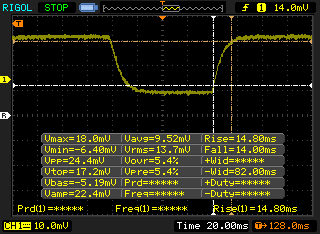 |
| ↘ 14 ms queda | ||
| A tela mostra taxas de resposta relativamente lentas em nossos testes e pode ser muito lenta para os jogadores. Em comparação, todos os dispositivos testados variam de 0.1 (mínimo) a 240 (máximo) ms. » 76 % de todos os dispositivos são melhores. Isso significa que o tempo de resposta medido é pior que a média de todos os dispositivos testados (19.8 ms). | ||
| ↔ Tempo de resposta 50% cinza a 80% cinza | ||
| 43.2 ms ... ascensão ↗ e queda ↘ combinadas | ↗ 18.8 ms ascensão | 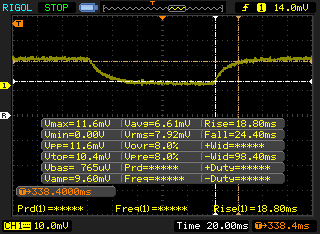 |
| ↘ 24.4 ms queda | ||
| A tela mostra taxas de resposta lentas em nossos testes e será insatisfatória para os jogadores. Em comparação, todos os dispositivos testados variam de 0.165 (mínimo) a 636 (máximo) ms. » 72 % de todos os dispositivos são melhores. Isso significa que o tempo de resposta medido é pior que a média de todos os dispositivos testados (30.9 ms). | ||
Cintilação da tela / PWM (modulação por largura de pulso)
| Tela tremeluzindo/PWM detectado | 510 Hz | ≤ 99 % configuração de brilho | 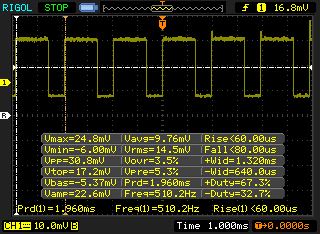 |
A luz de fundo da tela pisca em 510 Hz (pior caso, por exemplo, utilizando PWM) Cintilação detectada em uma configuração de brilho de 99 % e abaixo. Não deve haver cintilação ou PWM acima desta configuração de brilho. A frequência de 510 Hz é bastante alta, então a maioria dos usuários sensíveis ao PWM não deve notar nenhuma oscilação. [pwm_comparison] Em comparação: 52 % de todos os dispositivos testados não usam PWM para escurecer a tela. Se PWM foi detectado, uma média de 7744 (mínimo: 5 - máximo: 343500) Hz foi medida. | |||
| Cinebench R15 | |
| CPU Single 64Bit | |
| Média da turma Convertible (149.8 - 317, n=48, últimos 2 anos) | |
| Lenovo Yoga 920-13IKB-80Y7 | |
| Acer Spin 3 SP314-51-548L | |
| Média Intel Core i5-8250U (81 - 147, n=97) | |
| Lenovo Flex 6-14IKB | |
| HP Pavilion x360 14-ba011ng | |
| Asus VivoBook Flip 14 TP401NA | |
| CPU Multi 64Bit | |
| Média da turma Convertible (478 - 4940, n=48, últimos 2 anos) | |
| Lenovo Yoga 920-13IKB-80Y7 | |
| Média Intel Core i5-8250U (320 - 730, n=101) | |
| Acer Spin 3 SP314-51-548L | |
| Lenovo Flex 6-14IKB | |
| HP Pavilion x360 14-ba011ng | |
| Asus VivoBook Flip 14 TP401NA | |
| PCMark 8 - Home Score Accelerated v2 | |
| Média da turma Convertible (n=1últimos 2 anos) | |
| Lenovo Yoga 920-13IKB-80Y7 | |
| Acer Spin 3 SP314-51-548L | |
| Média Intel Core i5-8250U, NVIDIA GeForce MX130 (3207 - 3903, n=5) | |
| HP Pavilion x360 14-ba011ng | |
| Lenovo Flex 6-14IKB | |
| Asus VivoBook Flip 14 TP401NA | |
| PCMark 8 Home Score Accelerated v2 | 3207 pontos | |
| PCMark 10 Score | 3267 pontos | |
Ajuda | ||
| Lenovo Flex 6-14IKB Samsung PM961 MZVLW256HEHP | Acer Spin 3 SP314-51-548L Micron 1100 MTFDDAV256TBN | HP Pavilion x360 14-ba011ng Samsung CM871a MZNTY128HDHP | Lenovo Yoga 920-13IKB-80Y7 Samsung PM961 MZVLW256HEHP | Média Samsung PM961 MZVLW256HEHP | |
|---|---|---|---|---|---|
| AS SSD | -50% | -56% | 14% | -94% | |
| Copy Game MB/s (MB/s) | 231.9 | 166.2 | 319.2 | 537 ? | |
| Copy Program MB/s (MB/s) | 158.8 | 65.1 | 463.3 | 343 ? | |
| Copy ISO MB/s (MB/s) | 329.8 | 211.3 | 1341 | 1004 ? | |
| Score Total (Points) | 2311 | 867 -62% | 974 -58% | 2536 10% | 2565 ? 11% |
| Score Write (Points) | 526 | 392 -25% | 261 -50% | 608 16% | 587 ? 12% |
| Score Read (Points) | 1200 | 311 -74% | 465 -61% | 1316 10% | 1378 ? 15% |
| Access Time Write * (ms) | 0.039 | 0.056 -44% | 0.076 -95% | 0.028 28% | 0.4637 ? -1089% |
| Access Time Read * (ms) | 0.062 | 0.091 -47% | 0.093 -50% | 0.044 29% | 0.06777 ? -9% |
| 4K-64 Write (MB/s) | 308.5 | 273.6 -11% | 128.4 -58% | 391.3 27% | 419 ? 36% |
| 4K-64 Read (MB/s) | 953 | 236.1 -75% | 381.4 -60% | 1039 9% | 1112 ? 17% |
| 4K Write (MB/s) | 96.4 | 77.9 -19% | 83.9 -13% | 128.1 33% | 91.6 ? -5% |
| 4K Read (MB/s) | 47.85 | 25.41 -47% | 32.19 -33% | 48.46 1% | 45.1 ? -6% |
| Seq Write (MB/s) | 1211 | 406.9 -66% | 491.5 -59% | 885 -27% | 960 ? -21% |
| Seq Read (MB/s) | 1984 | 491.1 -75% | 515 -74% | 2282 15% | 2019 ? 2% |
* ... menor é melhor

| 3DMark 11 | |
| 1280x720 Performance GPU | |
| Média da turma Convertible (1505 - 40732, n=48, últimos 2 anos) | |
| Média NVIDIA GeForce MX130 (2476 - 3203, n=14) | |
| Lenovo Flex 6-14IKB | |
| HP Pavilion x360 14-ba011ng | |
| Lenovo Yoga 920-13IKB-80Y7 | |
| Acer Spin 3 SP314-51-548L | |
| Asus VivoBook Flip 14 TP401NA | |
| 1280x720 Performance Combined | |
| Média da turma Convertible (1952 - 17837, n=47, últimos 2 anos) | |
| Média NVIDIA GeForce MX130 (2169 - 3031, n=13) | |
| Lenovo Flex 6-14IKB | |
| HP Pavilion x360 14-ba011ng | |
| Lenovo Yoga 920-13IKB-80Y7 | |
| Acer Spin 3 SP314-51-548L | |
| Asus VivoBook Flip 14 TP401NA | |
| 3DMark 11 Performance | 3102 pontos | |
Ajuda | ||
| BioShock Infinite | |
| 1280x720 Very Low Preset (classificar por valor) | |
| Lenovo Flex 6-14IKB | |
| Asus VivoBook Flip 14 TP401NA | |
| Acer Spin 3 SP314-51-548L | |
| HP Pavilion x360 14-ba011ng | |
| Lenovo Yoga 920-13IKB-80Y7 | |
| Média NVIDIA GeForce MX130 (83.6 - 152.6, n=10) | |
| 1366x768 Medium Preset (classificar por valor) | |
| Lenovo Flex 6-14IKB | |
| Asus VivoBook Flip 14 TP401NA | |
| Acer Spin 3 SP314-51-548L | |
| HP Pavilion x360 14-ba011ng | |
| Lenovo Yoga 920-13IKB-80Y7 | |
| Média NVIDIA GeForce MX130 (57.3 - 84.5, n=10) | |
| 1366x768 High Preset (classificar por valor) | |
| Lenovo Flex 6-14IKB | |
| Asus VivoBook Flip 14 TP401NA | |
| Acer Spin 3 SP314-51-548L | |
| HP Pavilion x360 14-ba011ng | |
| Lenovo Yoga 920-13IKB-80Y7 | |
| Média NVIDIA GeForce MX130 (48 - 69, n=10) | |
| 1920x1080 Ultra Preset, DX11 (DDOF) (classificar por valor) | |
| Lenovo Flex 6-14IKB | |
| Acer Spin 3 SP314-51-548L | |
| HP Pavilion x360 14-ba011ng | |
| Lenovo Yoga 920-13IKB-80Y7 | |
| Média NVIDIA GeForce MX130 (22 - 48.7, n=10) | |
| baixo | média | alto | ultra | |
|---|---|---|---|---|
| BioShock Infinite (2013) | 115 | 61 | 48 | 22 |
Barulho
| Ocioso |
| 28.5 / 28.5 / 28.9 dB |
| Carga |
| 39.1 / 39.1 dB |
 | ||
30 dB silencioso 40 dB(A) audível 50 dB(A) ruidosamente alto |
||
min: | ||
| Lenovo Flex 6-14IKB GeForce MX130, i5-8250U, Samsung PM961 MZVLW256HEHP | Acer Spin 3 SP314-51-548L UHD Graphics 620, i5-8250U, Micron 1100 MTFDDAV256TBN | HP Pavilion x360 14-ba011ng GeForce 940MX, i5-7200U, Samsung CM871a MZNTY128HDHP | Lenovo Yoga 920-13IKB-80Y7 UHD Graphics 620, i5-8550U, Samsung PM961 MZVLW256HEHP | |
|---|---|---|---|---|
| Noise | -5% | -7% | 4% | |
| desligado / ambiente * (dB) | 28.5 | 30 -5% | 30 -5% | 28 2% |
| Idle Minimum * (dB) | 28.5 | 30 -5% | 31.2 -9% | 28 2% |
| Idle Average * (dB) | 28.5 | 30 -5% | 31.2 -9% | 28.8 -1% |
| Idle Maximum * (dB) | 28.9 | 30 -4% | 31.7 -10% | 30.3 -5% |
| Load Average * (dB) | 39.1 | 38.5 2% | 38.4 2% | 34.5 12% |
| Load Maximum * (dB) | 39.1 | 44 -13% | 42.1 -8% | 34.3 12% |
* ... menor é melhor
(+) A temperatura máxima no lado superior é 35.8 °C / 96 F, em comparação com a média de 35.4 °C / 96 F , variando de 19.6 a 60 °C para a classe Convertible.
(-) A parte inferior aquece até um máximo de 46 °C / 115 F, em comparação com a média de 36.9 °C / 98 F
(+) Em uso inativo, a temperatura média para o lado superior é 25 °C / 77 F, em comparação com a média do dispositivo de 30.3 °C / ### class_avg_f### F.
(+) Os apoios para as mãos e o touchpad são mais frios que a temperatura da pele, com um máximo de 23.4 °C / 74.1 F e, portanto, são frios ao toque.
(+) A temperatura média da área do apoio para as mãos de dispositivos semelhantes foi 28 °C / 82.4 F (+4.6 °C / 8.3 F).
Lenovo Flex 6-14IKB análise de áudio
(±) | o volume do alto-falante é médio, mas bom (###valor### dB)
Graves 100 - 315Hz
(-) | quase nenhum baixo - em média 16.3% menor que a mediana
(-) | graves não são lineares (15.9% delta para frequência anterior)
Médios 400 - 2.000 Hz
(+) | médios equilibrados - apenas 2.7% longe da mediana
(+) | médios são lineares (6.9% delta para frequência anterior)
Altos 2 - 16 kHz
(+) | agudos equilibrados - apenas 3.9% longe da mediana
(±) | a linearidade dos máximos é média (10.8% delta para frequência anterior)
Geral 100 - 16.000 Hz
(±) | a linearidade do som geral é média (24.8% diferença em relação à mediana)
Comparado com a mesma classe
» 75% de todos os dispositivos testados nesta classe foram melhores, 6% semelhantes, 18% piores
» O melhor teve um delta de 6%, a média foi 20%, o pior foi 57%
Comparado com todos os dispositivos testados
» 76% de todos os dispositivos testados foram melhores, 5% semelhantes, 19% piores
» O melhor teve um delta de 4%, a média foi 23%, o pior foi 134%
Asus VivoBook Flip 14 TP401NA análise de áudio
(-) | alto-falantes não muito altos (###valor### dB)
Graves 100 - 315Hz
(±) | graves reduzidos - em média 9% menor que a mediana
(-) | graves não são lineares (17.4% delta para frequência anterior)
Médios 400 - 2.000 Hz
(+) | médios equilibrados - apenas 2.8% longe da mediana
(+) | médios são lineares (6.9% delta para frequência anterior)
Altos 2 - 16 kHz
(±) | máximos mais altos - em média 5.1% maior que a mediana
(+) | os máximos são lineares (6.2% delta da frequência anterior)
Geral 100 - 16.000 Hz
(±) | a linearidade do som geral é média (18.5% diferença em relação à mediana)
Comparado com a mesma classe
» 42% de todos os dispositivos testados nesta classe foram melhores, 8% semelhantes, 51% piores
» O melhor teve um delta de 6%, a média foi 20%, o pior foi 57%
Comparado com todos os dispositivos testados
» 42% de todos os dispositivos testados foram melhores, 8% semelhantes, 51% piores
» O melhor teve um delta de 4%, a média foi 23%, o pior foi 134%
| desligado | |
| Ocioso | |
| Carga |
|
Key:
min: | |
| Lenovo Flex 6-14IKB i5-8250U, GeForce MX130, Samsung PM961 MZVLW256HEHP, IPS, 1920x1080, 14" | Asus VivoBook Flip 14 TP401NA Pentium N4200, HD Graphics 505, 128 GB eMMC Flash, IPS, 1920x1080, 14" | Acer Spin 3 SP314-51-548L i5-8250U, UHD Graphics 620, Micron 1100 MTFDDAV256TBN, IPS, 1920x1080, 14" | HP Pavilion x360 14-ba011ng i5-7200U, GeForce 940MX, Samsung CM871a MZNTY128HDHP, IPS, 1920x1080, 14" | Lenovo Yoga 920-13IKB-80Y7 i5-8550U, UHD Graphics 620, Samsung PM961 MZVLW256HEHP, IPS, 1920x1080, 13.9" | |
|---|---|---|---|---|---|
| Power Consumption | 30% | 28% | -17% | 13% | |
| Idle Minimum * (Watt) | 4.4 | 4.26 3% | 2.9 34% | 4.2 5% | 3.1 30% |
| Idle Average * (Watt) | 5.3 | 7.1 -34% | 5.2 2% | 7.2 -36% | 6.6 -25% |
| Idle Maximum * (Watt) | 9.4 | 7.44 21% | 5.4 43% | 9.8 -4% | 7 26% |
| Load Average * (Watt) | 43.6 | 1.4 97% | 29.4 33% | 44 -1% | 35.2 19% |
| Witcher 3 ultra * (Watt) | 34 | ||||
| Load Maximum * (Watt) | 40.5 | 15.6 61% | 29.6 27% | 61 -51% | 34.6 15% |
* ... menor é melhor
| Lenovo Flex 6-14IKB i5-8250U, GeForce MX130, 45 Wh | Asus VivoBook Flip 14 TP401NA Pentium N4200, HD Graphics 505, 39 Wh | Acer Spin 3 SP314-51-548L i5-8250U, UHD Graphics 620, 52.5 Wh | HP Pavilion x360 14-ba011ng i5-7200U, GeForce 940MX, 41.5 Wh | Lenovo Yoga 920-13IKB-80Y7 i5-8550U, UHD Graphics 620, 70 Wh | |
|---|---|---|---|---|---|
| Duração da bateria | |||||
| WiFi v1.3 (h) | 6.9 | 6.5 -6% | 8.3 20% | 6.2 -10% | 11.4 65% |
Pro
Contra
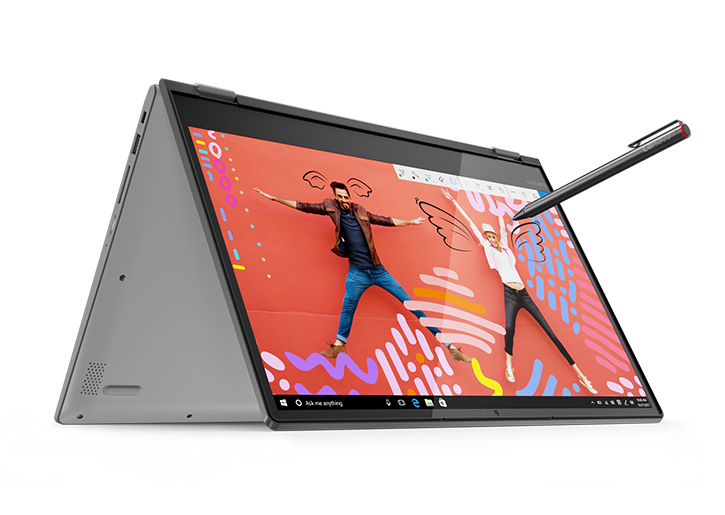
O Flex 6 14 da Lenovo representa outra opção de consumidor intermediário para quem procura um conversível de tamanho moderado, mas não está disposto a gastar o dinheiro em uma opção mais sofisticada, como o Yoga 920. Comparado com seus irmãos mais caros, o Flex 6 14 conta com uma carcaça de plástico mais frágil e um estilo esteticamente medíocre, mas pelo menos tem um descanso de mãos de metal escovado e marcos finos para um design mais modernizado. Os dispositivos de entrada são aceitáveis, mas os datilógrafos que esperam o luxo de um teclado de Ultrabook premium devem passar algum tempo com o Flex 6 14 antes de decidir. Da mesma forma, a tela é suficiente para uso interno, mas seu acabamento refletivo e brilho fraco são rapidamente superados por reflexos disruptivos em exteriores.
O Flex 6 14 da Lenovo faz sentido para alguém interessado em um conversível de bom desempenho com opções de stylus ativo que talvez não esteja tão preocupado com os dispositivos de entrada premium e design de carcaça, ou o uso em exteriores.
Apesar das noções de design, o desempenho do Flex 6 14 é perfeitamente adequado. Graças ao seu Core i5 2430M, GeForce MX130 de 8va geração, memória física suficiente e SSD NVMe, o Flex ultrapassa muitos dos seus pares no que diz respeito ao desempenho de armazenamento e capacidade gráfica. Este não é um portátil para jogos, mas é bom ter essa flexibilidade se a função sobre a forma for o tema do dia. A inclusão de um Lenovo Active Pen com nossa configuração de teste também é um bônus para qualquer pessoa que prefira entradas ou desenho com caneta.
A $800, o Flex 6 14 da Lenovo faz sentido para alguém interessado em um conversível de bom desempenho com opções de stylus ativo que talvez não esteja tão preocupado com os dispositivos de entrada premium e design/estabilidade da carcaça, ou o uso em exteriores. Por algumas centenas de dólares a mais, a próxima série de máquinas (Yoga 920, XPS 13) resolve a maioria dessas queixas - mas com as revisões de hoje, o Flex 6 14 parece ser um concorrente de gama média mais prático do que seus antecessores.
Lenovo Flex 6-14IKB
- 06/09/2018 v6 (old)
Steve Schardein
Price comparison
