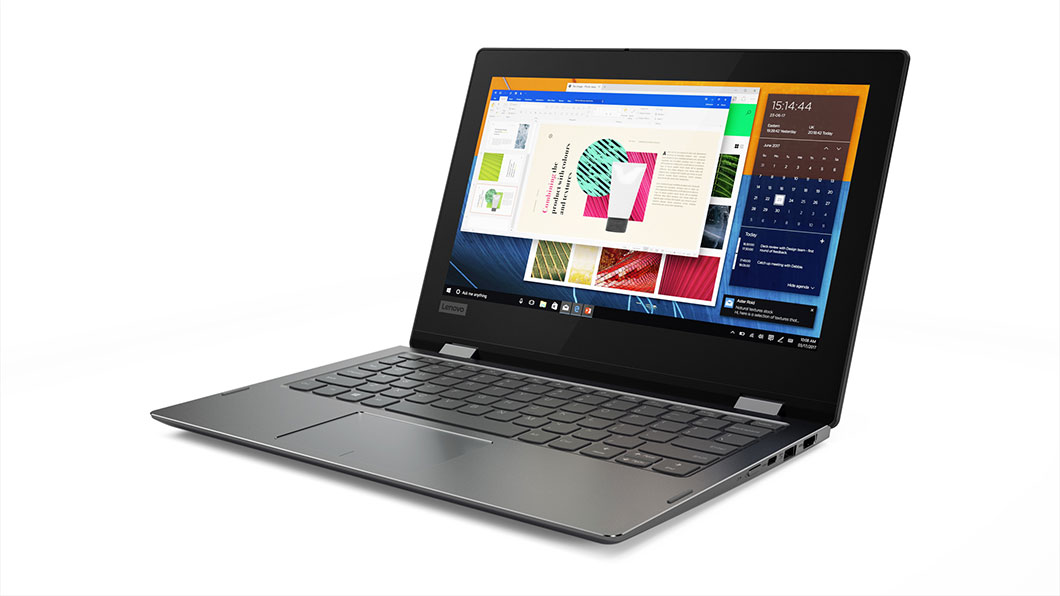
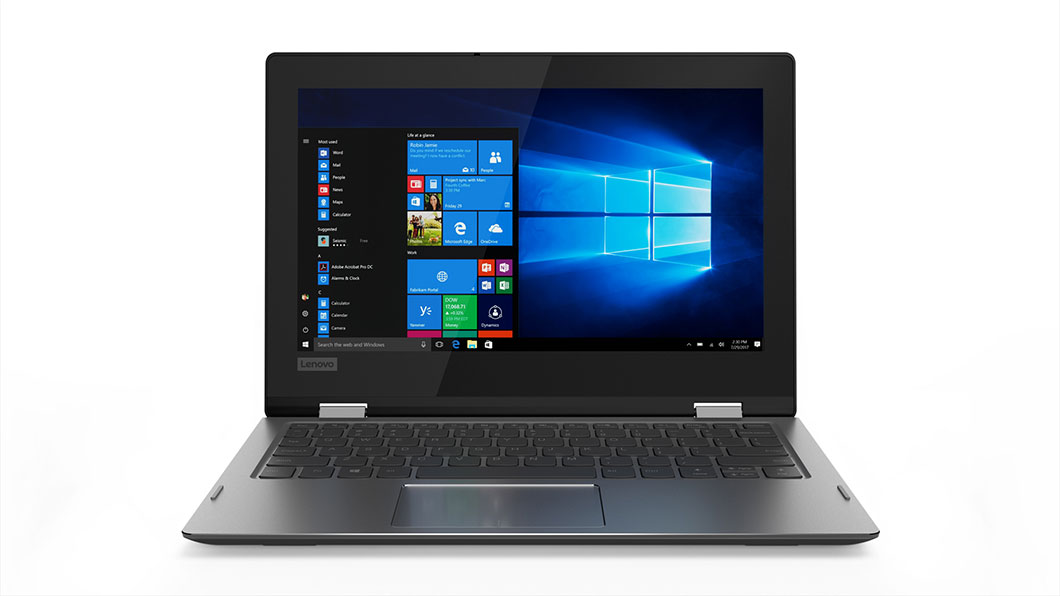
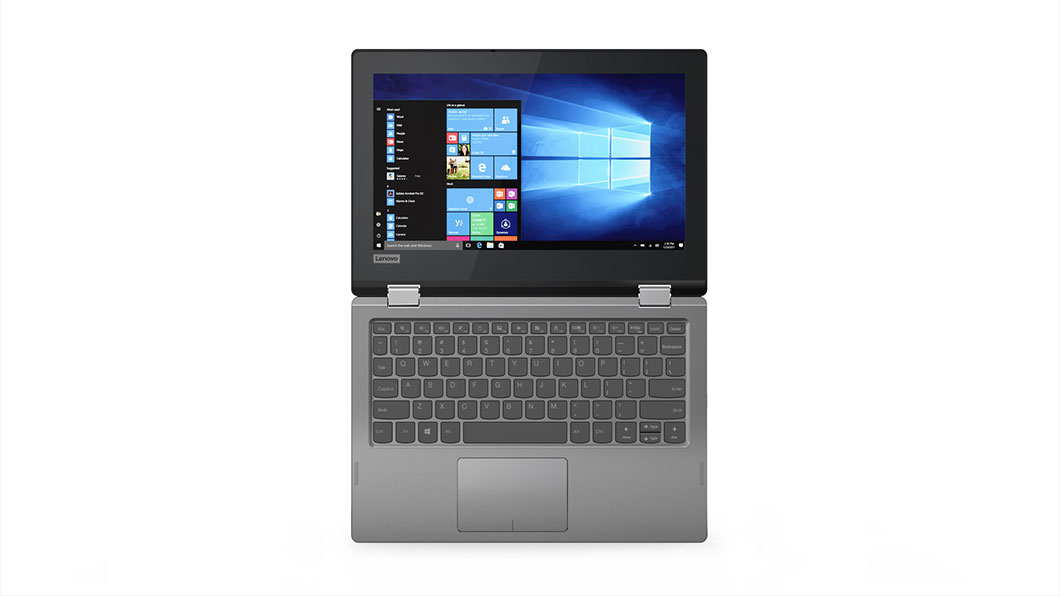
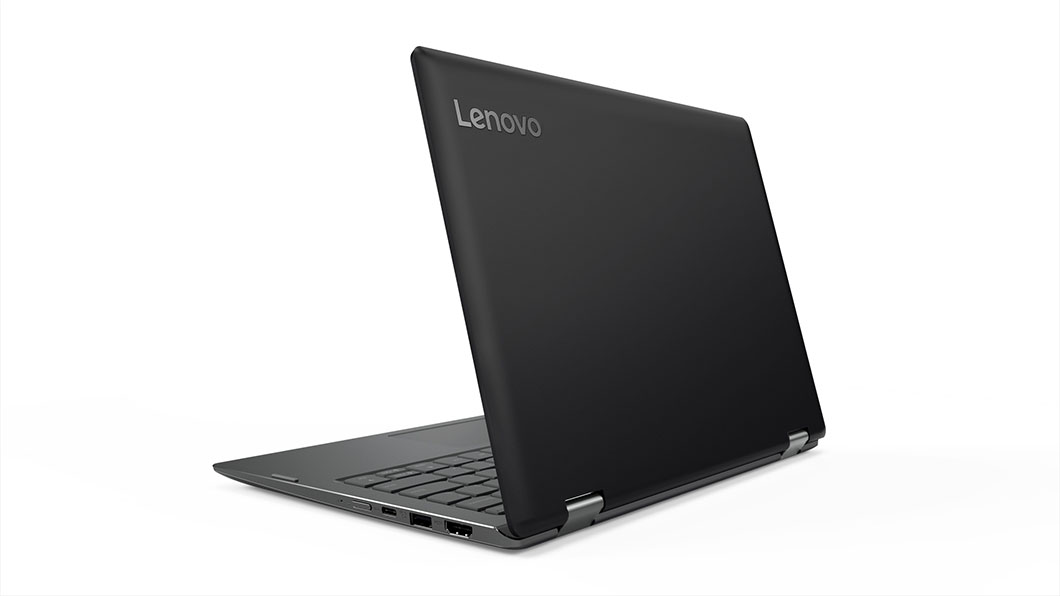
Breve Análise do Conversível Lenovo Flex 6 11 (Celeron N4000)
| SD Card Reader | |
| average JPG Copy Test (av. of 3 runs) | |
| Lenovo Flex 6-11IGM (Toshiba Exceria Pro SDXC 64 GB UHS-II) | |
| Lenovo Ideapad 120s-11IAP (Toshiba Exceria Pro M401) | |
| HP Pavilion x360 11t T5M27AV (Toshiba Exceria Pro SDXC 64 GB UHS-II) | |
| Acer TravelMate Spin B1 118-RN-P6BE (Toshiba Exceria Pro SDXC 64 GB UHS-II) | |
| maximum AS SSD Seq Read Test (1GB) | |
| Lenovo Flex 6-11IGM (Toshiba Exceria Pro SDXC 64 GB UHS-II) | |
| Lenovo Ideapad 120s-11IAP (Toshiba Exceria Pro M401) | |
| HP Pavilion x360 11t T5M27AV (Toshiba Exceria Pro SDXC 64 GB UHS-II) | |
| Acer TravelMate Spin B1 118-RN-P6BE (Toshiba Exceria Pro SDXC 64 GB UHS-II) | |
| Networking | |
| iperf3 transmit AX12 | |
| Acer TravelMate Spin B1 118-RN-P6BE | |
| Asus VivoBook Flip 12 TP203NAH-BP049T | |
| Lenovo Flex 6-11IGM | |
| Lenovo Ideapad 120s-11IAP | |
| HP Pavilion x360 11t T5M27AV | |
| iperf3 receive AX12 | |
| Acer TravelMate Spin B1 118-RN-P6BE | |
| Lenovo Ideapad 120s-11IAP | |
| Asus VivoBook Flip 12 TP203NAH-BP049T | |
| Lenovo Flex 6-11IGM | |
| HP Pavilion x360 11t T5M27AV | |
| |||||||||||||||||||||||||
iluminação: 80 %
iluminação com acumulador: 257.4 cd/m²
Contraste: 468:1 (Preto: 0.55 cd/m²)
ΔE ColorChecker Calman: 11.97 | ∀{0.5-29.43 Ø4.71}
calibrated: 3.71
ΔE Greyscale Calman: 12.3 | ∀{0.09-98 Ø4.96}
63.7% sRGB (Argyll 1.6.3 3D)
40.7% AdobeRGB 1998 (Argyll 1.6.3 3D)
44.16% AdobeRGB 1998 (Argyll 3D)
63.9% sRGB (Argyll 3D)
42.72% Display P3 (Argyll 3D)
Gamma: 2.03
CCT: 13739 K
| Lenovo Flex 6-11IGM Chi Mei CMN1132, TN LED, 11.6", 1366x768 | Lenovo Ideapad 120s-11IAP AU Optronics AUO-B116XTN02.5 , TN LED, 11.6", 1366x768 | HP Pavilion x360 11t T5M27AV LG Philips LGD0497, IPS, 11.6", 1366x768 | Apple MacBook Air 11 inch 2015-03 APP9CF3, TN, 11", 1366x768 | Asus VivoBook Flip 12 TP203NAH-BP049T AU Optronics B116XAN04.3, IPS, 11.6", 1366x768 | Acer TravelMate Spin B1 118-RN-P6BE LM116LF3L02, IPS LED, 11.6", 1920x1080 | |
|---|---|---|---|---|---|---|
| Display | -9% | -4% | -5% | 4% | 61% | |
| Display P3 Coverage (%) | 42.72 | 39.03 -9% | 41.11 -4% | 40.56 -5% | 44.23 4% | 71.6 68% |
| sRGB Coverage (%) | 63.9 | 58.7 -8% | 61.8 -3% | 60.6 -5% | 66.3 4% | 97.5 53% |
| AdobeRGB 1998 Coverage (%) | 44.16 | 40.33 -9% | 42.47 -4% | 41.95 -5% | 45.73 4% | 71.6 62% |
| Response Times | -51% | -4% | -4% | -10% | ||
| Response Time Grey 50% / Grey 80% * (ms) | 33.6 ? | 72.8 ? -117% | 42.8 ? -27% | 39 ? -16% | 38 ? -13% | |
| Response Time Black / White * (ms) | 27.2 ? | 22.8 ? 16% | 22 ? 19% | 25 ? 8% | 29.2 ? -7% | |
| PWM Frequency (Hz) | 25000 ? | 1000 ? | ||||
| Screen | -4% | 26% | 44% | 51% | 63% | |
| Brightness middle (cd/m²) | 257.4 | 266.2 3% | 245.2 -5% | 368 43% | 253 -2% | 324 26% |
| Brightness (cd/m²) | 243 | 251 3% | 219 -10% | 349 44% | 245 1% | 290 19% |
| Brightness Distribution (%) | 80 | 90 13% | 79 -1% | 90 13% | 65 -19% | 80 0% |
| Black Level * (cd/m²) | 0.55 | 0.67 -22% | 0.32 42% | 0.493 10% | 0.17 69% | 0.23 58% |
| Contrast (:1) | 468 | 397 -15% | 766 64% | 746 59% | 1488 218% | 1409 201% |
| Colorchecker dE 2000 * | 11.97 | 12.4 -4% | 5.5 54% | 3.29 73% | 3.17 74% | 3.7 69% |
| Colorchecker dE 2000 max. * | 30.48 | 24.5 20% | 16.9 45% | 5.22 83% | 8.13 73% | 7.4 76% |
| Colorchecker dE 2000 calibrated * | 3.71 | |||||
| Greyscale dE 2000 * | 12.3 | 14.4 -17% | 2.9 76% | 3.06 75% | 2 84% | 4 67% |
| Gamma | 2.03 108% | 2.16 102% | 2.2 100% | 2.68 82% | 2.43 91% | 2.13 103% |
| CCT | 13739 47% | 19436 33% | 6157 106% | 6397 102% | 6850 95% | 6971 93% |
| Color Space (Percent of AdobeRGB 1998) (%) | 40.7 | 37 -9% | 39 -4% | 38.8 -5% | 42 3% | 63.7 57% |
| Color Space (Percent of sRGB) (%) | 63.7 | 59 -7% | 62 -3% | 66 4% | 97.3 53% | |
| Média Total (Programa/Configurações) | -21% /
-11% | 6% /
16% | 20% /
32% | 17% /
34% | 38% /
53% |
* ... menor é melhor
Exibir tempos de resposta
| ↔ Tempo de resposta preto para branco | ||
|---|---|---|
| 27.2 ms ... ascensão ↗ e queda ↘ combinadas | ↗ 20.4 ms ascensão | 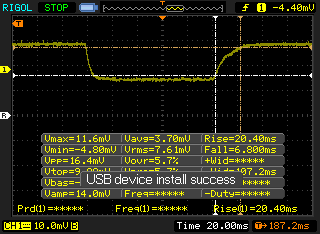 |
| ↘ 6.8 ms queda | ||
| A tela mostra taxas de resposta relativamente lentas em nossos testes e pode ser muito lenta para os jogadores. Em comparação, todos os dispositivos testados variam de 0.1 (mínimo) a 240 (máximo) ms. » 69 % de todos os dispositivos são melhores. Isso significa que o tempo de resposta medido é pior que a média de todos os dispositivos testados (19.8 ms). | ||
| ↔ Tempo de resposta 50% cinza a 80% cinza | ||
| 33.6 ms ... ascensão ↗ e queda ↘ combinadas | ↗ 20.4 ms ascensão | 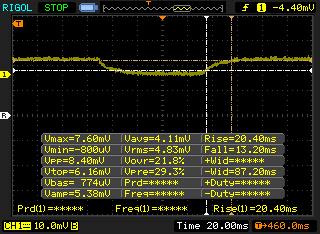 |
| ↘ 13.2 ms queda | ||
| A tela mostra taxas de resposta lentas em nossos testes e será insatisfatória para os jogadores. Em comparação, todos os dispositivos testados variam de 0.165 (mínimo) a 636 (máximo) ms. » 46 % de todos os dispositivos são melhores. Isso significa que o tempo de resposta medido é semelhante à média de todos os dispositivos testados (31 ms). | ||
Cintilação da tela / PWM (modulação por largura de pulso)
| Tela tremeluzindo/PWM detectado | 25000 Hz | ≤ 24 % configuração de brilho | 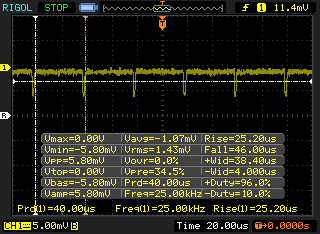 |
A luz de fundo da tela pisca em 25000 Hz (pior caso, por exemplo, utilizando PWM) Cintilação detectada em uma configuração de brilho de 24 % e abaixo. Não deve haver cintilação ou PWM acima desta configuração de brilho. A frequência de 25000 Hz é bastante alta, então a maioria dos usuários sensíveis ao PWM não deve notar nenhuma oscilação. [pwm_comparison] Em comparação: 52 % de todos os dispositivos testados não usam PWM para escurecer a tela. Se PWM foi detectado, uma média de 7754 (mínimo: 5 - máximo: 343500) Hz foi medida. | |||
| Cinebench R15 | |
| CPU Single 64Bit | |
| Huawei Matebook E | |
| Apple MacBook 12 (Early 2016) 1.1 GHz | |
| Apple MacBook 12 (Early 2016) 1.1 GHz | |
| Apple MacBook Air 11 inch 2015-03 | |
| Acer Swift 1 SF114-32-P8GG | |
| Lenovo Flex 6-11IGM | |
| Asus VivoBook Flip 12 TP203NAH-BP049T | |
| Acer TravelMate Spin B1 118-RN-P6BE | |
| Lenovo Ideapad 120s-11IAP | |
| HP Pavilion x360 11t T5M27AV | |
| CPU Multi 64Bit | |
| Huawei Matebook E | |
| Apple MacBook Air 11 inch 2015-03 | |
| Acer Swift 1 SF114-32-P8GG | |
| Apple MacBook 12 (Early 2016) 1.1 GHz | |
| Asus VivoBook Flip 12 TP203NAH-BP049T | |
| Lenovo Flex 6-11IGM | |
| Acer TravelMate Spin B1 118-RN-P6BE | |
| HP Pavilion x360 11t T5M27AV | |
| Lenovo Ideapad 120s-11IAP | |
| PCMark 8 - Home Score Accelerated v2 | |
| Huawei Matebook E | |
| Apple MacBook 12 (Early 2016) 1.1 GHz | |
| Asus VivoBook Flip 12 TP203NAH-BP049T | |
| Lenovo Flex 6-11IGM | |
| Acer TravelMate Spin B1 118-RN-P6BE | |
| Lenovo Ideapad 120s-11IAP | |
| HP Pavilion x360 11t T5M27AV | |
| PCMark 10 - Score | |
| Lenovo Flex 6-11IGM | |
| Acer TravelMate Spin B1 118-RN-P6BE | |
| Lenovo Ideapad 120s-11IAP | |
| PCMark 8 Home Score Accelerated v2 | 2040 pontos | |
| PCMark 10 Score | 1438 pontos | |
Ajuda | ||
| Lenovo Flex 6-11IGM SanDisk DF4064 | Lenovo Ideapad 120s-11IAP 64 GB eMMC Flash | Lenovo Yoga 730-13IKB-81CT Toshiba XG5 KXG50ZNV256G | HP Pavilion 17z 1EX13AV Avolusion MD1TBLSSHD | Média SanDisk DF4064 | |
|---|---|---|---|---|---|
| CrystalDiskMark 5.2 / 6 | -22% | 800% | -68% | -13% | |
| Write 4K (MB/s) | 14.29 | 12.19 -15% | 148.5 939% | 1.322 -91% | 12.7 ? -11% |
| Read 4K (MB/s) | 13.12 | 6.61 -50% | 27.48 109% | 0.545 -96% | 9.18 ? -30% |
| Write Seq (MB/s) | 117.9 | 108.2 -8% | 395.5 235% | 89.1 -24% | 108 ? -8% |
| Read Seq (MB/s) | 295.7 | 167.1 -43% | 1967 565% | 91.4 -69% | 219 ? -26% |
| Write 4K Q32T1 (MB/s) | 13.82 | 15.38 11% | 345 2396% | 1.239 -91% | 14.8 ? 7% |
| Read 4K Q32T1 (MB/s) | 37.36 | 31.28 -16% | 377.9 912% | 1.548 -96% | 34.3 ? -8% |
| Write Seq Q32T1 (MB/s) | 105.5 | 96.2 -9% | 425.5 303% | 90.3 -14% | 101 ? -4% |
| Read Seq Q32T1 (MB/s) | 240.7 | 134.1 -44% | 2500 939% | 88.3 -63% | 184.6 ? -23% |

| 3DMark 11 | |
| 1280x720 Performance GPU | |
| Apple MacBook Air 11 inch 2015-03 | |
| Apple MacBook 12 (Early 2016) 1.1 GHz | |
| Asus VivoBook Flip 12 TP203NAH-BP049T | |
| Lenovo Flex 6-11IGM | |
| Lenovo Ideapad 120s-11IAP | |
| Acer TravelMate Spin B1 118-RN-P6BE | |
| HP Pavilion x360 11t T5M27AV | |
| 1280x720 Performance Combined | |
| Apple MacBook Air 11 inch 2015-03 | |
| Apple MacBook 12 (Early 2016) 1.1 GHz | |
| Lenovo Flex 6-11IGM | |
| Lenovo Ideapad 120s-11IAP | |
| Asus VivoBook Flip 12 TP203NAH-BP049T | |
| HP Pavilion x360 11t T5M27AV | |
| Acer TravelMate Spin B1 118-RN-P6BE | |
| 3DMark 11 Performance | 572 pontos | |
Ajuda | ||
| baixo | média | alto | ultra | |
|---|---|---|---|---|
| BioShock Infinite (2013) | 19.9 | 9.2 |
| Lenovo Flex 6-11IGM UHD Graphics 600, Celeron N4000, SanDisk DF4064 | Apple MacBook Air 11 inch 2015-03 HD Graphics 6000, 5250U, Apple SSD SM0128F | Lenovo Ideapad 120s-11IAP HD Graphics 500, Celeron N3350, 64 GB eMMC Flash | HP Pavilion x360 11t T5M27AV HD Graphics 405 (Braswell), N3710, Toshiba MQ01ABF050 | Asus VivoBook Flip 12 TP203NAH-BP049T HD Graphics 505, Pentium N4200, Seagate Mobile HDD 1TB ST1000LM035 | Acer TravelMate Spin B1 118-RN-P6BE HD Graphics 505, Pentium N4200, SK Hynix HFS256G39TND-N210A | Apple MacBook 12 (Early 2016) 1.1 GHz HD Graphics 515, 6Y30, Apple SSD AP0256 | |
|---|---|---|---|---|---|---|---|
| Noise | |||||||
| Idle Minimum * (dB) | 29 | 31.7 | |||||
| Idle Average * (dB) | 29 | 31.7 | |||||
| Idle Maximum * (dB) | 29 | 31.7 | |||||
| Load Average * (dB) | 35.2 | 31.7 | |||||
| Load Maximum * (dB) | 43.1 | 31.7 | |||||
| desligado / ambiente * (dB) | 30.8 |
* ... menor é melhor
(+) A temperatura máxima no lado superior é 38.4 °C / 101 F, em comparação com a média de 35.9 °C / 97 F , variando de 21.4 a 59 °C para a classe Subnotebook.
(±) A parte inferior aquece até um máximo de 44.8 °C / 113 F, em comparação com a média de 39.2 °C / 103 F
(+) Em uso inativo, a temperatura média para o lado superior é 22.4 °C / 72 F, em comparação com a média do dispositivo de 30.8 °C / ### class_avg_f### F.
(+) Os apoios para as mãos e o touchpad são mais frios que a temperatura da pele, com um máximo de 31.8 °C / 89.2 F e, portanto, são frios ao toque.
(-) A temperatura média da área do apoio para as mãos de dispositivos semelhantes foi 28.2 °C / 82.8 F (-3.6 °C / -6.4 F).
| desligado | |
| Ocioso | |
| Carga |
|
Key:
min: | |
| Lenovo Flex 6-11IGM Celeron N4000, UHD Graphics 600, SanDisk DF4064, TN LED, 1366x768, 11.6" | Apple MacBook Air 11 inch 2015-03 5250U, HD Graphics 6000, Apple SSD SM0128F, TN, 1366x768, 11" | Lenovo Ideapad 120s-11IAP Celeron N3350, HD Graphics 500, 64 GB eMMC Flash, TN LED, 1366x768, 11.6" | HP Pavilion x360 11t T5M27AV N3710, HD Graphics 405 (Braswell), Toshiba MQ01ABF050, IPS, 1366x768, 11.6" | Asus VivoBook Flip 12 TP203NAH-BP049T Pentium N4200, HD Graphics 505, Seagate Mobile HDD 1TB ST1000LM035, IPS, 1366x768, 11.6" | Acer TravelMate Spin B1 118-RN-P6BE Pentium N4200, HD Graphics 505, SK Hynix HFS256G39TND-N210A, IPS LED, 1920x1080, 11.6" | |
|---|---|---|---|---|---|---|
| Power Consumption | -60% | 14% | -66% | -57% | -23% | |
| Idle Minimum * (Watt) | 2.7 | 2.5 7% | 2.8 -4% | 7.7 -185% | 5.7 -111% | 3.25 -20% |
| Idle Average * (Watt) | 4.5 | 5.1 -13% | 4.2 7% | 8.4 -87% | 7.8 -73% | 6.1 -36% |
| Idle Maximum * (Watt) | 5.7 | 6.1 -7% | 5.1 11% | 9.4 -65% | 8.7 -53% | 6.8 -19% |
| Load Average * (Watt) | 13.7 | 37.6 -174% | 11.8 14% | 14.7 -7% | 21 -53% | 15.1 -10% |
| Load Maximum * (Watt) | 20.3 | 43.4 -114% | 12.1 40% | 17.3 15% | 19 6% | 26.3 -30% |
* ... menor é melhor
| Lenovo Flex 6-11IGM Celeron N4000, UHD Graphics 600, 36 Wh | Apple MacBook Air 11 inch 2015-03 5250U, HD Graphics 6000, 38 Wh | Lenovo Ideapad 120s-11IAP Celeron N3350, HD Graphics 500, 32 Wh | HP Pavilion x360 11t T5M27AV N3710, HD Graphics 405 (Braswell), 34.6 Wh | Asus VivoBook Flip 12 TP203NAH-BP049T Pentium N4200, HD Graphics 505, 42 Wh | Acer TravelMate Spin B1 118-RN-P6BE Pentium N4200, HD Graphics 505, 48 Wh | Apple MacBook 12 (Early 2016) 1.1 GHz 6Y30, HD Graphics 515, 41.4 Wh | |
|---|---|---|---|---|---|---|---|
| Duração da bateria | -2% | -17% | -47% | -30% | -33% | -3% | |
| WiFi v1.3 (h) | 8.7 | 8.5 -2% | 7.2 -17% | 4.6 -47% | 6.1 -30% | 5.8 -33% | 8.4 -3% |
| Load (h) | 1.5 | 3.8 | 2.5 | 3.9 | |||
| Reader / Idle (h) | 15.3 | 7.5 |
Pro
Contra
Olhando netbooks na faixa de preço abaixo de $300, esperamos que sejam backups confiáveis e versáteis para o portátil ou PC principal do usuário. O Flex 6 11 pode ser o certo, com sua construção relativamente forte, longa duração da bateria, número respeitável de portas e formato versátil 2 em 1.
A principal desvantagem que nos impede recomendar totalmente o Flex 6 11 é sua tela TN 768p. Os ângulos de visão limitados estragam diretamente os recursos 2 em 1 porque as cores e o contraste são severamente afetados no modo tablet. Inclusive o concorrente HP Pavilion x360 11 é entregue com um painel IPS 768p para evitar este problema. É desconcertante não ver nenhuma opção IPS para o Lenovo, especialmente quando quase todos os tablets Android baratos estão equipados com uma tela IPS.
Esperamos que futuras revisões incorporem uma retro iluminação de teclado, uma tela mais brilhante, melhor desempenho do Turbo Boost, SIM opcional, marcos mais estreitos para reduzir o peso e um painel IPS como padrão.
O Flex 6 11 funciona bem como um portátil secundário para tarefas de processamento de texto leve e multimídia. Infelizmente, o painel TN forçado para cortar custos torna o modo tablet quase inútil, na prática.
Lenovo Flex 6-11IGM
- 05/29/2018 v6 (old)
Allen Ngo
Price comparison
