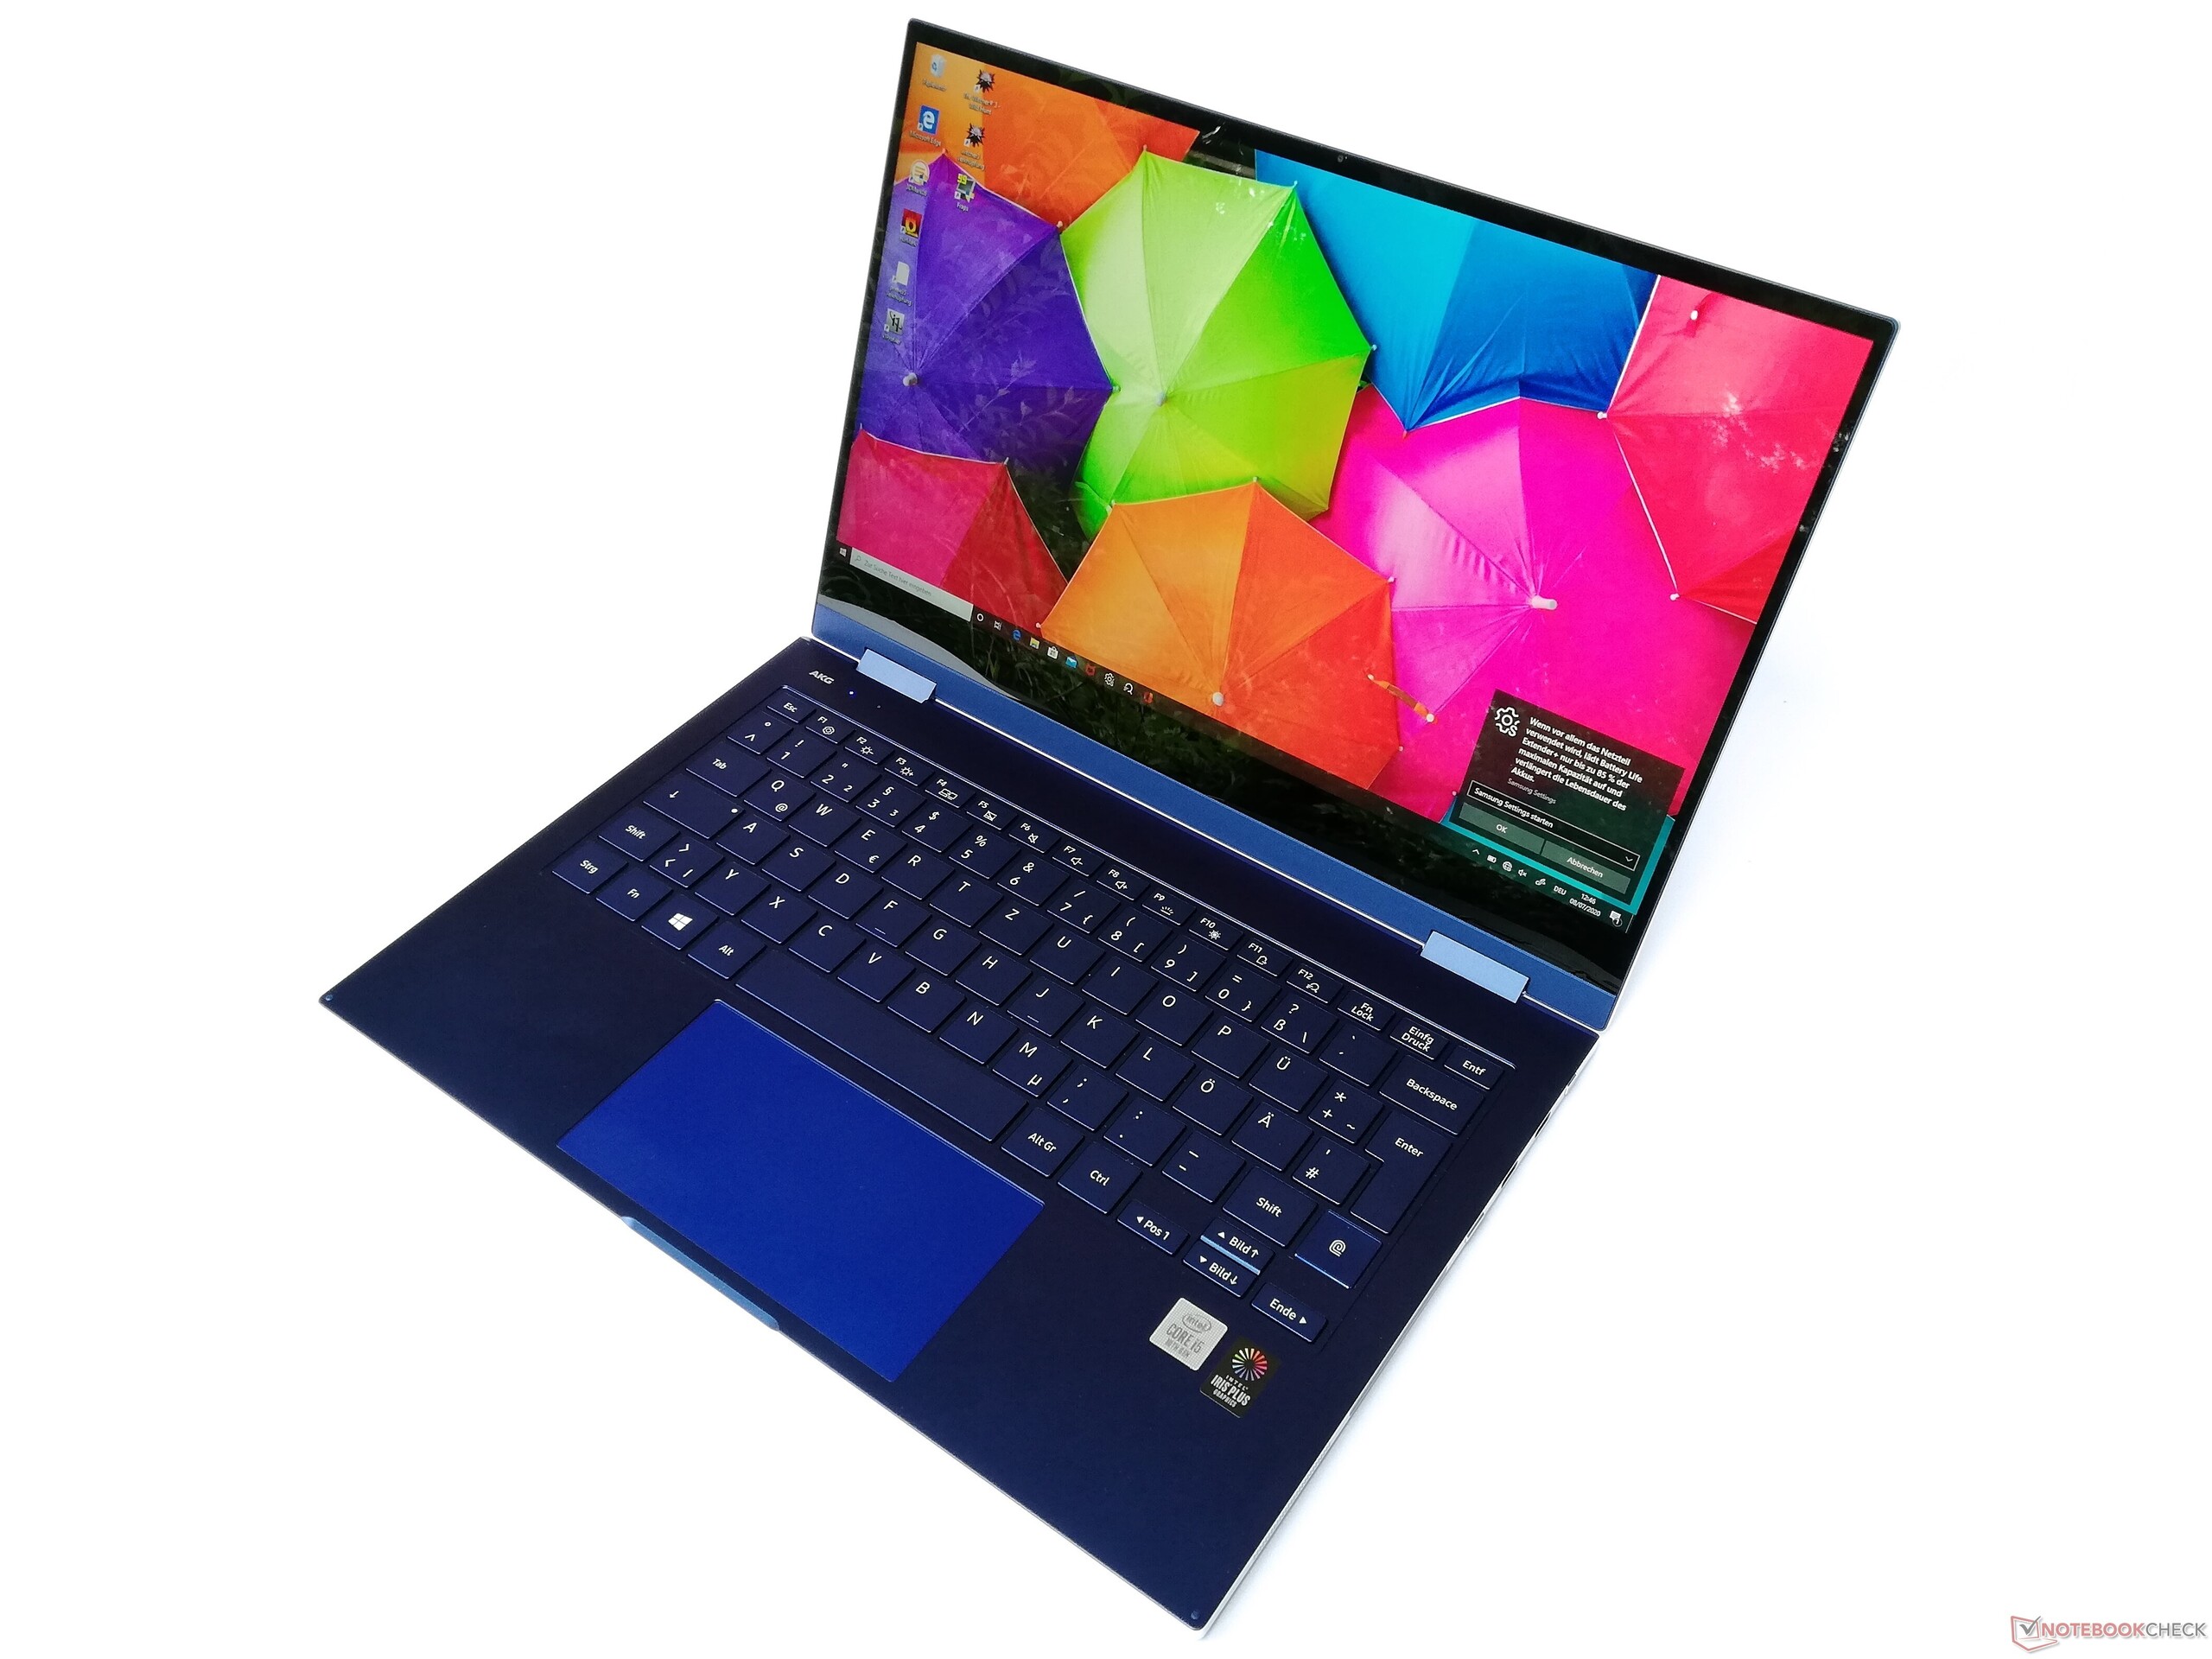
Breve Análise do Galaxy Book Flex 13.3: Conversível Samsung com tela brilhante
Avaliação | Data | Modelo | Peso | Altura | Size | Resolução | Preço |
|---|---|---|---|---|---|---|---|
| 84.4 % v7 (old) | 07/2020 | Samsung Galaxy Book Flex 13.3 i5-1035G4, Iris Plus Graphics G4 (Ice Lake 48 EU) | 1.2 kg | 13 mm | 13.30" | 1920x1080 | |
| 89.1 % v7 (old) | 10/2019 | Dell Latitude 7200 i5-8365U, UHD Graphics 620 | 1.2 kg | 9.35 mm | 12.30" | 1920x1280 | |
| 88.4 % v7 (old) | 11/2019 | Microsoft Surface Pro 7 Core i5-1035G4 i5-1035G4, Iris Plus Graphics G4 (Ice Lake 48 EU) | 1.1 kg | 8.5 mm | 12.30" | 2736x1824 | |
| 84.7 % v7 (old) | 08/2020 | Fujitsu Lifebook U939X i5-8265U, UHD Graphics 620 | 1 kg | 17 mm | 13.30" | 1920x1080 | |
| 88.2 % v7 (old) | 10/2019 | Lenovo Yoga C940-14IIL i7-1065G7, Iris Plus Graphics G7 (Ice Lake 64 EU) | 1.4 kg | 14.95 mm | 14.00" | 1920x1080 |
| SD Card Reader | |
| average JPG Copy Test (av. of 3 runs) | |
| Dell Latitude 7200 (Toshiba Exceria Pro M501 64 GB UHS-II) | |
| Fujitsu Lifebook U939X (Toshiba Exceria Pro SDXC 64 GB UHS-II) | |
| Samsung Galaxy Book Flex 13.3 (Toshiba Exceria Pro M501 microSDXC 64GB) | |
| Microsoft Surface Pro 7 Core i5-1035G4 (Toshiba Exceria Pro M501 64 GB UHS-II) | |
| Média da turma Convertible (28.1 - 197, n=23, últimos 2 anos) | |
| maximum AS SSD Seq Read Test (1GB) | |
| Dell Latitude 7200 (Toshiba Exceria Pro M501 64 GB UHS-II) | |
| Fujitsu Lifebook U939X (Toshiba Exceria Pro SDXC 64 GB UHS-II) | |
| Média da turma Convertible (28.9 - 254, n=22, últimos 2 anos) | |
| Samsung Galaxy Book Flex 13.3 (Toshiba Exceria Pro M501 microSDXC 64GB) | |
| Microsoft Surface Pro 7 Core i5-1035G4 (Toshiba Exceria Pro M501 64 GB UHS-II) | |


, i5-1035G4, Samsung SSD PM981a MZVLB256HBHQ")
, i5-1035G4, Samsung SSD PM981a MZVLB256HBHQ")
| |||||||||||||||||||||||||
iluminação: 86 %
iluminação com acumulador: 569 cd/m²
Contraste: 1213:1 (Preto: 0.39 cd/m²)
ΔE ColorChecker Calman: 5.18 | ∀{0.5-29.43 Ø4.73}
ΔE Greyscale Calman: 7.04 | ∀{0.09-98 Ø4.97}
Gamma: 2.35
CCT: 6753 K
| Samsung Galaxy Book Flex 13.3 BOE087A, IPS, 1920x1080, 13.3" | Dell Latitude 7200 SHP14A3 LQ123N1, IPS LED, 1920x1280, 12.3" | Microsoft Surface Pro 7 Core i5-1035G4 LG Philips LP123WQ112604, IPS, 2736x1824, 12.3" | Fujitsu Lifebook U939X Sharp SHP14B0, IPS, 1920x1080, 13.3" | Lenovo Yoga C940-14IIL LP140WF9-SPE2, IPS LED, 1920x1080, 14" | |
|---|---|---|---|---|---|
| Display | |||||
| Display P3 Coverage (%) | 71.6 | 66 | 66.6 | 66 | |
| sRGB Coverage (%) | 99.5 | 93.8 | 96.9 | 97.9 | |
| AdobeRGB 1998 Coverage (%) | 72.6 | 66.9 | 67.9 | 67.3 | |
| Response Times | -24% | 12% | -23% | -12% | |
| Response Time Grey 50% / Grey 80% * (ms) | 44 ? | 52 ? -18% | 34.8 ? 21% | 54.4 ? -24% | 49.6 ? -13% |
| Response Time Black / White * (ms) | 27 ? | 34.8 ? -29% | 26.4 ? 2% | 32.8 ? -21% | 30 ? -11% |
| PWM Frequency (Hz) | 1645 ? | 21550 ? | |||
| Screen | 29% | 3% | 9% | 28% | |
| Brightness middle (cd/m²) | 473 | 401 -15% | 480.4 2% | 325 -31% | 384 -19% |
| Brightness (cd/m²) | 434 | 385 -11% | 485 12% | 310 -29% | 363 -16% |
| Brightness Distribution (%) | 86 | 88 2% | 91 6% | 89 3% | 90 5% |
| Black Level * (cd/m²) | 0.39 | 0.28 28% | 0.48 -23% | 0.29 26% | 0.17 56% |
| Contrast (:1) | 1213 | 1432 18% | 1001 -17% | 1121 -8% | 2259 86% |
| Colorchecker dE 2000 * | 5.18 | 1.8 65% | 5 3% | 3.2 38% | 3.5 32% |
| Colorchecker dE 2000 max. * | 10.01 | 3.4 66% | 7.72 23% | 6.2 38% | 5.5 45% |
| Greyscale dE 2000 * | 7.04 | 1.6 77% | 5.9 16% | 4.4 37% | 4.6 35% |
| Gamma | 2.35 94% | 2.14 103% | 2.38 92% | 2.21 100% | 2.32 95% |
| CCT | 6753 96% | 6702 97% | 7805 83% | 7430 87% | 6884 94% |
| Colorchecker dE 2000 calibrated * | 1.1 | 2.44 | 1.1 | 1 | |
| Color Space (Percent of AdobeRGB 1998) (%) | 66.6 | 60.3 | 62.9 | 62 | |
| Color Space (Percent of sRGB) (%) | 99.4 | 93.2 | 96.6 | 97.7 | |
| Média Total (Programa/Configurações) | 3% /
18% | 8% /
5% | -7% /
3% | 8% /
20% |
* ... menor é melhor
Exibir tempos de resposta
| ↔ Tempo de resposta preto para branco | ||
|---|---|---|
| 27 ms ... ascensão ↗ e queda ↘ combinadas | ↗ 15 ms ascensão | 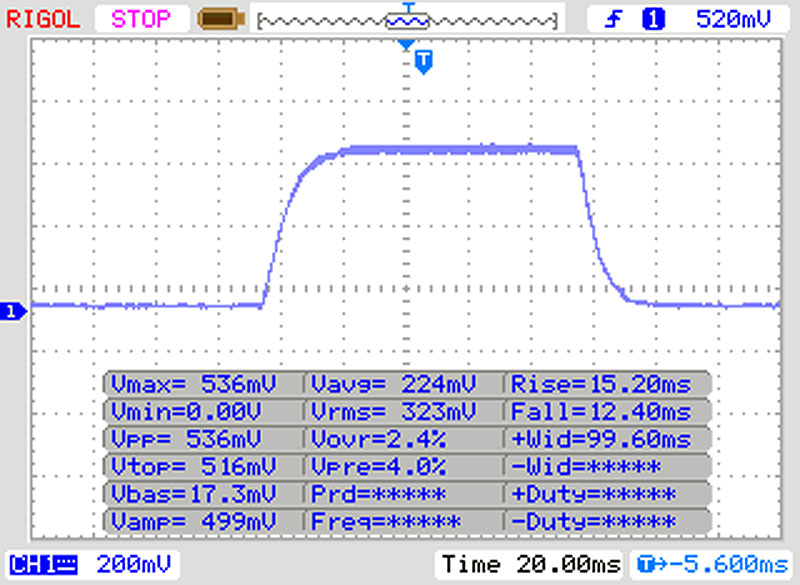 |
| ↘ 12 ms queda | ||
| A tela mostra taxas de resposta relativamente lentas em nossos testes e pode ser muito lenta para os jogadores. Em comparação, todos os dispositivos testados variam de 0.1 (mínimo) a 240 (máximo) ms. » 67 % de todos os dispositivos são melhores. Isso significa que o tempo de resposta medido é pior que a média de todos os dispositivos testados (19.9 ms). | ||
| ↔ Tempo de resposta 50% cinza a 80% cinza | ||
| 44 ms ... ascensão ↗ e queda ↘ combinadas | ↗ 19 ms ascensão | 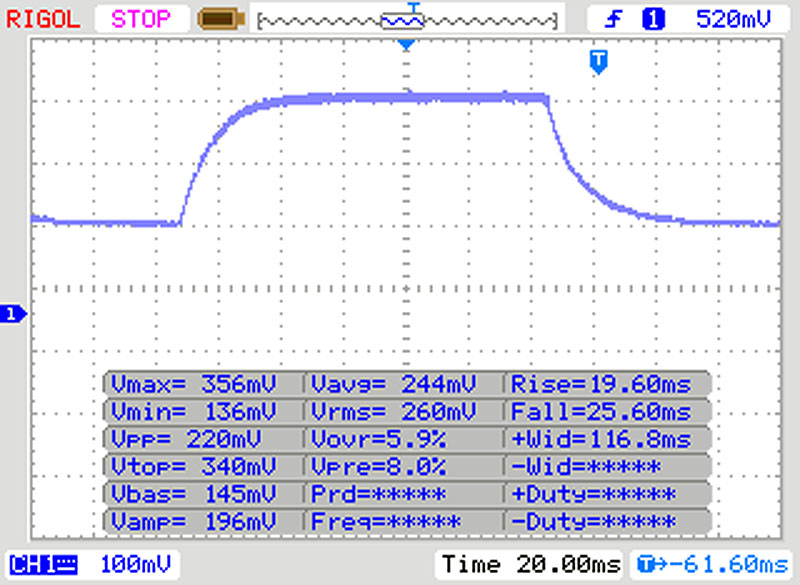 |
| ↘ 15 ms queda | ||
| A tela mostra taxas de resposta lentas em nossos testes e será insatisfatória para os jogadores. Em comparação, todos os dispositivos testados variam de 0.165 (mínimo) a 636 (máximo) ms. » 73 % de todos os dispositivos são melhores. Isso significa que o tempo de resposta medido é pior que a média de todos os dispositivos testados (31.1 ms). | ||
Cintilação da tela / PWM (modulação por largura de pulso)
| Tela tremeluzindo / PWM não detectado | 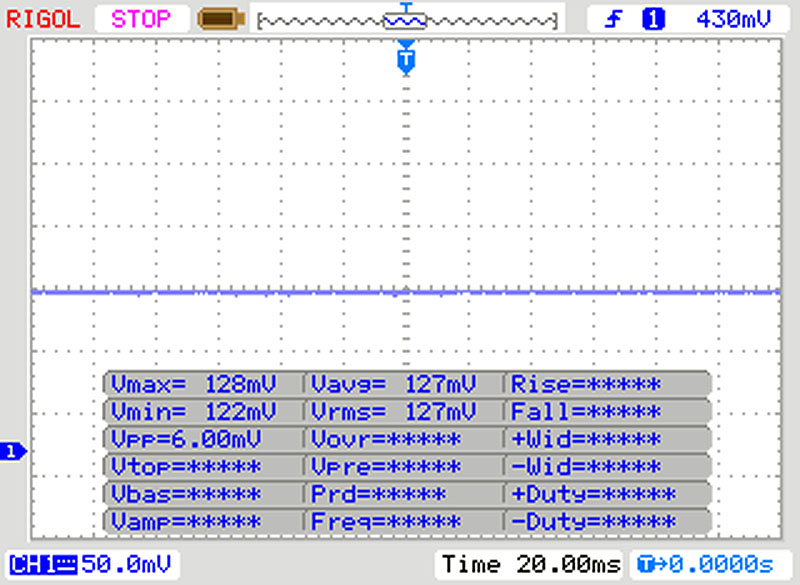 | ||
[pwm_comparison] Em comparação: 52 % de todos os dispositivos testados não usam PWM para escurecer a tela. Se PWM foi detectado, uma média de 7798 (mínimo: 5 - máximo: 343500) Hz foi medida. | |||
Cinebench R15: CPU Single 64Bit | CPU Multi 64Bit
Blender: v2.79 BMW27 CPU
7-Zip 18.03: 7z b 4 -mmt1 | 7z b 4
Geekbench 5.5: Single-Core | Multi-Core
HWBOT x265 Benchmark v2.2: 4k Preset
LibreOffice : 20 Documents To PDF
R Benchmark 2.5: Overall mean
| Cinebench R20 / CPU (Single Core) | |
| Média da turma Convertible (273 - 834, n=49, últimos 2 anos) | |
| Microsoft Surface Pro 7 Core i5-1035G4 | |
| Dell Latitude 7200 | |
| Samsung Galaxy Book Flex 13.3 | |
| Média Intel Core i5-1035G4 (357 - 441, n=6) | |
| Fujitsu Lifebook U939X | |
| Cinebench R20 / CPU (Multi Core) | |
| Média da turma Convertible (595 - 12102, n=49, últimos 2 anos) | |
| Dell Latitude 7200 | |
| Microsoft Surface Pro 7 Core i5-1035G4 | |
| Média Intel Core i5-1035G4 (892 - 1648, n=6) | |
| Samsung Galaxy Book Flex 13.3 | |
| Fujitsu Lifebook U939X | |
| Cinebench R15 / CPU Single 64Bit | |
| Média da turma Convertible (149.8 - 317, n=48, últimos 2 anos) | |
| Lenovo Yoga C940-14IIL | |
| Microsoft Surface Pro 7 Core i5-1035G4 | |
| Samsung Galaxy Book Flex 13.3 | |
| Média Intel Core i5-1035G4 (146.4 - 172, n=5) | |
| Dell Latitude 7200 | |
| Fujitsu Lifebook U939X | |
| Cinebench R15 / CPU Multi 64Bit | |
| Média da turma Convertible (478 - 4940, n=48, últimos 2 anos) | |
| Lenovo Yoga C940-14IIL | |
| Lenovo Yoga C940-14IIL | |
| Microsoft Surface Pro 7 Core i5-1035G4 | |
| Dell Latitude 7200 | |
| Média Intel Core i5-1035G4 (490 - 676, n=6) | |
| Samsung Galaxy Book Flex 13.3 | |
| Fujitsu Lifebook U939X | |
| Blender / v2.79 BMW27 CPU | |
| Samsung Galaxy Book Flex 13.3 | |
| Média Intel Core i5-1035G4 (703 - 1075, n=6) | |
| Fujitsu Lifebook U939X | |
| Microsoft Surface Pro 7 Core i5-1035G4 | |
| Dell Latitude 7200 | |
| Lenovo Yoga C940-14IIL | |
| Média da turma Convertible (105 - 1051, n=48, últimos 2 anos) | |
| 7-Zip 18.03 / 7z b 4 -mmt1 | |
| Média da turma Convertible (3672 - 6655, n=48, últimos 2 anos) | |
| Lenovo Yoga C940-14IIL | |
| Samsung Galaxy Book Flex 13.3 | |
| Fujitsu Lifebook U939X | |
| Dell Latitude 7200 | |
| Média Intel Core i5-1035G4 (1307 - 4190, n=6) | |
| Microsoft Surface Pro 7 Core i5-1035G4 | |
| 7-Zip 18.03 / 7z b 4 | |
| Média da turma Convertible (12977 - 121368, n=48, últimos 2 anos) | |
| Lenovo Yoga C940-14IIL | |
| Dell Latitude 7200 | |
| Fujitsu Lifebook U939X | |
| Média Intel Core i5-1035G4 (11030 - 19548, n=6) | |
| Samsung Galaxy Book Flex 13.3 | |
| Microsoft Surface Pro 7 Core i5-1035G4 | |
| Geekbench 5.5 / Single-Core | |
| Média da turma Convertible (806 - 2275, n=48, últimos 2 anos) | |
| Samsung Galaxy Book Flex 13.3 | |
| Média Intel Core i5-1035G4 (1081 - 1277, n=5) | |
| Fujitsu Lifebook U939X | |
| Geekbench 5.5 / Multi-Core | |
| Média da turma Convertible (1608 - 22023, n=48, últimos 2 anos) | |
| Samsung Galaxy Book Flex 13.3 | |
| Média Intel Core i5-1035G4 (3261 - 4315, n=5) | |
| Fujitsu Lifebook U939X | |
| HWBOT x265 Benchmark v2.2 / 4k Preset | |
| Média da turma Convertible (3.43 - 36.2, n=48, últimos 2 anos) | |
| Lenovo Yoga C940-14IIL | |
| Microsoft Surface Pro 7 Core i5-1035G4 | |
| Dell Latitude 7200 | |
| Média Intel Core i5-1035G4 (3.37 - 5.61, n=6) | |
| Fujitsu Lifebook U939X | |
| Samsung Galaxy Book Flex 13.3 | |
| LibreOffice / 20 Documents To PDF | |
| Média Intel Core i5-1035G4 (58.4 - 78.3, n=5) | |
| Samsung Galaxy Book Flex 13.3 | |
| Fujitsu Lifebook U939X | |
| Média da turma Convertible (42.5 - 84.3, n=48, últimos 2 anos) | |
| R Benchmark 2.5 / Overall mean | |
| Média Intel Core i5-1035G4 (0.701 - 0.825, n=5) | |
| Samsung Galaxy Book Flex 13.3 | |
| Fujitsu Lifebook U939X | |
| Média da turma Convertible (0.3915 - 0.84, n=48, últimos 2 anos) | |
* ... menor é melhor
| DPC Latencies / LatencyMon - interrupt to process latency (max), Web, Youtube, Prime95 | |
| Samsung Galaxy Book Flex 13.3 | |
| Fujitsu Lifebook U939X | |
* ... menor é melhor
| Samsung Galaxy Book Flex 13.3 Samsung SSD PM981a MZVLB256HBHQ | Dell Latitude 7200 WDC PC SN520 SDAPNUW-512G | Microsoft Surface Pro 7 Core i5-1035G4 Toshiba BG4 KBG40ZPZ256G | Fujitsu Lifebook U939X Samsung SSD PM981 MZVLB512HAJQ | Lenovo Yoga C940-14IIL Samsung SSD PM981 MZVLB512HAJQ | Média Samsung SSD PM981a MZVLB256HBHQ | |
|---|---|---|---|---|---|---|
| CrystalDiskMark 5.2 / 6 | -31% | -25% | -14% | -6% | -10% | |
| Write 4K (MB/s) | 157.9 | 131.9 -16% | 118.5 -25% | 158.5 0% | 128.4 -19% | 135.2 ? -14% |
| Read 4K (MB/s) | 48.37 | 45.47 -6% | 54.1 12% | 47.62 -2% | 46.37 -4% | 44.6 ? -8% |
| Write Seq (MB/s) | 2196 | 1021 -54% | 1166 -47% | 1573 -28% | 1863 -15% | 2091 ? -5% |
| Read Seq (MB/s) | 2064 | 1085 -47% | 1676 -19% | 1411 -32% | 2340 13% | 2097 ? 2% |
| Write 4K Q32T1 (MB/s) | 457 | 444.9 -3% | 330.5 -28% | 366.1 -20% | 451.1 -1% | 370 ? -19% |
| Read 4K Q32T1 (MB/s) | 514 | 366.6 -29% | 393.1 -24% | 451.9 -12% | 415.3 -19% | 372 ? -28% |
| Write Seq Q32T1 (MB/s) | 2354 | 1458 -38% | 1569 -33% | 1985 -16% | 2985 27% | 2308 ? -2% |
| Read Seq Q32T1 (MB/s) | 3557 | 1640 -54% | 2390 -33% | 3451 -3% | 2565 -28% | 3395 ? -5% |
| Write 4K Q8T8 (MB/s) | 437.2 | 451.4 | 208 ? | |||
| Read 4K Q8T8 (MB/s) | 988 | 1004 | 383 ? | |||
| AS SSD | 3% | -254% | 31% | 20% | -12% | |
| Seq Read (MB/s) | 2637 | 1294 -51% | 1590 -40% | 2723 3% | 2525 -4% | 2276 ? -14% |
| Seq Write (MB/s) | 2000 | 856 -57% | 714 -64% | 1864 -7% | 1253 -37% | 1486 ? -26% |
| 4K Read (MB/s) | 52.7 | 42.52 -19% | 50.7 -4% | 53.9 2% | 59.1 12% | 49.6 ? -6% |
| 4K Write (MB/s) | 148.4 | 141 -5% | 109.4 -26% | 143.8 -3% | 134.1 -10% | 129.5 ? -13% |
| 4K-64 Read (MB/s) | 647 | 983 52% | 924 43% | 1301 101% | 1010 56% | 683 ? 6% |
| 4K-64 Write (MB/s) | 865 | 1183 37% | 294.6 -66% | 1342 55% | 1461 69% | 895 ? 3% |
| Access Time Read * (ms) | 0.072 | 0.057 21% | 0.066 8% | 0.051 29% | 0.052 28% | 0.06433 ? 11% |
| Access Time Write * (ms) | 0.026 | 0.026 -0% | 0.697 -2581% | 0.027 -4% | 0.029 -12% | 0.04793 ? -84% |
| Score Read (Points) | 963 | 1155 20% | 1133 18% | 1627 69% | 1322 37% | 960 ? 0% |
| Score Write (Points) | 1214 | 1410 16% | 475 -61% | 1672 38% | 1721 42% | 1173 ? -3% |
| Score Total (Points) | 2653 | 3142 18% | 2157 -19% | 4097 54% | 3670 38% | 2598 ? -2% |
| Média Total (Programa/Configurações) | -14% /
-11% | -140% /
-157% | 9% /
12% | 7% /
9% | -11% /
-11% |
* ... menor é melhor

Continuous load read: DiskSpd Read Loop, Queue Depth 8
| 3DMark 11 Performance | 3513 pontos | |
| 3DMark Fire Strike Score | 1922 pontos | |
| 3DMark Time Spy Score | 741 pontos | |
Ajuda | ||
| Far Cry 5 - 1280x720 Low Preset AA:T | |
| Média da turma Convertible (15 - 142, n=20, últimos 2 anos) | |
| Média Intel Iris Plus Graphics G4 (Ice Lake 48 EU) (18 - 20, n=2) | |
| Samsung Galaxy Book Flex 13.3 | |
| baixo | média | alto | ultra | |
|---|---|---|---|---|
| The Witcher 3 (2015) | 37.2 | 21.2 | 12.4 | |
| Dota 2 Reborn (2015) | 56 | 33.2 | 20.5 | 19.6 |
| X-Plane 11.11 (2018) | 26.5 | 14.4 | 13.2 | |
| Far Cry 5 (2018) | 18 |
Barulho
| Ocioso |
| 30.7 / 30.7 / 30.7 dB |
| Carga |
| 34.8 / 34.5 dB |
 | ||
30 dB silencioso 40 dB(A) audível 50 dB(A) ruidosamente alto |
||
min: | ||
(±) A temperatura máxima no lado superior é 41.6 °C / 107 F, em comparação com a média de 35.4 °C / 96 F , variando de 19.6 a 60 °C para a classe Convertible.
(±) A parte inferior aquece até um máximo de 40.6 °C / 105 F, em comparação com a média de 36.9 °C / 98 F
(+) Em uso inativo, a temperatura média para o lado superior é 26.7 °C / 80 F, em comparação com a média do dispositivo de 30.3 °C / ### class_avg_f### F.
(±) Jogando The Witcher 3, a temperatura média para o lado superior é 34 °C / 93 F, em comparação com a média do dispositivo de 30.3 °C / ## #class_avg_f### F.
(+) Os apoios para as mãos e o touchpad estão atingindo a temperatura máxima da pele (32.4 °C / 90.3 F) e, portanto, não estão quentes.
(-) A temperatura média da área do apoio para as mãos de dispositivos semelhantes foi 28 °C / 82.4 F (-4.4 °C / -7.9 F).
Samsung Galaxy Book Flex 13.3 análise de áudio
(-) | alto-falantes não muito altos (###valor### dB)
Graves 100 - 315Hz
(-) | quase nenhum baixo - em média 22% menor que a mediana
(±) | a linearidade dos graves é média (11.9% delta para a frequência anterior)
Médios 400 - 2.000 Hz
(+) | médios equilibrados - apenas 2.4% longe da mediana
(+) | médios são lineares (5.8% delta para frequência anterior)
Altos 2 - 16 kHz
(+) | agudos equilibrados - apenas 4.5% longe da mediana
(±) | a linearidade dos máximos é média (7.1% delta para frequência anterior)
Geral 100 - 16.000 Hz
(±) | a linearidade do som geral é média (22.6% diferença em relação à mediana)
Comparado com a mesma classe
» 68% de todos os dispositivos testados nesta classe foram melhores, 5% semelhantes, 27% piores
» O melhor teve um delta de 6%, a média foi 20%, o pior foi 57%
Comparado com todos os dispositivos testados
» 67% de todos os dispositivos testados foram melhores, 6% semelhantes, 28% piores
» O melhor teve um delta de 4%, a média foi 24%, o pior foi 134%
Apple MacBook 12 (Early 2016) 1.1 GHz análise de áudio
(+) | os alto-falantes podem tocar relativamente alto (###valor### dB)
Graves 100 - 315Hz
(±) | graves reduzidos - em média 11.3% menor que a mediana
(±) | a linearidade dos graves é média (14.2% delta para a frequência anterior)
Médios 400 - 2.000 Hz
(+) | médios equilibrados - apenas 2.4% longe da mediana
(+) | médios são lineares (5.5% delta para frequência anterior)
Altos 2 - 16 kHz
(+) | agudos equilibrados - apenas 2% longe da mediana
(+) | os máximos são lineares (4.5% delta da frequência anterior)
Geral 100 - 16.000 Hz
(+) | o som geral é linear (10.2% diferença em relação à mediana)
Comparado com a mesma classe
» 7% de todos os dispositivos testados nesta classe foram melhores, 2% semelhantes, 91% piores
» O melhor teve um delta de 5%, a média foi 18%, o pior foi 53%
Comparado com todos os dispositivos testados
» 5% de todos os dispositivos testados foram melhores, 1% semelhantes, 94% piores
» O melhor teve um delta de 4%, a média foi 24%, o pior foi 134%
| desligado | |
| Ocioso | |
| Carga |
|
Key:
min: | |
| Samsung Galaxy Book Flex 13.3 i5-1035G4, Iris Plus Graphics G4 (Ice Lake 48 EU), Samsung SSD PM981a MZVLB256HBHQ, IPS, 1920x1080, 13.3" | Dell Latitude 7200 i5-8365U, UHD Graphics 620, WDC PC SN520 SDAPNUW-512G, IPS LED, 1920x1280, 12.3" | Microsoft Surface Pro 7 Core i5-1035G4 i5-1035G4, Iris Plus Graphics G4 (Ice Lake 48 EU), Toshiba BG4 KBG40ZPZ256G, IPS, 2736x1824, 12.3" | Fujitsu Lifebook U939X i5-8265U, UHD Graphics 620, Samsung SSD PM981 MZVLB512HAJQ, IPS, 1920x1080, 13.3" | Lenovo Yoga C940-14IIL i7-1065G7, Iris Plus Graphics G7 (Ice Lake 64 EU), Samsung SSD PM981 MZVLB512HAJQ, IPS LED, 1920x1080, 14" | Média Intel Iris Plus Graphics G4 (Ice Lake 48 EU) | Média da turma Convertible | |
|---|---|---|---|---|---|---|---|
| Power Consumption | 4% | -27% | 0% | -16% | 6% | -23% | |
| Idle Minimum * (Watt) | 3.3 | 3.3 -0% | 4.5 -36% | 3.4 -3% | 3.2 3% | 3.26 ? 1% | 4.29 ? -30% |
| Idle Average * (Watt) | 8.9 | 5.8 35% | 9.2 -3% | 5.9 34% | 7 21% | 7.28 ? 18% | 7.08 ? 20% |
| Idle Maximum * (Watt) | 10.4 | 6.5 37% | 9.6 8% | 9.2 12% | 8.9 14% | 8.66 ? 17% | 8.68 ? 17% |
| Load Average * (Watt) | 40 | 37 7% | 42 -5% | 34.1 15% | 47.6 -19% | 34.4 ? 14% | 44 ? -10% |
| Witcher 3 ultra * (Watt) | 28 | ||||||
| Load Maximum * (Watt) | 32 | 51.3 -60% | 63.5 -98% | 50.5 -58% | 63.1 -97% | 38.9 ? -22% | 67.3 ? -110% |
* ... menor é melhor
| Samsung Galaxy Book Flex 13.3 i5-1035G4, Iris Plus Graphics G4 (Ice Lake 48 EU), 69.7 Wh | Dell Latitude 7200 i5-8365U, UHD Graphics 620, 38 Wh | Microsoft Surface Pro 7 Core i5-1035G4 i5-1035G4, Iris Plus Graphics G4 (Ice Lake 48 EU), 45 Wh | Fujitsu Lifebook U939X i5-8265U, UHD Graphics 620, 50 Wh | Lenovo Yoga C940-14IIL i7-1065G7, Iris Plus Graphics G7 (Ice Lake 64 EU), 60 Wh | Média da turma Convertible | |
|---|---|---|---|---|---|---|
| Duração da bateria | -17% | 35% | 46% | -6% | 57% | |
| Reader / Idle (h) | 11.6 | 22.3 92% | 27.7 ? 139% | |||
| WiFi v1.3 (h) | 7.2 | 7 -3% | 10 39% | 10.5 46% | 10.6 47% | 11.9 ? 65% |
| Load (h) | 2.6 | 1.8 -31% | 1.9 -27% | 1.1 -58% | 1.779 ? -32% |
Pro
Contra
Veredicto - O Samsung Galaxy Book Flex 13.3 é um conversível sólido
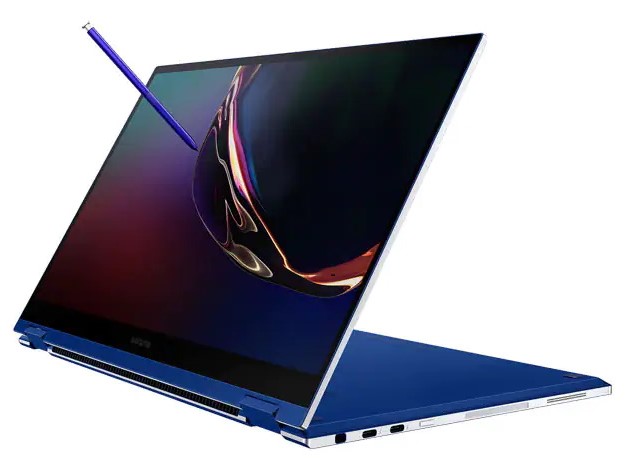
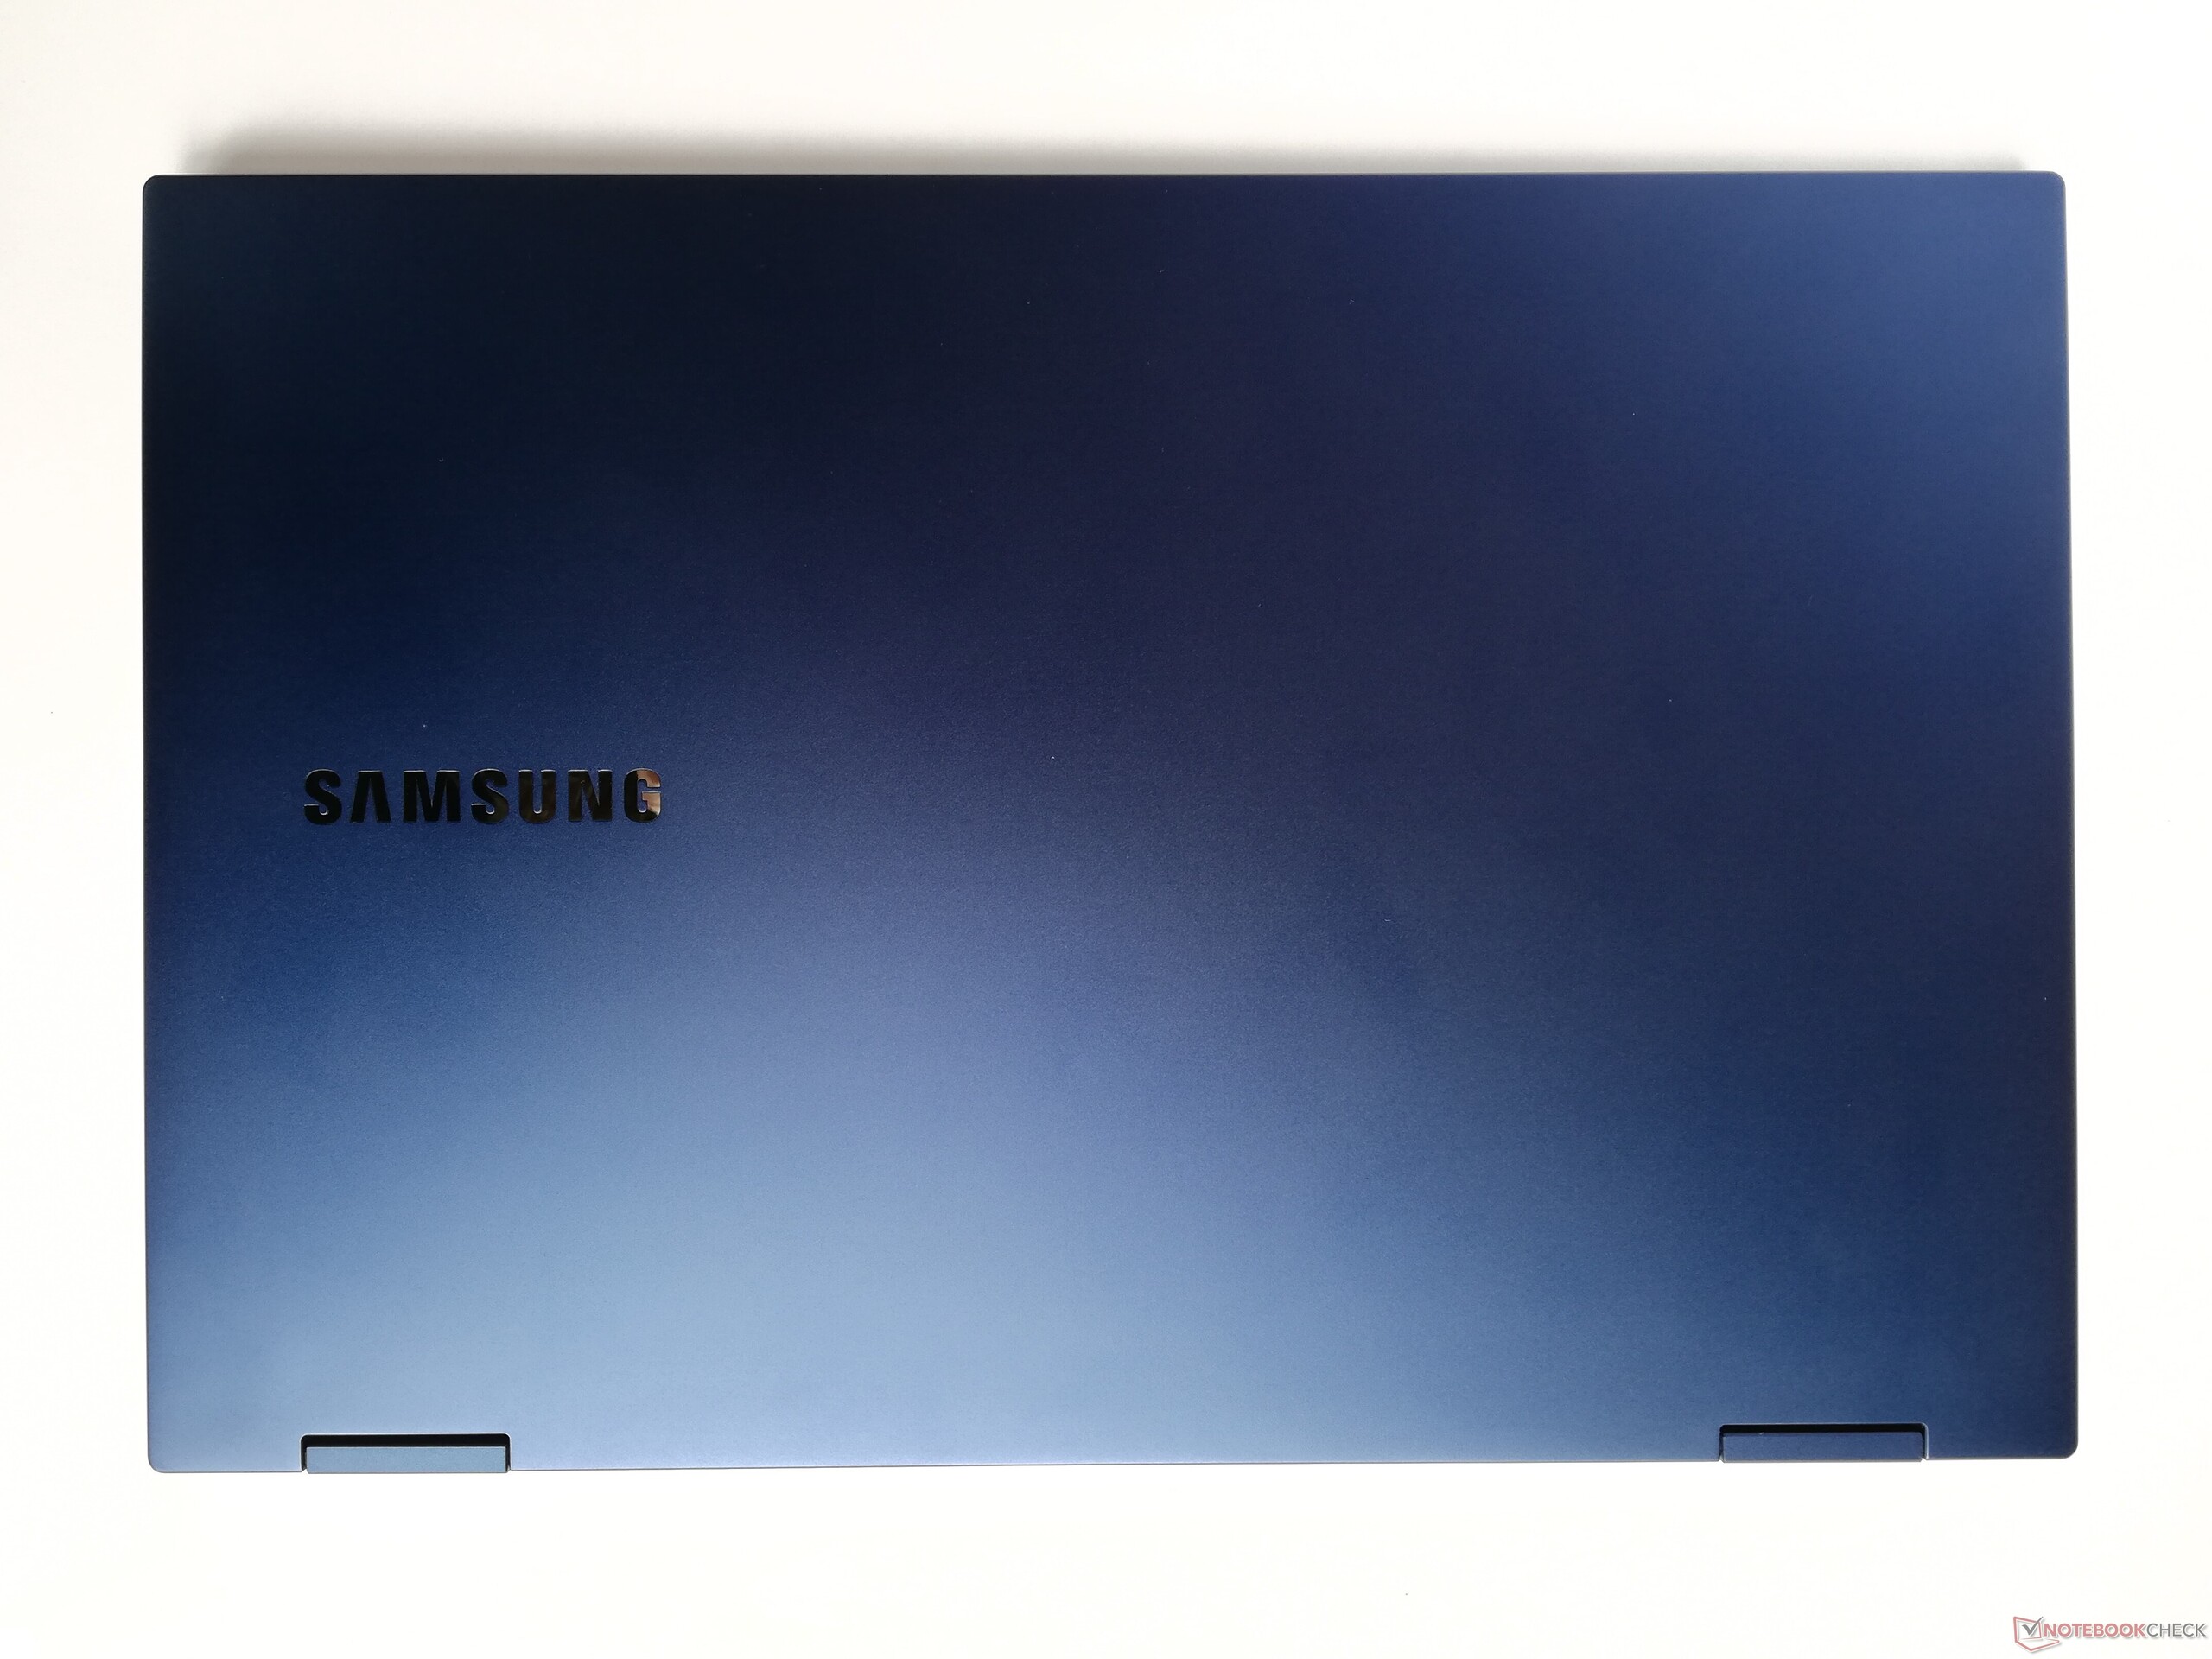
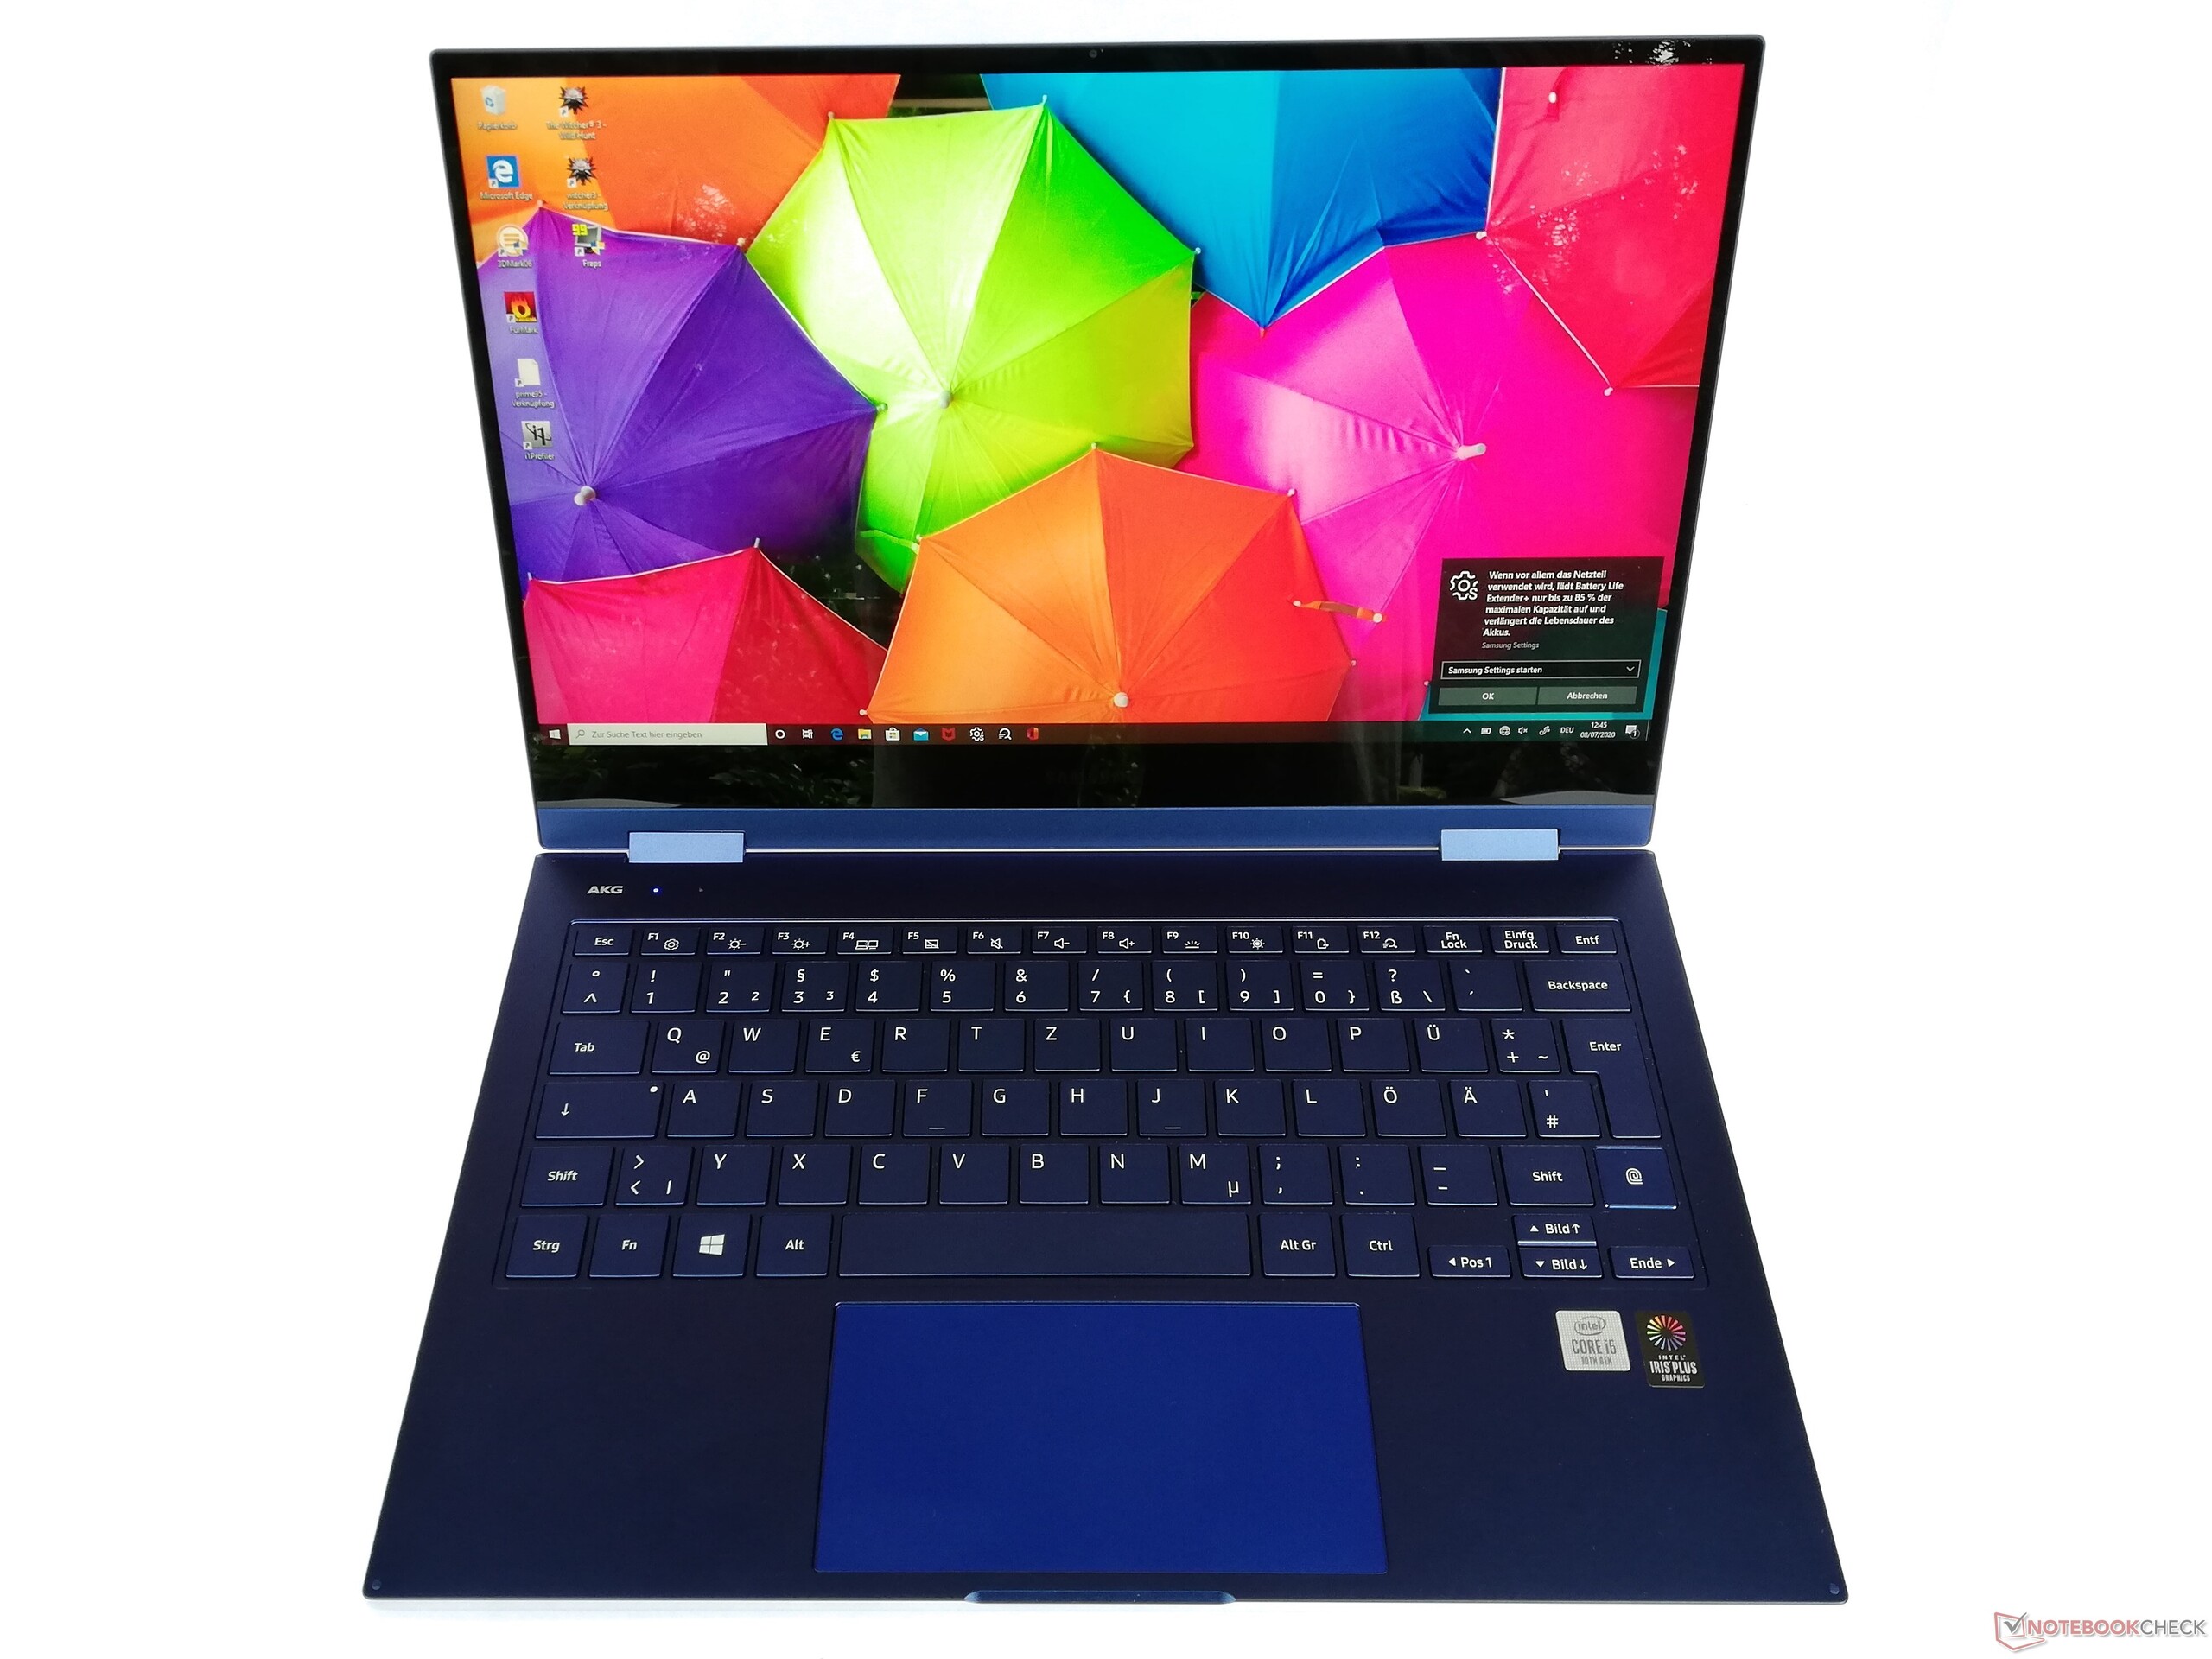
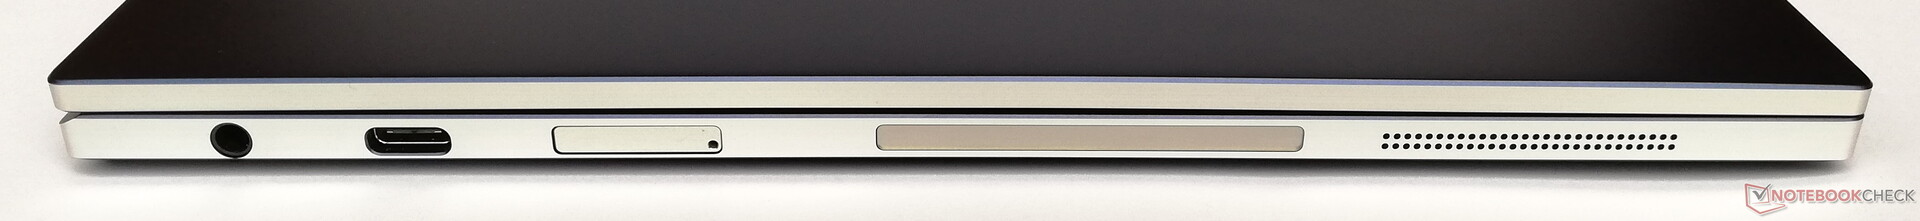
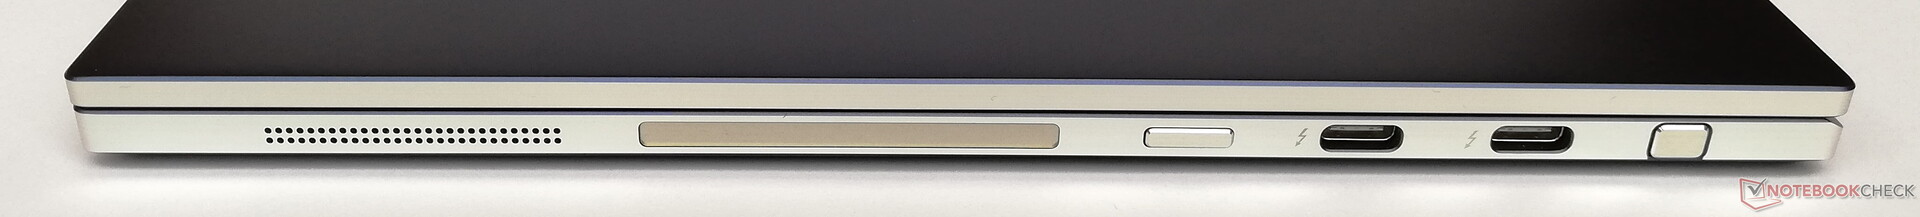
Com o Galaxy Book Flex 13.3, a Samsung entrega um conversível muito estável e visualmente atrativo. A tela não é tão boa quanto poderíamos observar com o Galaxy Book Ion 13.3, por exemplo, mas ainda é um dos melhores de sua classe. A tela táctil reage muito diretamente à entrada por toque, e também é fácil trabalhar com a S Pen incluída. O teclado e o ClickPad, que fornecem uma resposta agradável, também merecem um elogio. O fato de a conectividade ser um pouco ruim também pode ser facilmente superada graças às duas portas Thunderbolt 3.
Os compradores do Samsung Galaxy Book Flex 13.3 recebem um atraente conversível Windows que se destaca especialmente por seus bons dispositivos de entrada.
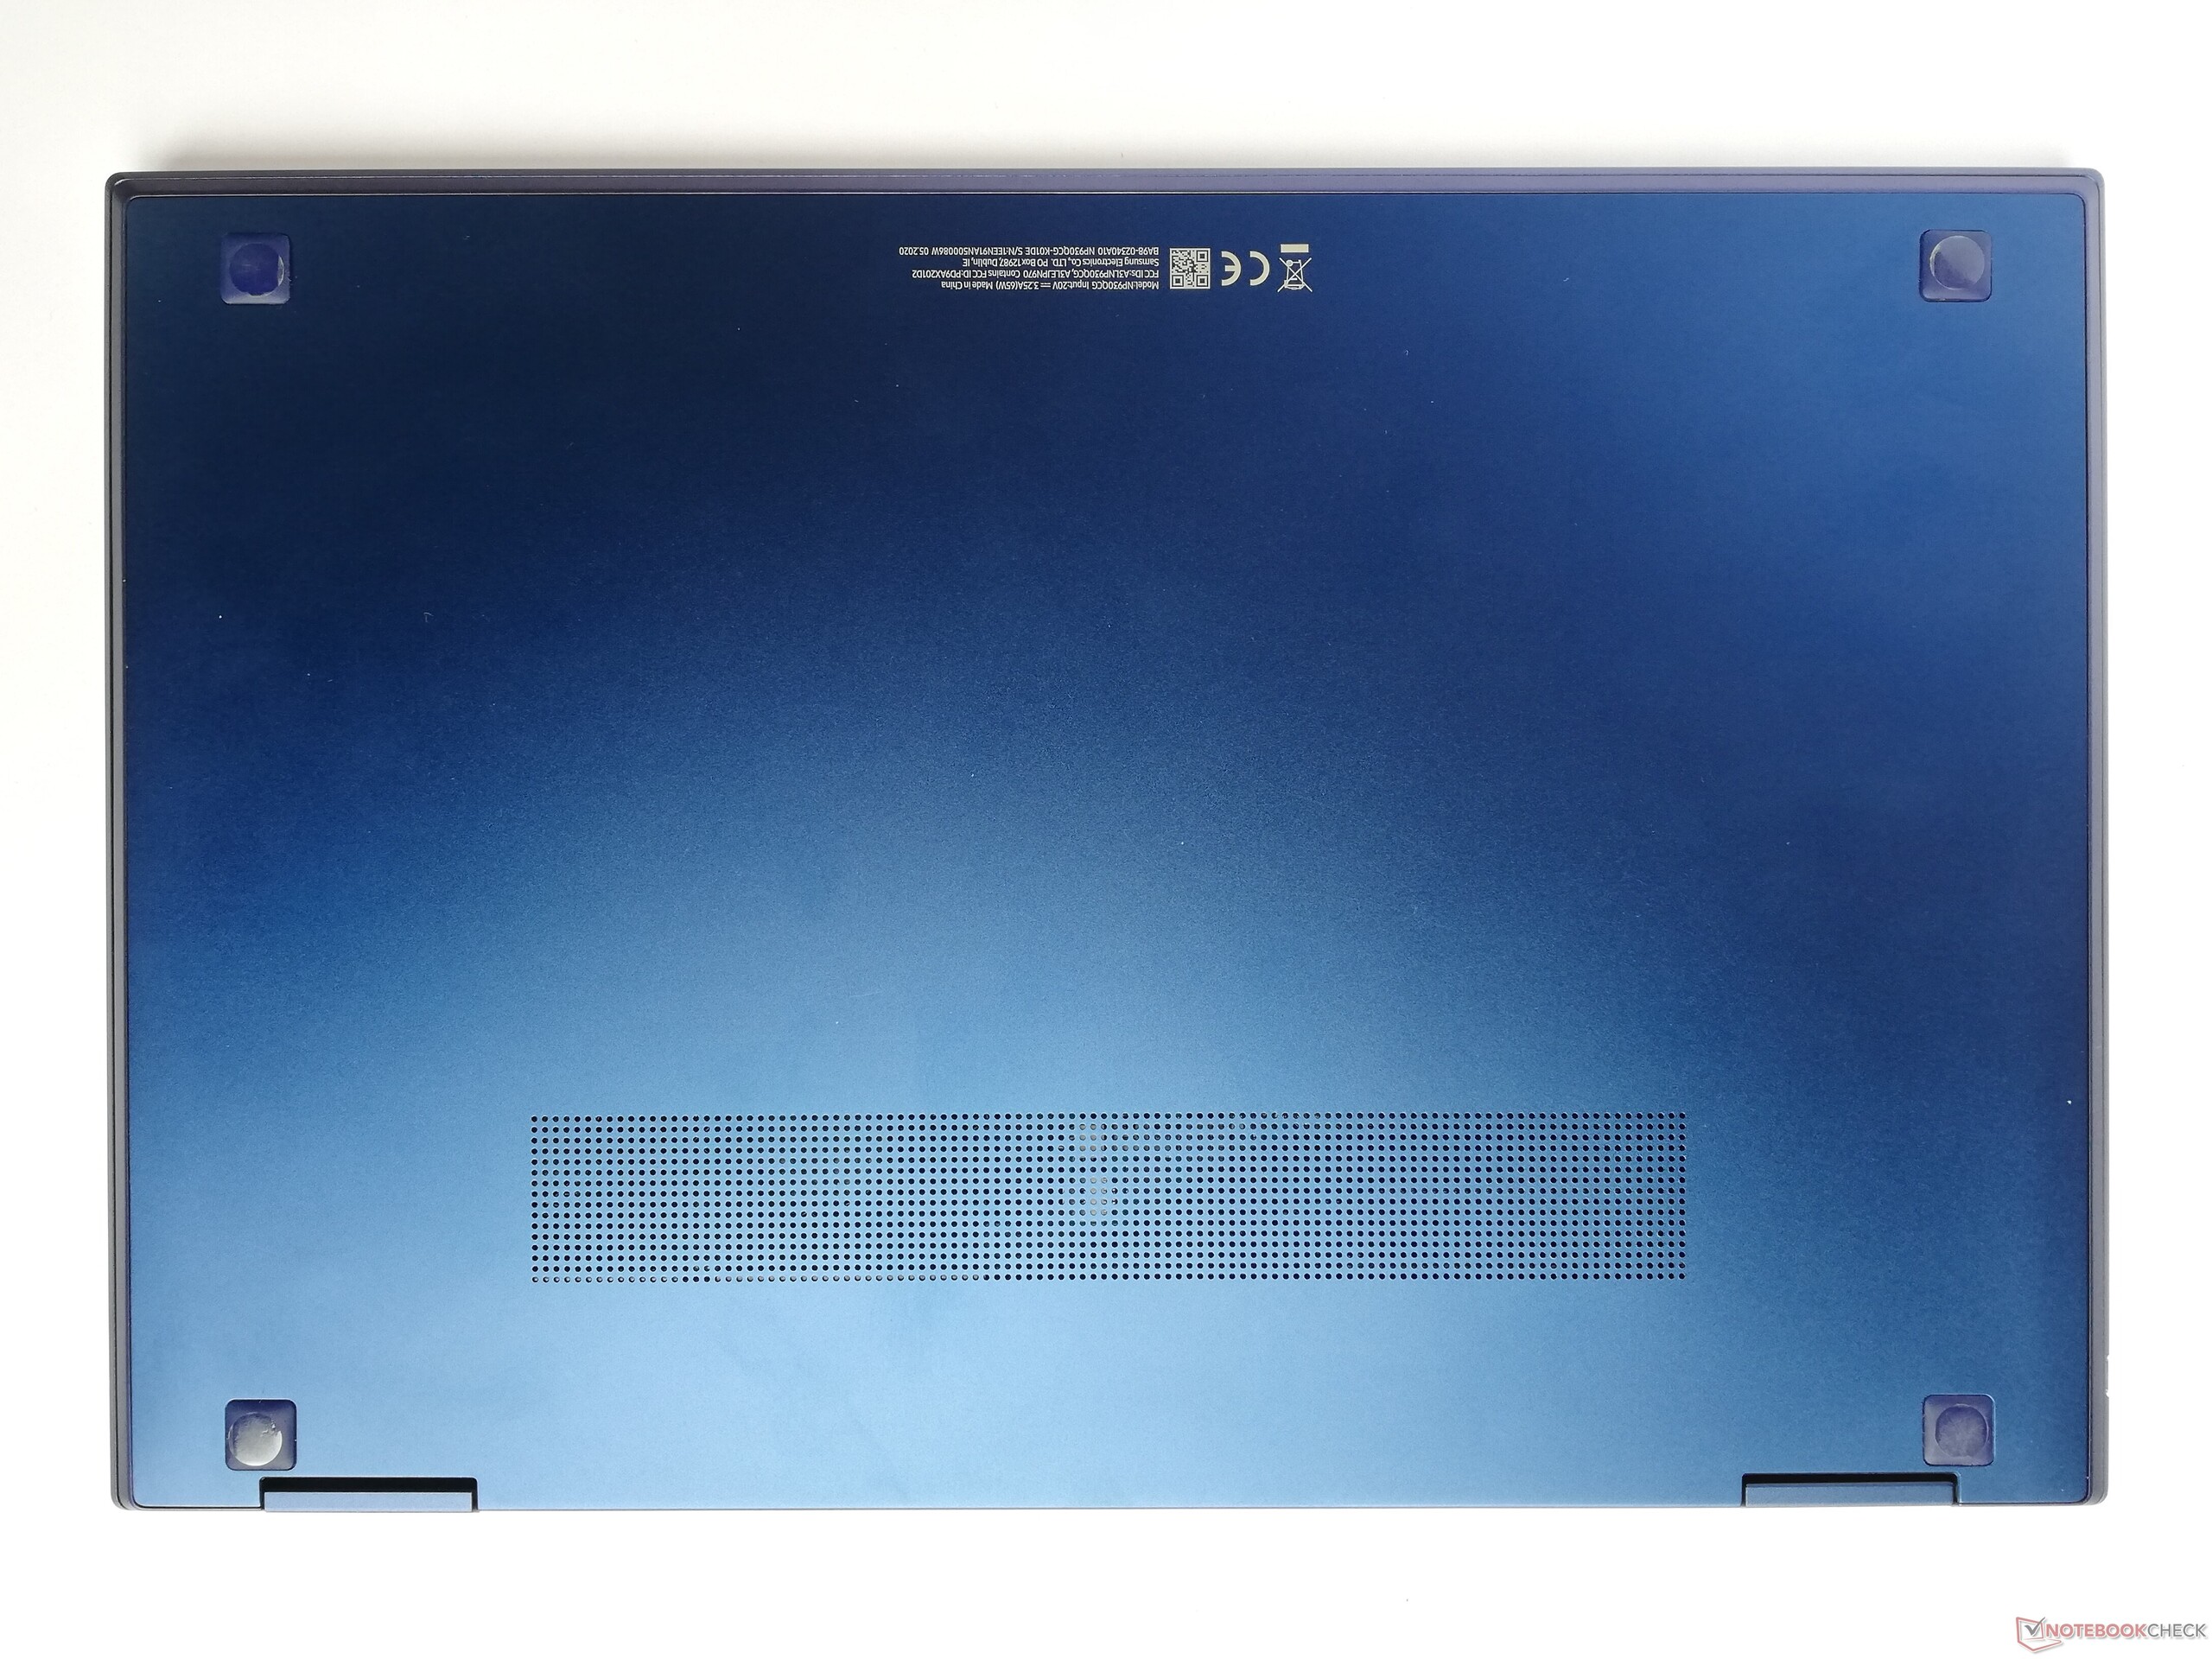
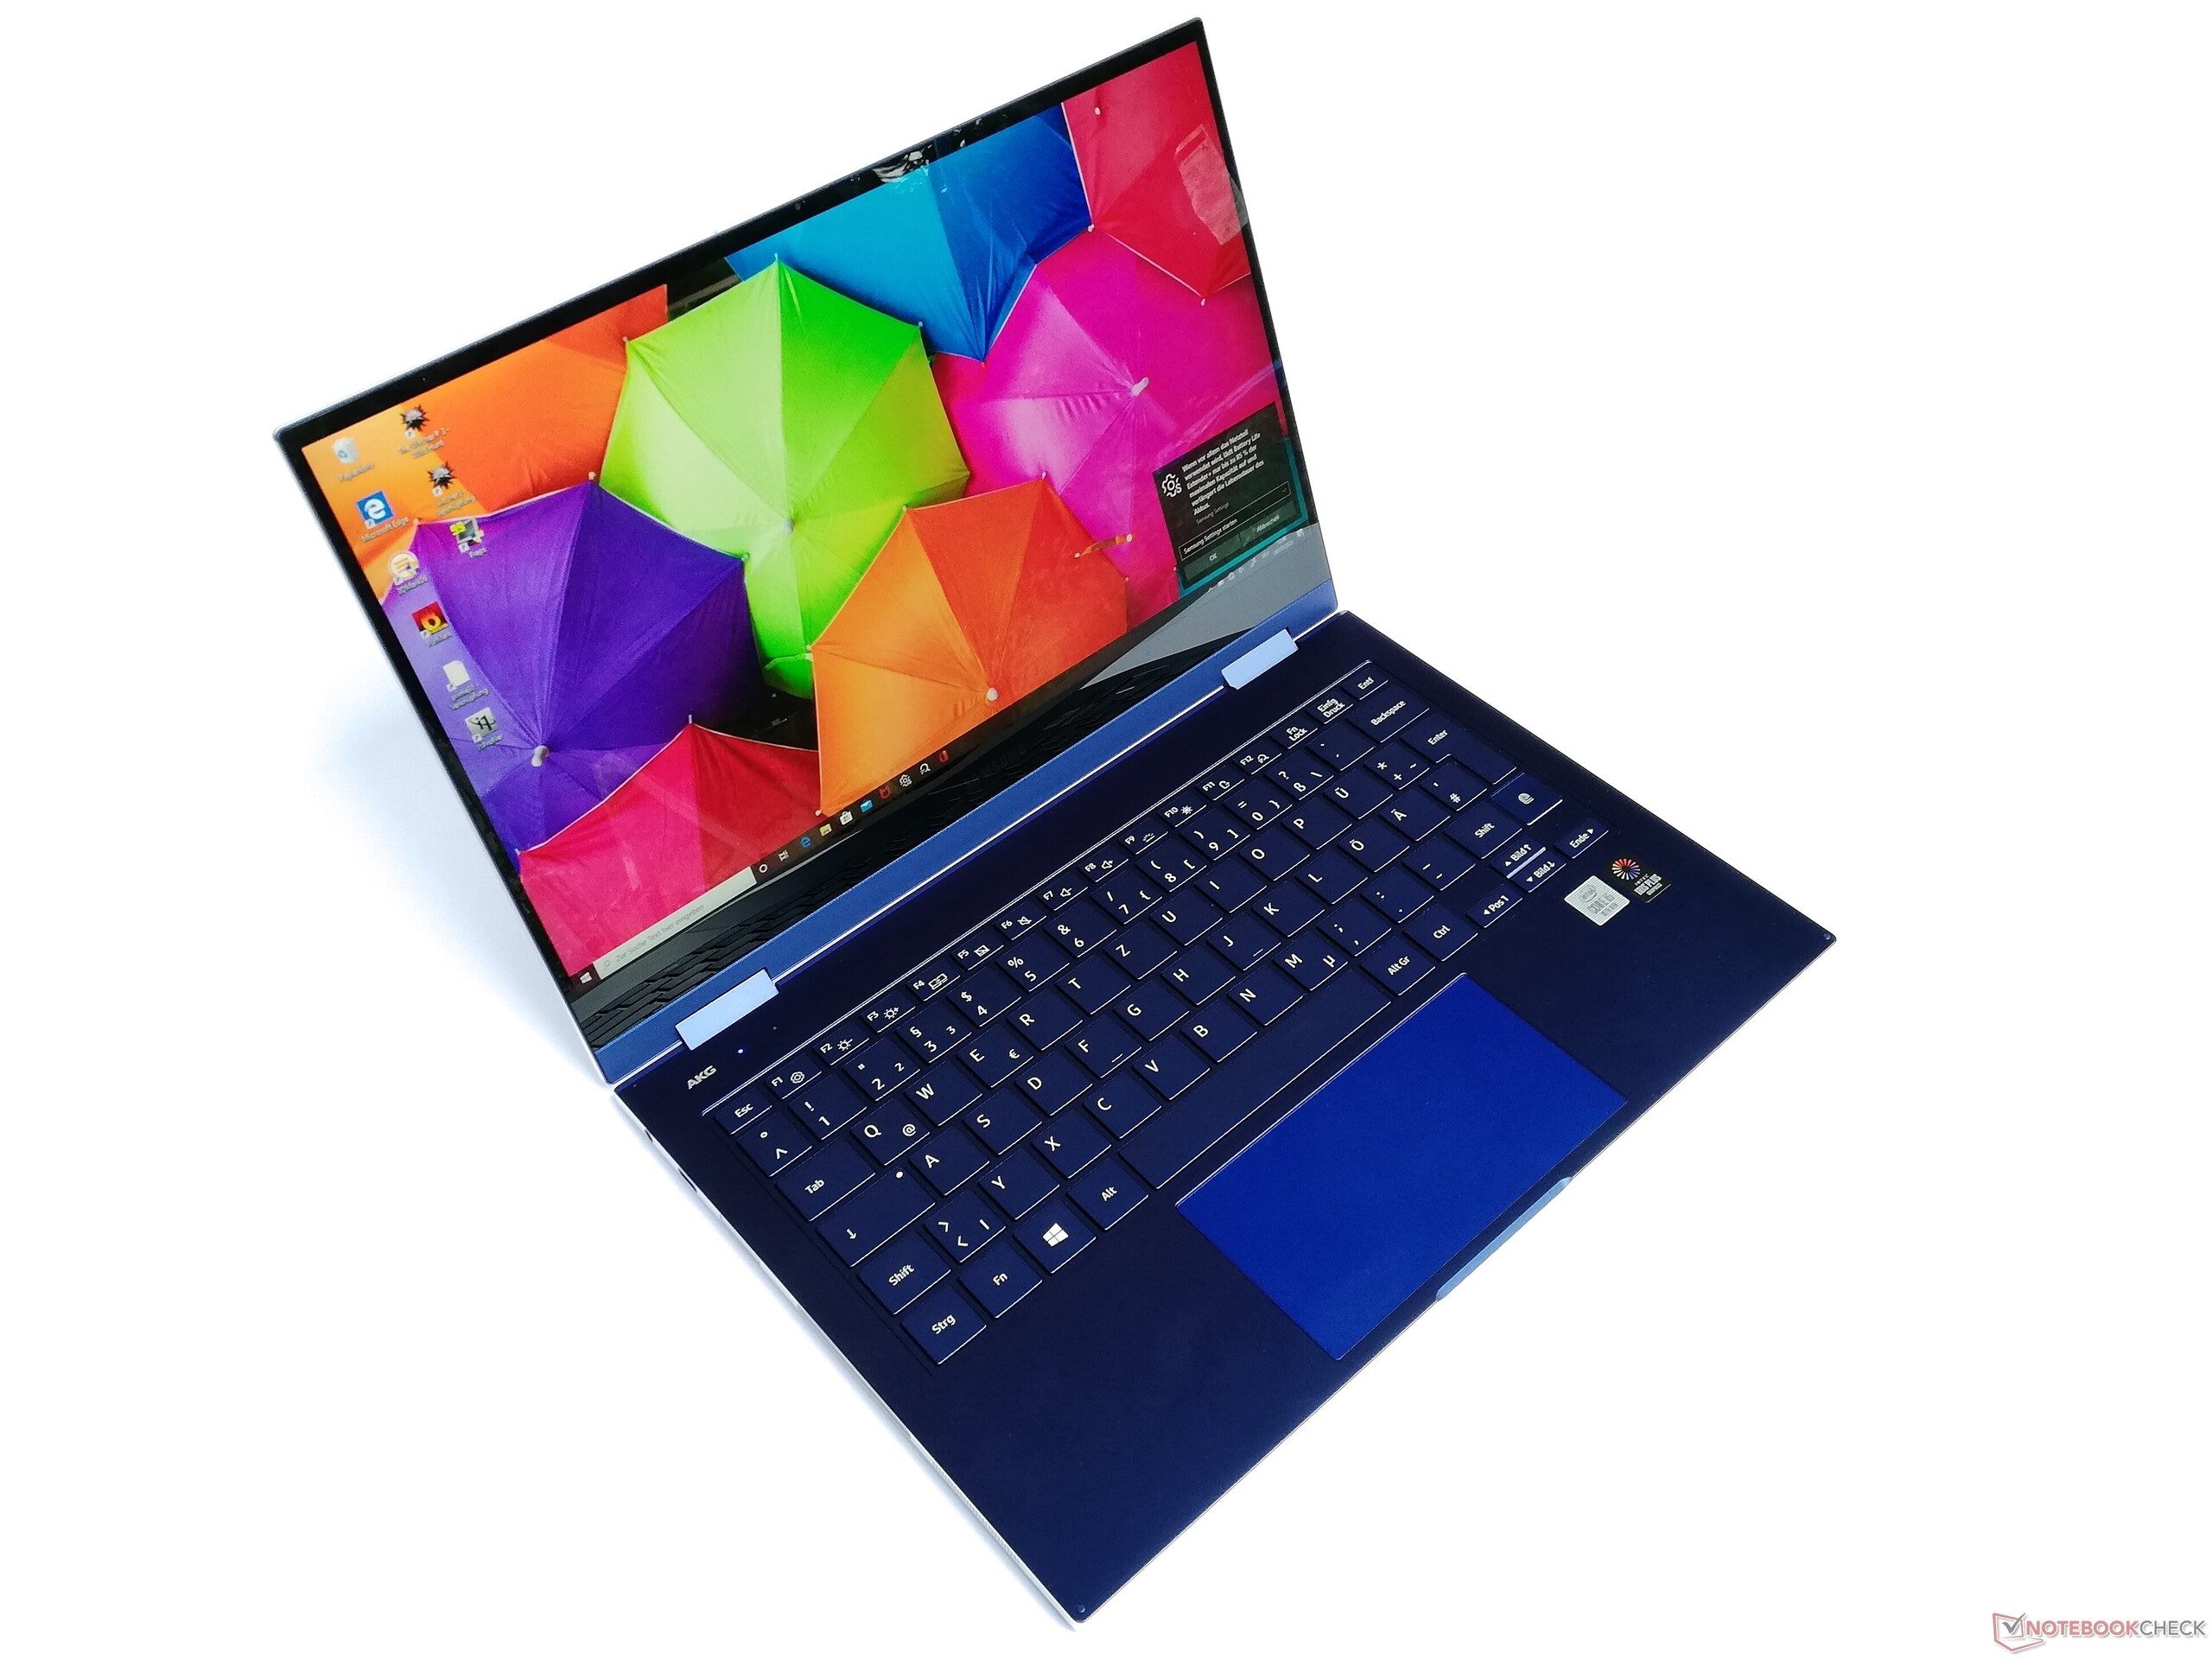
No final, existem apenas aspectos menores a serem criticados. Um exemplo é o fato de os cartões microSD estarem alojados em um slot fixo que só pode ser removido com uma ferramenta especial. Isso dificulta desnecessariamente a troca de cartões de memória. Além disso, o fato de a tela e a base não ficarem completamente alinhadas uma com a outra no modo tablet estraga um pouco a boa impressão geral. Conversíveis como o Fujitsu Lifebook U939X ou o Dell Latitude 7200 são um pouco mais amigáveis.
Samsung Galaxy Book Flex 13.3
- 07/20/2020 v7 (old)
Mike Wobker
Price comparison
