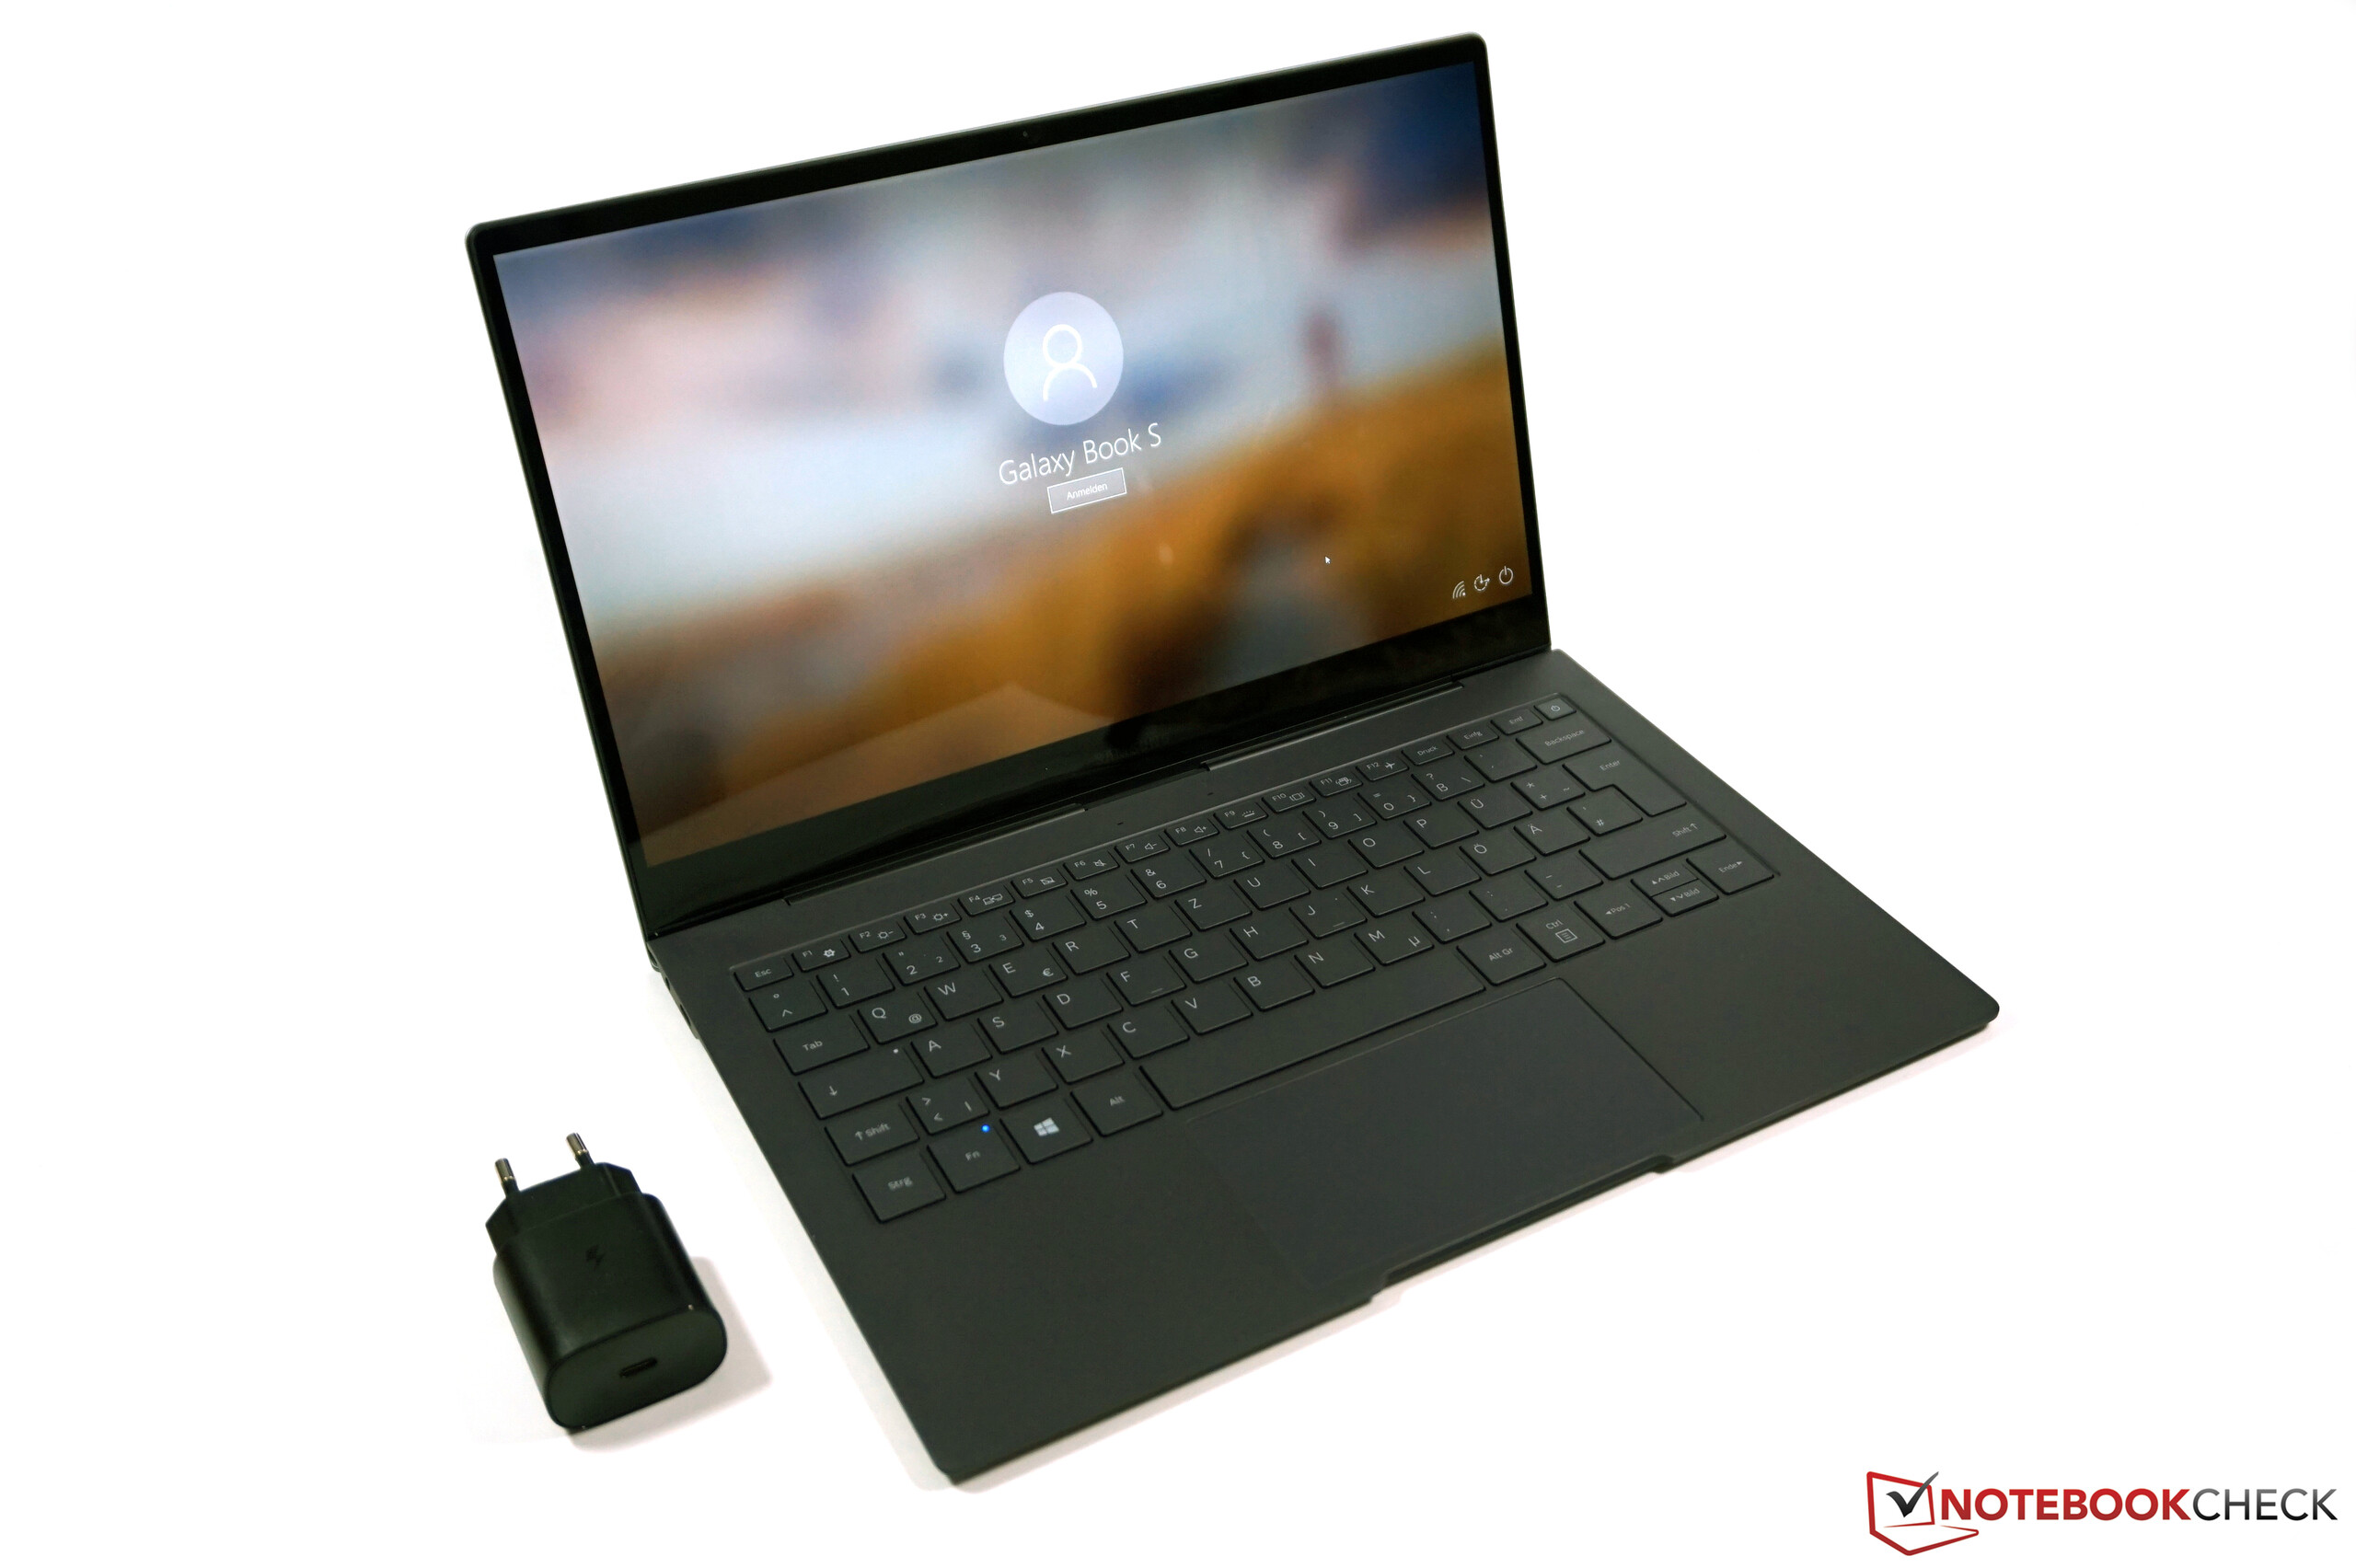
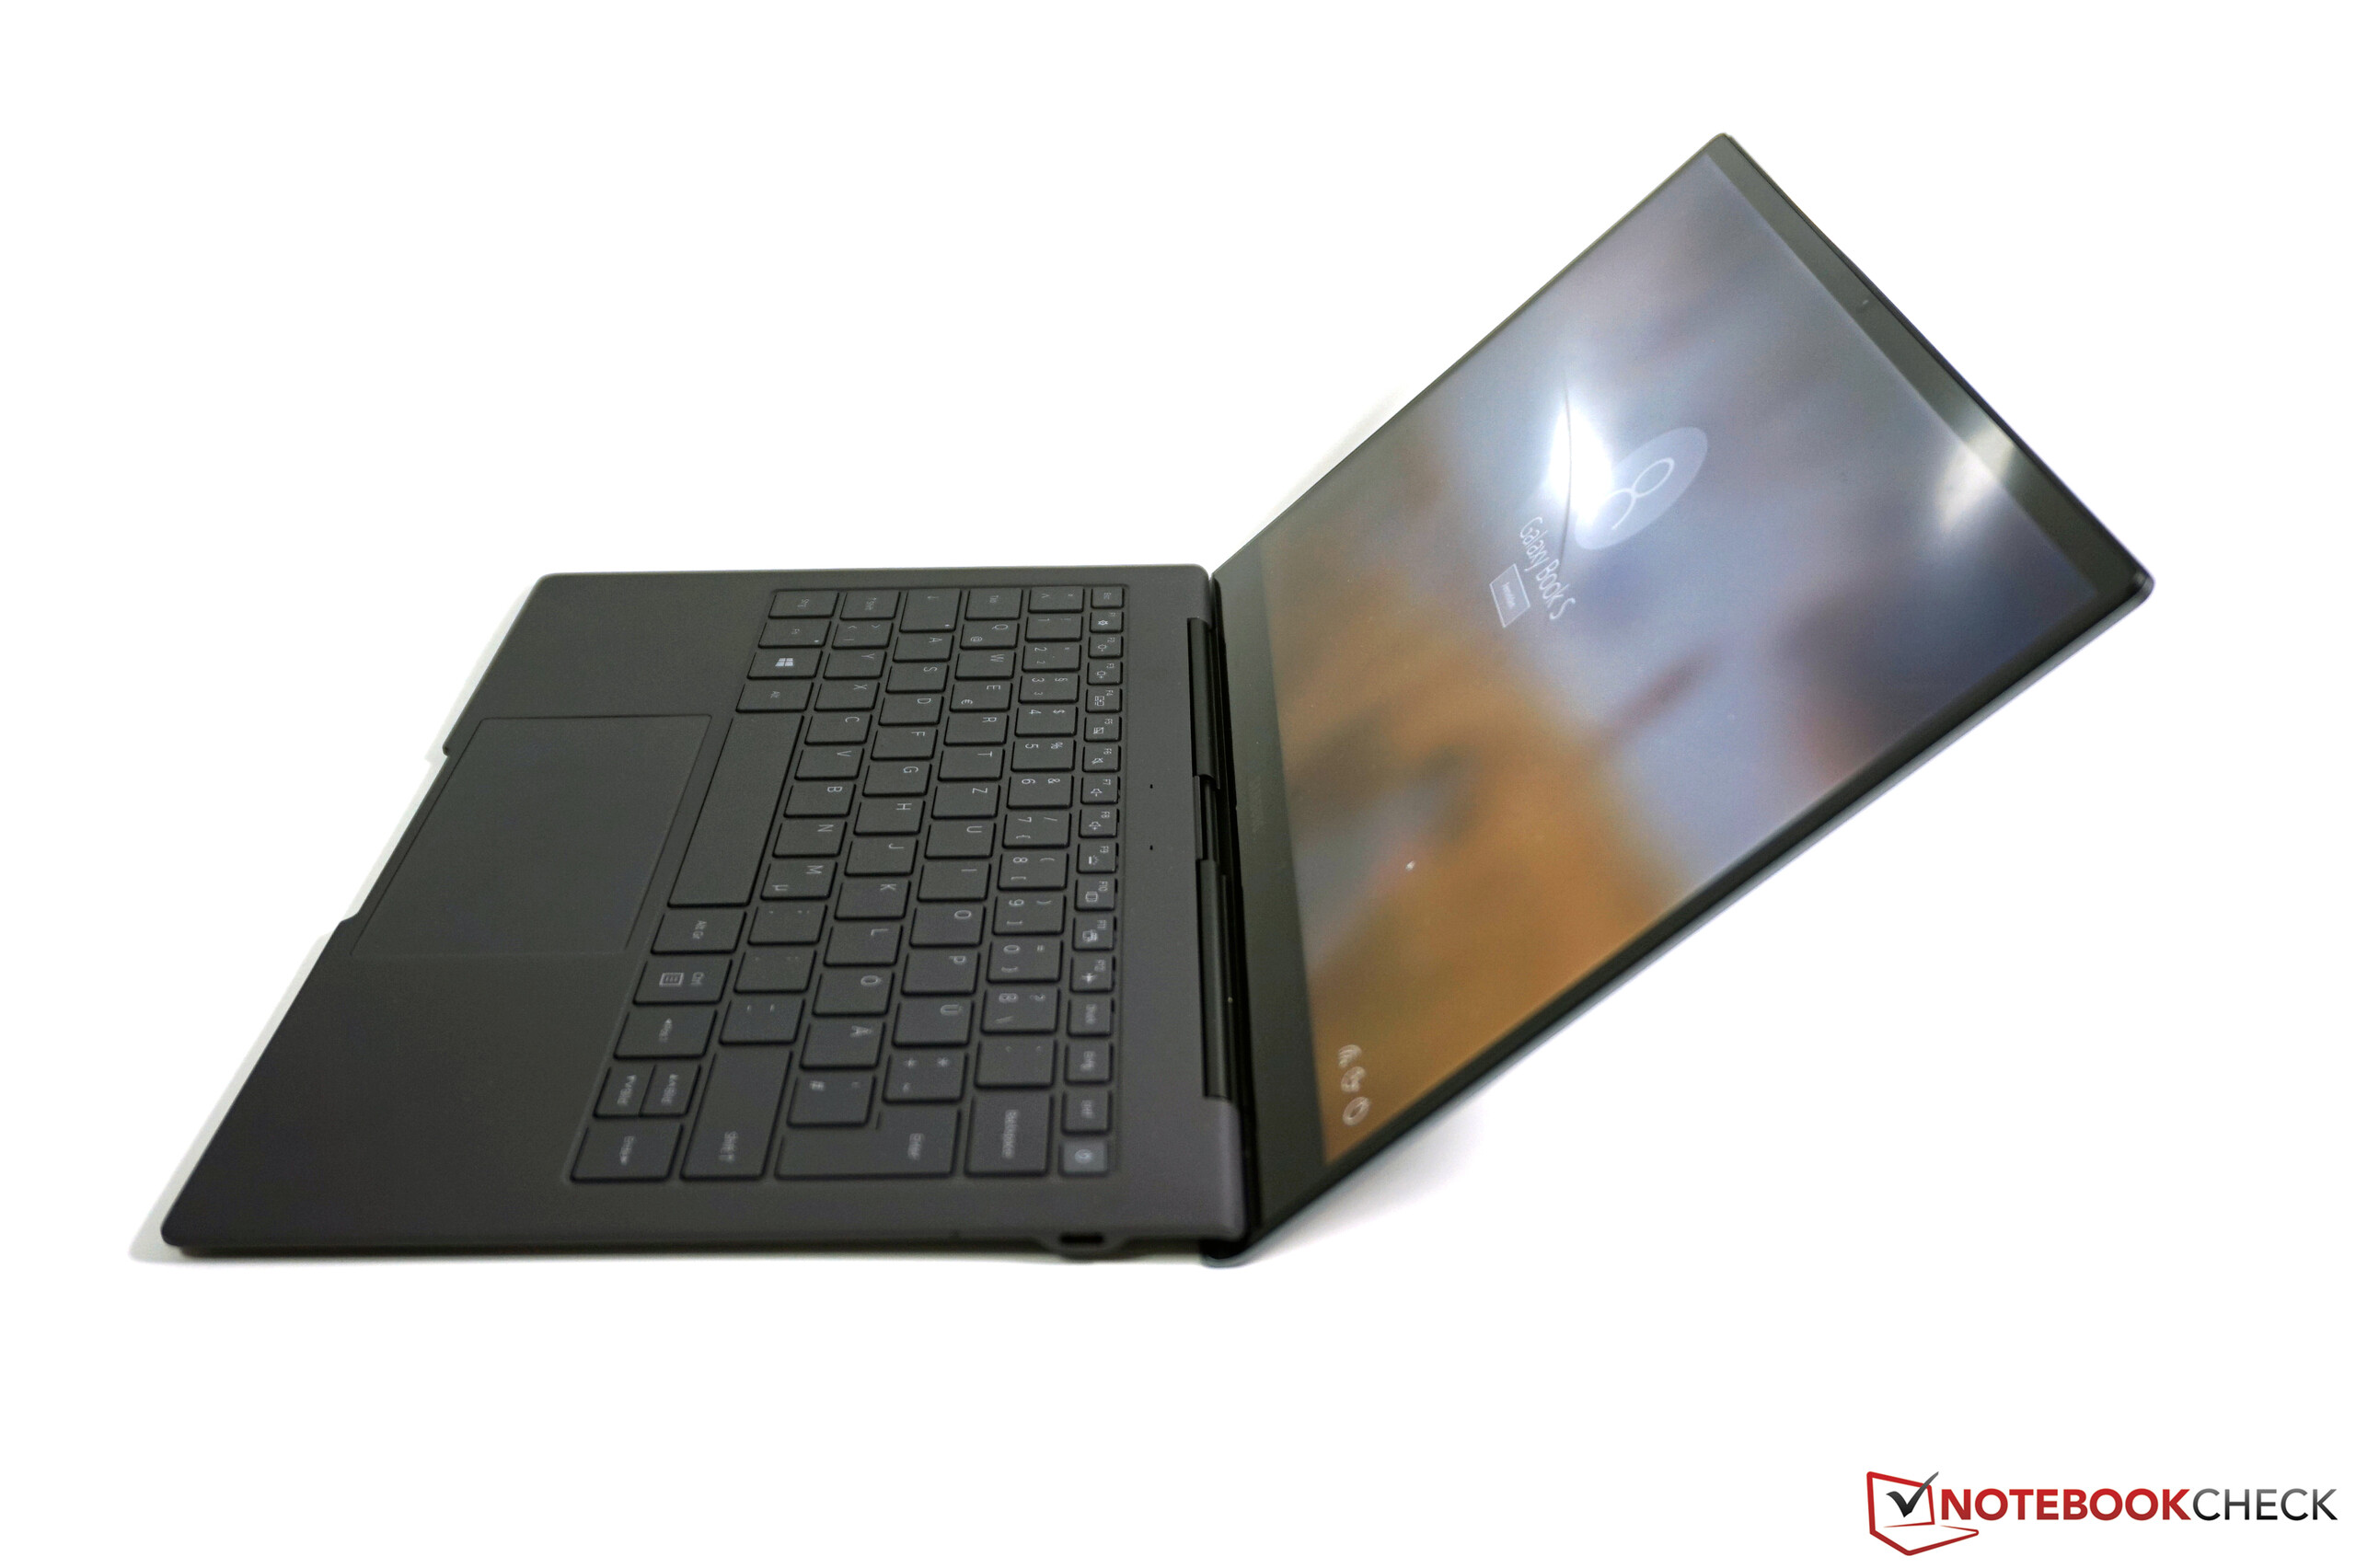
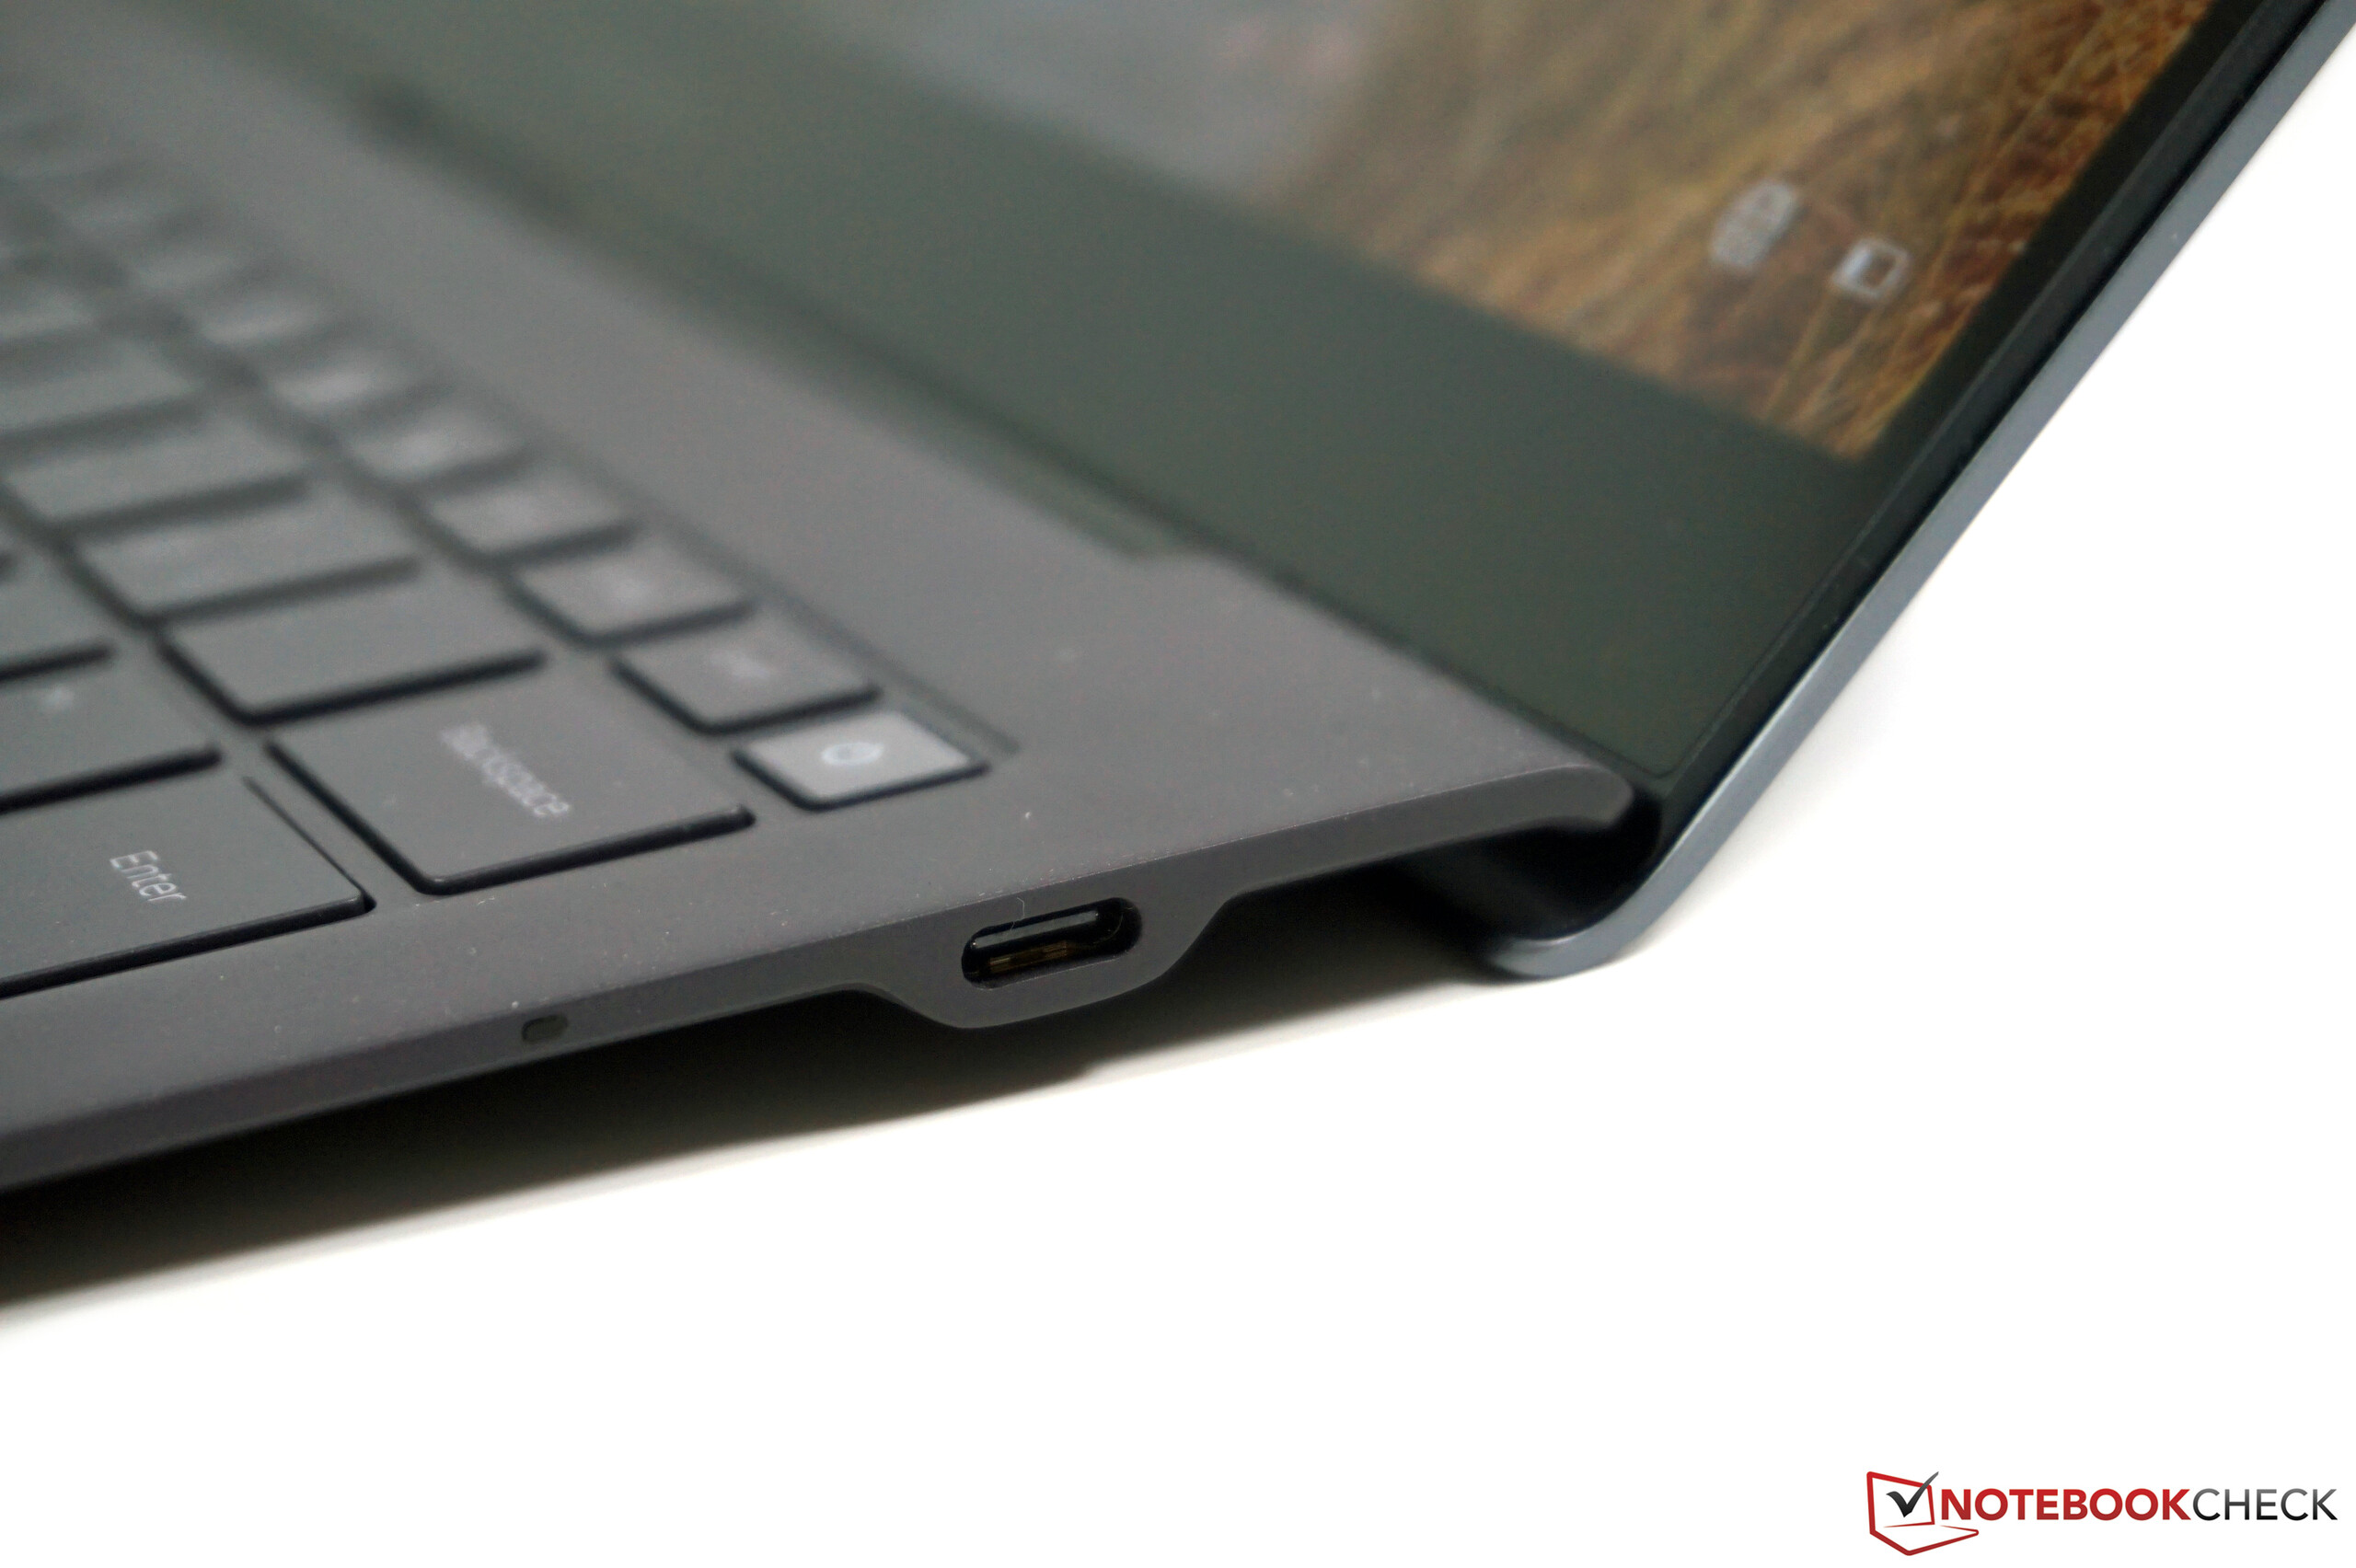
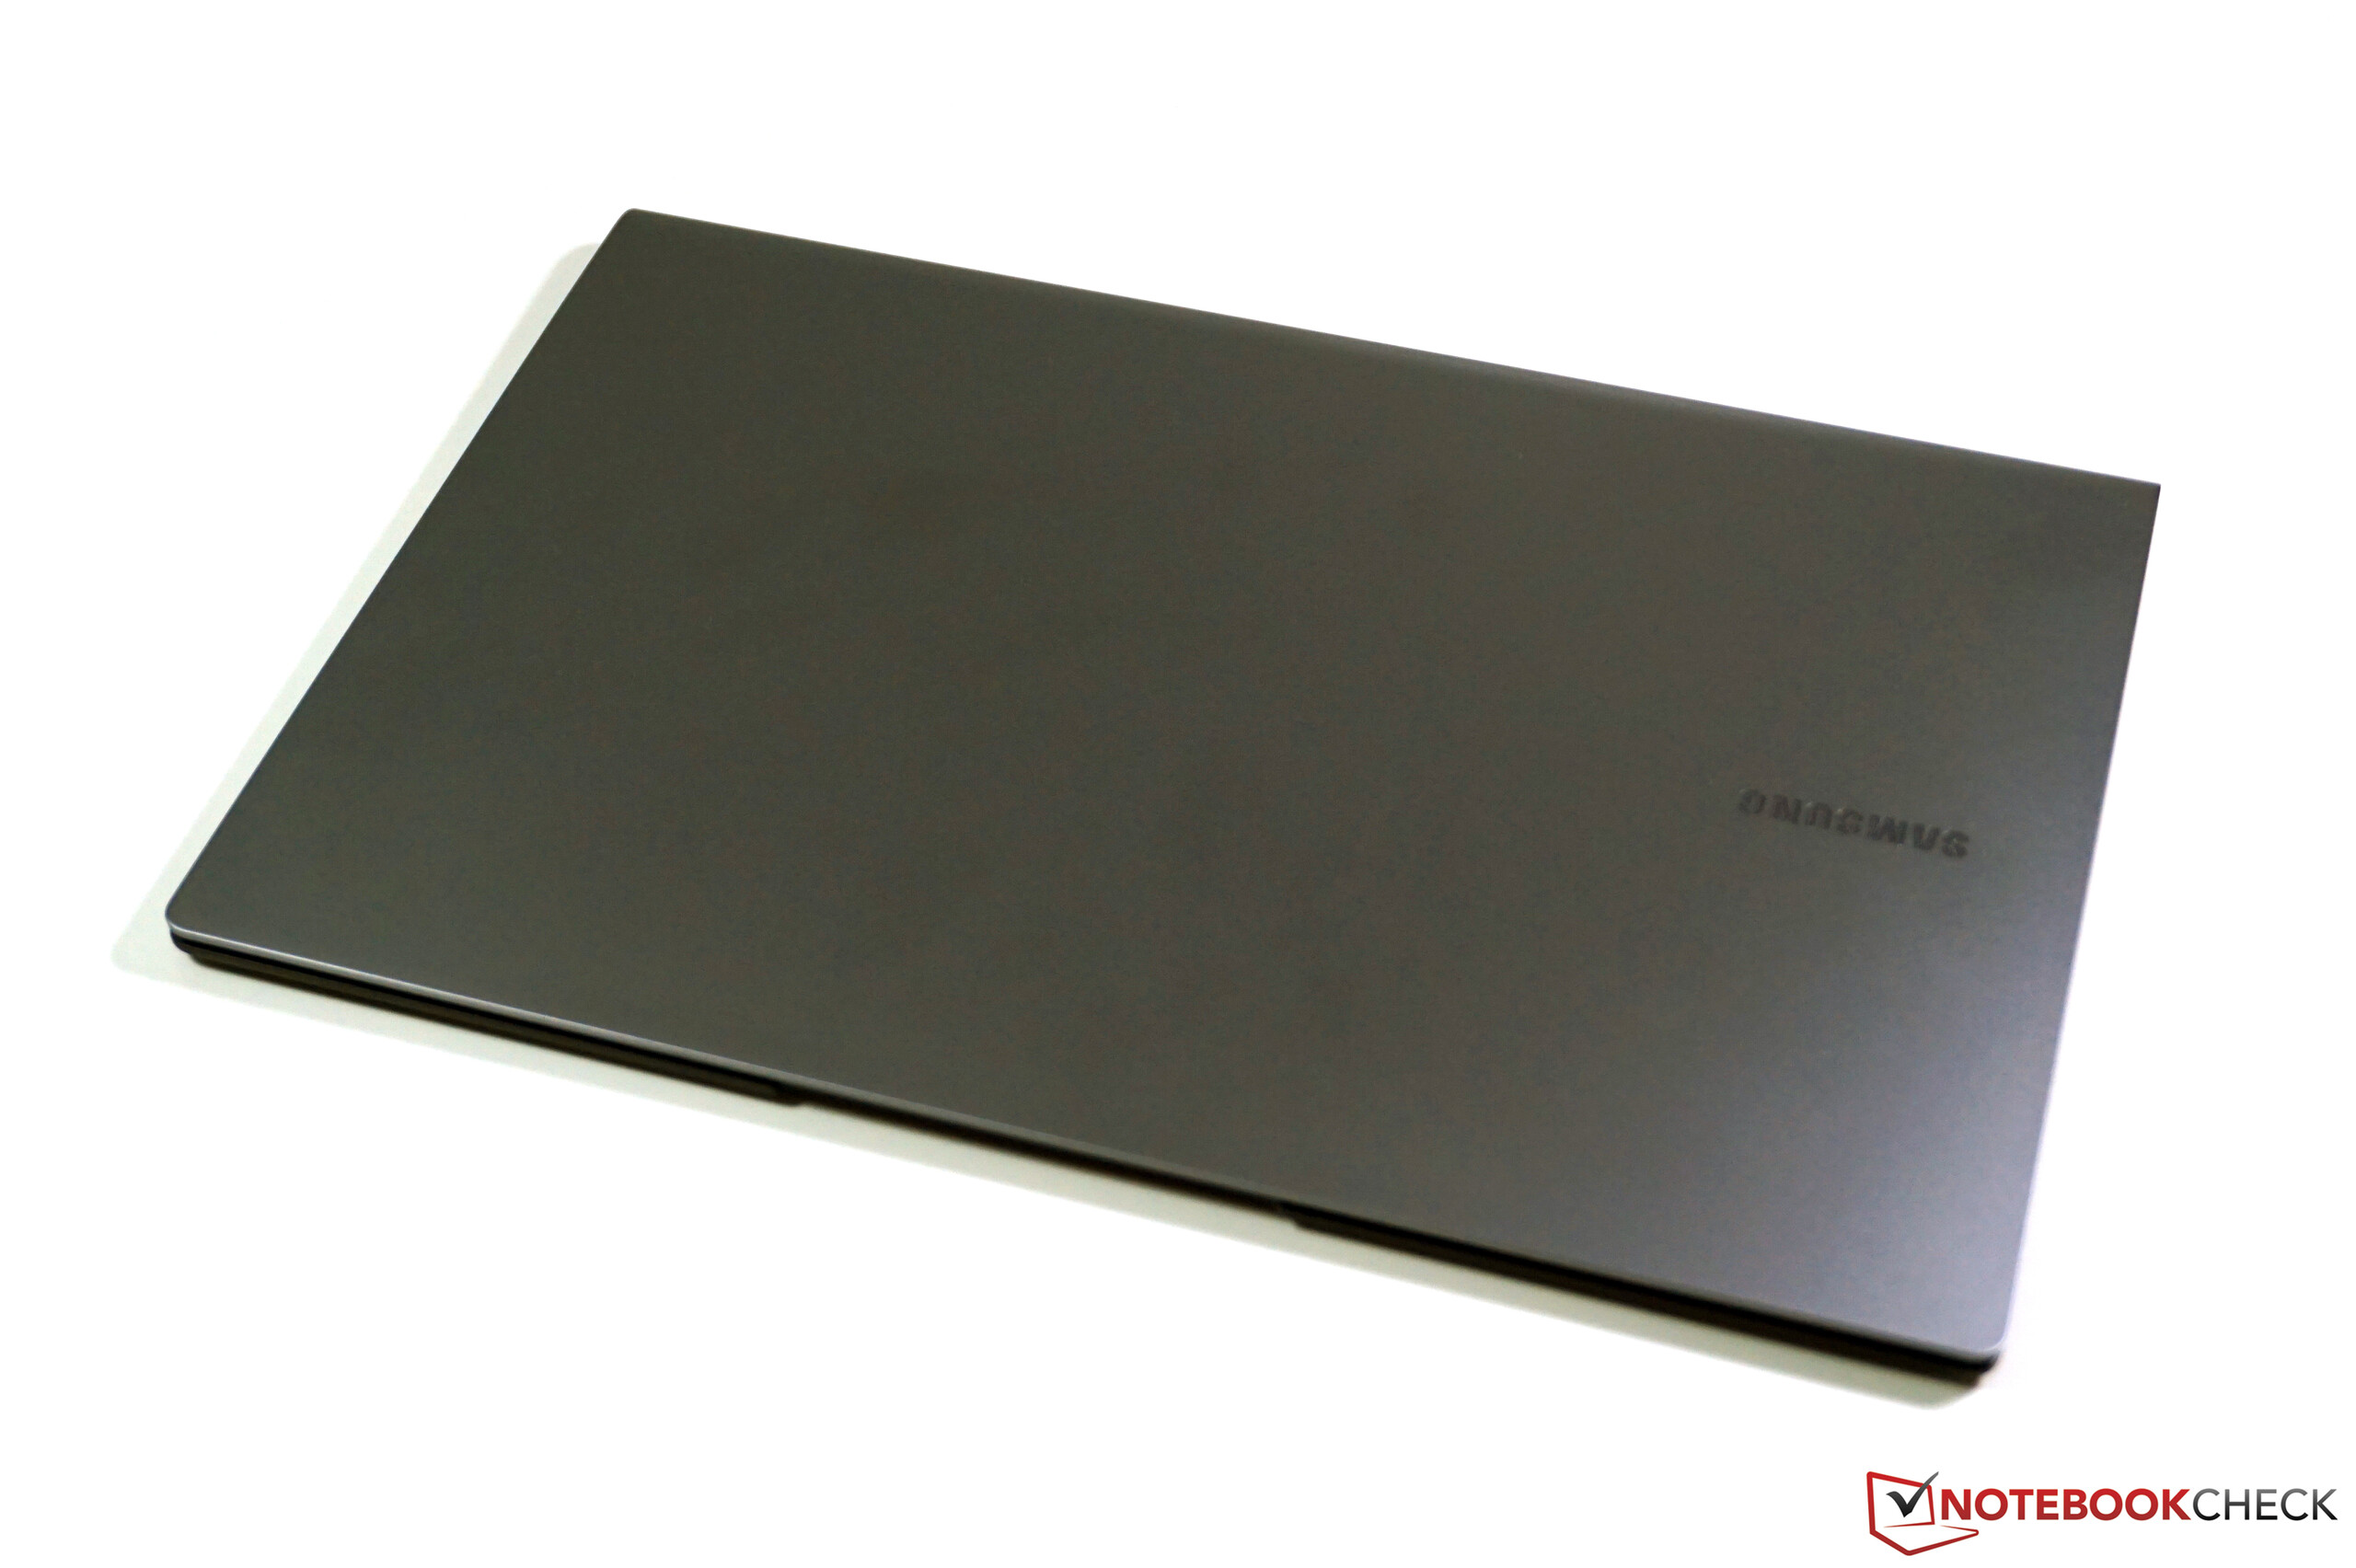
Breve Análise do Portátil Samsung Galaxy Book S: Bateria de longa duração e menos de 1 kg
Avaliação | Data | Modelo | Peso | Altura | Size | Resolução | Preço |
|---|---|---|---|---|---|---|---|
| 86.2 % v7 (old) | 06/2020 | Samsung Galaxy Book S SD 8cx, Adreno 680 | 951 g | 11.8 mm | 13.30" | 1920x1080 | |
| 89.6 % v7 (old) | 05/2020 | Apple MacBook Air 2020 i3 i3-1000NG4, Iris Plus Graphics G4 (Ice Lake 48 EU) | 1.3 kg | 16.1 mm | 13.30" | 2560x1600 | |
| 88.8 % v7 (old) | 03/2020 | Dell XPS 13 9300 i5 FHD i5-1035G1, UHD Graphics G1 (Ice Lake 32 EU) | 1.2 kg | 14.8 mm | 13.40" | 1920x1200 | |
| 85.9 % v7 (old) | 09/2020 | Acer Swift 3 SF313-52-52AS i5-1035G4, Iris Plus Graphics G4 (Ice Lake 48 EU) | 1.2 kg | 16.6 mm | 13.50" | 2256x1504 | |
| 84 % v7 (old) | 03/2020 | Microsoft Surface Laptop 3 13 Core i5-1035G7 i5-1035G7, Iris Plus Graphics G7 (Ice Lake 64 EU) | 1.3 kg | 14.5 mm | 13.50" | 2256x1504 |
| SD Card Reader | |
| average JPG Copy Test (av. of 3 runs) | |
| Dell XPS 13 9300 i5 FHD (Toshiba Exceria Pro M501 64 GB UHS-II) | |
| Média da turma Subnotebook (23.7 - 188, n=9, últimos 2 anos) | |
| Samsung Galaxy Book S (Toshiba Exceria Pro M501 64 GB UHS-II) | |
| maximum AS SSD Seq Read Test (1GB) | |
| Dell XPS 13 9300 i5 FHD (Toshiba Exceria Pro M501 64 GB UHS-II) | |
| Média da turma Subnotebook (24.9 - 195, n=8, últimos 2 anos) | |
| Samsung Galaxy Book S (Toshiba Exceria Pro M501 64 GB UHS-II) | |


| |||||||||||||||||||||||||
iluminação: 88 %
iluminação com acumulador: 380 cd/m²
Contraste: 1064:1 (Preto: 0.36 cd/m²)
ΔE ColorChecker Calman: 3.1 | ∀{0.5-29.43 Ø4.72}
ΔE Greyscale Calman: 3.6 | ∀{0.09-98 Ø4.97}
96.9% sRGB (Calman 2D)
Gamma: 2
CCT: 6743 K
| Samsung Galaxy Book S BOE, IPS, 1920x1080, 13.3" | Apple MacBook Air 2020 i3 APPA042, IPS, 2560x1600, 13.3" | Dell XPS 13 9300 i5 FHD SHP14CB, IPS, 1920x1200, 13.4" | Acer Swift 3 SF313-52-52AS BOE08BC, IPS, 2256x1504, 13.5" | Microsoft Surface Laptop 3 13 Core i5-1035G7 Sharp LQ135P1JX51, IPS, 2256x1504, 13.5" | |
|---|---|---|---|---|---|
| Display | |||||
| Display P3 Coverage (%) | 70.3 | 71.5 | 70.3 | 65.7 | |
| sRGB Coverage (%) | 98 | 99.4 | 99.8 | 98.6 | |
| AdobeRGB 1998 Coverage (%) | 71.6 | 73.5 | 71.3 | 67.8 | |
| Response Times | 11% | -20% | -6% | -34% | |
| Response Time Grey 50% / Grey 80% * (ms) | 48.8 ? | 38.4 ? 21% | 60 ? -23% | 50 ? -2% | 59.2 ? -21% |
| Response Time Black / White * (ms) | 28.4 ? | 28.4 ? -0% | 33.2 ? -17% | 31 ? -9% | 41.6 ? -46% |
| PWM Frequency (Hz) | 9524 ? | 119000 ? | 2500 ? | 192 ? | 21740 ? |
| Screen | 34% | 13% | -5% | 28% | |
| Brightness middle (cd/m²) | 383 | 416 9% | 619 62% | 456 19% | 403.4 5% |
| Brightness (cd/m²) | 355 | 403 14% | 591 66% | 432 22% | 397 12% |
| Brightness Distribution (%) | 88 | 95 8% | 91 3% | 88 0% | 89 1% |
| Black Level * (cd/m²) | 0.36 | 0.34 6% | 0.35 3% | 0.32 11% | 0.34 6% |
| Contrast (:1) | 1064 | 1224 15% | 1769 66% | 1425 34% | 1186 11% |
| Colorchecker dE 2000 * | 3.1 | 0.9 71% | 3 3% | 3.49 -13% | 0.94 70% |
| Colorchecker dE 2000 max. * | 5.3 | 1.4 74% | 8.2 -55% | 8.4 -58% | 2.92 45% |
| Greyscale dE 2000 * | 3.6 | 1 72% | 5.2 -44% | 5.53 -54% | 0.9 75% |
| Gamma | 2 110% | 2.2 100% | 2.14 103% | 2.41 91% | 2.13 103% |
| CCT | 6743 96% | 6629 98% | 6340 103% | 6675 97% | 6620 98% |
| Colorchecker dE 2000 calibrated * | 0.6 | 1 | 0.72 | 0.99 | |
| Color Space (Percent of AdobeRGB 1998) (%) | 63.9 | 66.9 | 65 | 62.3 | |
| Color Space (Percent of sRGB) (%) | 97.6 | 99.3 | 100 | 98.7 | |
| Média Total (Programa/Configurações) | 23% /
29% | -4% /
6% | -6% /
-5% | -3% /
16% |
* ... menor é melhor
Exibir tempos de resposta
| ↔ Tempo de resposta preto para branco | ||
|---|---|---|
| 28.4 ms ... ascensão ↗ e queda ↘ combinadas | ↗ 16.4 ms ascensão | 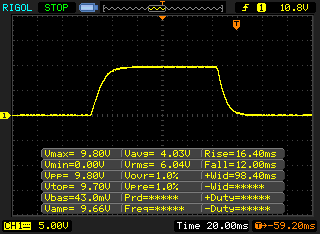 |
| ↘ 12 ms queda | ||
| A tela mostra taxas de resposta relativamente lentas em nossos testes e pode ser muito lenta para os jogadores. Em comparação, todos os dispositivos testados variam de 0.1 (mínimo) a 240 (máximo) ms. » 75 % de todos os dispositivos são melhores. Isso significa que o tempo de resposta medido é pior que a média de todos os dispositivos testados (19.8 ms). | ||
| ↔ Tempo de resposta 50% cinza a 80% cinza | ||
| 48.8 ms ... ascensão ↗ e queda ↘ combinadas | ↗ 22 ms ascensão | 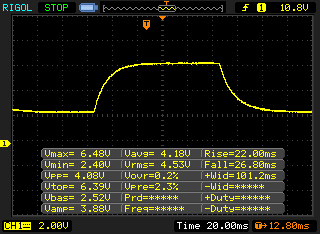 |
| ↘ 26.8 ms queda | ||
| A tela mostra taxas de resposta lentas em nossos testes e será insatisfatória para os jogadores. Em comparação, todos os dispositivos testados variam de 0.165 (mínimo) a 636 (máximo) ms. » 84 % de todos os dispositivos são melhores. Isso significa que o tempo de resposta medido é pior que a média de todos os dispositivos testados (31 ms). | ||
Cintilação da tela / PWM (modulação por largura de pulso)
| Tela tremeluzindo/PWM detectado | 9524 Hz | ≤ 20 % configuração de brilho | 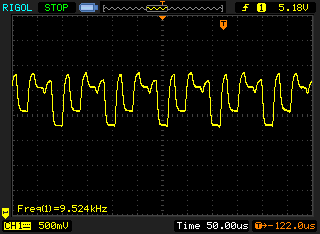 |
A luz de fundo da tela pisca em 9524 Hz (pior caso, por exemplo, utilizando PWM) Cintilação detectada em uma configuração de brilho de 20 % e abaixo. Não deve haver cintilação ou PWM acima desta configuração de brilho. A frequência de 9524 Hz é bastante alta, então a maioria dos usuários sensíveis ao PWM não deve notar nenhuma oscilação. [pwm_comparison] Em comparação: 52 % de todos os dispositivos testados não usam PWM para escurecer a tela. Se PWM foi detectado, uma média de 7775 (mínimo: 5 - máximo: 343500) Hz foi medida. | |||
Geekbench 4.4: 64 Bit Single-Core Score | 64 Bit Multi-Core Score
3DMark 11: 1280x720 Performance GPU
Jetstream 2: 2.0 Total
JetStream 1.1: 1.1 Total
WebXPRT 3: Overall
Mozilla Kraken 1.1: Total
Octane V2: Total Score
Speedometer 2.0: Result 2.0
| Geekbench 5.5 / Single-Core | |
| Média da turma Subnotebook (726 - 2224, n=48, últimos 2 anos) | |
| Dell XPS 13 9300 i5 FHD | |
| Apple MacBook Air 2020 i3 | |
| Acer Swift 3 SF313-52-52AS | |
| Acer Swift 3 SF313-52-52AS | |
| Samsung Galaxy Book S | |
| Média Qualcomm Snapdragon 8cx (n=1) | |
| Geekbench 5.5 / Multi-Core | |
| Média da turma Subnotebook (2557 - 17218, n=48, últimos 2 anos) | |
| Dell XPS 13 9300 i5 FHD | |
| Acer Swift 3 SF313-52-52AS | |
| Acer Swift 3 SF313-52-52AS | |
| Samsung Galaxy Book S | |
| Média Qualcomm Snapdragon 8cx (n=1) | |
| Apple MacBook Air 2020 i3 | |
| Geekbench 4.4 / 64 Bit Single-Core Score | |
| Média da turma Subnotebook (5976 - 8929, n=7, últimos 2 anos) | |
| Microsoft Surface Laptop 3 13 Core i5-1035G7 | |
| Dell XPS 13 9300 i5 FHD | |
| Apple MacBook Air 2020 i3 | |
| Samsung Galaxy Book S | |
| Média Qualcomm Snapdragon 8cx (n=1) | |
| Geekbench 4.4 / 64 Bit Multi-Core Score | |
| Média da turma Subnotebook (27854 - 45023, n=7, últimos 2 anos) | |
| Microsoft Surface Laptop 3 13 Core i5-1035G7 | |
| Dell XPS 13 9300 i5 FHD | |
| Samsung Galaxy Book S | |
| Média Qualcomm Snapdragon 8cx (n=1) | |
| Apple MacBook Air 2020 i3 | |
| 3DMark 11 / Performance GPU | |
| Média da turma Subnotebook (995 - 18489, n=54, últimos 2 anos) | |
| Microsoft Surface Laptop 3 13 Core i5-1035G7 | |
| Acer Swift 3 SF313-52-52AS | |
| Dell XPS 13 9300 i5 FHD | |
| Apple MacBook Air 2020 i3 | |
| Samsung Galaxy Book S | |
| Média Qualcomm Snapdragon 8cx (n=1) | |
| Jetstream 2 / 2.0 Total | |
| Média da turma Subnotebook (117 - 476, n=28, últimos 2 anos) | |
| Apple MacBook Air 2020 i3 | |
| Samsung Galaxy Book S | |
| Média Qualcomm Snapdragon 8cx (n=1) | |
| JetStream 1.1 / 1.1 Total | |
| Média da turma Subnotebook (215 - 476, n=2, últimos 2 anos) | |
| Microsoft Surface Laptop 3 13 Core i5-1035G7 | |
| Dell XPS 13 9300 i5 FHD | |
| Apple MacBook Air 2020 i3 | |
| Acer Swift 3 SF313-52-52AS | |
| Samsung Galaxy Book S | |
| Média Qualcomm Snapdragon 8cx (n=1) | |
| WebXPRT 3 / Overall | |
| Média da turma Subnotebook (156 - 530, n=55, últimos 2 anos) | |
| Dell XPS 13 9300 i5 FHD | |
| Acer Swift 3 SF313-52-52AS | |
| Acer Swift 3 SF313-52-52AS | |
| Apple MacBook Air 2020 i3 | |
| Samsung Galaxy Book S | |
| Média Qualcomm Snapdragon 8cx (n=1) | |
| Mozilla Kraken 1.1 / Total | |
| Samsung Galaxy Book S | |
| Média Qualcomm Snapdragon 8cx (n=1) | |
| Microsoft Surface Laptop 3 13 Core i5-1035G7 | |
| Apple MacBook Air 2020 i3 | |
| Acer Swift 3 SF313-52-52AS | |
| Acer Swift 3 SF313-52-52AS | |
| Dell XPS 13 9300 i5 FHD | |
| Média da turma Subnotebook (234 - 1104, n=60, últimos 2 anos) | |
| Octane V2 / Total Score | |
| Média da turma Subnotebook (35801 - 142020, n=28, últimos 2 anos) | |
| Apple MacBook Air 2020 i3 | |
| Microsoft Surface Laptop 3 13 Core i5-1035G7 | |
| Dell XPS 13 9300 i5 FHD | |
| Samsung Galaxy Book S | |
| Média Qualcomm Snapdragon 8cx (n=1) | |
| Speedometer 2.0 / Result 2.0 | |
| Média da turma Subnotebook (110 - 793, n=26, últimos 2 anos) | |
| Apple MacBook Air 2020 i3 | |
| Samsung Galaxy Book S | |
| Média Qualcomm Snapdragon 8cx (n=1) | |
| Dell XPS 13 9300 i5 FHD | |
* ... menor é melhor
| Samsung Galaxy Book S 256 GB NVMe | Apple MacBook Air 2020 i3 Apple SSD AP0256 | Dell XPS 13 9300 i5 FHD Toshiba XG6 KXG60ZNV512G | Acer Swift 3 SF313-52-52AS SK Hynix BC501 HFM512GDJTNG | Microsoft Surface Laptop 3 13 Core i5-1035G7 SK hynix BC501 HFM256GDGTNG | Média 256 GB NVMe | |
|---|---|---|---|---|---|---|
| CrystalDiskMark 5.2 / 6 | 246% | 399% | 319% | 278% | 5% | |
| Write 4K (MB/s) | 30.59 | 34.57 13% | 121.9 298% | 120.6 294% | 112.3 267% | 35.8 ? 17% |
| Read 4K (MB/s) | 20.26 | 28.48 41% | 50 147% | 46.88 131% | 42.13 108% | 16.2 ? -20% |
| Write Seq (MB/s) | 421.4 | 1026 143% | 1497 255% | 1044 148% | 630 50% | 362 ? -14% |
| Read Seq (MB/s) | 1232 | 1109 -10% | 2111 71% | 1147 -7% | 1023 -17% | 726 ? -41% |
| Write 4K Q32T1 (MB/s) | 39.17 | 178.4 355% | 365.9 834% | 332.4 749% | 336.6 759% | 63.1 ? 61% |
| Read 4K Q32T1 (MB/s) | 41.14 | 557 1254% | 384.6 835% | 443.3 978% | 399.6 871% | 62.7 ? 52% |
| Write Seq Q32T1 (MB/s) | 420.9 | 970 130% | 2748 553% | 1052 150% | 821 95% | 455 ? 8% |
| Read Seq Q32T1 (MB/s) | 1047 | 1513 45% | 3119 198% | 2171 107% | 2030 94% | 761 ? -27% |
| AS SSD | 25% | 205% | 137% | 66% | 1% | |
| Seq Read (MB/s) | 1069 | 1135 6% | 2328 118% | 1370 28% | 1387 30% | 984 ? -8% |
| Seq Write (MB/s) | 382 | 1090 185% | 1137 198% | 1019 167% | 504 32% | 393 ? 3% |
| 4K Read (MB/s) | 16.64 | 14.87 -11% | 48.07 189% | 50.8 205% | 42.35 155% | 15.6 ? -6% |
| 4K Write (MB/s) | 35.99 | 26.27 -27% | 120.6 235% | 111.2 209% | 120 233% | 38.5 ? 7% |
| 4K-64 Read (MB/s) | 415.1 | 585 41% | 899 117% | 770 85% | 497.4 20% | 376 ? -9% |
| 4K-64 Write (MB/s) | 229.5 | 154.6 -33% | 1220 432% | 713 211% | 354.9 55% | 256 ? 12% |
| Access Time Read * (ms) | 0.126 | 0.085 | 0.055 | 0.05767 ? | ||
| Access Time Write * (ms) | 0.093 | 0.058 38% | 0.033 65% | 0.034 63% | 0.093 -0% | 0.08467 ? 9% |
| Score Read (Points) | 539 | 713 32% | 1180 119% | 958 78% | 678 26% | 490 ? -9% |
| Score Write (Points) | 304 | 290 -5% | 1455 379% | 926 205% | 525 73% | 334 ? 10% |
| Score Total (Points) | 1086 | 1365 26% | 3189 194% | 2370 118% | 1520 40% | 1047 ? -4% |
| Copy ISO MB/s (MB/s) | 764 | 497 ? | ||||
| Copy Program MB/s (MB/s) | 256.1 | 307 ? | ||||
| Copy Game MB/s (MB/s) | 368.4 | 386 ? | ||||
| Média Total (Programa/Configurações) | 136% /
124% | 302% /
291% | 228% /
218% | 172% /
161% | 3% /
2% |
* ... menor é melhor

(±) A temperatura máxima no lado superior é 43.9 °C / 111 F, em comparação com a média de 35.9 °C / 97 F , variando de 21.4 a 59 °C para a classe Subnotebook.
(-) A parte inferior aquece até um máximo de 46.8 °C / 116 F, em comparação com a média de 39.2 °C / 103 F
(+) Em uso inativo, a temperatura média para o lado superior é 24.6 °C / 76 F, em comparação com a média do dispositivo de 30.8 °C / ### class_avg_f### F.
(+) Os apoios para as mãos e o touchpad estão atingindo a temperatura máxima da pele (35.2 °C / 95.4 F) e, portanto, não estão quentes.
(-) A temperatura média da área do apoio para as mãos de dispositivos semelhantes foi 28.2 °C / 82.8 F (-7 °C / -12.6 F).
Samsung Galaxy Book S análise de áudio
(±) | o volume do alto-falante é médio, mas bom (###valor### dB)
Graves 100 - 315Hz
(±) | graves reduzidos - em média 10.7% menor que a mediana
(±) | a linearidade dos graves é média (9.7% delta para a frequência anterior)
Médios 400 - 2.000 Hz
(+) | médios equilibrados - apenas 3.8% longe da mediana
(+) | médios são lineares (3.9% delta para frequência anterior)
Altos 2 - 16 kHz
(+) | agudos equilibrados - apenas 2.1% longe da mediana
(+) | os máximos são lineares (2.2% delta da frequência anterior)
Geral 100 - 16.000 Hz
(+) | o som geral é linear (14.8% diferença em relação à mediana)
Comparado com a mesma classe
» 31% de todos os dispositivos testados nesta classe foram melhores, 6% semelhantes, 63% piores
» O melhor teve um delta de 5%, a média foi 18%, o pior foi 53%
Comparado com todos os dispositivos testados
» 20% de todos os dispositivos testados foram melhores, 4% semelhantes, 76% piores
» O melhor teve um delta de 4%, a média foi 24%, o pior foi 134%
Apple MacBook Air 2020 i5 análise de áudio
(±) | o volume do alto-falante é médio, mas bom (###valor### dB)
Graves 100 - 315Hz
(+) | bons graves - apenas 4.3% longe da mediana
(±) | a linearidade dos graves é média (11.5% delta para a frequência anterior)
Médios 400 - 2.000 Hz
(+) | médios equilibrados - apenas 3.4% longe da mediana
(+) | médios são lineares (6.2% delta para frequência anterior)
Altos 2 - 16 kHz
(+) | agudos equilibrados - apenas 2% longe da mediana
(+) | os máximos são lineares (3.7% delta da frequência anterior)
Geral 100 - 16.000 Hz
(+) | o som geral é linear (9.9% diferença em relação à mediana)
Comparado com a mesma classe
» 7% de todos os dispositivos testados nesta classe foram melhores, 1% semelhantes, 92% piores
» O melhor teve um delta de 5%, a média foi 18%, o pior foi 53%
Comparado com todos os dispositivos testados
» 4% de todos os dispositivos testados foram melhores, 1% semelhantes, 95% piores
» O melhor teve um delta de 4%, a média foi 24%, o pior foi 134%
| desligado | |
| Ocioso | |
| Carga |
|
Key:
min: | |
| Samsung Galaxy Book S SD 8cx, Adreno 680, 256 GB NVMe, IPS, 1920x1080, 13.3" | Apple MacBook Air 2020 i3 i3-1000NG4, Iris Plus Graphics G4 (Ice Lake 48 EU), Apple SSD AP0256, IPS, 2560x1600, 13.3" | Dell XPS 13 9300 i5 FHD i5-1035G1, UHD Graphics G1 (Ice Lake 32 EU), Toshiba XG6 KXG60ZNV512G, IPS, 1920x1200, 13.4" | Acer Swift 3 SF313-52-52AS i5-1035G4, Iris Plus Graphics G4 (Ice Lake 48 EU), SK Hynix BC501 HFM512GDJTNG, IPS, 2256x1504, 13.5" | Microsoft Surface Laptop 3 13 Core i5-1035G7 i5-1035G7, Iris Plus Graphics G7 (Ice Lake 64 EU), SK hynix BC501 HFM256GDGTNG, IPS, 2256x1504, 13.5" | Média Qualcomm Adreno 680 | Média da turma Subnotebook | |
|---|---|---|---|---|---|---|---|
| Power Consumption | -54% | -120% | -68% | -154% | -8% | -145% | |
| Idle Minimum * (Watt) | 1.61 | 2.1 -30% | 3.4 -111% | 3 -86% | 4.4 -173% | 1.955 ? -21% | 3.86 ? -140% |
| Idle Average * (Watt) | 4.3 | 6.2 -44% | 6 -40% | 6.1 -42% | 7.5 -74% | 4 ? 7% | 6.61 ? -54% |
| Idle Maximum * (Watt) | 5 | 7 -40% | 10.2 -104% | 8.4 -68% | 7.8 -56% | 5.3 ? -6% | 8 ? -60% |
| Load Average * (Watt) | 13.2 | 24.7 -87% | 36.6 -177% | 25.7 -95% | 41.9 -217% | 13.1 ? 1% | 42.2 ? -220% |
| Load Maximum * (Watt) | 18.3 | 30.6 -67% | 49.3 -169% | 27.6 -51% | 63.9 -249% | 21.7 ? -19% | 64.5 ? -252% |
| Witcher 3 ultra * (Watt) | 40.8 |
* ... menor é melhor
| Samsung Galaxy Book S SD 8cx, Adreno 680, 42 Wh | Apple MacBook Air 2020 i3 i3-1000NG4, Iris Plus Graphics G4 (Ice Lake 48 EU), 49.9 Wh | Dell XPS 13 9300 i5 FHD i5-1035G1, UHD Graphics G1 (Ice Lake 32 EU), 52 Wh | Acer Swift 3 SF313-52-52AS i5-1035G4, Iris Plus Graphics G4 (Ice Lake 48 EU), 54.5 Wh | Microsoft Surface Laptop 3 13 Core i5-1035G7 i5-1035G7, Iris Plus Graphics G7 (Ice Lake 64 EU), 45 Wh | Média da turma Subnotebook | |
|---|---|---|---|---|---|---|
| Duração da bateria | -40% | -35% | -32% | -59% | -37% | |
| H.264 (h) | 21.9 | 11.1 -49% | 14.4 -34% | 15.4 ? -30% | ||
| WiFi v1.3 (h) | 15.9 | 11 -31% | 11.7 -26% | 10.8 -32% | 8.3 -48% | 14 ? -12% |
| Load (h) | 6.2 | 3.4 -45% | 1.9 -69% | 1.969 ? -68% |
Pro
Contra
Veredicto - Companheiro móvel com seleção limitada de aplicativos
O Samsung Galaxy Book S deixou uma boa impressão geral durante nossa análise. Gostamos muito da combinação do chassi extremamente leve, longos tempos de duração da bateria e o modem LTE integrado, o que faz muito sentido se você viaja muito e precisa de um dispositivo para feiras comerciais, por exemplo. Se você usa principalmente aplicativos web e o Microsoft Office Suite, dificilmente notará as limitações do processador ARM. Recomendamos ainda verificar se existem versões compatíveis dos aplicativos que você planeja utilizar antes da compra.
A solução de resfriamento passivo e os excelentes alto-falantes são outros dois destaques. Os dispositivos de entrada são médios, mas a iluminação do teclado só é utilizável na escuridão total, porque é muito suave e se ativa após um pequeno atraso. Definitivamente, isso requer algum ajuste fino. A tela também não é ruim, mas a concorrência só usa painéis melhores e o próprio Galaxy Book S da Samsung com o processador Intel também é muito mais brilhante, de acordo com as especificações oficiais.
O Samsung Galaxy Book S é um excelente companheiro móvel com um chassi extremamente leve, LTE integrado e tempos de duração de bateria muito longos. Você deve considerar as limitações da seleção de aplicativos devido ao processador ARM antes da compra.
Já estamos ansiosos para ver como o Galaxy Book S com o processador híbrido Intel irá funcionar. Ele deve oferecer mais desempenho e compatibilidade, mas tem tempos de duração mais curtos em troca e também não possui um modem LTE.
Samsung Galaxy Book S
- 06/22/2020 v7 (old)
Andreas Osthoff
Price comparison
