Breve Análise do Portátil 2-em-1 Dell Latitude 7200: O dispositivo híbrido deixa uma boa impressão, apesar de seu teclado flexível
| SD Card Reader | |
| average JPG Copy Test (av. of 3 runs) | |
| Dell Latitude 7200 (Toshiba Exceria Pro M501 64 GB UHS-II) | |
| Lenovo ThinkPad X1 Tablet G3-20KJ001NGE (Toshiba Exceria Pro M501 UHS-II) | |
| Microsoft Surface Pro 6, Core i7, 512 GB (Toshiba Exceria Pro M501 microSDXC 64GB) | |
| Média da turma Convertible (29.4 - 186, n=21, últimos 2 anos) | |
| maximum AS SSD Seq Read Test (1GB) | |
| Dell Latitude 7200 (Toshiba Exceria Pro M501 64 GB UHS-II) | |
| Média da turma Convertible (67.5 - 254, n=20, últimos 2 anos) | |
| Microsoft Surface Pro 6, Core i7, 512 GB (Toshiba Exceria Pro M501 microSDXC 64GB) | |
| Lenovo ThinkPad X1 Tablet G3-20KJ001NGE (Toshiba Exceria Pro M501 UHS-II) | |
| |||||||||||||||||||||||||
iluminação: 88 %
iluminação com acumulador: 394 cd/m²
Contraste: 1432:1 (Preto: 0.28 cd/m²)
ΔE ColorChecker Calman: 1.8 | ∀{0.5-29.43 Ø4.71}
calibrated: 1.1
ΔE Greyscale Calman: 1.6 | ∀{0.09-98 Ø4.96}
99.4% sRGB (Argyll 1.6.3 3D)
66.6% AdobeRGB 1998 (Argyll 1.6.3 3D)
72.6% AdobeRGB 1998 (Argyll 3D)
99.5% sRGB (Argyll 3D)
71.6% Display P3 (Argyll 3D)
Gamma: 2.14
CCT: 6702 K
| Dell Latitude 7200 SHP14A3 LQ123N1, , 1920x1280, 12.3" | Lenovo ThinkPad X1 Tablet G3-20KJ001NGE LP130QP1-SPA1, , 3000x2000, 13" | HP Elite x2 1013 G3-2TT14EA AU Optronics AUO101A, , 3000x2000, 13" | Microsoft Surface Pro 6, Core i7, 512 GB LGPhilips LP123WQ112604, , 2736x1824, 12.3" | |
|---|---|---|---|---|
| Display | -3% | -5% | -5% | |
| Display P3 Coverage (%) | 71.6 | 68.1 -5% 67.8 -5% | 67.5 -6% | 67.1 -6% |
| sRGB Coverage (%) | 99.5 | 99.4 0% 99.1 0% | 96.7 -3% | 95.5 -4% |
| AdobeRGB 1998 Coverage (%) | 72.6 | 69.9 -4% 69.3 -5% | 68.2 -6% | 67.9 -6% |
| Response Times | -7% | 18% | 23% | |
| Response Time Grey 50% / Grey 80% * (ms) | 52 ? | 47.2 ? 9% | 47 ? 10% | 43 ? 17% |
| Response Time Black / White * (ms) | 34.8 ? | 42.4 ? -22% | 26 ? 25% | 25 ? 28% |
| PWM Frequency (Hz) | 1645 ? | 22000 ? | ||
| Screen | -30% | -51% | -36% | |
| Brightness middle (cd/m²) | 401 | 474 18% | 452 13% | 484 21% |
| Brightness (cd/m²) | 385 | 418 9% | 412 7% | 473 23% |
| Brightness Distribution (%) | 88 | 76 -14% | 85 -3% | 91 3% |
| Black Level * (cd/m²) | 0.28 | 0.33 -18% | 0.48 -71% | 0.33 -18% |
| Contrast (:1) | 1432 | 1436 0% | 942 -34% | 1467 2% |
| Colorchecker dE 2000 * | 1.8 | 3.2 -78% | 4.05 -125% | 4.29 -138% |
| Colorchecker dE 2000 max. * | 3.4 | 6.1 -79% | 6.64 -95% | 6.46 -90% |
| Colorchecker dE 2000 calibrated * | 1.1 | 0.9 18% | 1.56 -42% | 1.34 -22% |
| Greyscale dE 2000 * | 1.6 | 4.5 -181% | 4.87 -204% | 4.3 -169% |
| Gamma | 2.14 103% | 2.07 106% | 2.71 81% | 2.51 88% |
| CCT | 6702 97% | 5881 111% | 7160 91% | 7315 89% |
| Color Space (Percent of AdobeRGB 1998) (%) | 66.6 | 64 -4% | 62 -7% | 62 -7% |
| Color Space (Percent of sRGB) (%) | 99.4 | 99.4 0% | 97 -2% | 95 -4% |
| Média Total (Programa/Configurações) | -13% /
-19% | -13% /
-34% | -6% /
-23% |
* ... menor é melhor
Exibir tempos de resposta
| ↔ Tempo de resposta preto para branco | ||
|---|---|---|
| 34.8 ms ... ascensão ↗ e queda ↘ combinadas | ↗ 18.4 ms ascensão | 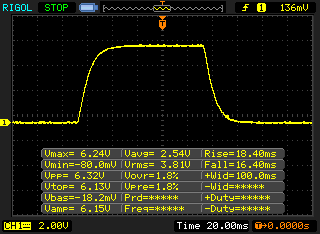 |
| ↘ 16.4 ms queda | ||
| A tela mostra taxas de resposta lentas em nossos testes e será insatisfatória para os jogadores. Em comparação, todos os dispositivos testados variam de 0.1 (mínimo) a 240 (máximo) ms. » 92 % de todos os dispositivos são melhores. Isso significa que o tempo de resposta medido é pior que a média de todos os dispositivos testados (19.8 ms). | ||
| ↔ Tempo de resposta 50% cinza a 80% cinza | ||
| 52 ms ... ascensão ↗ e queda ↘ combinadas | ↗ 26 ms ascensão | 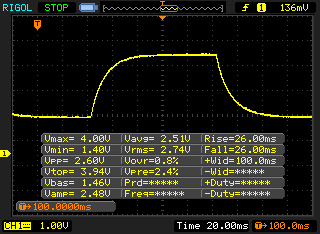 |
| ↘ 26 ms queda | ||
| A tela mostra taxas de resposta lentas em nossos testes e será insatisfatória para os jogadores. Em comparação, todos os dispositivos testados variam de 0.165 (mínimo) a 636 (máximo) ms. » 88 % de todos os dispositivos são melhores. Isso significa que o tempo de resposta medido é pior que a média de todos os dispositivos testados (30.9 ms). | ||
Cintilação da tela / PWM (modulação por largura de pulso)
| Tela tremeluzindo/PWM detectado | 1645 Hz | ≤ 25 % configuração de brilho | 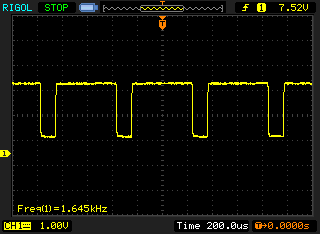 |
A luz de fundo da tela pisca em 1645 Hz (pior caso, por exemplo, utilizando PWM) Cintilação detectada em uma configuração de brilho de 25 % e abaixo. Não deve haver cintilação ou PWM acima desta configuração de brilho. A frequência de 1645 Hz é bastante alta, então a maioria dos usuários sensíveis ao PWM não deve notar nenhuma oscilação. [pwm_comparison] Em comparação: 52 % de todos os dispositivos testados não usam PWM para escurecer a tela. Se PWM foi detectado, uma média de 7748 (mínimo: 5 - máximo: 343500) Hz foi medida. | |||
| PCMark 8 Home Score Accelerated v2 | 3392 pontos | |
| PCMark 8 Work Score Accelerated v2 | 4858 pontos | |
| PCMark 10 Score | 3782 pontos | |
Ajuda | ||
| Dell Latitude 7200 WDC PC SN520 SDAPNUW-512G | Lenovo ThinkPad X1 Tablet G3-20KJ001NGE Samsung PM961 MZVLW256HEHP | HP Elite x2 1013 G3-2TT14EA Samsung PM961 MZVLW256HEHP | Microsoft Surface Pro 6, Core i7, 512 GB Toshiba KBG30ZPZ512G | Média WDC PC SN520 SDAPNUW-512G | |
|---|---|---|---|---|---|
| CrystalDiskMark 5.2 / 6 | -2% | 9% | -29% | 7% | |
| Write 4K (MB/s) | 131.9 | 95.4 -28% | 91 -31% | 83.2 -37% | 138.5 ? 5% |
| Read 4K (MB/s) | 45.47 | 39.19 -14% | 36.84 -19% | 43.84 -4% | 44.2 ? -3% |
| Write Seq (MB/s) | 1021 | 1197 17% | 636 -38% | 1265 ? 24% | |
| Read Seq (MB/s) | 1085 | 1705 57% | 900 -17% | 1237 ? 14% | |
| Write 4K Q32T1 (MB/s) | 444.9 | 399.2 -10% | 355.8 -20% | 192.9 -57% | 404 ? -9% |
| Read 4K Q32T1 (MB/s) | 366.6 | 260.7 -29% | 256.9 -30% | 247.4 -33% | 421 ? 15% |
| Write Seq Q32T1 (MB/s) | 1458 | 1287 -12% | 1222 -16% | 861 -41% | 1491 ? 2% |
| Read Seq Q32T1 (MB/s) | 1640 | 3025 84% | 3460 111% | 1615 -2% | 1741 ? 6% |

| 3DMark 11 Performance | 1992 pontos | |
| 3DMark Cloud Gate Standard Score | 7916 pontos | |
| 3DMark Fire Strike Score | 1071 pontos | |
Ajuda | ||
| baixo | média | alto | ultra | |
|---|---|---|---|---|
| BioShock Infinite (2013) | 67.6 | 34.6 | 29.2 | 9.5 |
| The Witcher 3 (2015) | 16.4 | |||
| Dota 2 Reborn (2015) | 73 | 43.3 | 19.9 | 17.8 |
| Rise of the Tomb Raider (2016) | 21.9 | |||
| X-Plane 11.11 (2018) | 22.1 | 14.7 | 13.1 |
Barulho
| Ocioso |
| 28.8 / 28.8 / 28.8 dB |
| Carga |
| 30.1 / 30.1 dB |
 | ||
30 dB silencioso 40 dB(A) audível 50 dB(A) ruidosamente alto |
||
min: | ||
(±) A temperatura máxima no lado superior é 42.5 °C / 109 F, em comparação com a média de 35.4 °C / 96 F , variando de 19.6 a 60 °C para a classe Convertible.
(+) A parte inferior aquece até um máximo de 39.4 °C / 103 F, em comparação com a média de 36.9 °C / 98 F
(+) Em uso inativo, a temperatura média para o lado superior é 22.9 °C / 73 F, em comparação com a média do dispositivo de 30.3 °C / ### class_avg_f### F.
(+) Os apoios para as mãos e o touchpad são mais frios que a temperatura da pele, com um máximo de 30.9 °C / 87.6 F e, portanto, são frios ao toque.
(-) A temperatura média da área do apoio para as mãos de dispositivos semelhantes foi 28 °C / 82.4 F (-2.9 °C / -5.2 F).
Dell Latitude 7200 análise de áudio
(-) | alto-falantes não muito altos (###valor### dB)
Graves 100 - 315Hz
(-) | quase nenhum baixo - em média 17.3% menor que a mediana
(±) | a linearidade dos graves é média (9.2% delta para a frequência anterior)
Médios 400 - 2.000 Hz
(+) | médios equilibrados - apenas 4.5% longe da mediana
(±) | a linearidade dos médios é média (7.5% delta para frequência anterior)
Altos 2 - 16 kHz
(+) | agudos equilibrados - apenas 4.9% longe da mediana
(±) | a linearidade dos máximos é média (7.2% delta para frequência anterior)
Geral 100 - 16.000 Hz
(±) | a linearidade do som geral é média (26.7% diferença em relação à mediana)
Comparado com a mesma classe
» 83% de todos os dispositivos testados nesta classe foram melhores, 3% semelhantes, 14% piores
» O melhor teve um delta de 6%, a média foi 20%, o pior foi 57%
Comparado com todos os dispositivos testados
» 82% de todos os dispositivos testados foram melhores, 4% semelhantes, 14% piores
» O melhor teve um delta de 4%, a média foi 23%, o pior foi 134%
Microsoft Surface Pro 6, Core i7, 512 GB análise de áudio
(-) | alto-falantes não muito altos (###valor### dB)
Graves 100 - 315Hz
(±) | graves reduzidos - em média 11.4% menor que a mediana
(±) | a linearidade dos graves é média (10.6% delta para a frequência anterior)
Médios 400 - 2.000 Hz
(+) | médios equilibrados - apenas 4.3% longe da mediana
(±) | a linearidade dos médios é média (10.4% delta para frequência anterior)
Altos 2 - 16 kHz
(±) | máximos mais altos - em média 5.7% maior que a mediana
(±) | a linearidade dos máximos é média (8.1% delta para frequência anterior)
Geral 100 - 16.000 Hz
(±) | a linearidade do som geral é média (21.4% diferença em relação à mediana)
Comparado com a mesma classe
» 57% de todos os dispositivos testados nesta classe foram melhores, 12% semelhantes, 32% piores
» O melhor teve um delta de 6%, a média foi 20%, o pior foi 57%
Comparado com todos os dispositivos testados
» 60% de todos os dispositivos testados foram melhores, 7% semelhantes, 33% piores
» O melhor teve um delta de 4%, a média foi 23%, o pior foi 134%
| desligado | |
| Ocioso | |
| Carga |
|
Key:
min: | |
| Dell Latitude 7200 i5-8365U, UHD Graphics 620, WDC PC SN520 SDAPNUW-512G, IPS LED, 1920x1280, 12.3" | Lenovo ThinkPad X1 Tablet G3-20KJ001NGE i5-8250U, UHD Graphics 620, Samsung PM961 MZVLW256HEHP, IPS, 3000x2000, 13" | HP Elite x2 1013 G3-2TT14EA i5-8350U, UHD Graphics 620, Samsung PM961 MZVLW256HEHP, IPS, 3000x2000, 13" | Microsoft Surface Pro 6, Core i7, 512 GB i7-8650U, UHD Graphics 620, Toshiba KBG30ZPZ512G, IPS, 2736x1824, 12.3" | |
|---|---|---|---|---|
| Power Consumption | -38% | -25% | -13% | |
| Idle Minimum * (Watt) | 3.3 | 4.8 -45% | 4.9 -48% | 3.2 3% |
| Idle Average * (Watt) | 5.8 | 9 -55% | 8.9 -53% | 8.7 -50% |
| Idle Maximum * (Watt) | 6.5 | 10.5 -62% | 11 -69% | 10.4 -60% |
| Load Average * (Watt) | 37 | 42.8 -16% | 32 14% | 29.2 21% |
| Load Maximum * (Watt) | 51.3 | 57.8 -13% | 36 30% | 40.8 20% |
* ... menor é melhor
| Dell Latitude 7200 i5-8365U, UHD Graphics 620, 38 Wh | Lenovo ThinkPad X1 Tablet G3-20KJ001NGE i5-8250U, UHD Graphics 620, 42 Wh | HP Elite x2 1013 G3-2TT14EA i5-8350U, UHD Graphics 620, 50 Wh | Microsoft Surface Pro 6, Core i7, 512 GB i7-8650U, UHD Graphics 620, 45 Wh | Média da turma Convertible | |
|---|---|---|---|---|---|
| Duração da bateria | -7% | 6% | 22% | 50% | |
| H.264 (h) | 8.2 | 8.7 6% | 6.5 -21% | 15 ? 83% | |
| WiFi v1.3 (h) | 7 | 6.6 -6% | 7.7 10% | 8.5 21% | 12 ? 71% |
| Load (h) | 1.8 | 1.4 -22% | 2.3 28% | 2.2 22% | 1.713 ? -5% |
| Reader / Idle (h) | 13.2 | 13 | 18.1 | 26.7 ? |
Pro
Contra

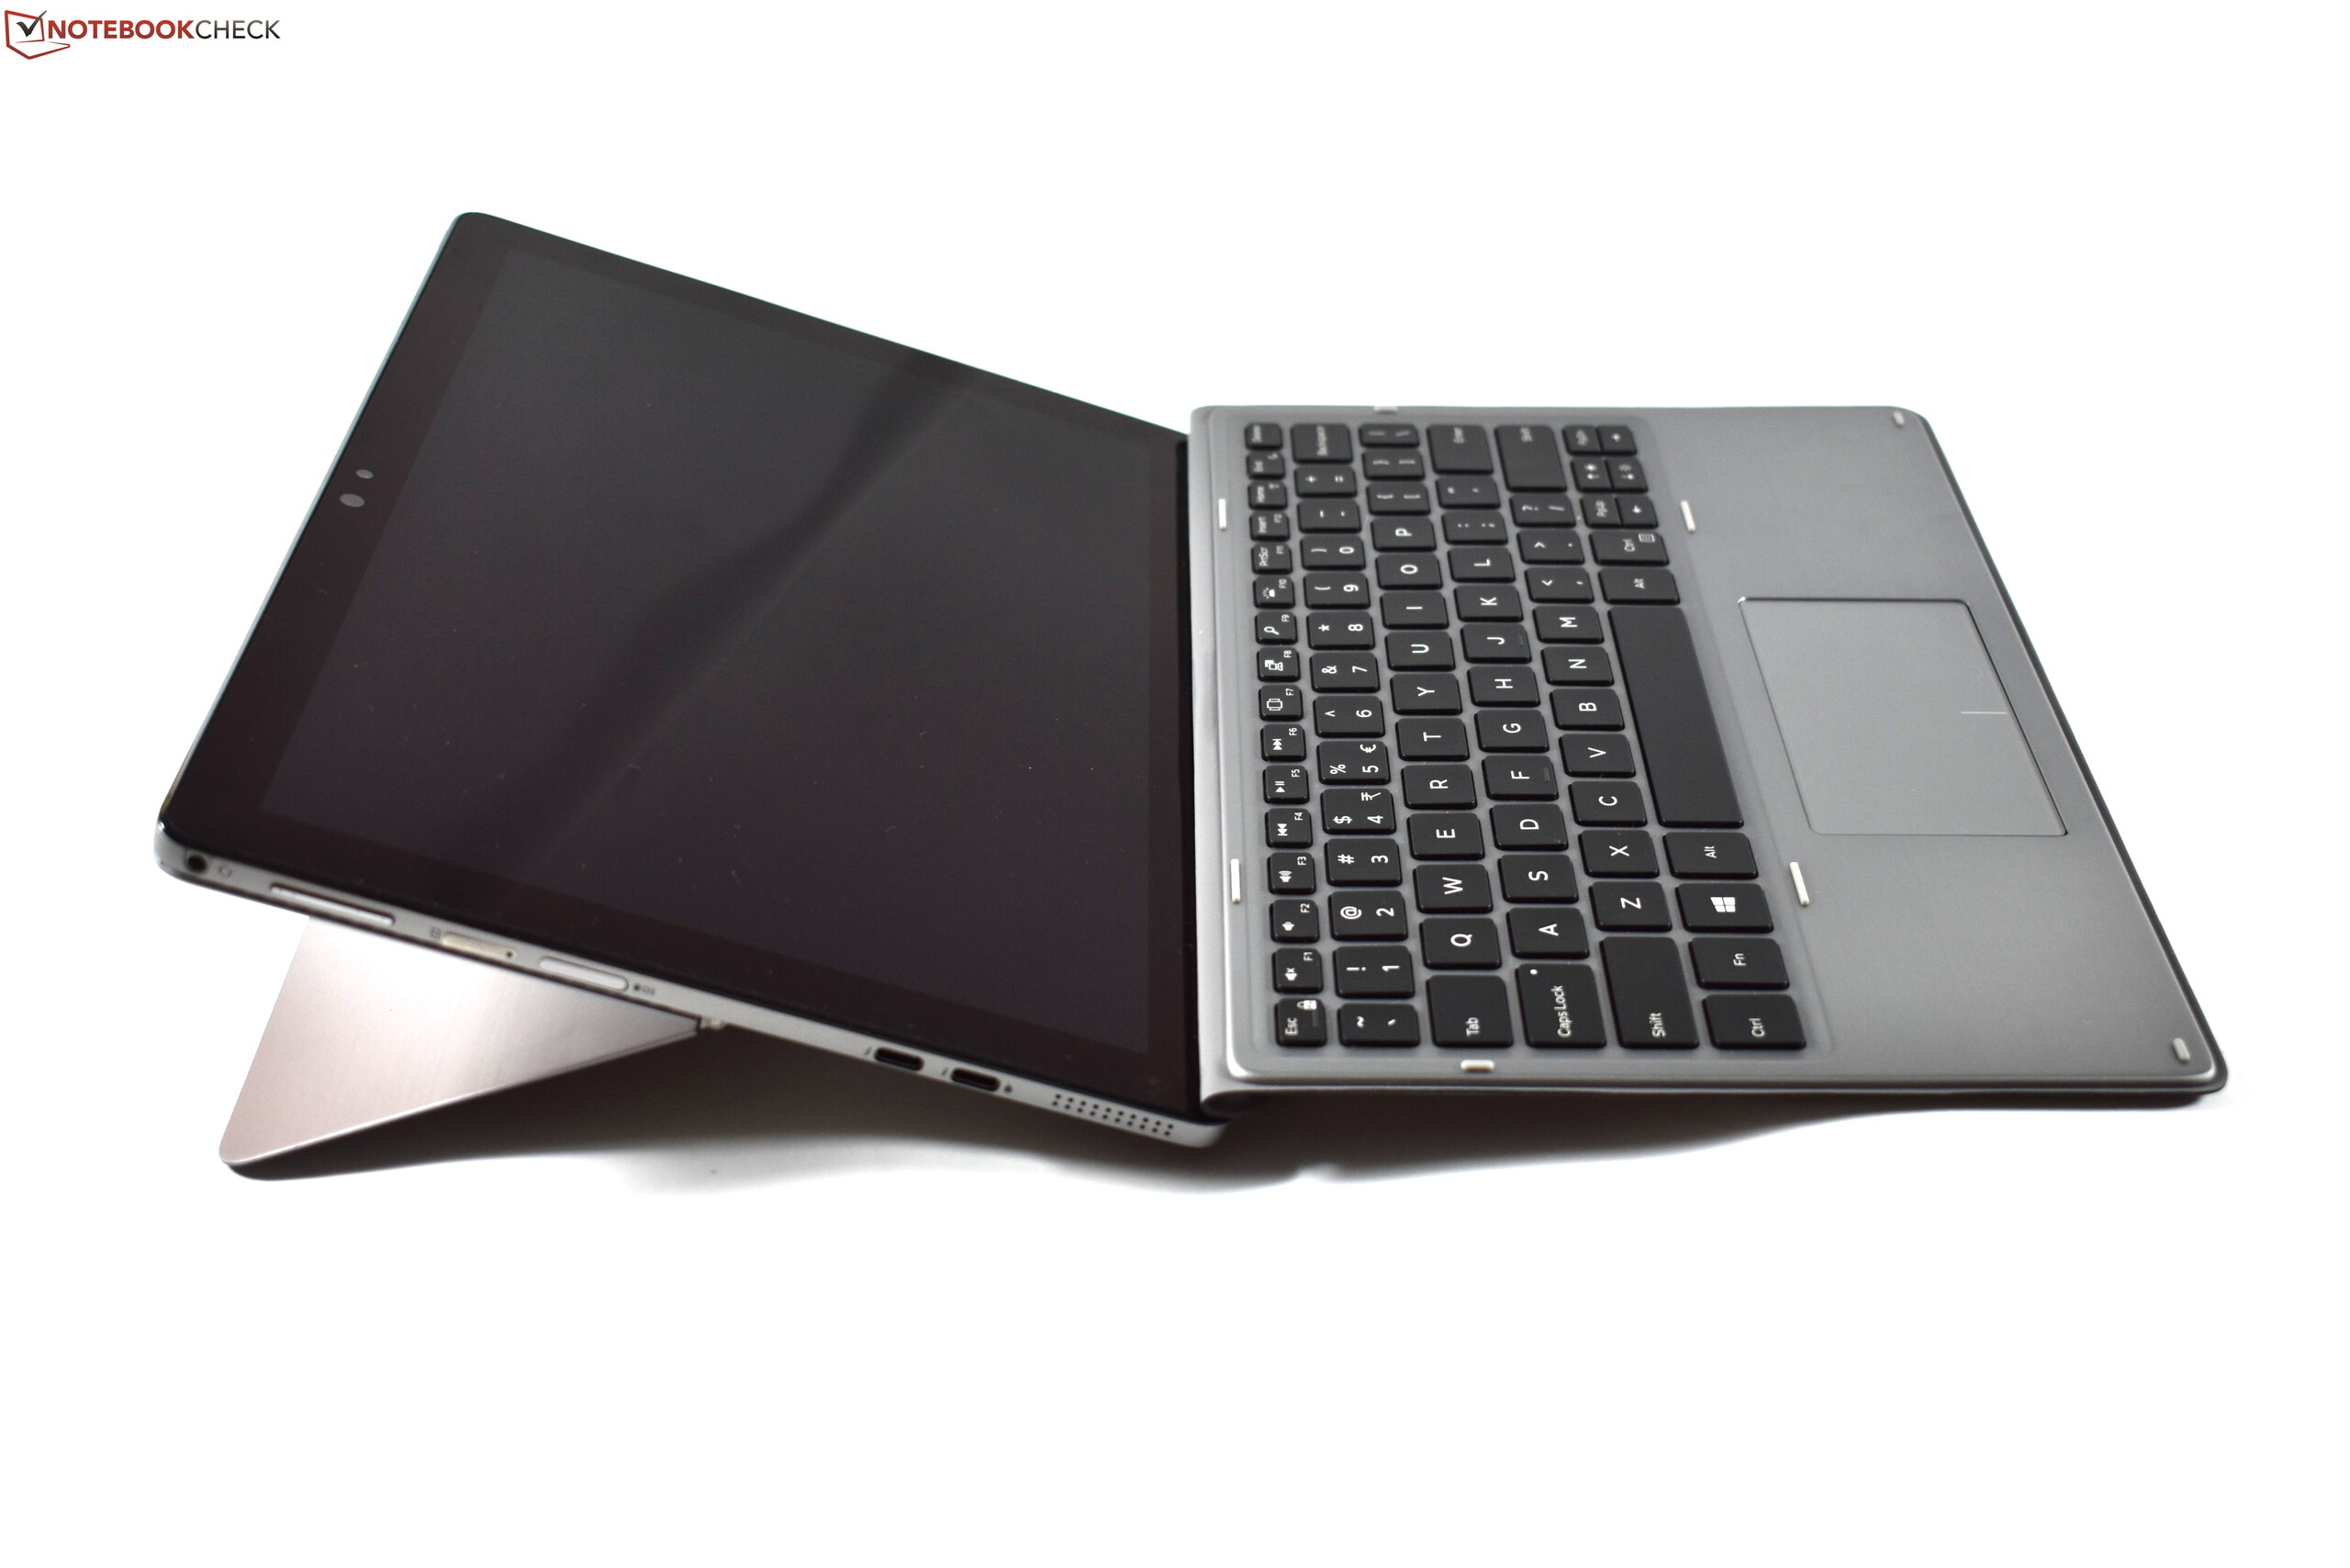
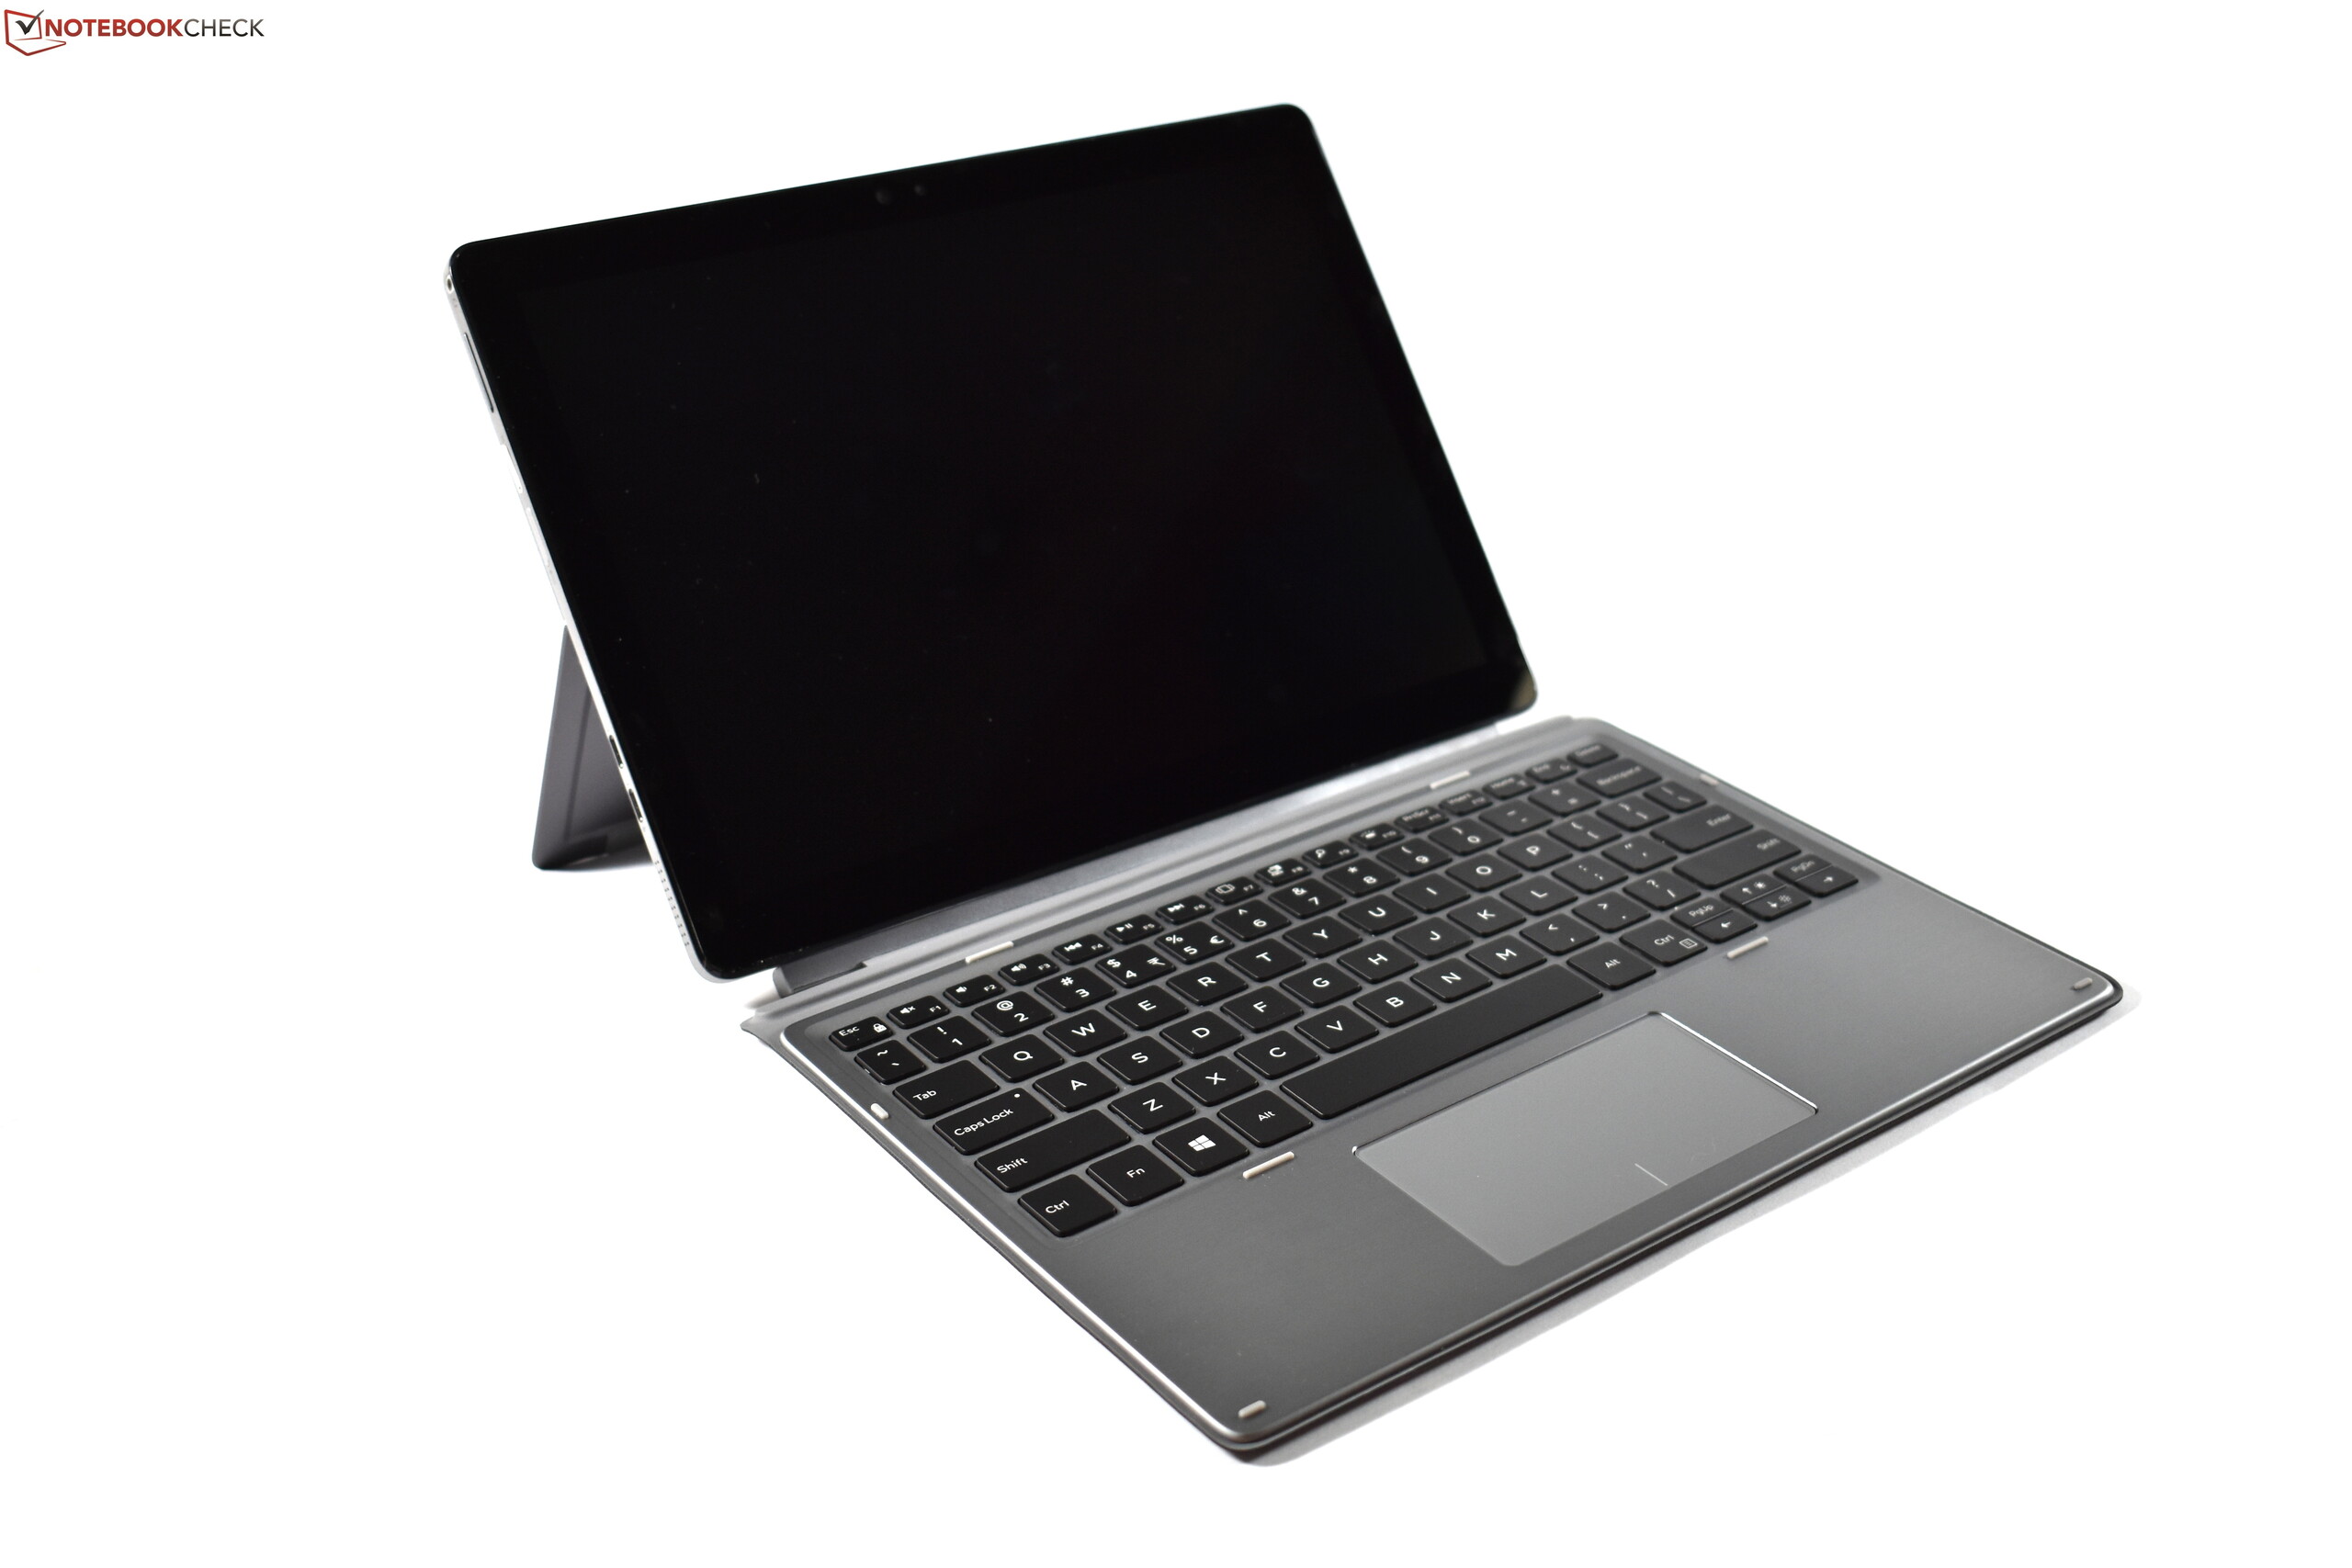
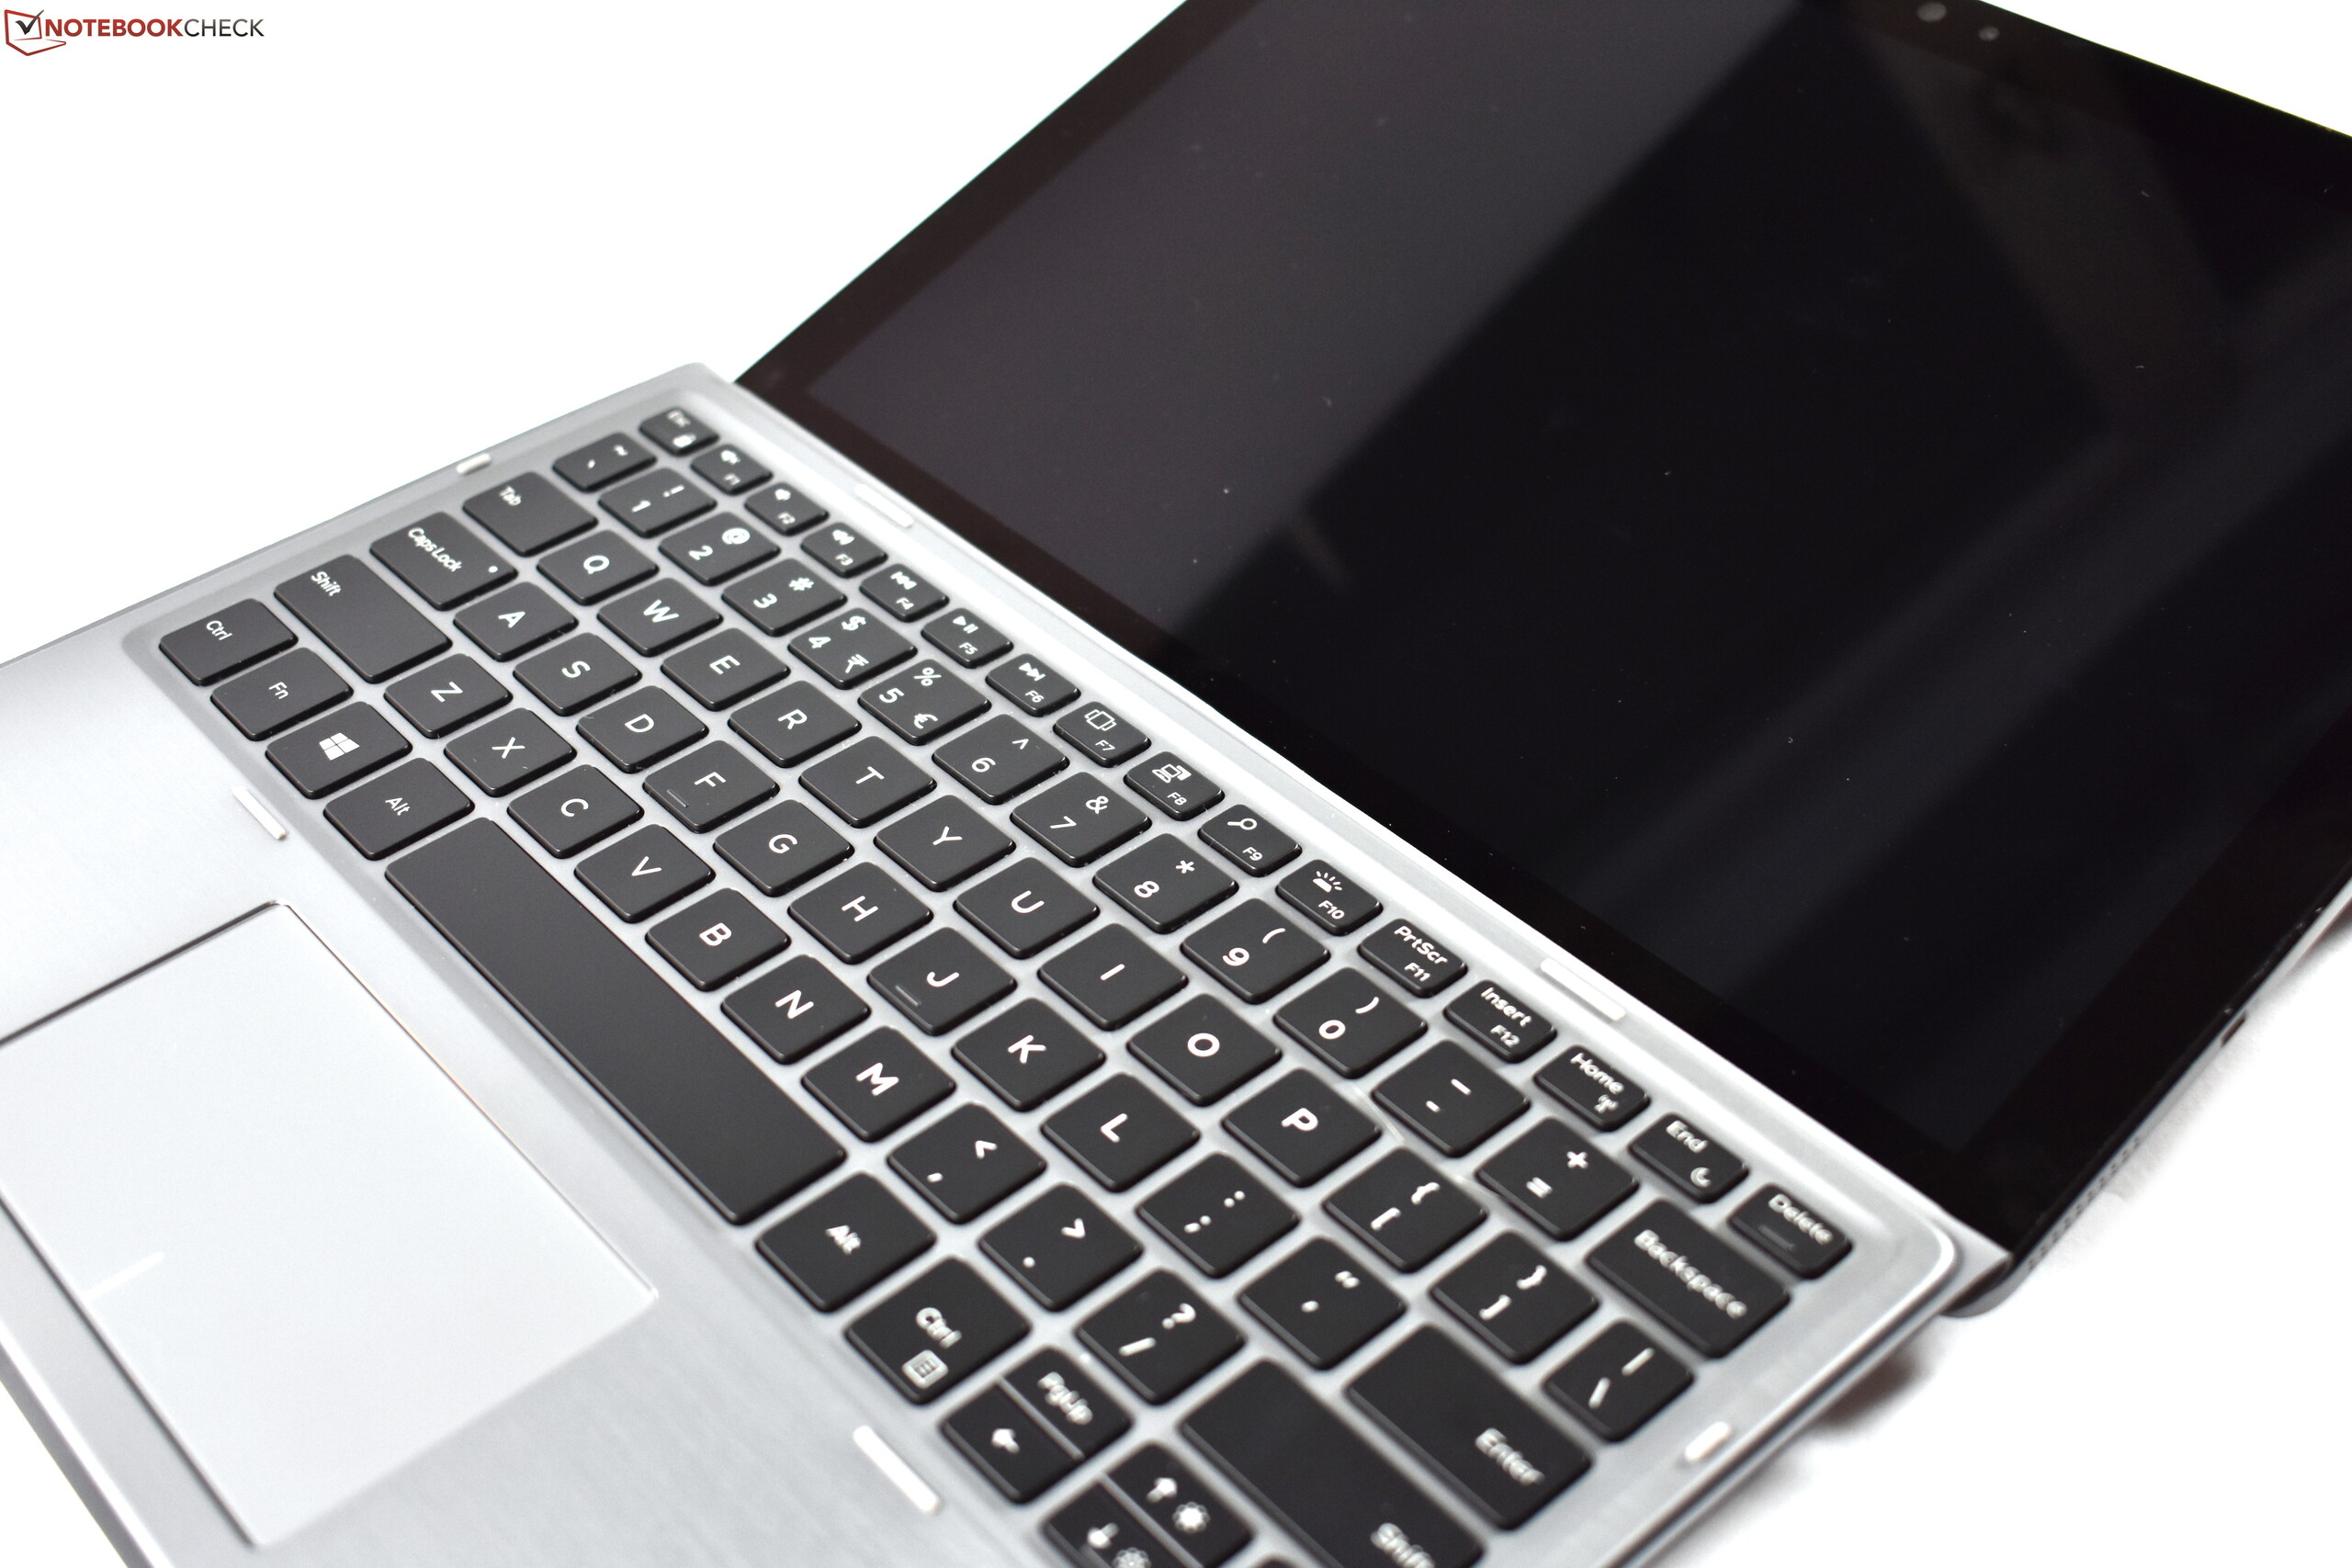
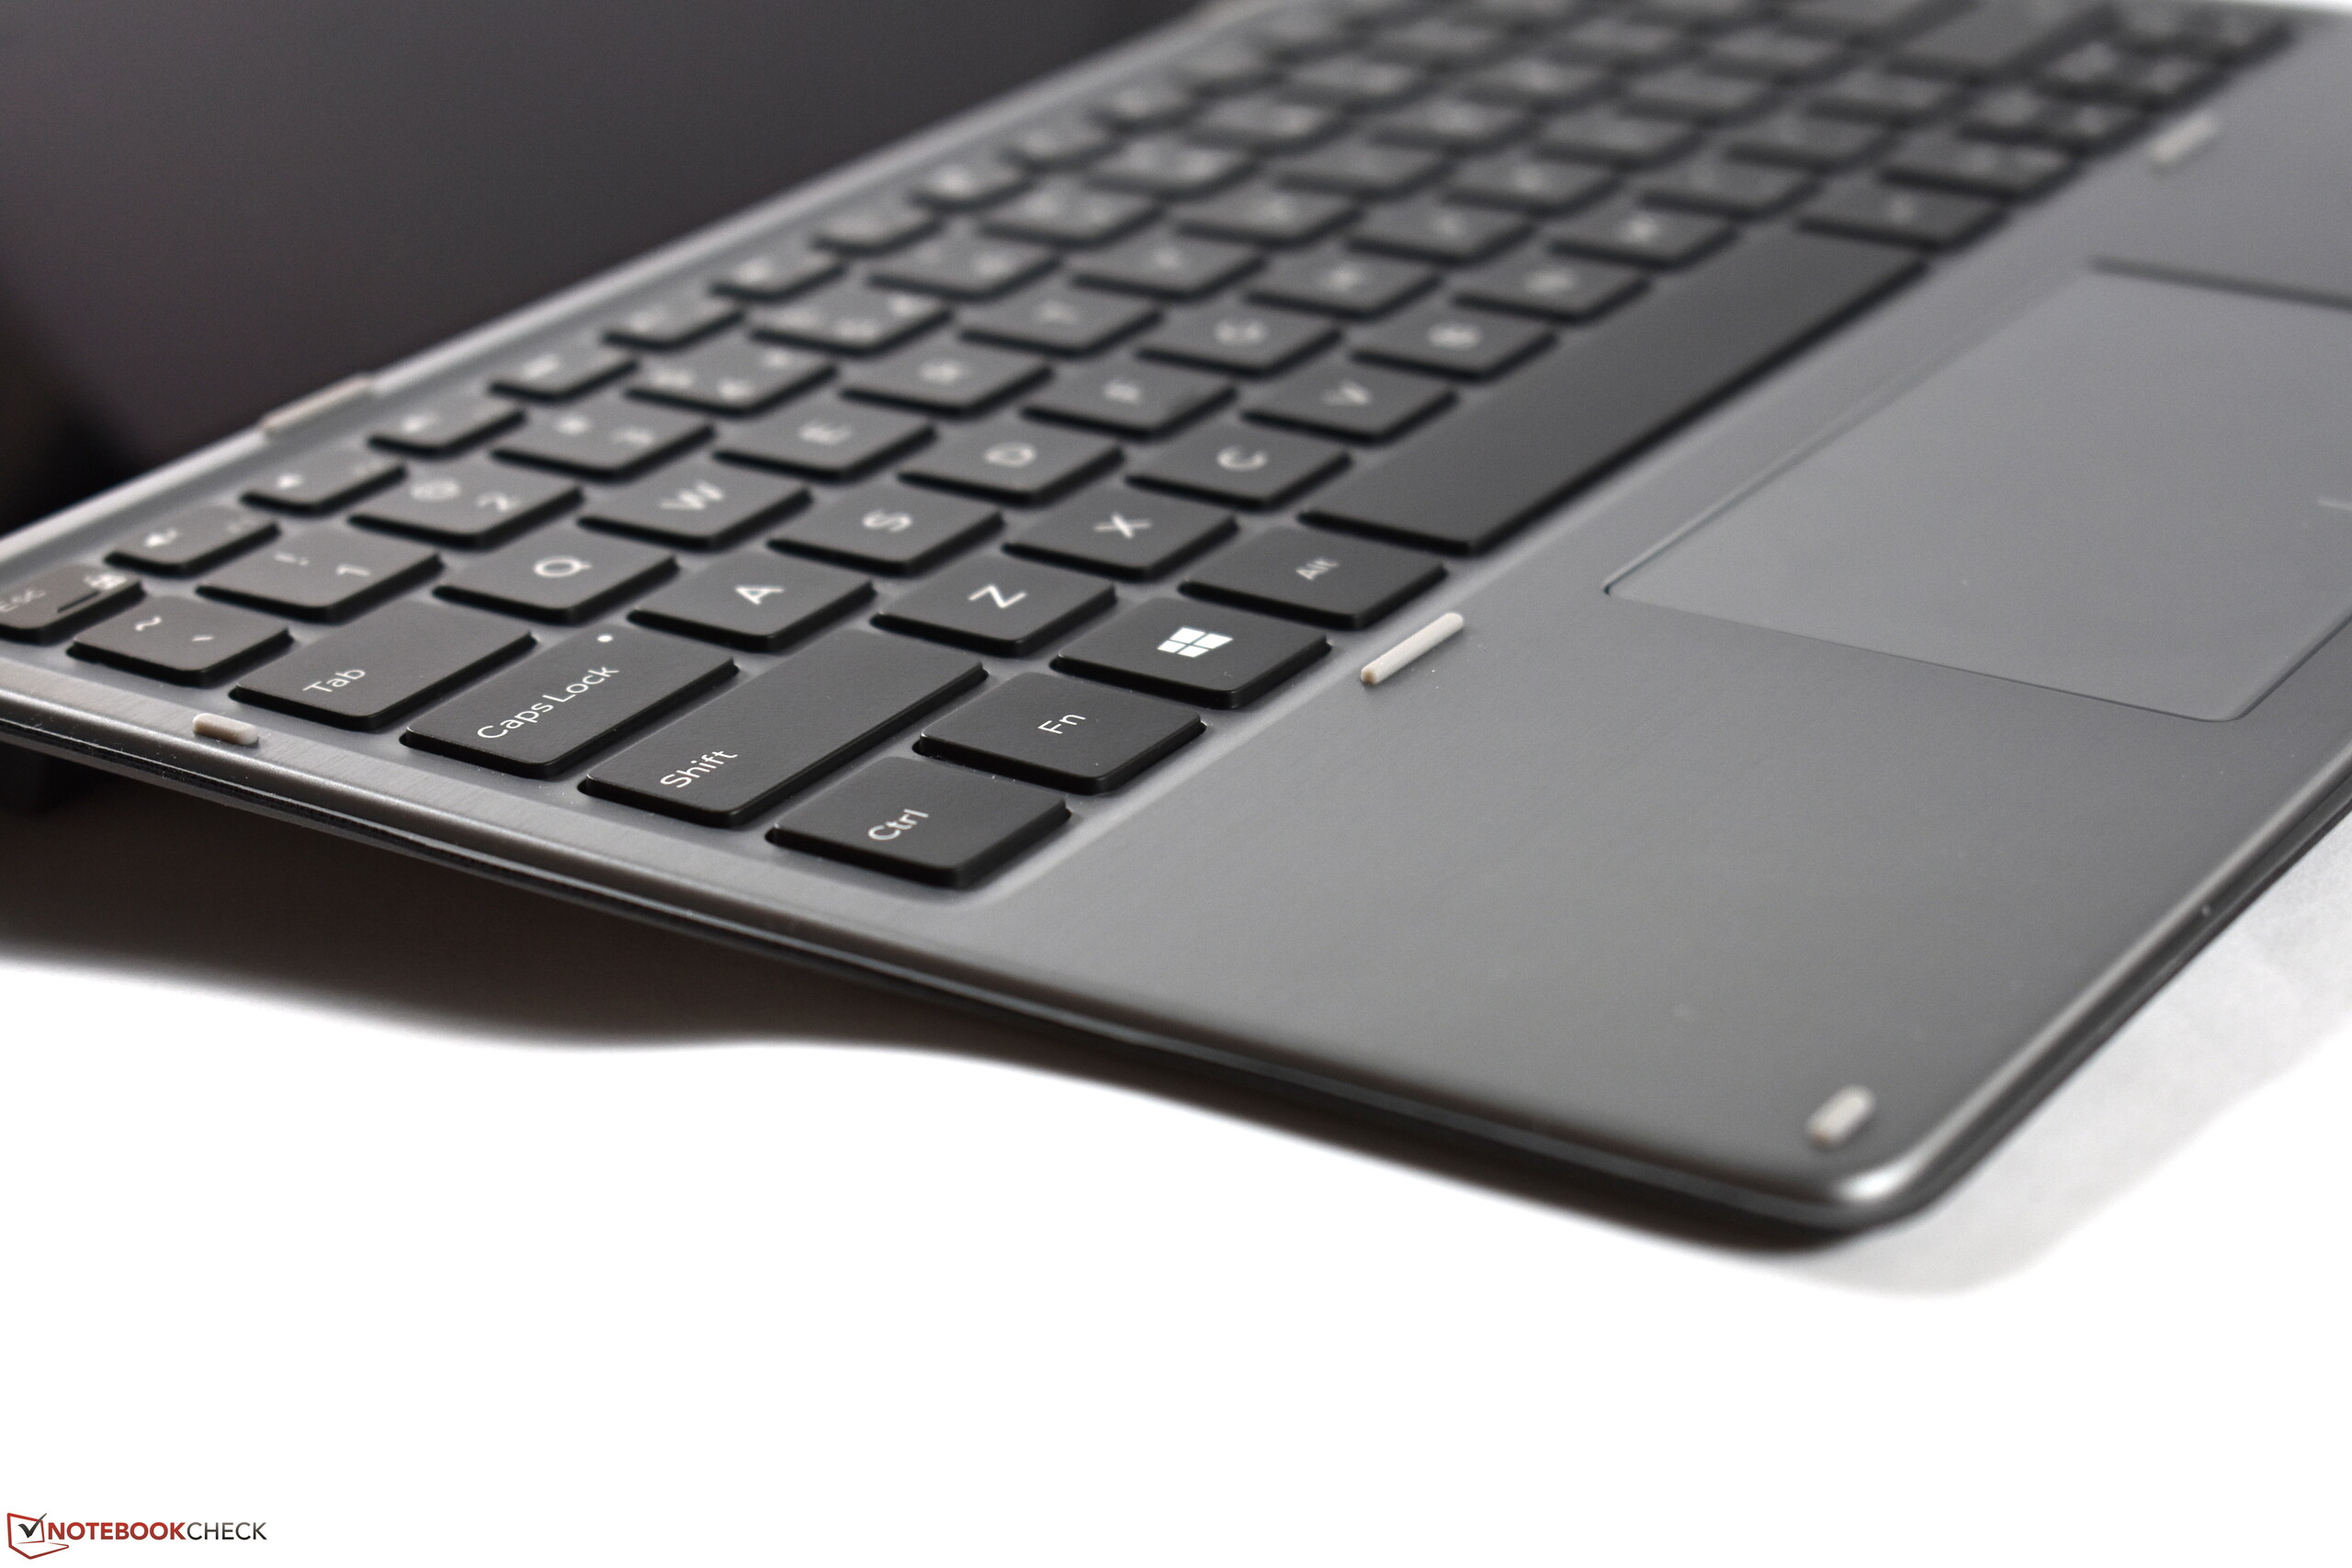
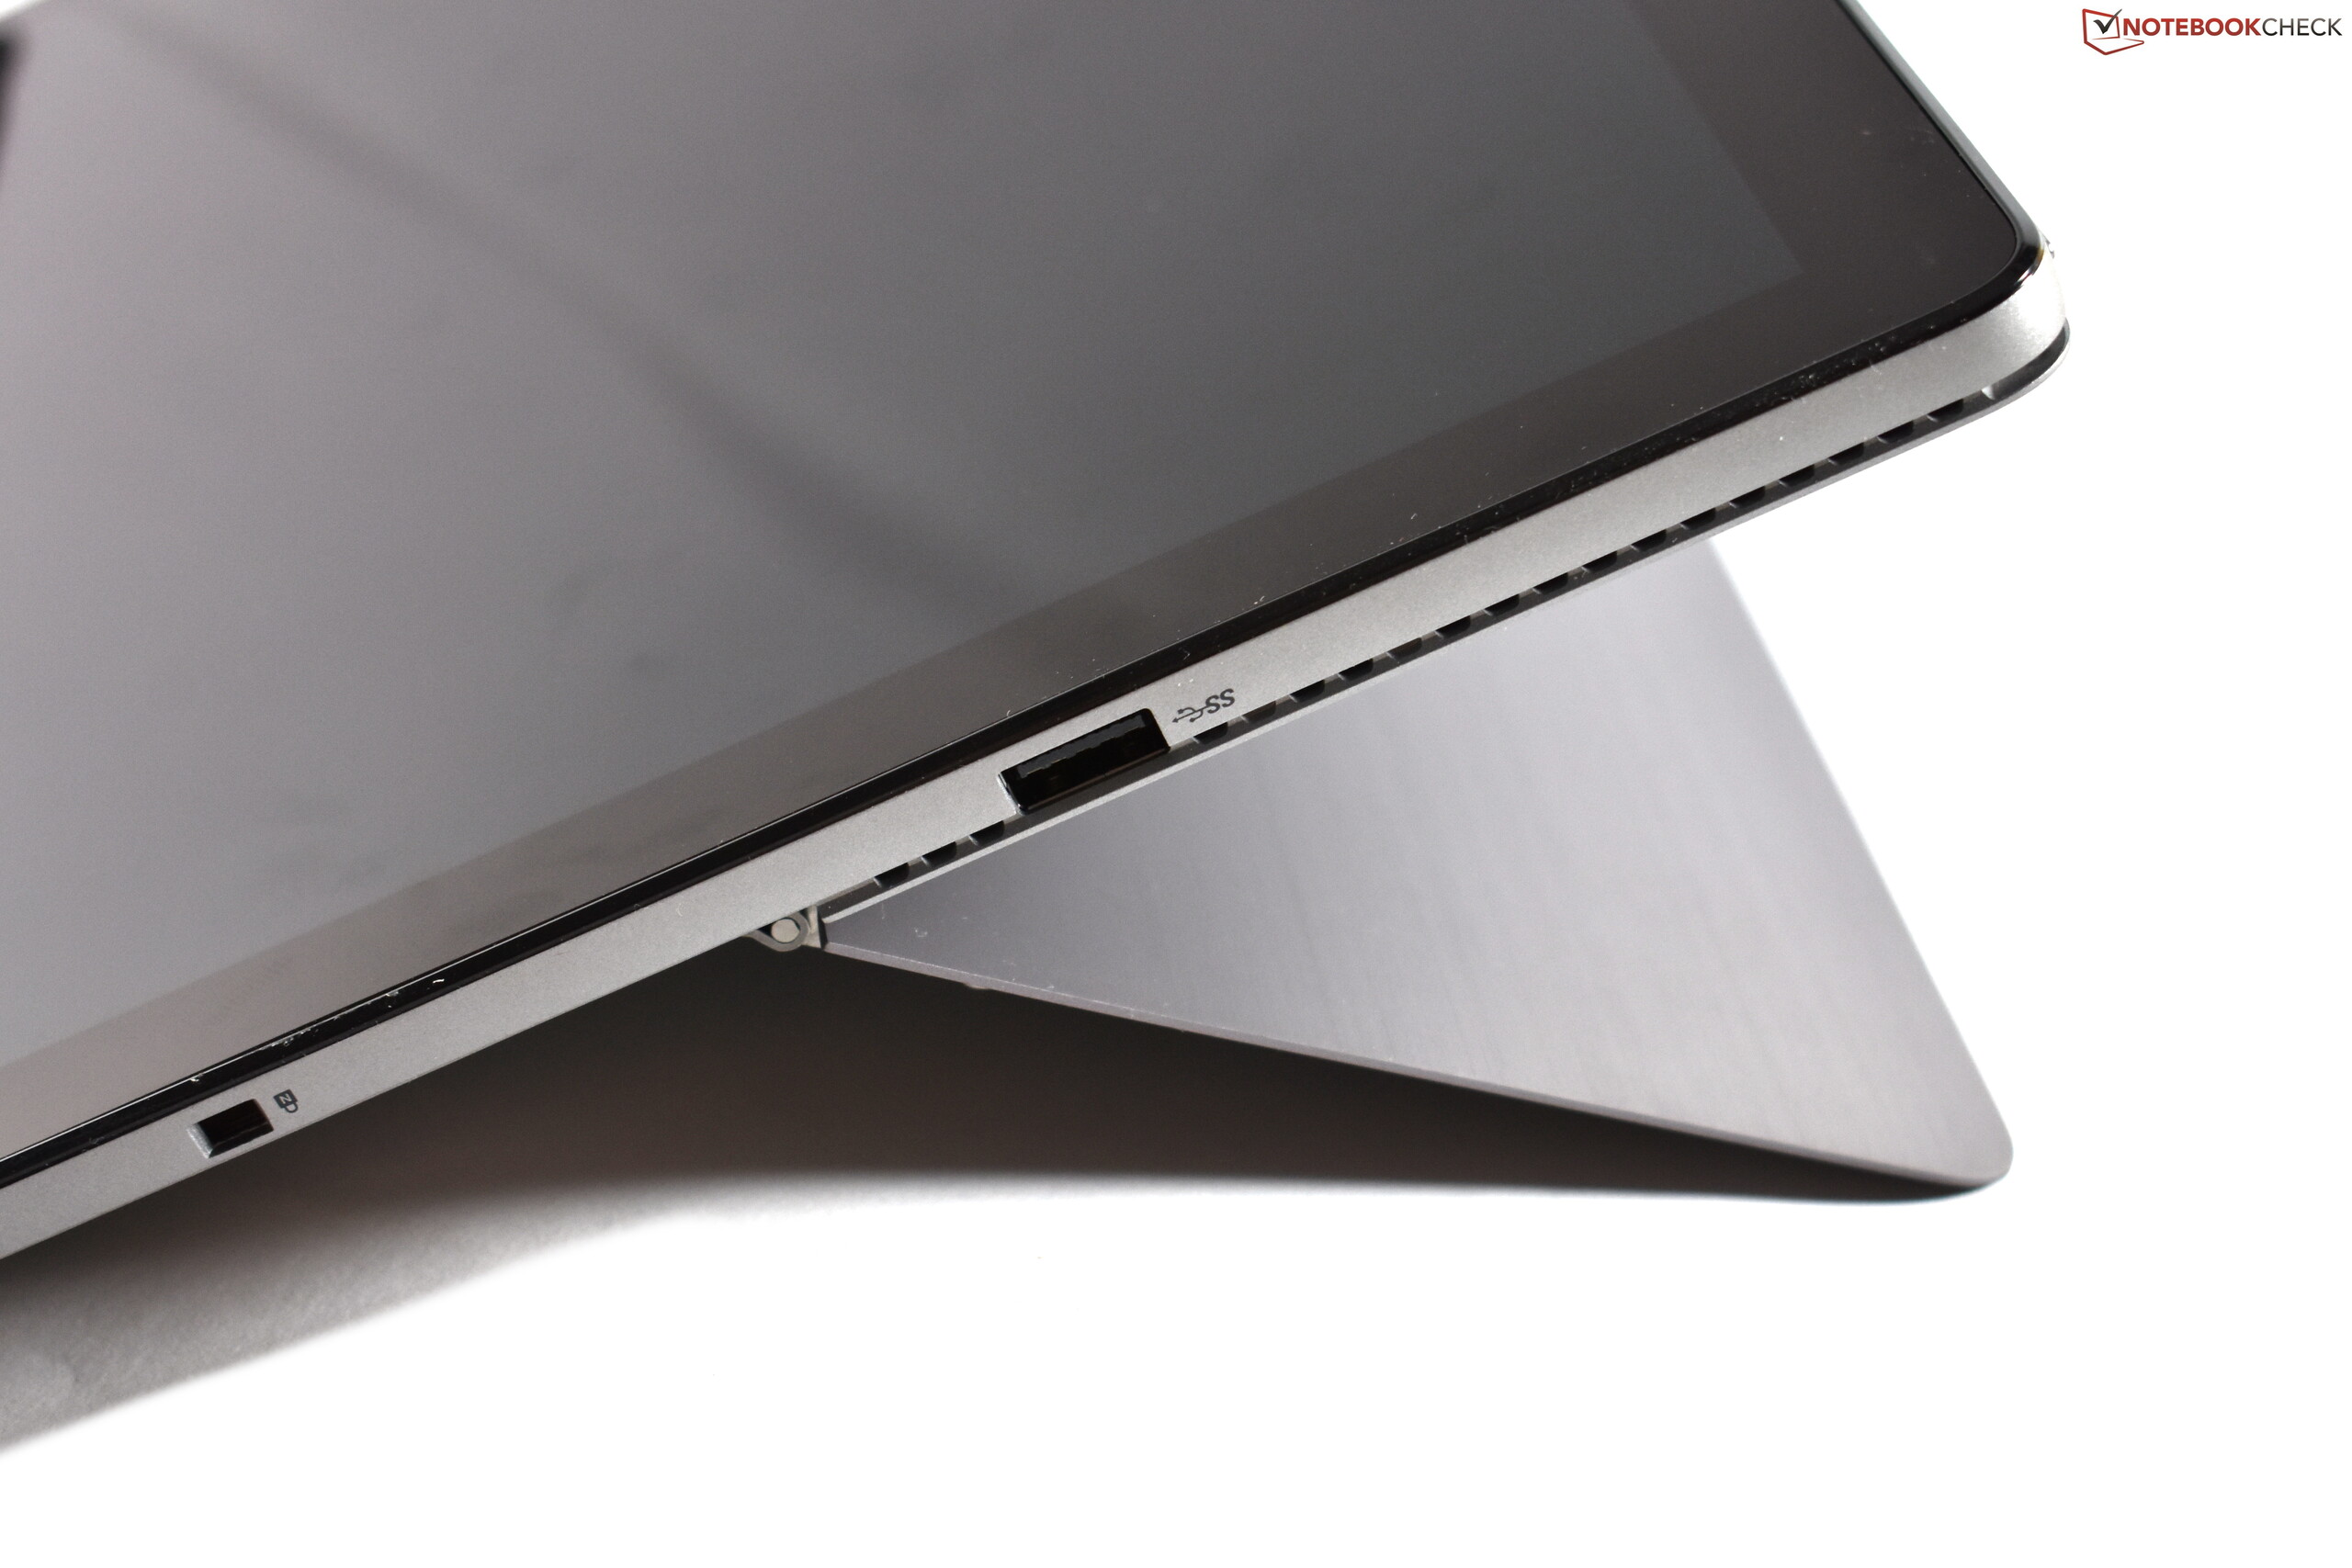
Um clone do Surface? A Dell provavelmente ficaria longe dessa descrição para o 2-em-1 Dell Latitude 7200, mesmo que seja adequada para o dispositivo. A Dell adapta o princípio básico do Microsoft Surface Pro 6 com suas fortalezas e fraquezas.
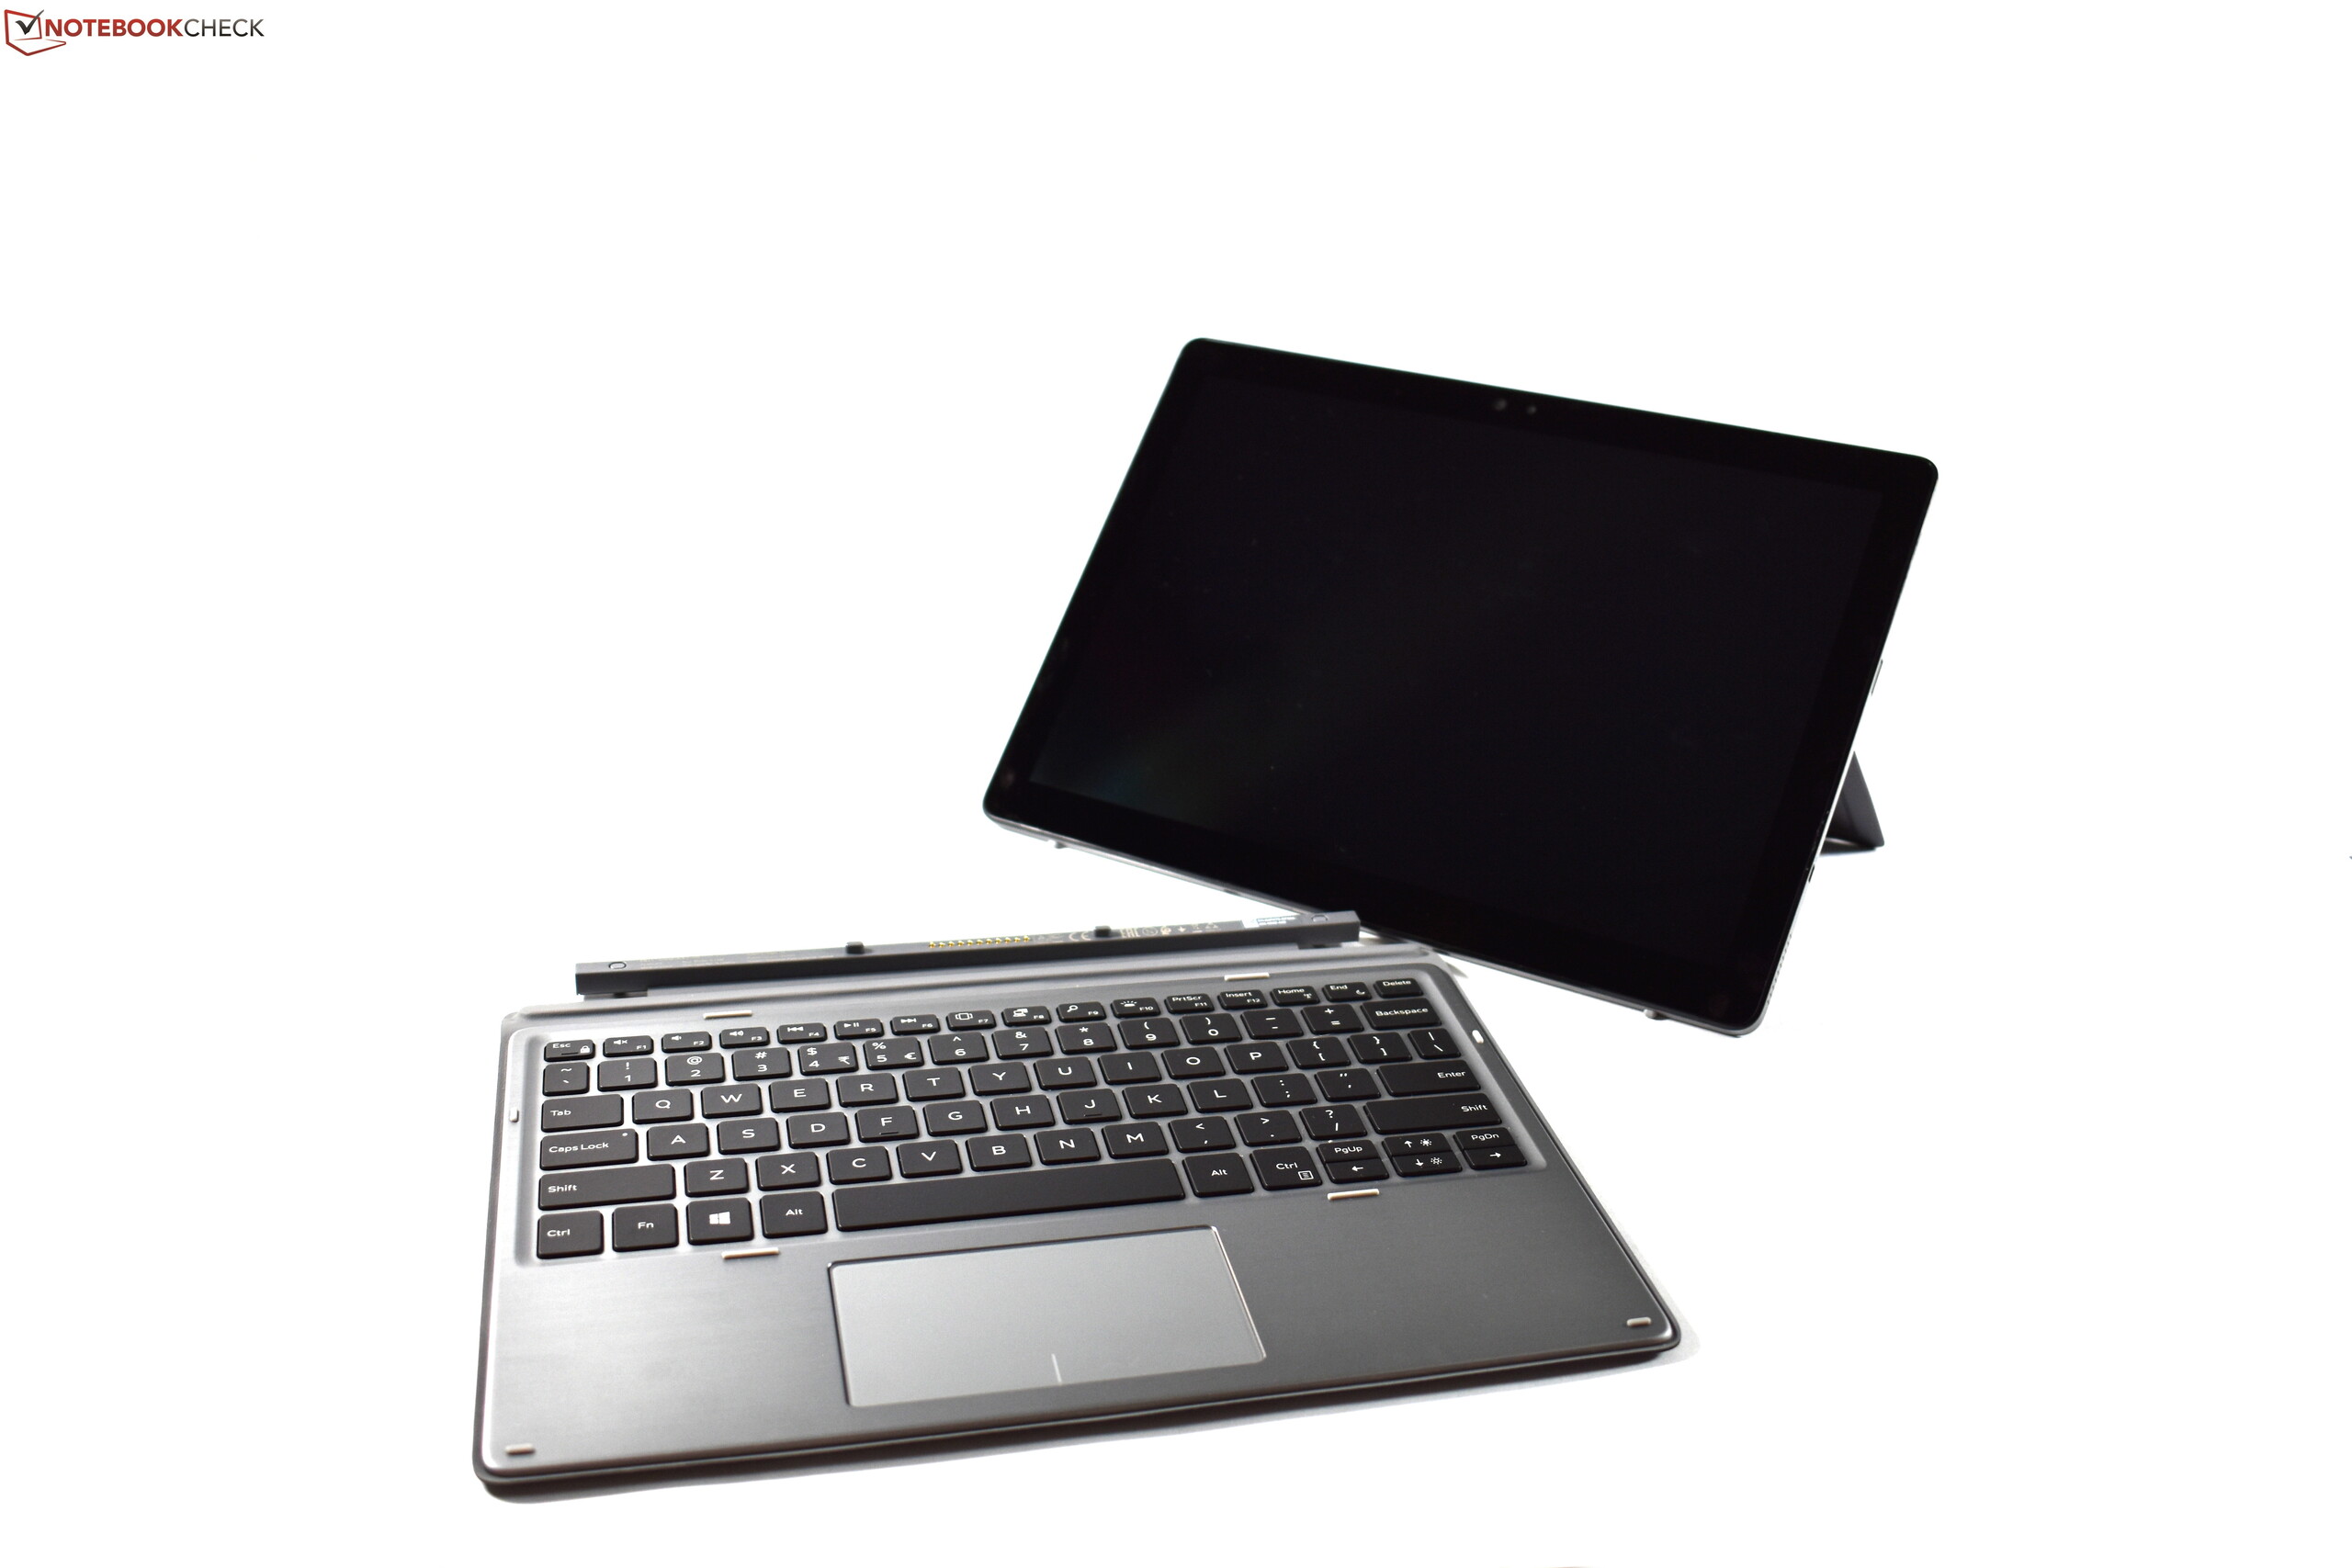
Um dos pontos fortes dessa categoria de dispositivo é definitivamente a tela, que também no caso do 2-em1 Dell Latitude 7200 possui o confortável formato 3:2 e uma alta cobertura de espaço de cores. A desvantagem, no entanto, é a superfície brilhante e o brilho mais baixo em comparação com os concorrentes, mesmo que o computador Dell certamente não tenha um desempenho tão ruim aqui. Um ponto fraco, no entanto, é o teclado. A falta de estabilidade da tampa do teclado tem um efeito muito negativo na experiência de digitação. Esses dois pontos representam a separação mais óbvia de portáteis "de verdade", como o Dell Latitude 7300.
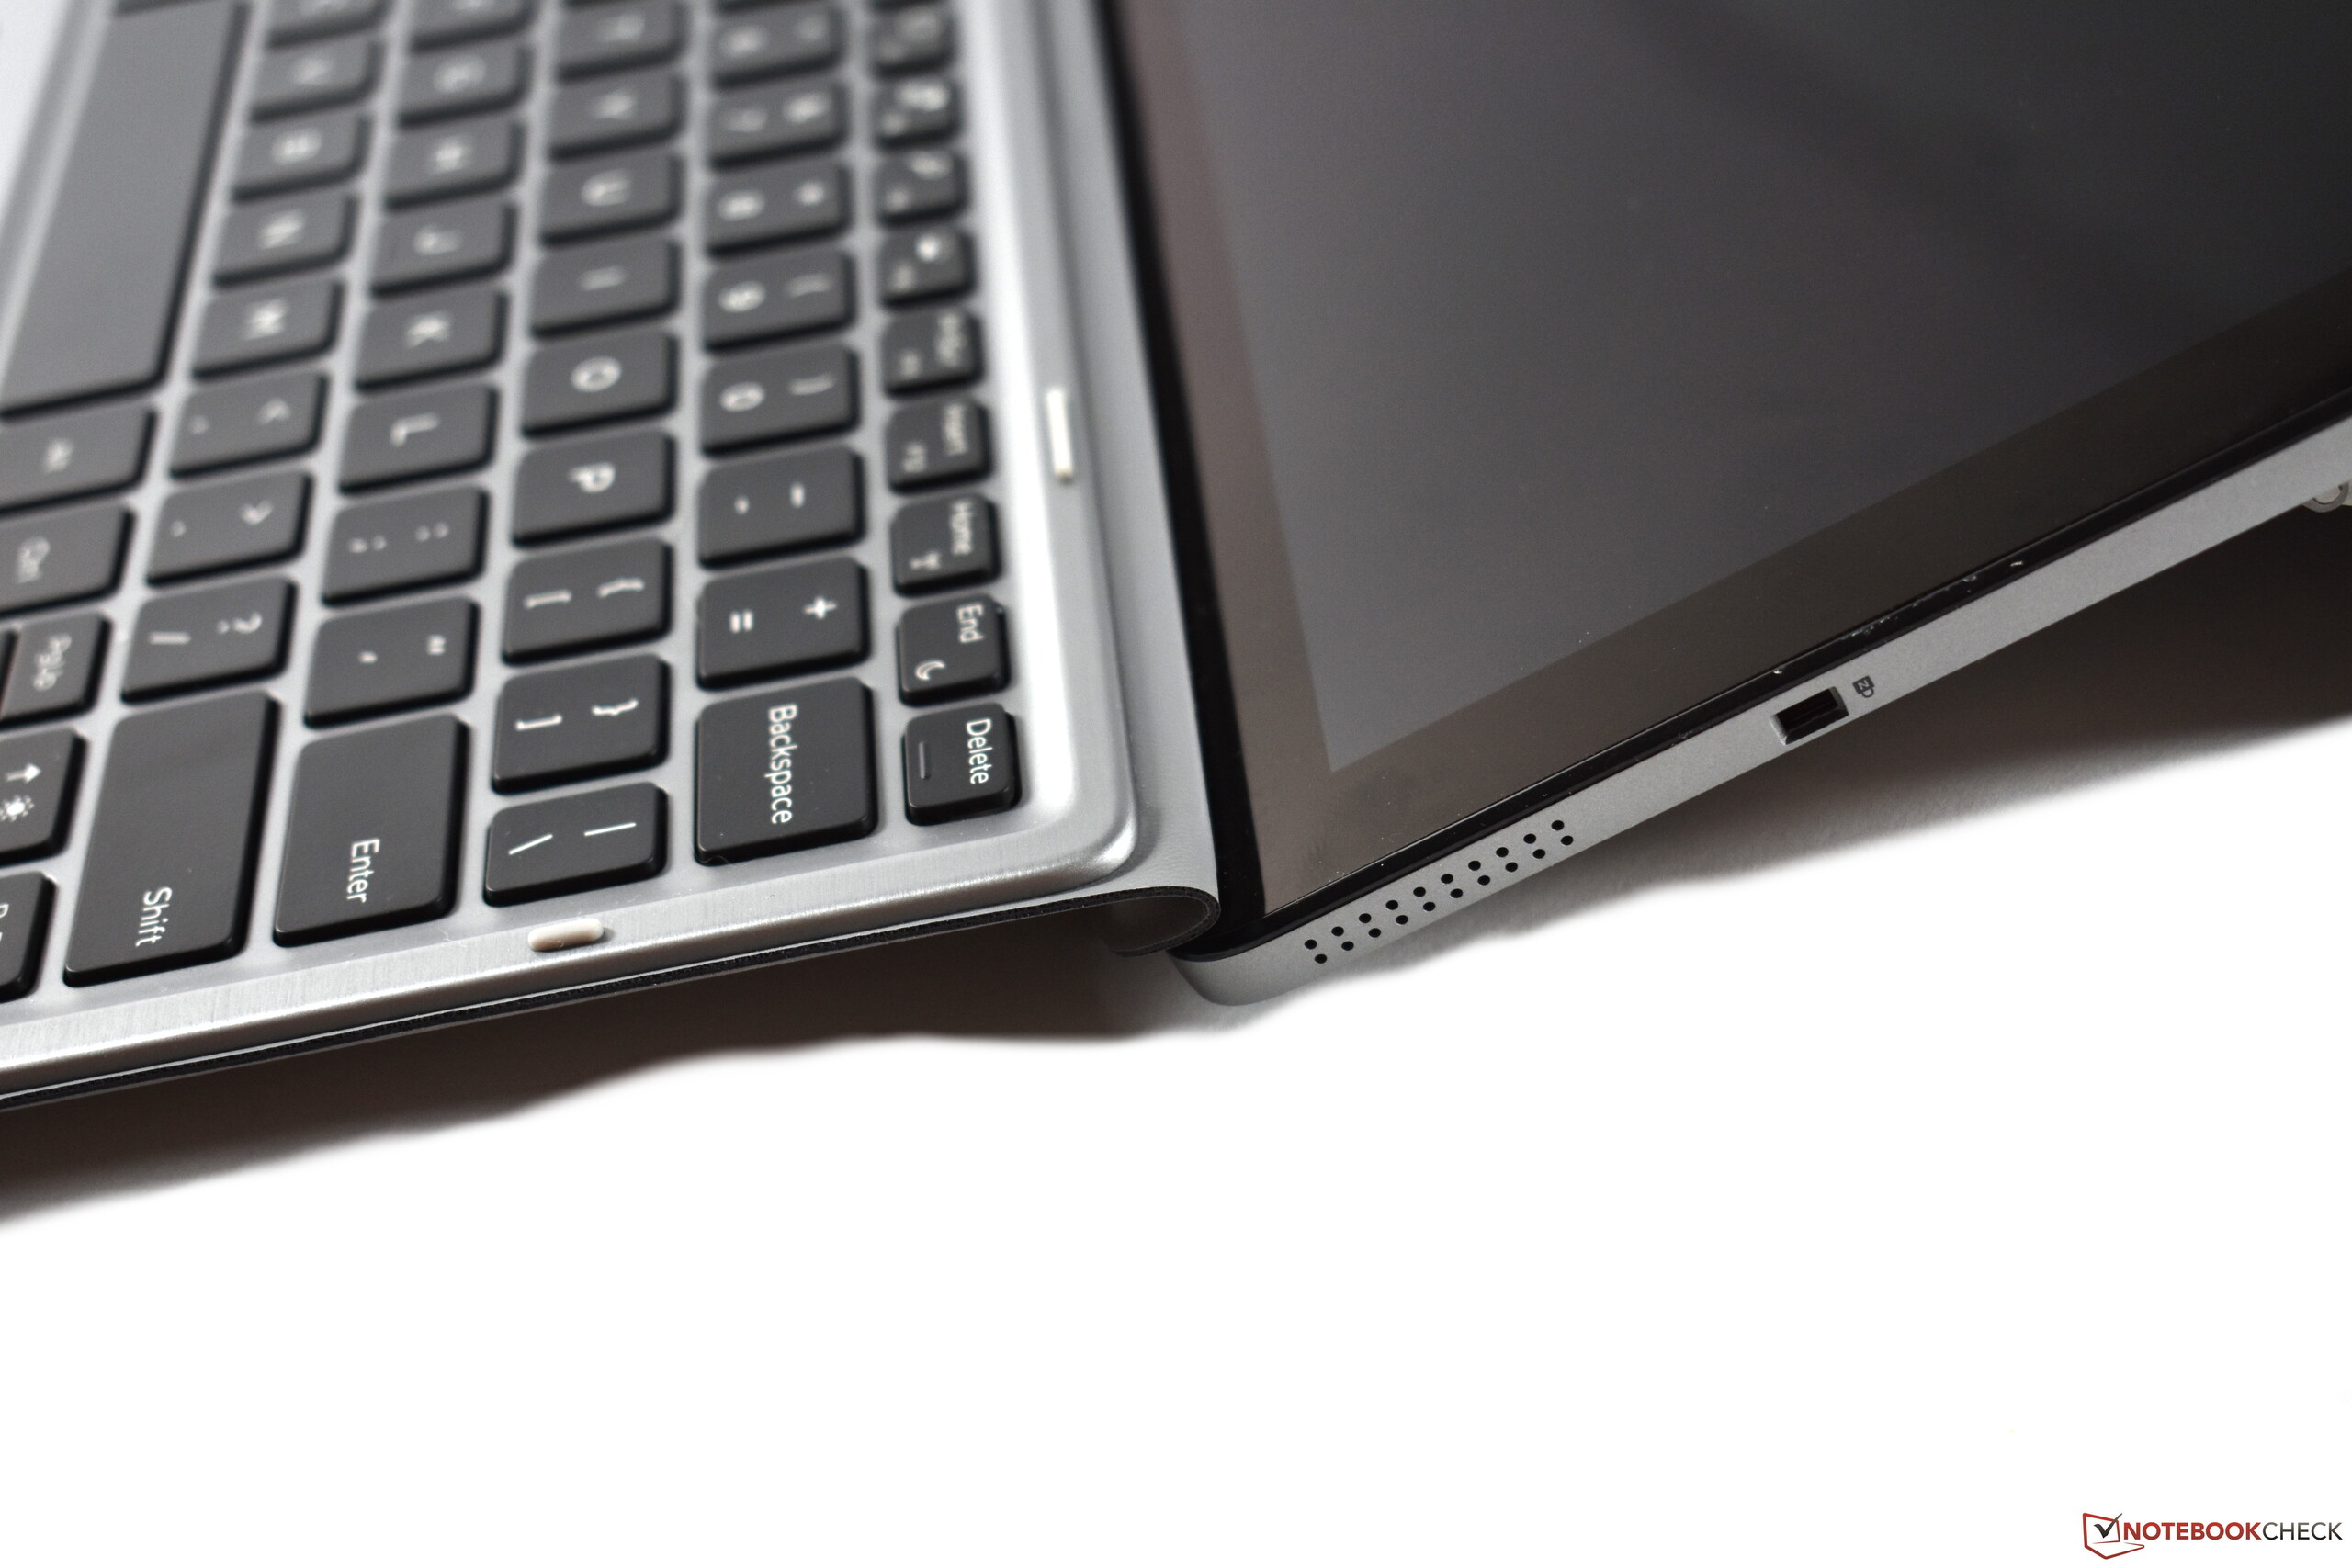
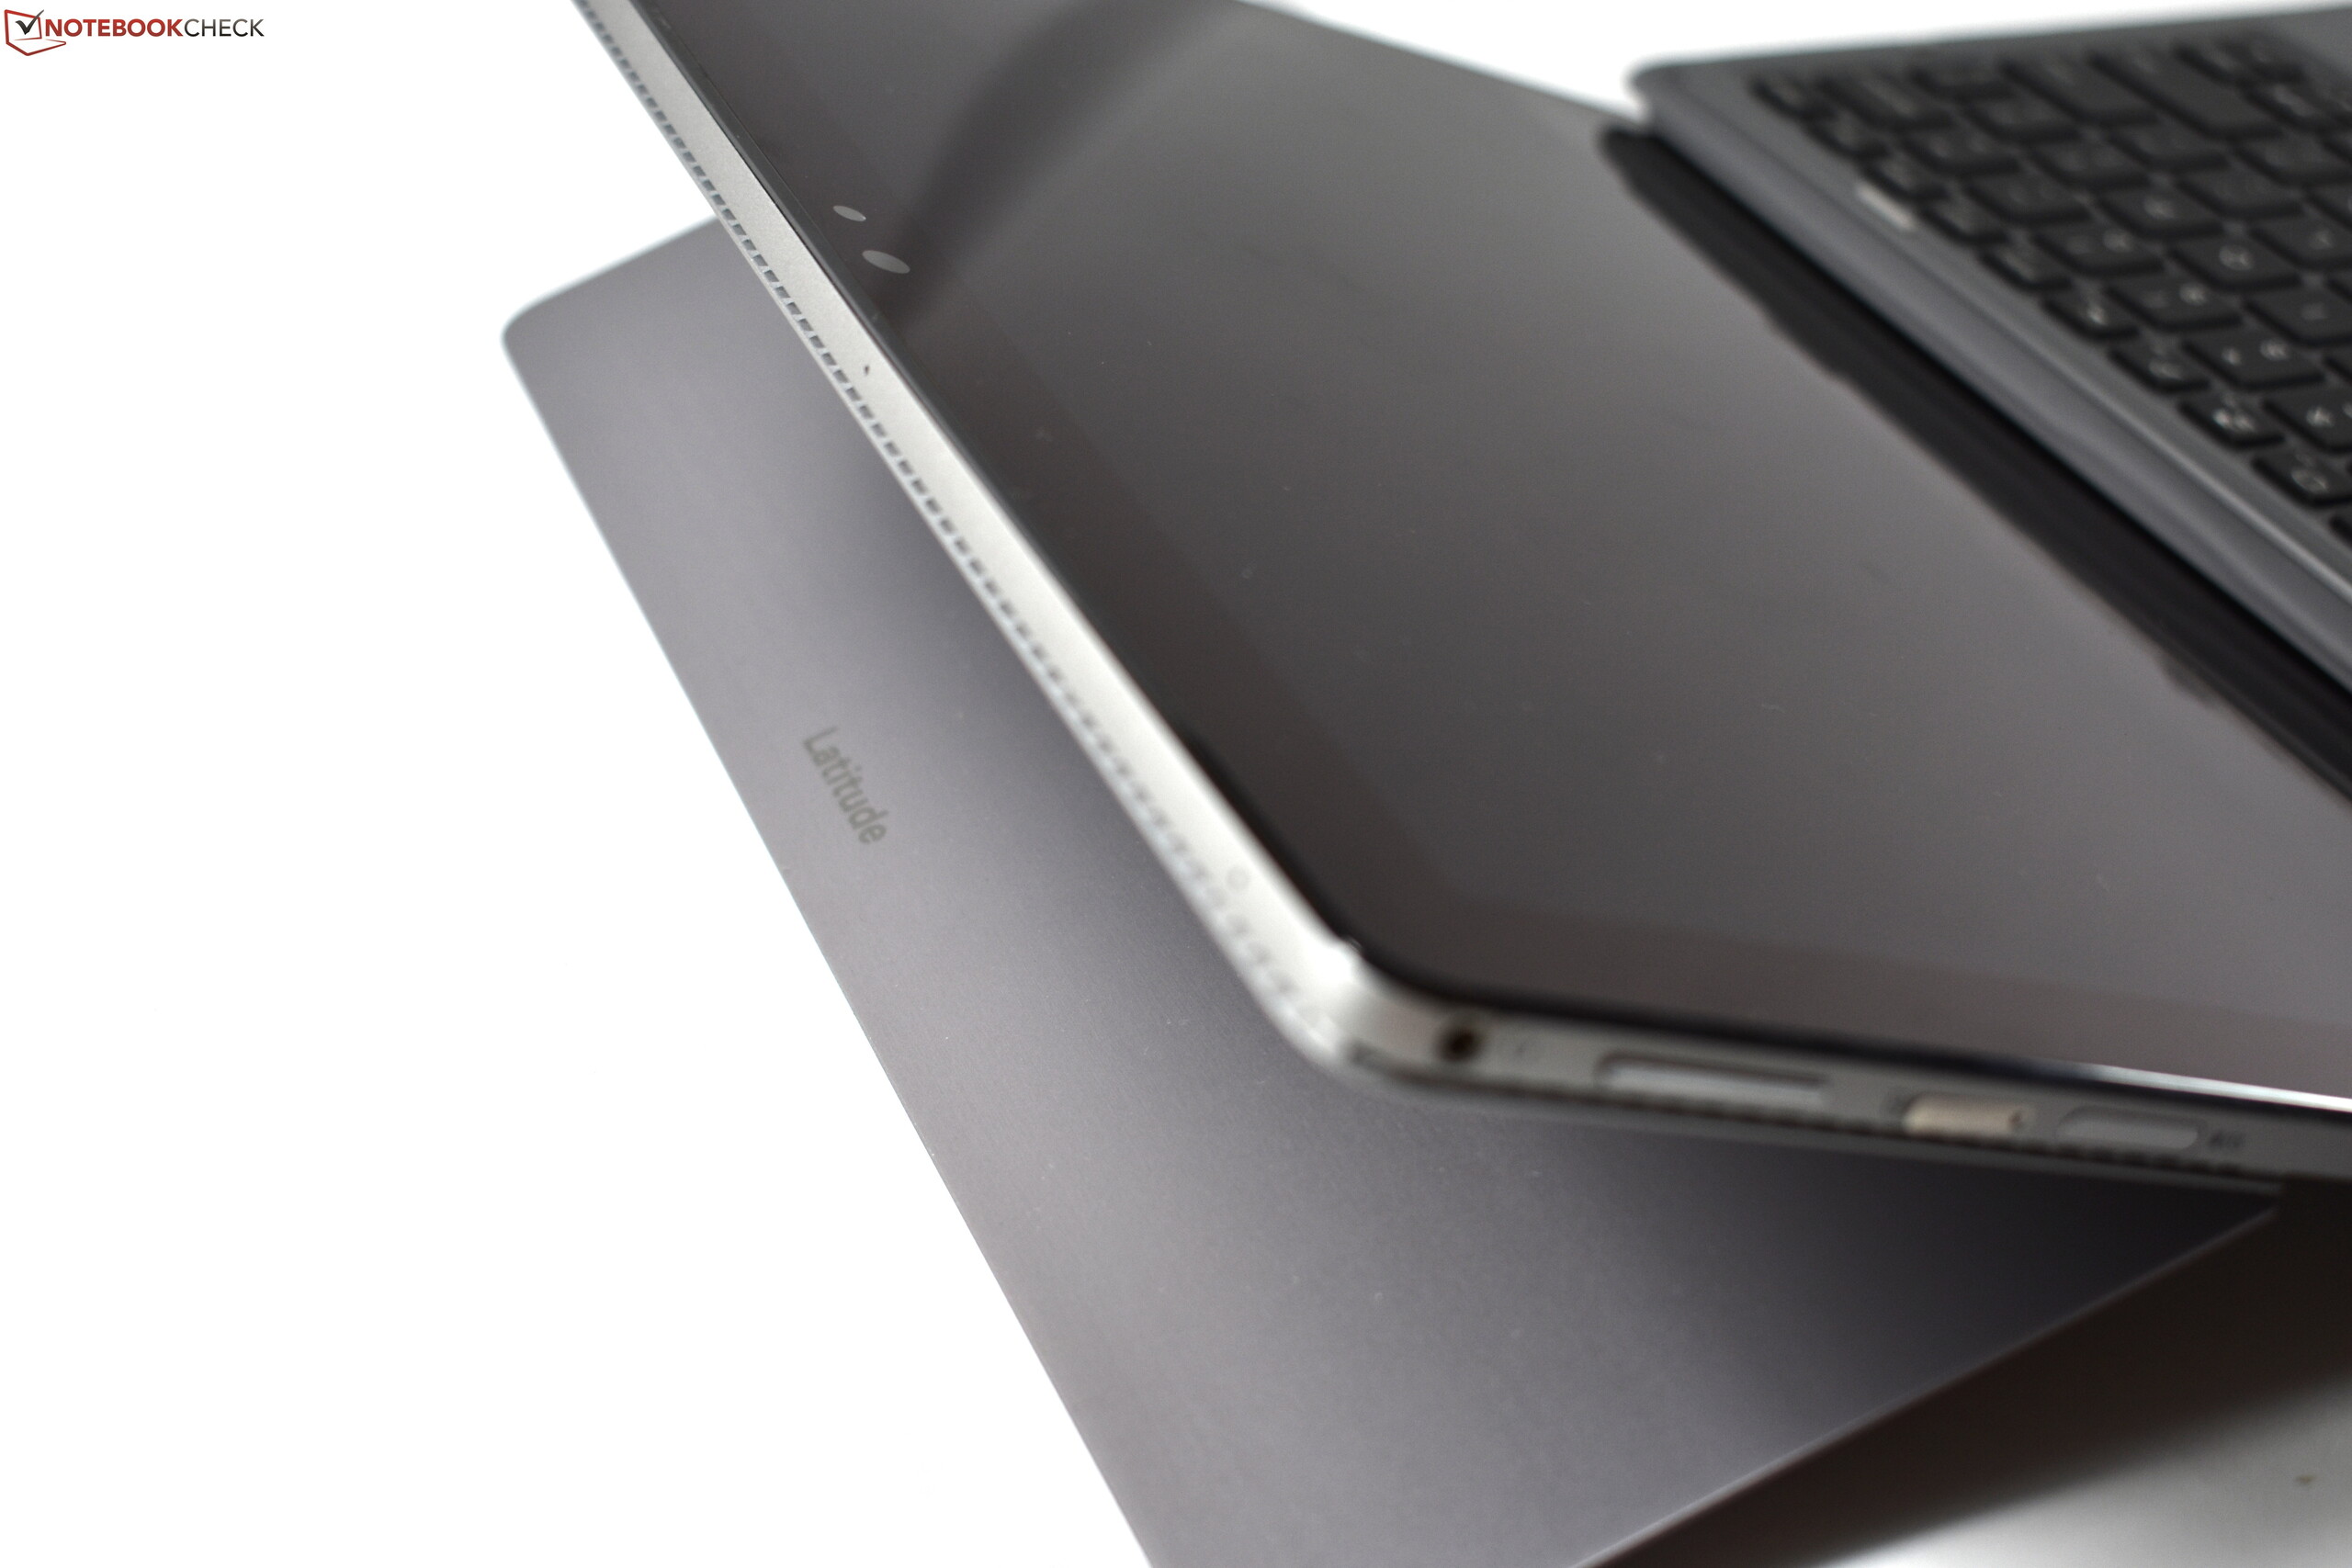
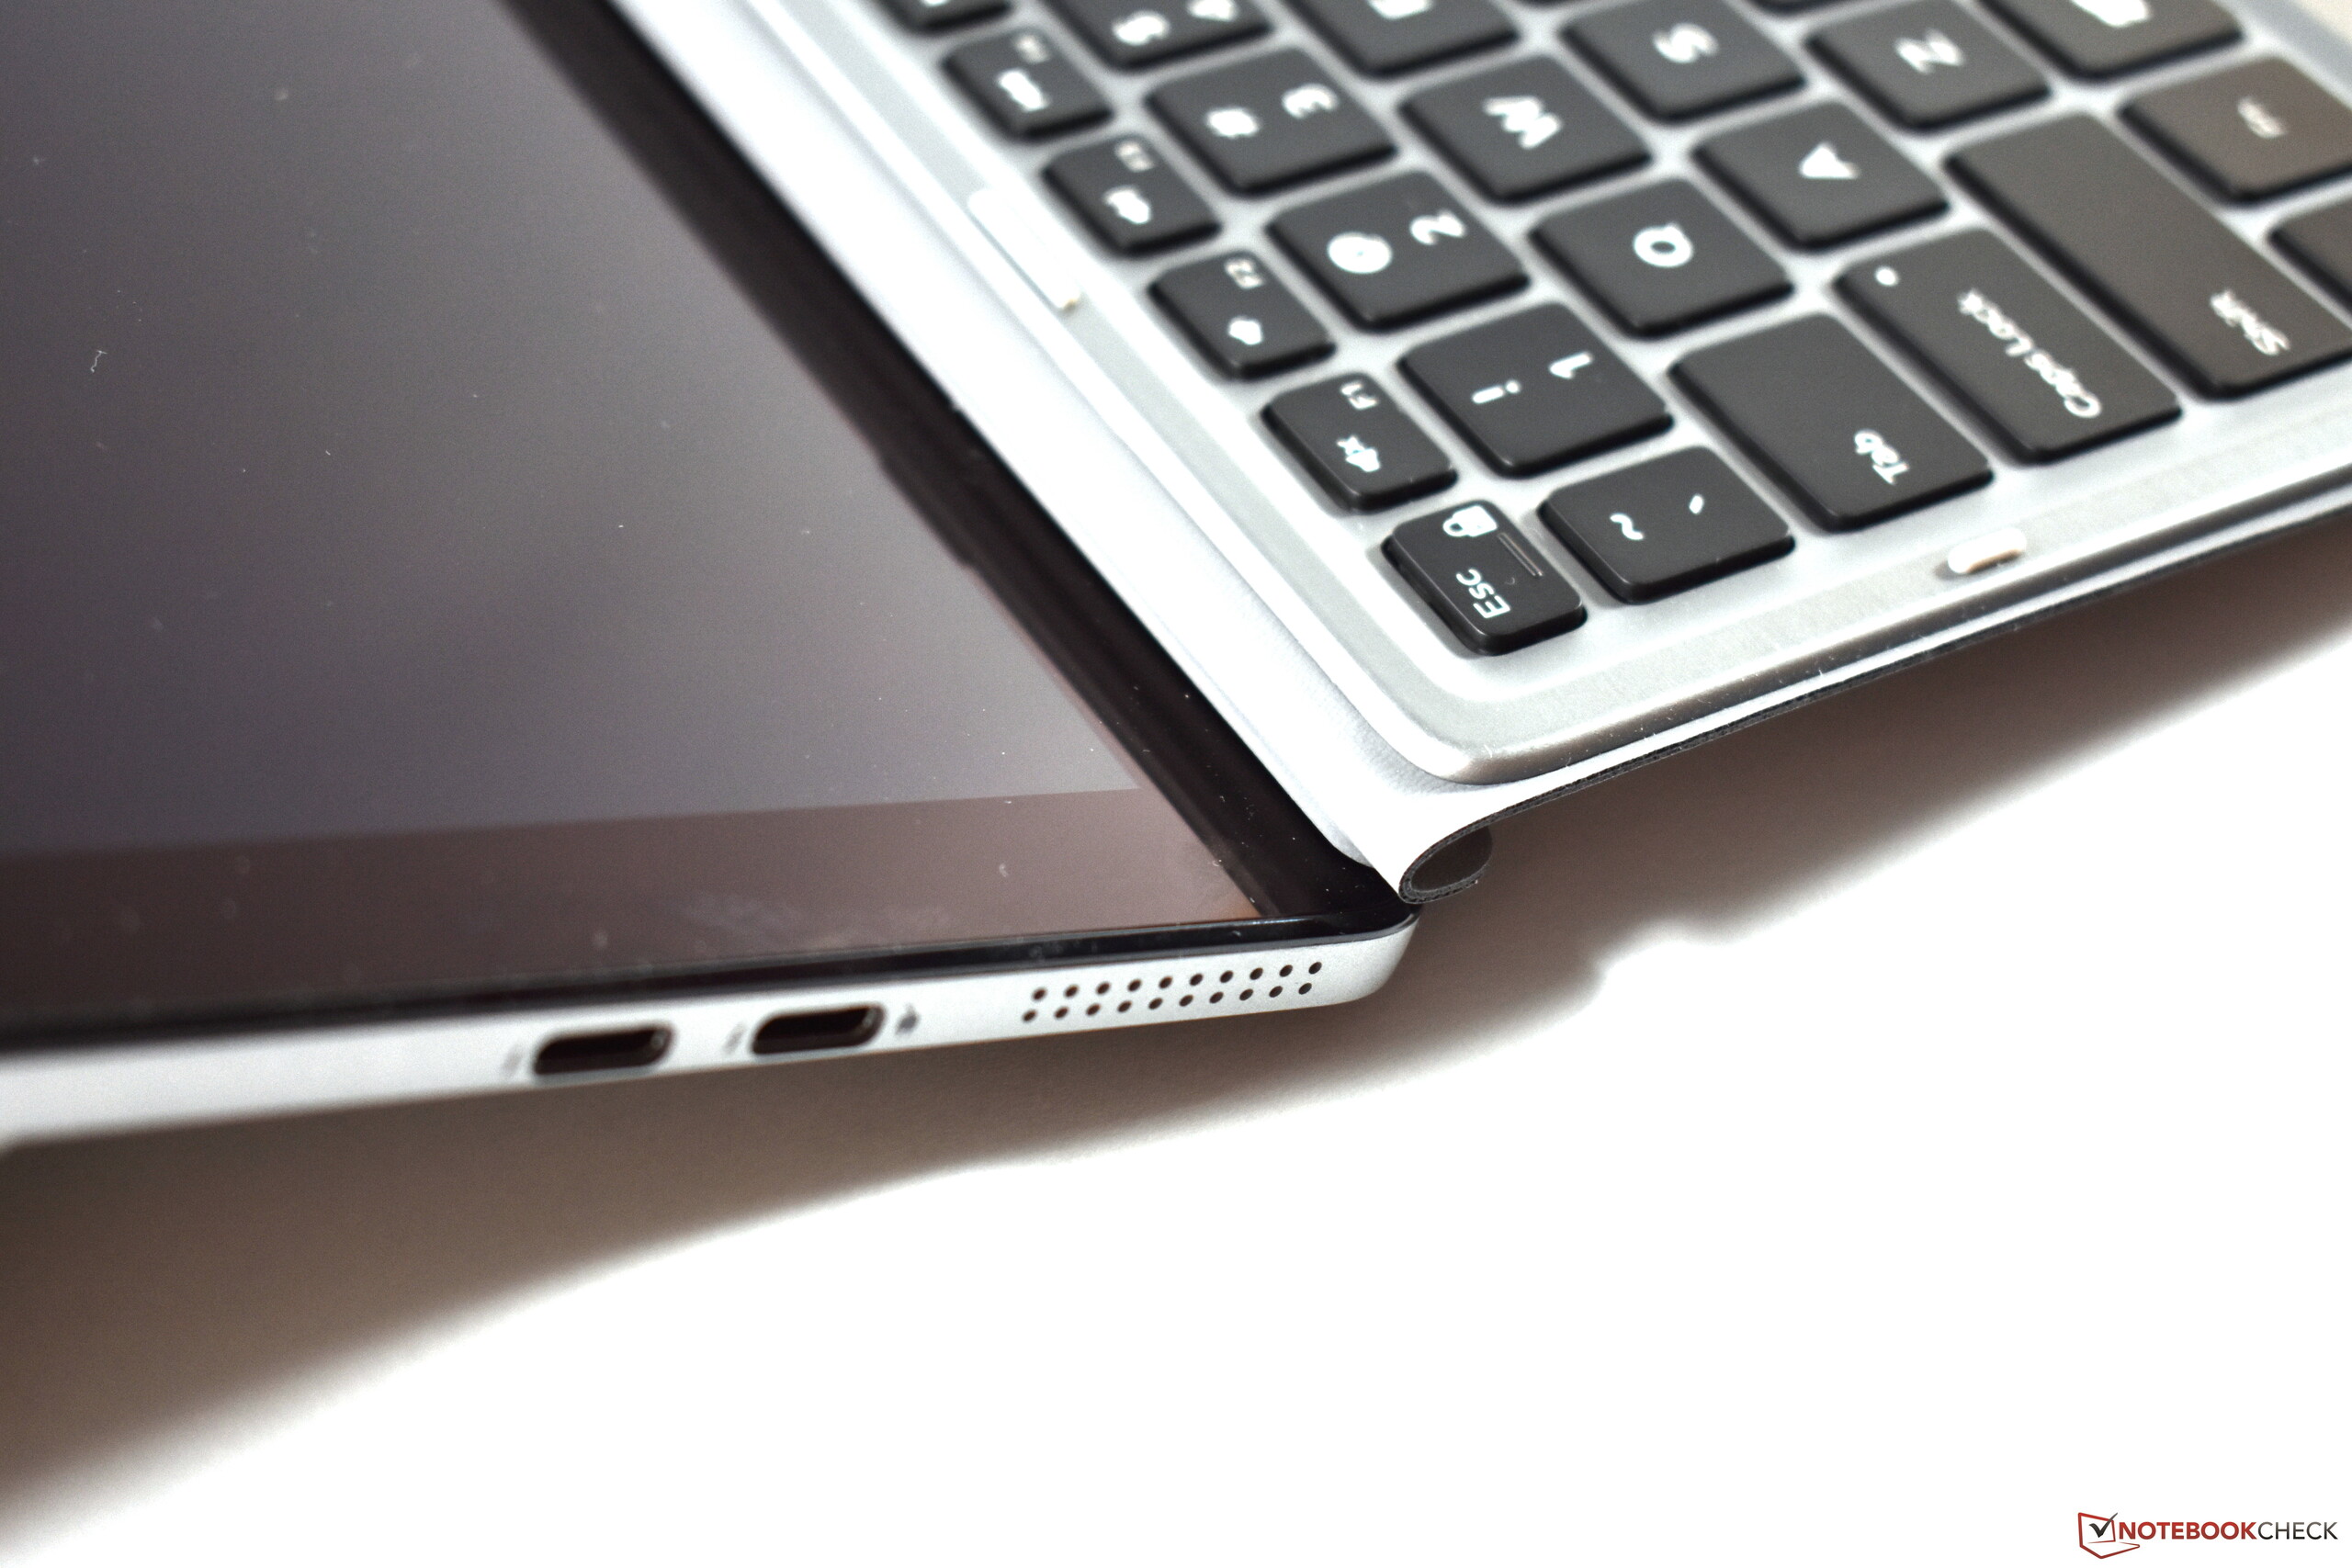
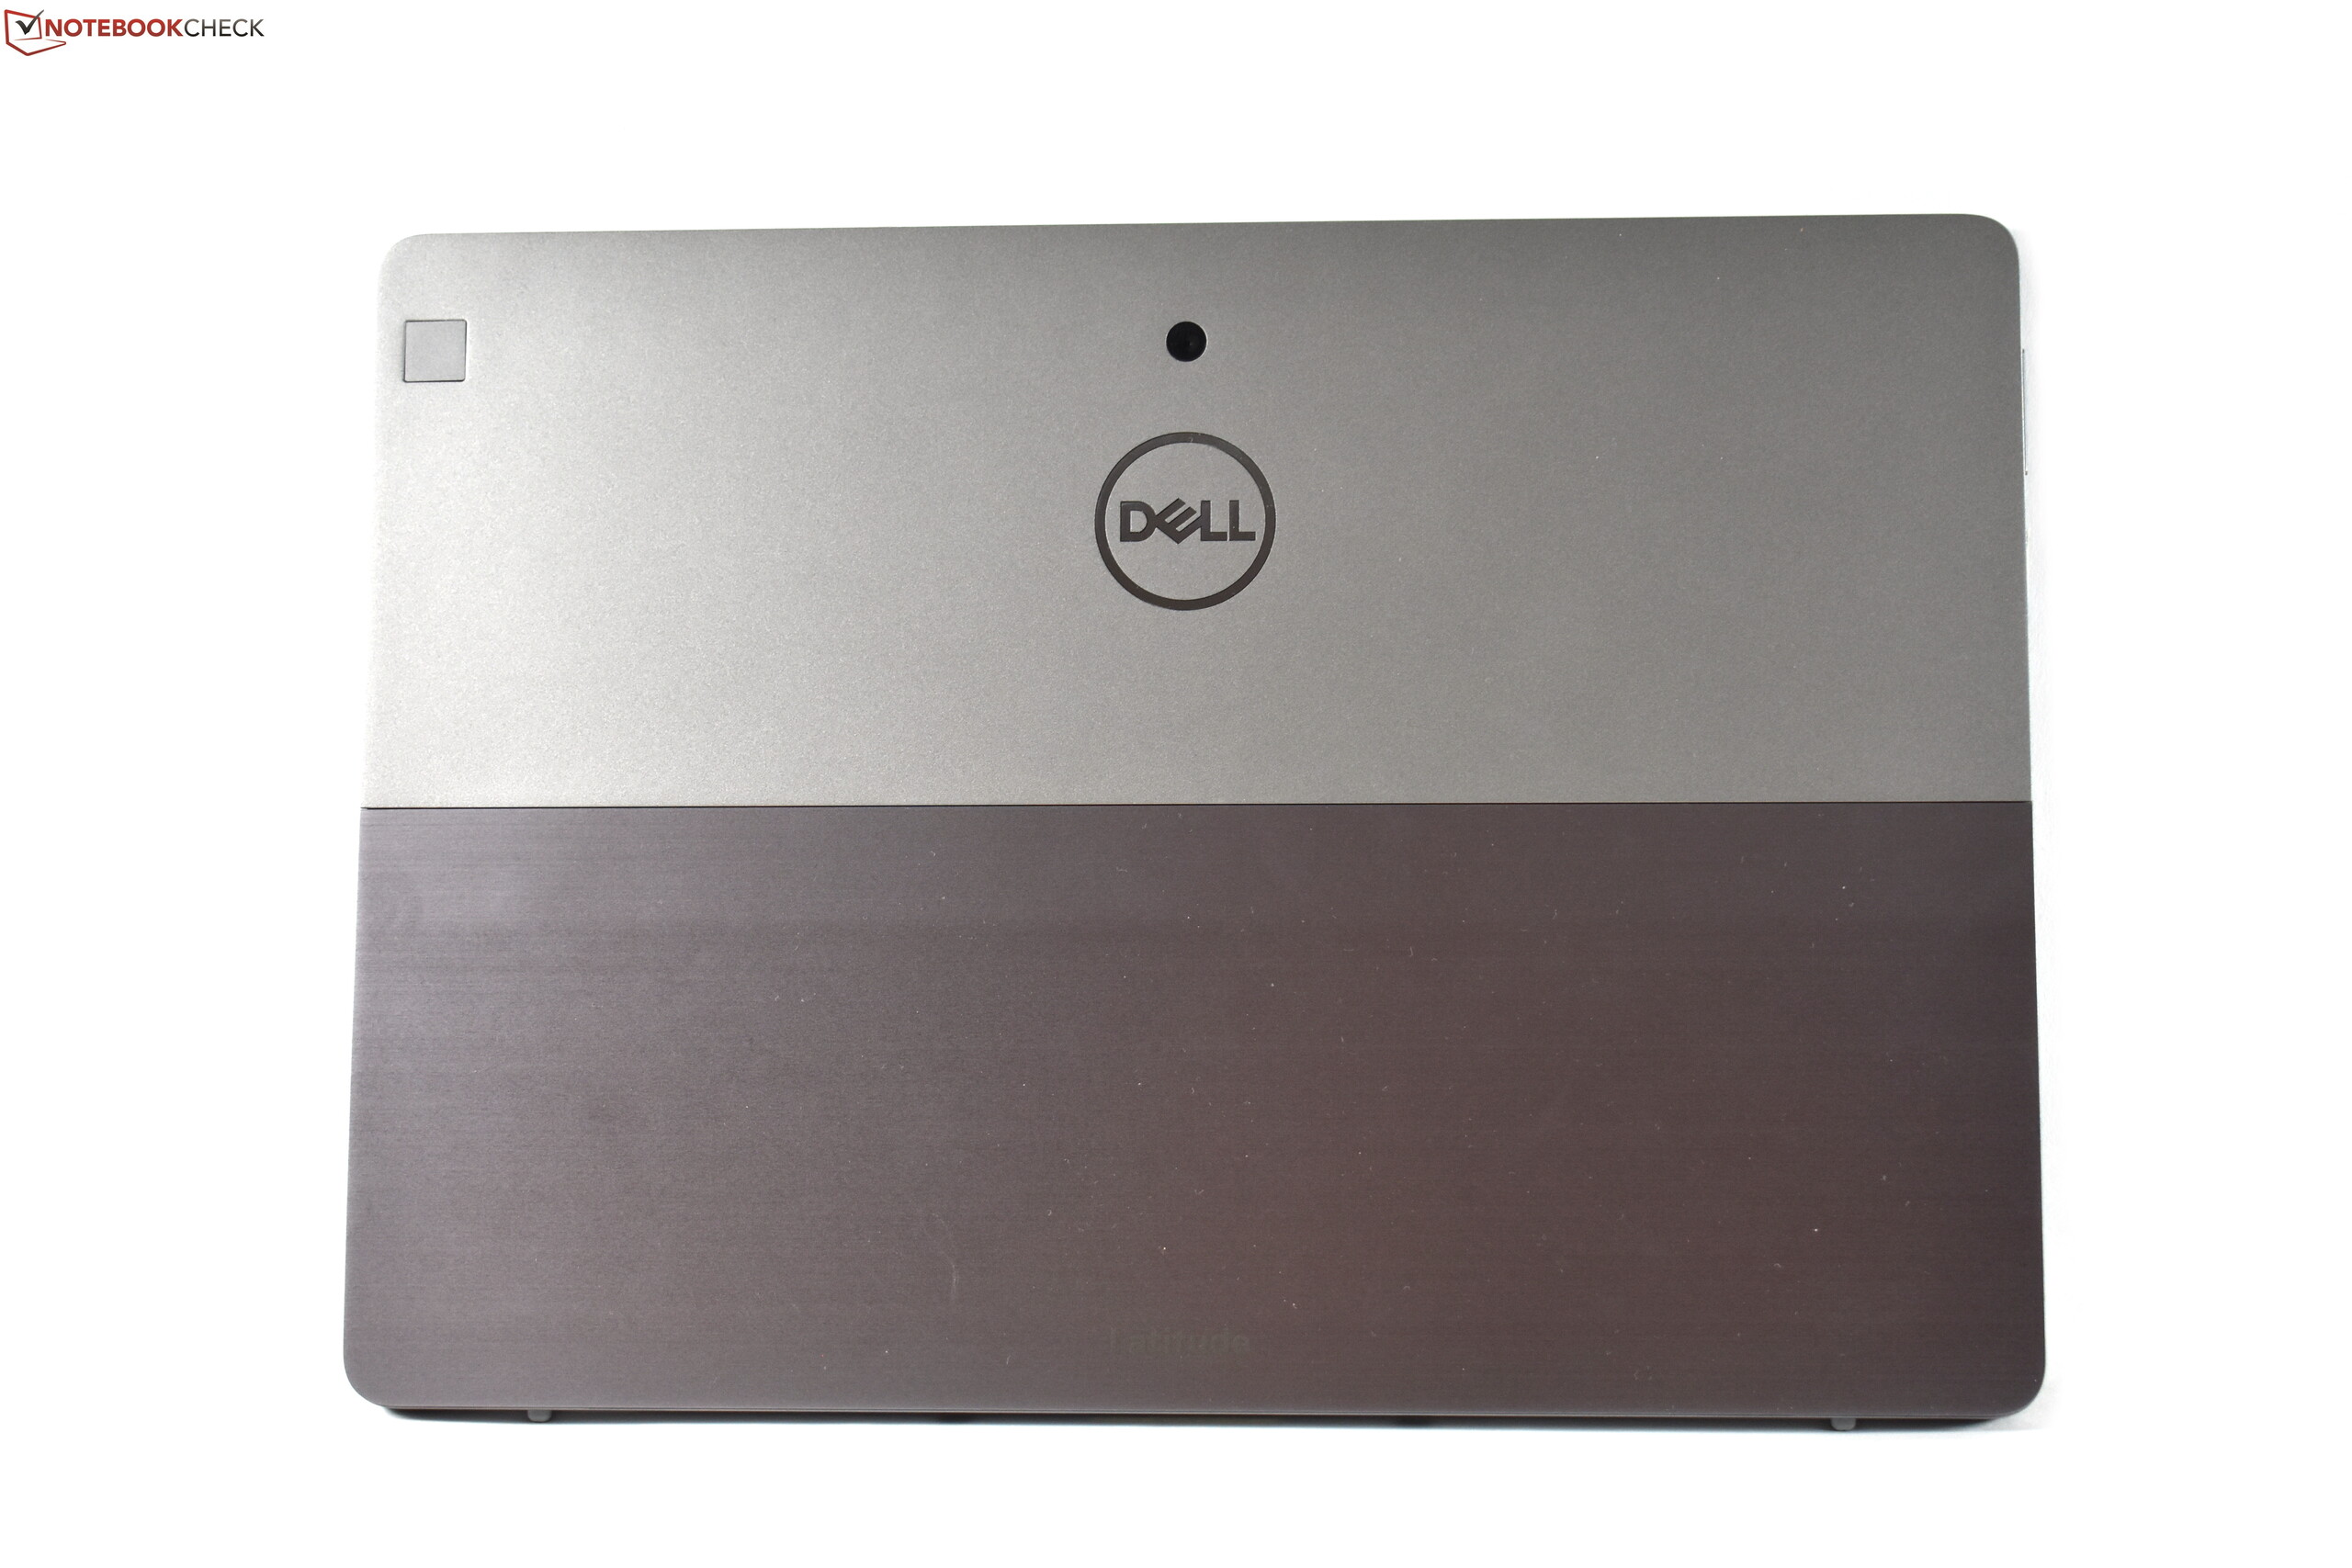
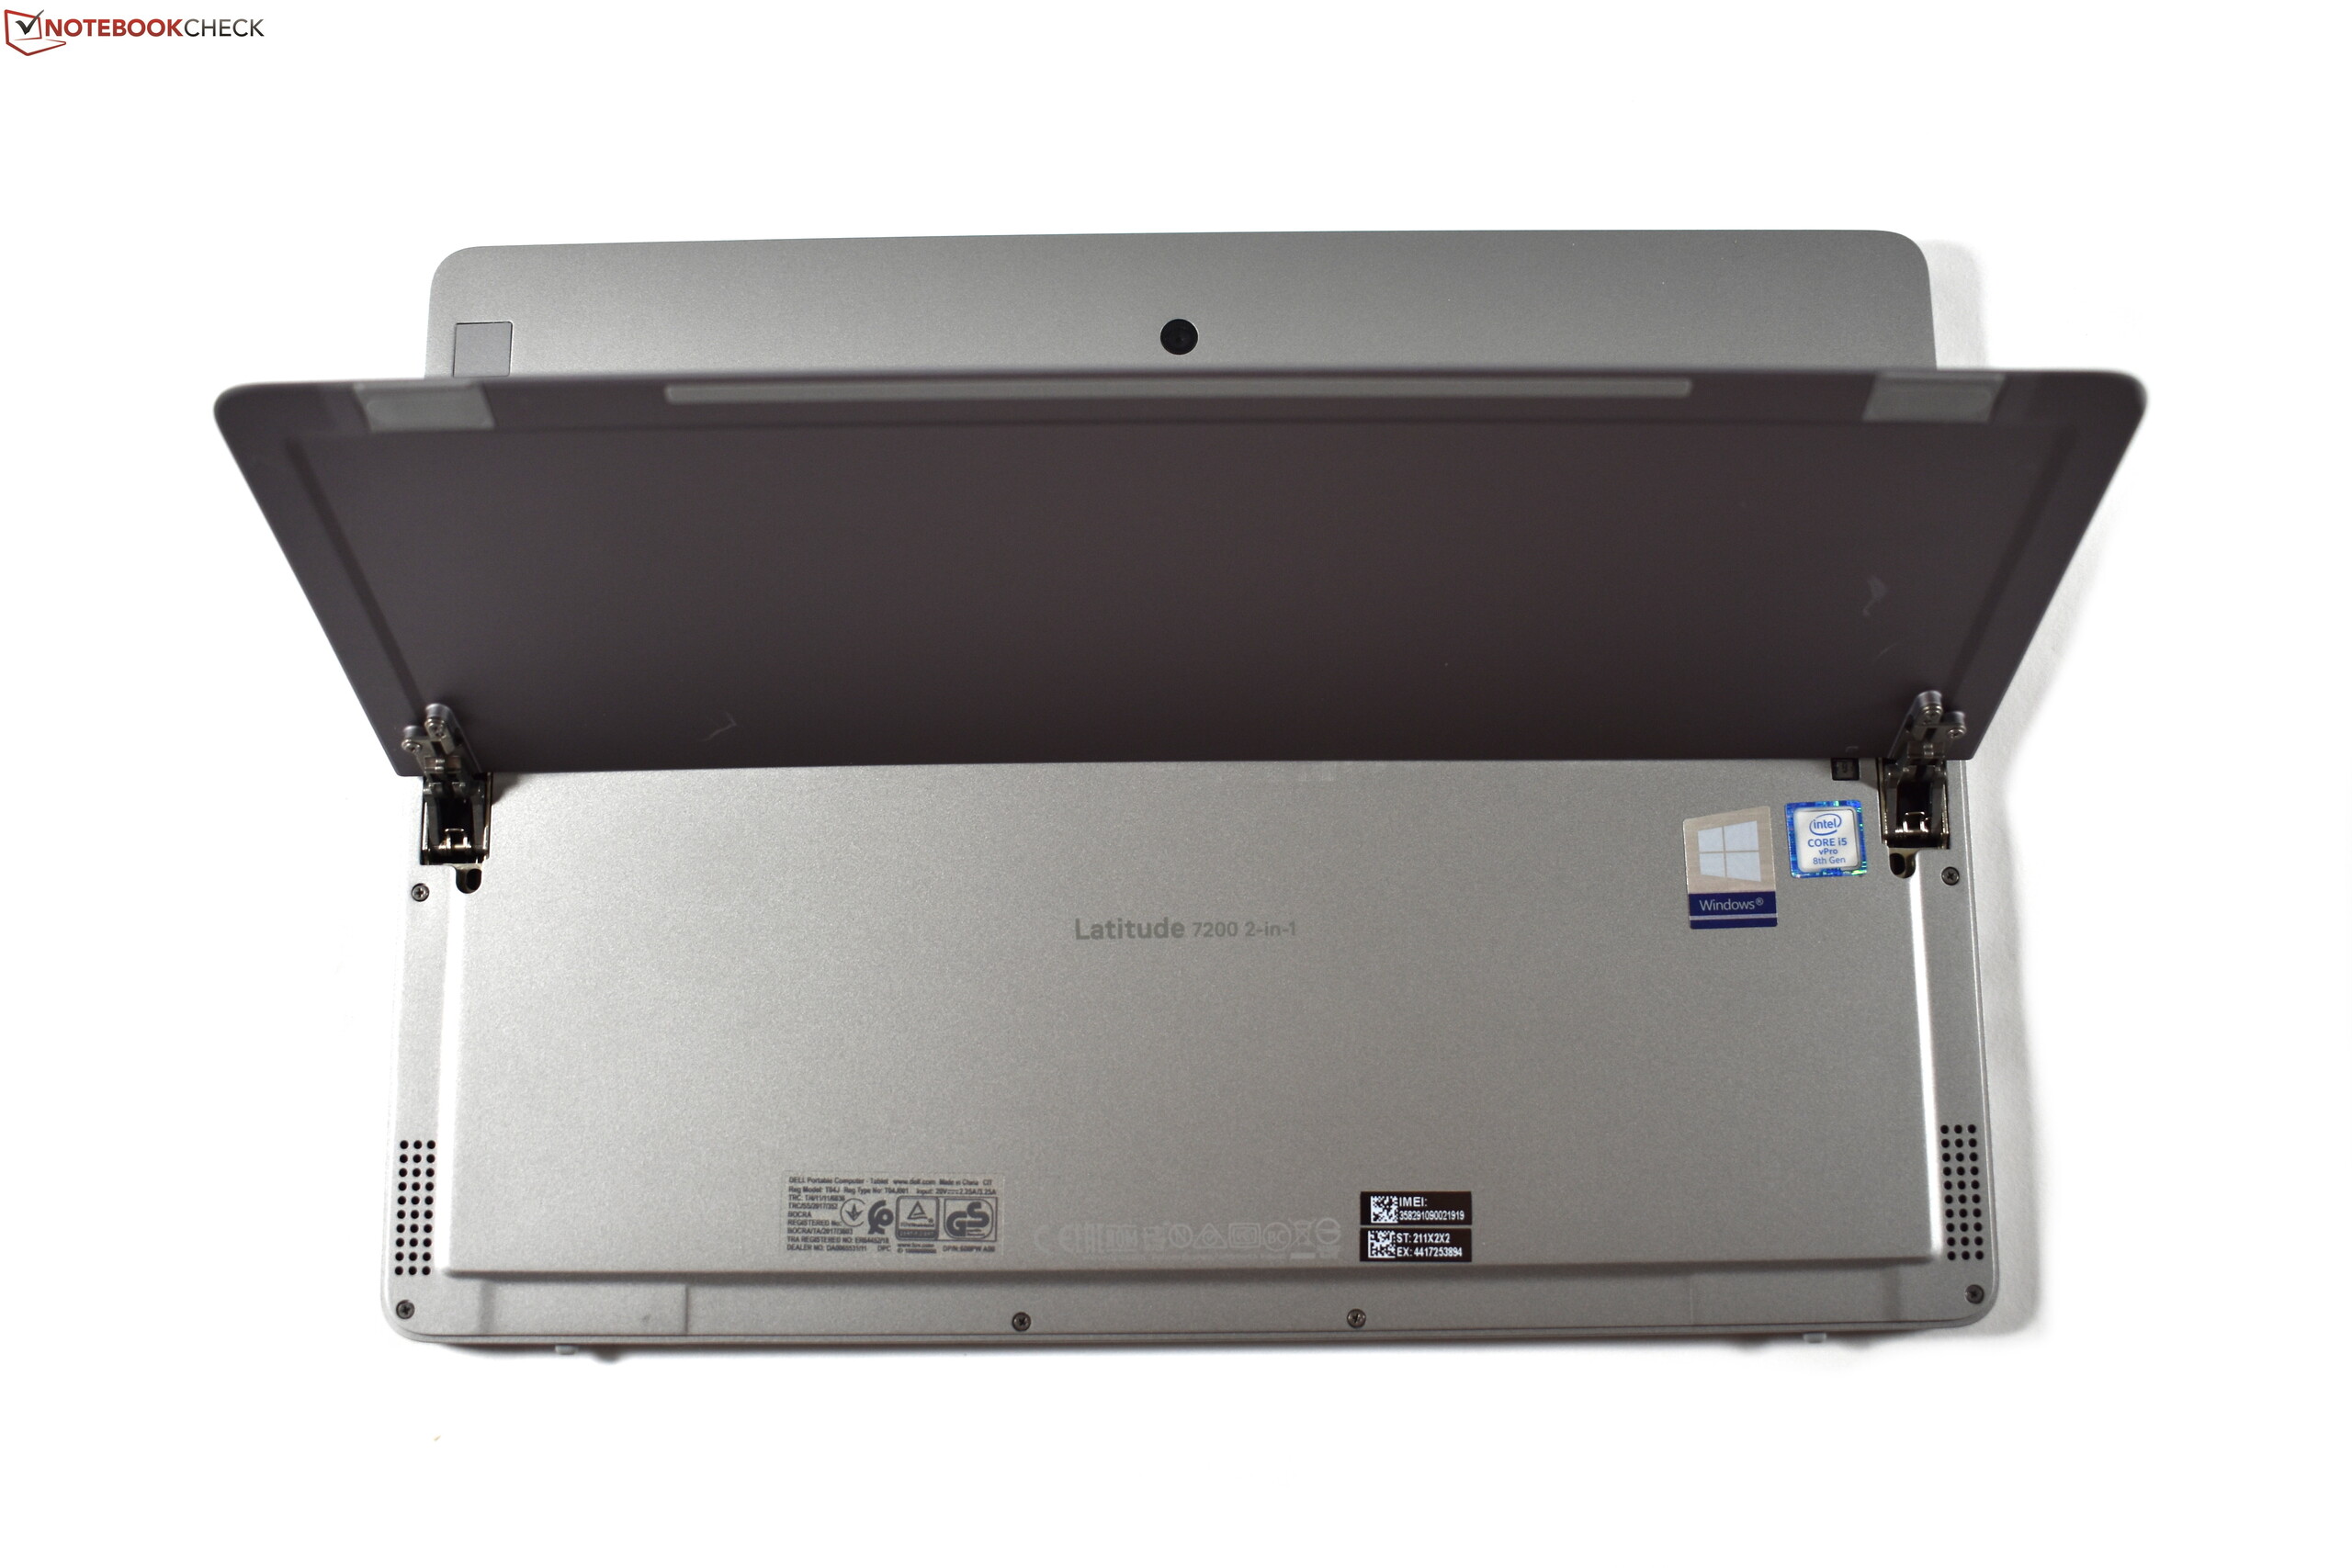
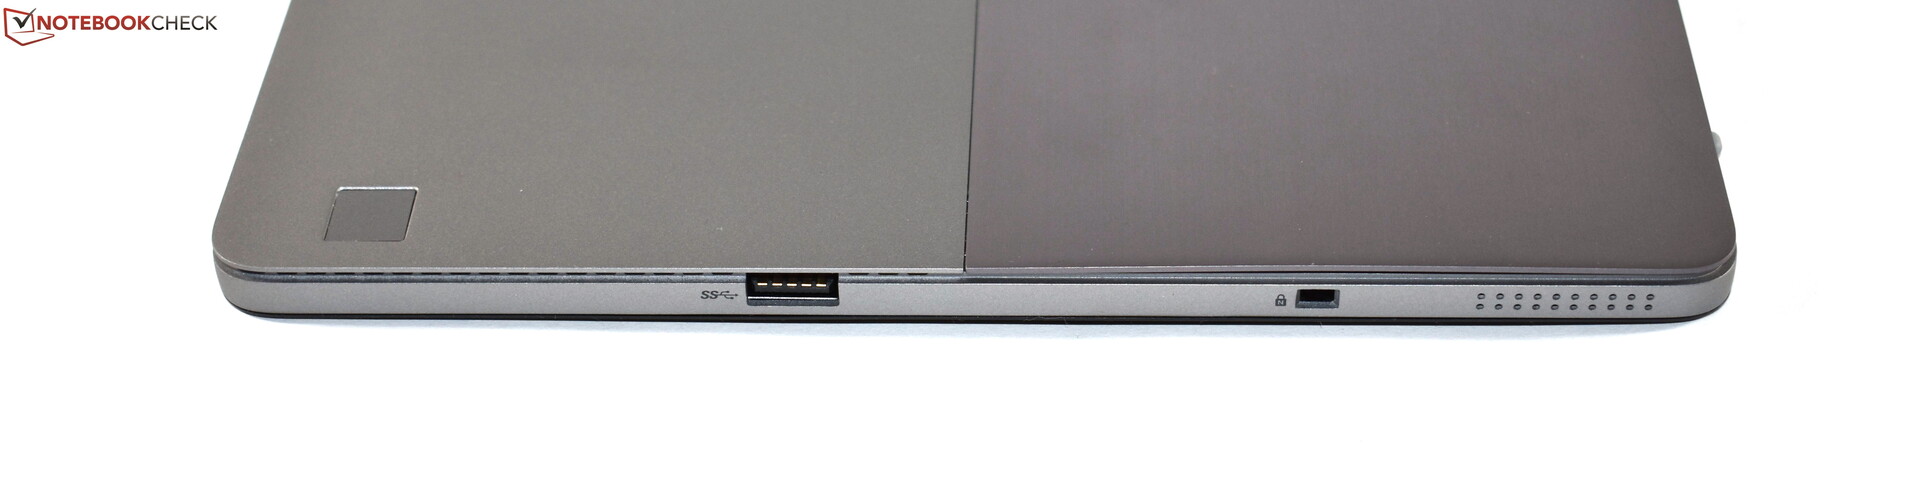
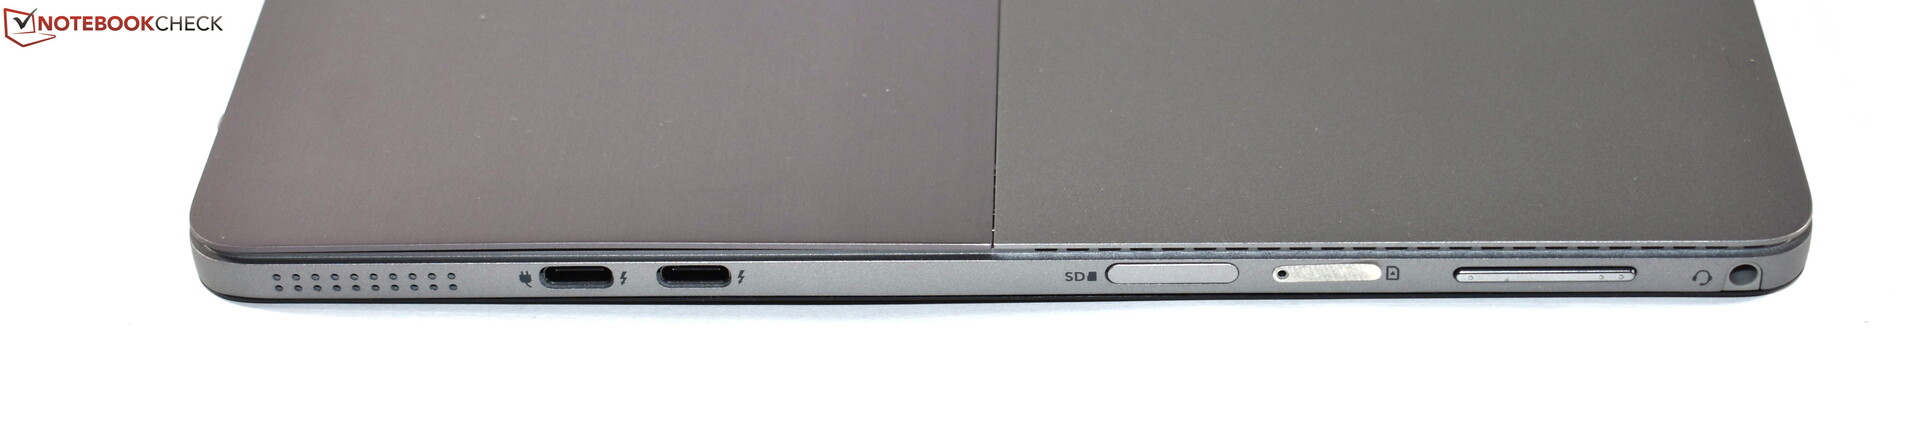
Na classe de tablets conversíveis, o Dell Latitude 7200 2-em-1 impressiona com sua boa conectividade e boa capacidade de manutenção. Também classificamos como positiva a operação quase silenciosa, a carcaça de alta qualidade, o touchpad confortável e a ampla garantia do Dell Latitude 7200 2-em-1. O rápido leitor de cartões microSD e a WWAN embutida também são vantagens. Negativo, a nosso ver, é o desempenho da CPU, pior que o do Microsoft Surface Pro 6, por exemplo.
A Dell não comete erros aqui, e é por isso que podemos dizer em sã consciência: O Dell Latitude 7200 2-em-1 é recomendado.
Em conclusão, podemos recomendar o Dell Latitude 7200 2-em-1 como um tablet empresarial muito bom. Como comprador, é claro, você deve estar ciente de suas prioridades. Se você colocar uma ênfase maior na tela, um tablet poderá ser uma solução melhor. Se for o teclado, você provavelmente se sairia melhor com um portátil normal como o Dell Latitude 7300.
Dell Latitude 7200
- 09/26/2019 v7 (old)
Benjamin Herzig