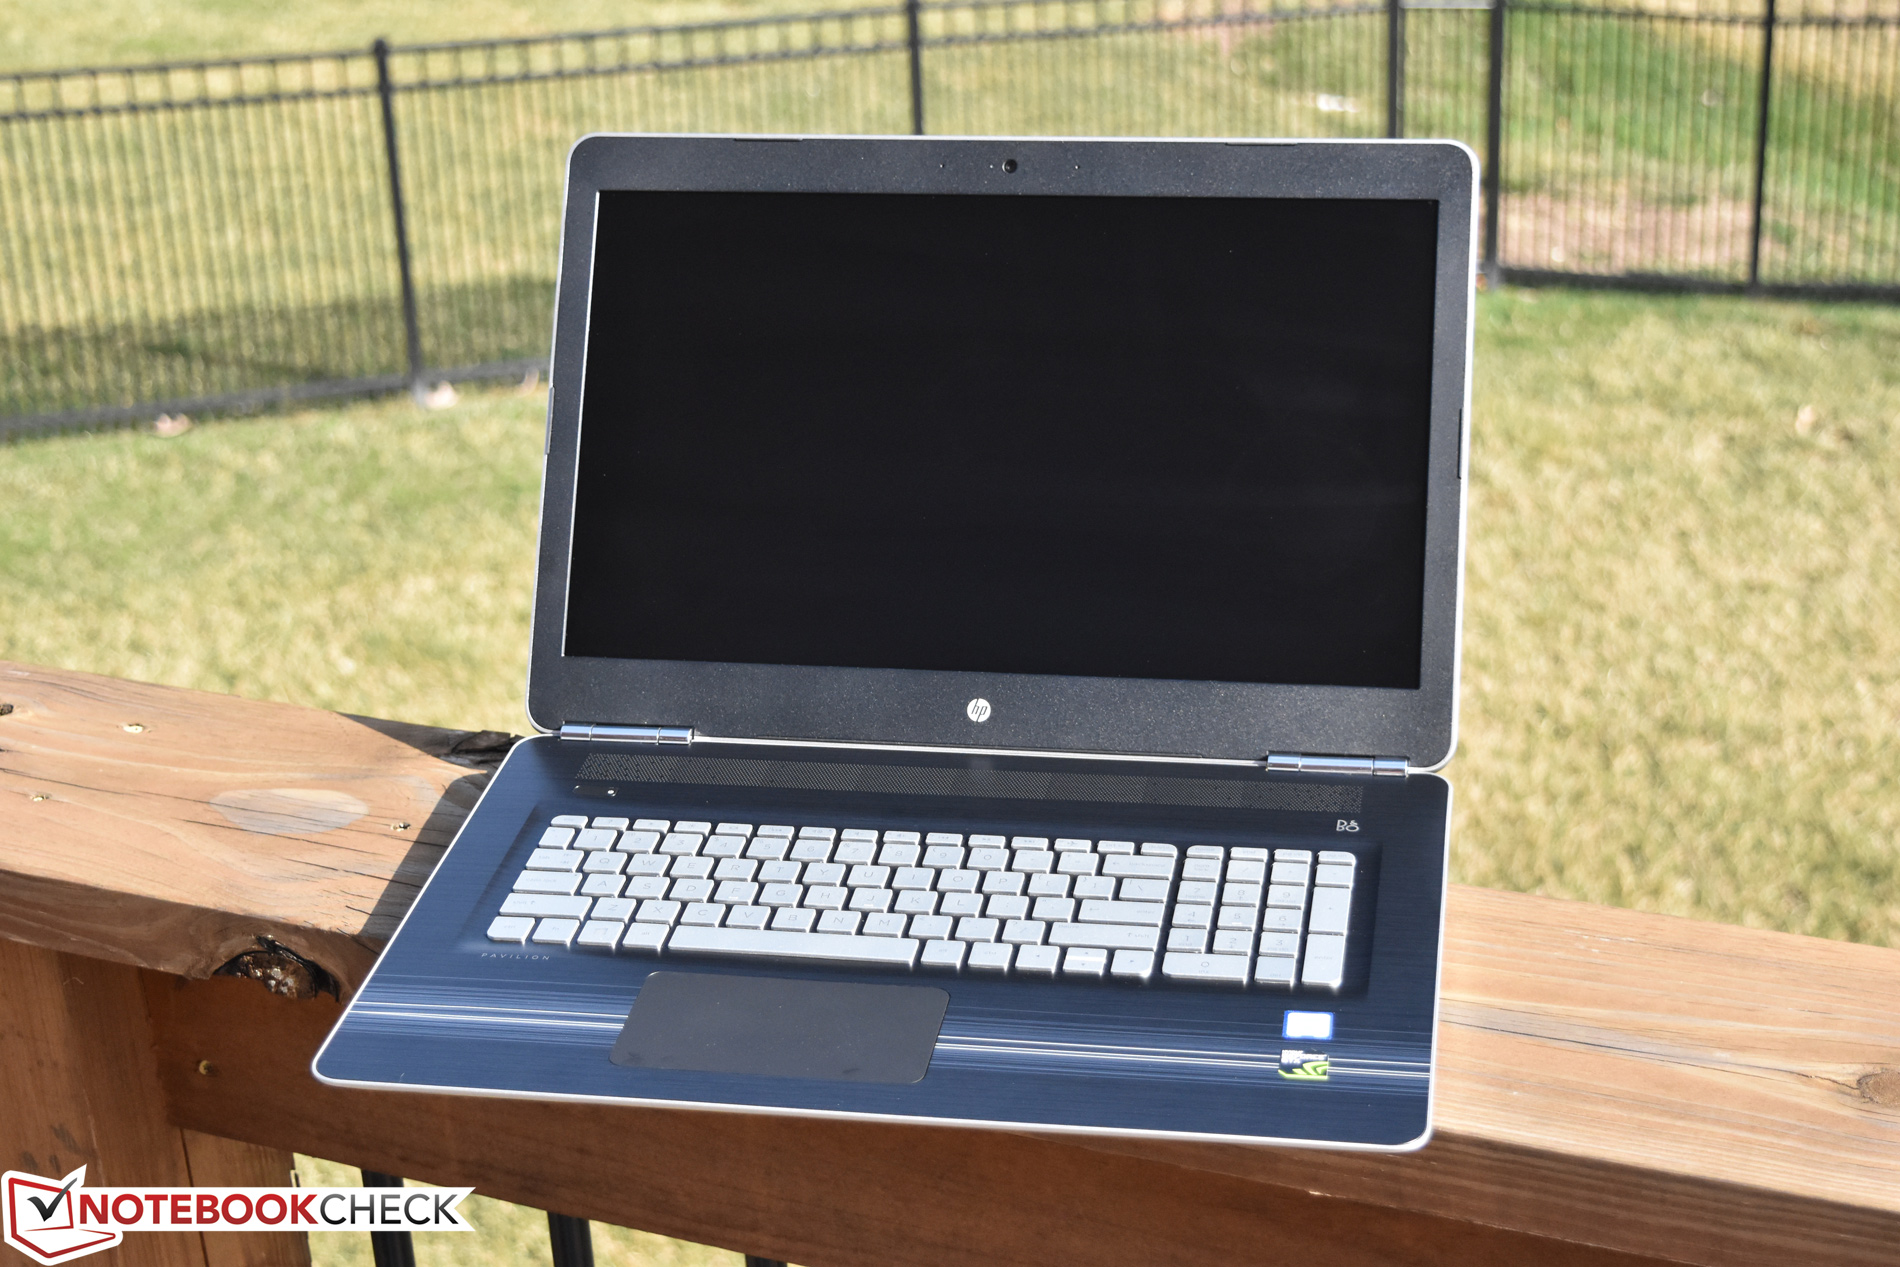
Breve Análise do HP Pavilion 17t (7700HQ, UHD, GTX 1050)
| |||||||||||||||||||||||||
iluminação: 90 %
iluminação com acumulador: 325.7 cd/m²
Contraste: 880:1 (Preto: 0.37 cd/m²)
ΔE ColorChecker Calman: 6.5 | ∀{0.5-29.43 Ø4.71}
ΔE Greyscale Calman: 5.6 | ∀{0.09-98 Ø4.96}
100% sRGB (Argyll 1.6.3 3D)
87% AdobeRGB 1998 (Argyll 1.6.3 3D)
99.4% AdobeRGB 1998 (Argyll 3D)
99.9% sRGB (Argyll 3D)
87.1% Display P3 (Argyll 3D)
Gamma: 2.59
CCT: 5860 K
| HP Pavilion 17t-ab200 UHD AUO119B, IPS, 17.3", 3840x2160 | HP Pavilion 17t-ab200 AUO109D, IPS, 17.3", 1920x1080 | Gigabyte P57X v7 SHP145E, IPS, 17.3", 3840x2160 | MSI GT73VR 6RF IPS, 17.3", 3840x2160 | |
|---|---|---|---|---|
| Display | -24% | 0% | -22% | |
| Display P3 Coverage (%) | 87.1 | 65.2 -25% | 87.8 1% | 63.6 -27% |
| sRGB Coverage (%) | 99.9 | 87.6 -12% | 100 0% | 95.8 -4% |
| AdobeRGB 1998 Coverage (%) | 99.4 | 64.1 -36% | 98.9 -1% | 65.7 -34% |
| Response Times | 22% | -25% | 22% | |
| Response Time Grey 50% / Grey 80% * (ms) | 50.8 | 36.8 28% | 55.6 ? -9% | 33.6 ? 34% |
| Response Time Black / White * (ms) | 33.2 | 28 16% | 46.8 ? -41% | 30 ? 10% |
| PWM Frequency (Hz) | 1000 ? | |||
| Screen | -8% | 10% | -0% | |
| Brightness middle (cd/m²) | 325.7 | 278.8 -14% | 441.3 35% | 334.8 3% |
| Brightness (cd/m²) | 309 | 265 -14% | 408 32% | 316 2% |
| Brightness Distribution (%) | 90 | 91 1% | 86 -4% | 87 -3% |
| Black Level * (cd/m²) | 0.37 | 0.28 24% | 0.44 -19% | 0.422 -14% |
| Contrast (:1) | 880 | 996 13% | 1003 14% | 793 -10% |
| Colorchecker dE 2000 * | 6.5 | 5.8 11% | 5.1 22% | 4.11 37% |
| Colorchecker dE 2000 max. * | 9.6 | 10.6 -10% | 9.8 -2% | 7.8 19% |
| Greyscale dE 2000 * | 5.6 | 8.3 -48% | 4.3 23% | 5.74 -3% |
| Gamma | 2.59 85% | 2.1 105% | 2.08 106% | 2.3 96% |
| CCT | 5860 111% | 5723 114% | 7345 88% | 5987 109% |
| Color Space (Percent of AdobeRGB 1998) (%) | 87 | 57 -34% | 87 0% | 60.5 -30% |
| Color Space (Percent of sRGB) (%) | 100 | 87 -13% | 100 0% | 96 -4% |
| Média Total (Programa/Configurações) | -3% /
-8% | -5% /
3% | 0% /
-2% |
* ... menor é melhor
Exibir tempos de resposta
| ↔ Tempo de resposta preto para branco | ||
|---|---|---|
| 33.2 ms ... ascensão ↗ e queda ↘ combinadas | ↗ ms ascensão | 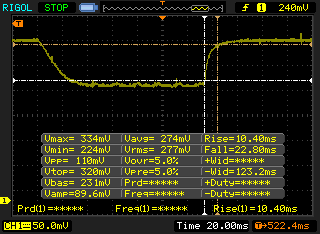 |
| ↘ ms queda | ||
| A tela mostra taxas de resposta lentas em nossos testes e será insatisfatória para os jogadores. Em comparação, todos os dispositivos testados variam de 0.1 (mínimo) a 240 (máximo) ms. » 90 % de todos os dispositivos são melhores. Isso significa que o tempo de resposta medido é pior que a média de todos os dispositivos testados (19.8 ms). | ||
| ↔ Tempo de resposta 50% cinza a 80% cinza | ||
| 50.8 ms ... ascensão ↗ e queda ↘ combinadas | ↗ ms ascensão | 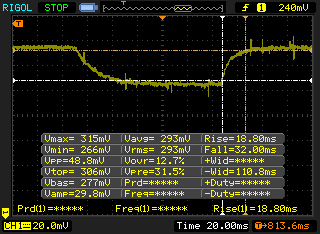 |
| ↘ ms queda | ||
| A tela mostra taxas de resposta lentas em nossos testes e será insatisfatória para os jogadores. Em comparação, todos os dispositivos testados variam de 0.165 (mínimo) a 636 (máximo) ms. » 87 % de todos os dispositivos são melhores. Isso significa que o tempo de resposta medido é pior que a média de todos os dispositivos testados (30.9 ms). | ||
Cintilação da tela / PWM (modulação por largura de pulso)
| Tela tremeluzindo / PWM não detectado | 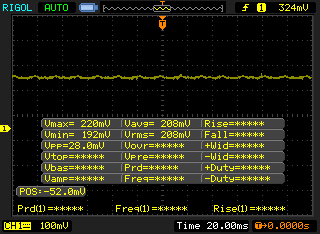 | ||
[pwm_comparison] Em comparação: 52 % de todos os dispositivos testados não usam PWM para escurecer a tela. Se PWM foi detectado, uma média de 7748 (mínimo: 5 - máximo: 343500) Hz foi medida. | |||
| Cinebench R11.5 | |
| CPU Single 64Bit | |
| MSI GT73VR 6RF | |
| HP Pavilion 17t-ab200 UHD | |
| Gigabyte P57X v7 | |
| HP Pavilion 17t-ab200 | |
| CPU Multi 64Bit | |
| MSI GT73VR 6RF | |
| HP Pavilion 17t-ab200 | |
| Gigabyte P57X v7 | |
| HP Pavilion 17t-ab200 UHD | |
| wPrime 2.10 - 1024m | |
| Gigabyte P57X v7 | |
| HP Pavilion 17t-ab200 UHD | |
| HP Pavilion 17t-ab200 | |
* ... menor é melhor
| PCMark 8 | |
| Home Score Accelerated v2 | |
| MSI GT73VR 6RF | |
| HP Pavilion 17t-ab200 | |
| Gigabyte P57X v7 | |
| HP Pavilion 17t-ab200 UHD | |
| Acer Aspire V17 Nitro BE VN7-793G-706L | |
| Work Score Accelerated v2 | |
| HP Pavilion 17t-ab200 | |
| MSI GT73VR 6RF | |
| Gigabyte P57X v7 | |
| HP Pavilion 17t-ab200 UHD | |
| Creative Score Accelerated v2 | |
| MSI GT73VR 6RF | |
| HP Pavilion 17t-ab200 | |
| Gigabyte P57X v7 | |
| HP Pavilion 17t-ab200 UHD | |
| PCMark 8 Home Score Accelerated v2 | 3056 pontos | |
| PCMark 8 Creative Score Accelerated v2 | 4516 pontos | |
| PCMark 8 Work Score Accelerated v2 | 2213 pontos | |
Ajuda | ||
| HP Pavilion 17t-ab200 UHD Intel SSD 600p SSDPEKKW256G7 | HP Pavilion 17t-ab200 Samsung CM871a MZNTY128HDHP | Gigabyte P57X v7 Transcend MTS800 256GB M.2 (TS256GMTS800) | Acer Aspire V17 Nitro BE VN7-793G-706L Toshiba NVMe THNSN5512GPU7 | MSI GT73VR 6RF 2x SanDisk X400 1TB M.2 SD8SN8U1T001122 (RAID 0) | |
|---|---|---|---|---|---|
| CrystalDiskMark 3.0 | -16% | -19% | 59% | 50% | |
| Read Seq (MB/s) | 1076 | 520 -52% | 517 -52% | 1172 9% | 914 -15% |
| Write Seq (MB/s) | 263.2 | 353.6 34% | 305.7 16% | 1073 308% | 916 248% |
| Read 512 (MB/s) | 695 | 376.2 -46% | 315 -55% | 760 9% | 698 0% |
| Write 512 (MB/s) | 472.3 | 118.5 -75% | 306.1 -35% | 878 86% | 916 94% |
| Read 4k (MB/s) | 20.09 | 32.7 63% | 26.04 30% | 21.04 5% | 31.37 56% |
| Write 4k (MB/s) | 116.2 | 85.3 -27% | 82.3 -29% | 59.8 -49% | 65.7 -43% |
| Read 4k QD32 (MB/s) | 282.7 | 399 41% | 281.3 0% | 573 103% | 425 50% |
| Write 4k QD32 (MB/s) | 405.2 | 132.5 -67% | 296 -27% | 419.8 4% | 441.8 9% |

| 3DMark 11 | |
| 1280x720 Performance GPU | |
| MSI GT73VR 6RF | |
| Gigabyte P57X v7 | |
| Acer Aspire V17 Nitro BE VN7-793G-706L | |
| HP Pavilion 17t-ab200 UHD | |
| HP Pavilion 17t-ab200 | |
| 1280x720 Performance Combined | |
| Gigabyte P57X v7 | |
| MSI GT73VR 6RF | |
| HP Pavilion 17t-ab200 | |
| HP Pavilion 17t-ab200 UHD | |
| Acer Aspire V17 Nitro BE VN7-793G-706L | |
| 3DMark | |
| 1280x720 Cloud Gate Standard Graphics | |
| MSI GT73VR 6RF | |
| Gigabyte P57X v7 | |
| HP Pavilion 17t-ab200 | |
| Acer Aspire V17 Nitro BE VN7-793G-706L | |
| HP Pavilion 17t-ab200 UHD | |
| 1920x1080 Fire Strike Graphics | |
| MSI GT73VR 6RF | |
| Gigabyte P57X v7 | |
| Acer Aspire V17 Nitro BE VN7-793G-706L | |
| HP Pavilion 17t-ab200 UHD | |
| HP Pavilion 17t-ab200 | |
| 3DMark 06 Standard Score | 25817 pontos | |
| 3DMark 11 Performance | 7554 pontos | |
| 3DMark Ice Storm Standard Score | 11692 pontos | |
| 3DMark Cloud Gate Standard Score | 11173 pontos | |
| 3DMark Fire Strike Score | 5383 pontos | |
Ajuda | ||
| Rise of the Tomb Raider - 3840x2160 High Preset AA:FX AF:4x (classificar por valor) | |
| HP Pavilion 17t-ab200 UHD | |
| Gigabyte P57X v7 | |
| Acer Aspire V17 Nitro BE VN7-793G-706L | |
| MSI GT73VR 6RF | |
| Doom - 3840x2160 High Preset AA:FX (classificar por valor) | |
| HP Pavilion 17t-ab200 UHD | |
| MSI GT73VR 6RF | |
| Batman: Arkham Knight - 3840x2160 High / On (Interactive Smoke & Paper Debris Off) AA:SM AF:8x (classificar por valor) | |
| HP Pavilion 17t-ab200 UHD | |
| Gigabyte P57X v7 | |
| MSI GT73VR 6RF | |
| baixo | média | alto | ultra | 4K | |
|---|---|---|---|---|---|
| Batman: Arkham Knight (2015) | 13 | ||||
| Rise of the Tomb Raider (2016) | 12 | ||||
| Doom (2016) | 15 |
Barulho
| Ocioso |
| 34.5 / 34.5 / 36.6 dB |
| DVD |
| 36.6 / dB |
| Carga |
| 46.6 / 52.3 dB |
 | ||
30 dB silencioso 40 dB(A) audível 50 dB(A) ruidosamente alto |
||
min: | ||
| HP Pavilion 17t-ab200 UHD GeForce GTX 1050 Mobile, i7-7700HQ, Intel SSD 600p SSDPEKKW256G7 | HP Pavilion 17t-ab200 GeForce GTX 1050 Mobile, i7-7700HQ, Samsung CM871a MZNTY128HDHP | Gigabyte P57X v7 GeForce GTX 1070 Mobile, i7-7700HQ, Transcend MTS800 256GB M.2 (TS256GMTS800) | MSI GT73VR 6RF GeForce GTX 1080 Mobile, 6820HK, 2x SanDisk X400 1TB M.2 SD8SN8U1T001122 (RAID 0) | |
|---|---|---|---|---|
| Noise | -1% | 6% | -2% | |
| desligado / ambiente * (dB) | 29.6 | 30.8 -4% | 29 2% | 29.2 1% |
| Idle Minimum * (dB) | 34.5 | 35.3 -2% | 30.4 12% | 32 7% |
| Idle Average * (dB) | 34.5 | 35.4 -3% | 32.1 7% | 32 7% |
| Idle Maximum * (dB) | 36.6 | 35.4 3% | 32.1 12% | 35 4% |
| Load Average * (dB) | 46.6 | 48.6 -4% | 45.6 2% | 50 -7% |
| Load Maximum * (dB) | 52.3 | 49.8 5% | 51.5 2% | 64 -22% |
* ... menor é melhor
(-) A temperatura máxima no lado superior é 48.8 °C / 120 F, em comparação com a média de 36.8 °C / 98 F , variando de 21 a 71 °C para a classe Multimedia.
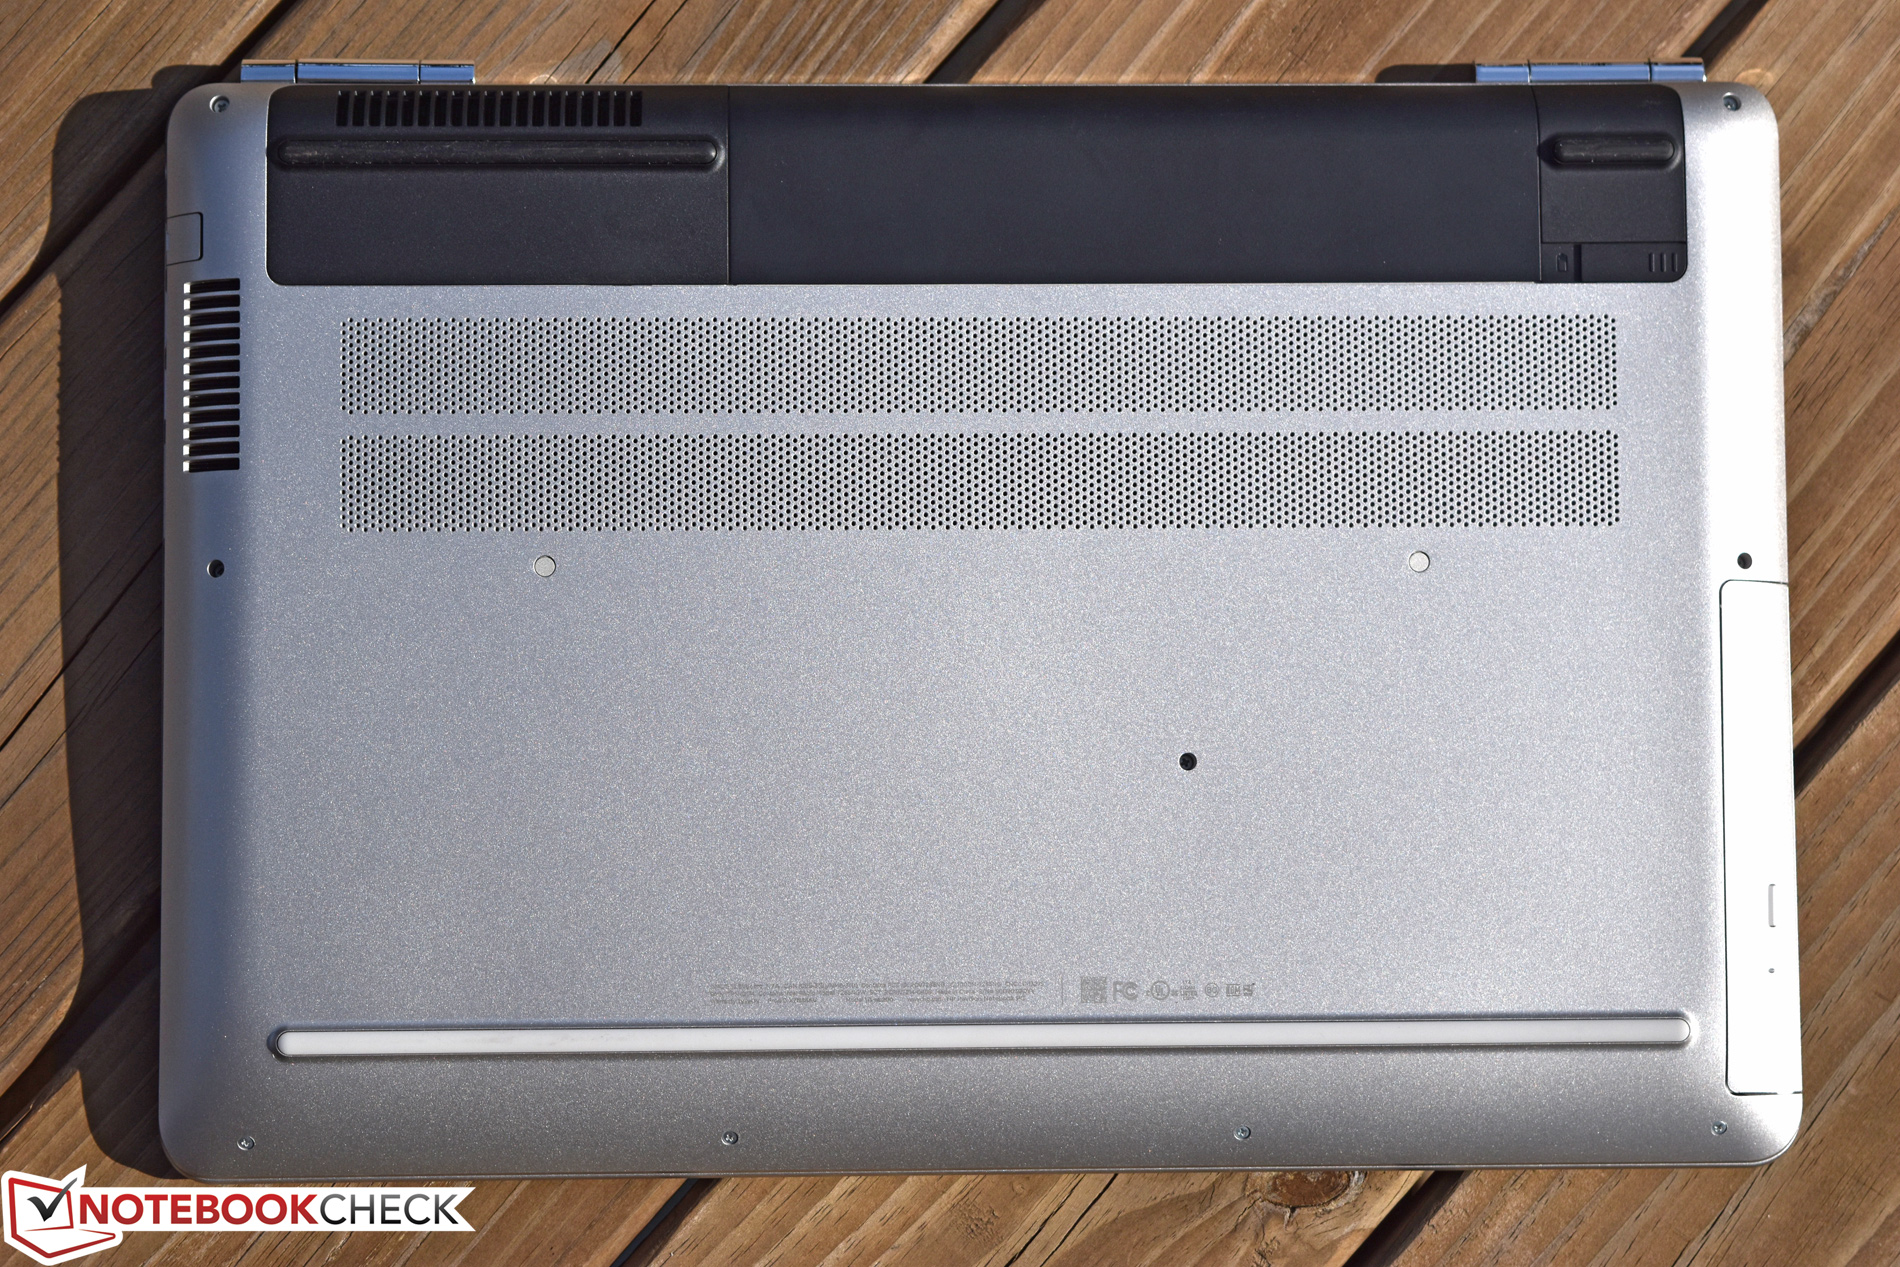
(+) A parte inferior aquece até um máximo de 38.4 °C / 101 F, em comparação com a média de 39.1 °C / 102 F
(+) Em uso inativo, a temperatura média para o lado superior é 22.2 °C / 72 F, em comparação com a média do dispositivo de 31.3 °C / ### class_avg_f### F.
(+) Os apoios para as mãos e o touchpad são mais frios que a temperatura da pele, com um máximo de 31 °C / 87.8 F e, portanto, são frios ao toque.
(-) A temperatura média da área do apoio para as mãos de dispositivos semelhantes foi 28.7 °C / 83.7 F (-2.3 °C / -4.1 F).
HP Pavilion 17t-ab200 UHD análise de áudio
(±) | o volume do alto-falante é médio, mas bom (###valor### dB)
Graves 100 - 315Hz
(±) | graves reduzidos - em média 13.3% menor que a mediana
(±) | a linearidade dos graves é média (10.8% delta para a frequência anterior)
Médios 400 - 2.000 Hz
(+) | médios equilibrados - apenas 3.1% longe da mediana
(+) | médios são lineares (5.4% delta para frequência anterior)
Altos 2 - 16 kHz
(+) | agudos equilibrados - apenas 3.5% longe da mediana
(±) | a linearidade dos máximos é média (7.8% delta para frequência anterior)
Geral 100 - 16.000 Hz
(±) | a linearidade do som geral é média (23.7% diferença em relação à mediana)
Comparado com a mesma classe
» 83% de todos os dispositivos testados nesta classe foram melhores, 6% semelhantes, 10% piores
» O melhor teve um delta de 5%, a média foi 17%, o pior foi 45%
Comparado com todos os dispositivos testados
» 71% de todos os dispositivos testados foram melhores, 6% semelhantes, 23% piores
» O melhor teve um delta de 4%, a média foi 23%, o pior foi 134%
MSI GT73VR 6RF análise de áudio
(±) | o volume do alto-falante é médio, mas bom (###valor### dB)
Graves 100 - 315Hz
(±) | graves reduzidos - em média 8.2% menor que a mediana
(±) | a linearidade dos graves é média (8% delta para a frequência anterior)
Médios 400 - 2.000 Hz
(+) | médios equilibrados - apenas 3.3% longe da mediana
(+) | médios são lineares (6.4% delta para frequência anterior)
Altos 2 - 16 kHz
(+) | agudos equilibrados - apenas 4.6% longe da mediana
(±) | a linearidade dos máximos é média (9.9% delta para frequência anterior)
Geral 100 - 16.000 Hz
(±) | a linearidade do som geral é média (19.9% diferença em relação à mediana)
Comparado com a mesma classe
» 70% de todos os dispositivos testados nesta classe foram melhores, 6% semelhantes, 24% piores
» O melhor teve um delta de 6%, a média foi 18%, o pior foi 132%
Comparado com todos os dispositivos testados
» 51% de todos os dispositivos testados foram melhores, 7% semelhantes, 42% piores
» O melhor teve um delta de 4%, a média foi 23%, o pior foi 134%
| desligado | |
| Ocioso | |
| Carga |
|
Key:
min: | |
| HP Pavilion 17t-ab200 UHD i7-7700HQ, GeForce GTX 1050 Mobile, Intel SSD 600p SSDPEKKW256G7, IPS, 3840x2160, 17.3" | HP Pavilion 17t-ab200 i7-7700HQ, GeForce GTX 1050 Mobile, Samsung CM871a MZNTY128HDHP, IPS, 1920x1080, 17.3" | Gigabyte P57X v7 i7-7700HQ, GeForce GTX 1070 Mobile, Transcend MTS800 256GB M.2 (TS256GMTS800), IPS, 3840x2160, 17.3" | MSI GT73VR 6RF 6820HK, GeForce GTX 1080 Mobile, 2x SanDisk X400 1TB M.2 SD8SN8U1T001122 (RAID 0), IPS, 3840x2160, 17.3" | |
|---|---|---|---|---|
| Power Consumption | 24% | -62% | -122% | |
| Idle Minimum * (Watt) | 13.3 | 8.2 38% | 15.7 -18% | 28.9 -117% |
| Idle Average * (Watt) | 18.5 | 11 41% | 23.4 -26% | 30.6 -65% |
| Idle Maximum * (Watt) | 19 | 11.1 42% | 23.5 -24% | 33.1 -74% |
| Load Average * (Watt) | 78 | 77 1% | 184.6 -137% | 224.4 -188% |
| Load Maximum * (Watt) | 113.4 | 116.9 -3% | 233.1 -106% | 302.6 -167% |
* ... menor é melhor
| HP Pavilion 17t-ab200 UHD i7-7700HQ, GeForce GTX 1050 Mobile, 63 Wh | HP Pavilion 17t-ab200 i7-7700HQ, GeForce GTX 1050 Mobile, 62 Wh | Gigabyte P57X v7 i7-7700HQ, GeForce GTX 1070 Mobile, 75.81 Wh | Acer Aspire V17 Nitro BE VN7-793G-706L i7-7700HQ, GeForce GTX 1060 Mobile, 69 Wh | MSI GT73VR 6RF 6820HK, GeForce GTX 1080 Mobile, 75.2 Wh | |
|---|---|---|---|---|---|
| Duração da bateria | 31% | -28% | -21% | -32% | |
| Reader / Idle (h) | 8.9 | 11.5 29% | 4.3 -52% | 5.1 -43% | |
| WiFi v1.3 (h) | 4.8 | 6.8 42% | 2.6 -46% | 3.8 -21% | 3.3 -31% |
| Load (h) | 1.4 | 1.7 21% | 1.6 14% | 1.1 -21% |
Pro
Contra

Considerando que o Pavilion 17t que revisamos no mês passado, apesar de todas as suas lutas, parecia um candidato plausível para um entusiasta de jogos móveis com um orçamento sério, esta última máquina vem consideravelmente mais desequilibrada em termos de fortalezas e fraquezas. Embora a GPU e outros componentes permaneçam bastante consistentes com aqueles da configuração anterior, algumas limitações do poder/firmware resultam em um desempenho mais baixo do que o que medimos no modelo 1080p, e a tela da resolução mais alta - embora inegavelmente mais atraente - significa que jogar com a resolução nativa com configurações e taxas de fotogramas respeitáveis, é quase impossível com a GTX 1050. Este é um ótimo exemplo de uma situação onde mais é menos—dado que a fatia de mercado muito específica que provavelmente encontre o Pavilion 17t atraente, provavelmente não verá um motivo para pagar um preço substancialmente mais alto para uma atualização do a painel que não poderiam aproveitar durante os jogos.
Depois vem a questão dos entusiastas da edição de foto e vídeo, desde que o o painel UHD forneça uma boa cobertura da gama de cores e um brilho e resolução muito melhor que sua contraparte da 1080p. No entanto, existem máquinas muito melhores para esses propósitos, e considerando os problemas relativamente severos de estabilidade, que encontramos com o 17t durante nosso período de testes (incluindo os soluços do desempenho, que ainda permanecem até certo grau, inclusive depois da atualização do firmware), se estiver por fazer um investimento moderado para um hobby de edição de fotos e vídeos, seria sensato não optar por uma máquina com um histórico de outros problemas relacionados, sem importar quanto possa economizar.
Se, inclusive depois de tomar em conta sua miríade de problemas, o Pavilion 17t ainda estiver sendo considerado, é imperativo aplicar BIOS F.35 REV A para corrigir alguns dos principais problemas de estabilidade.
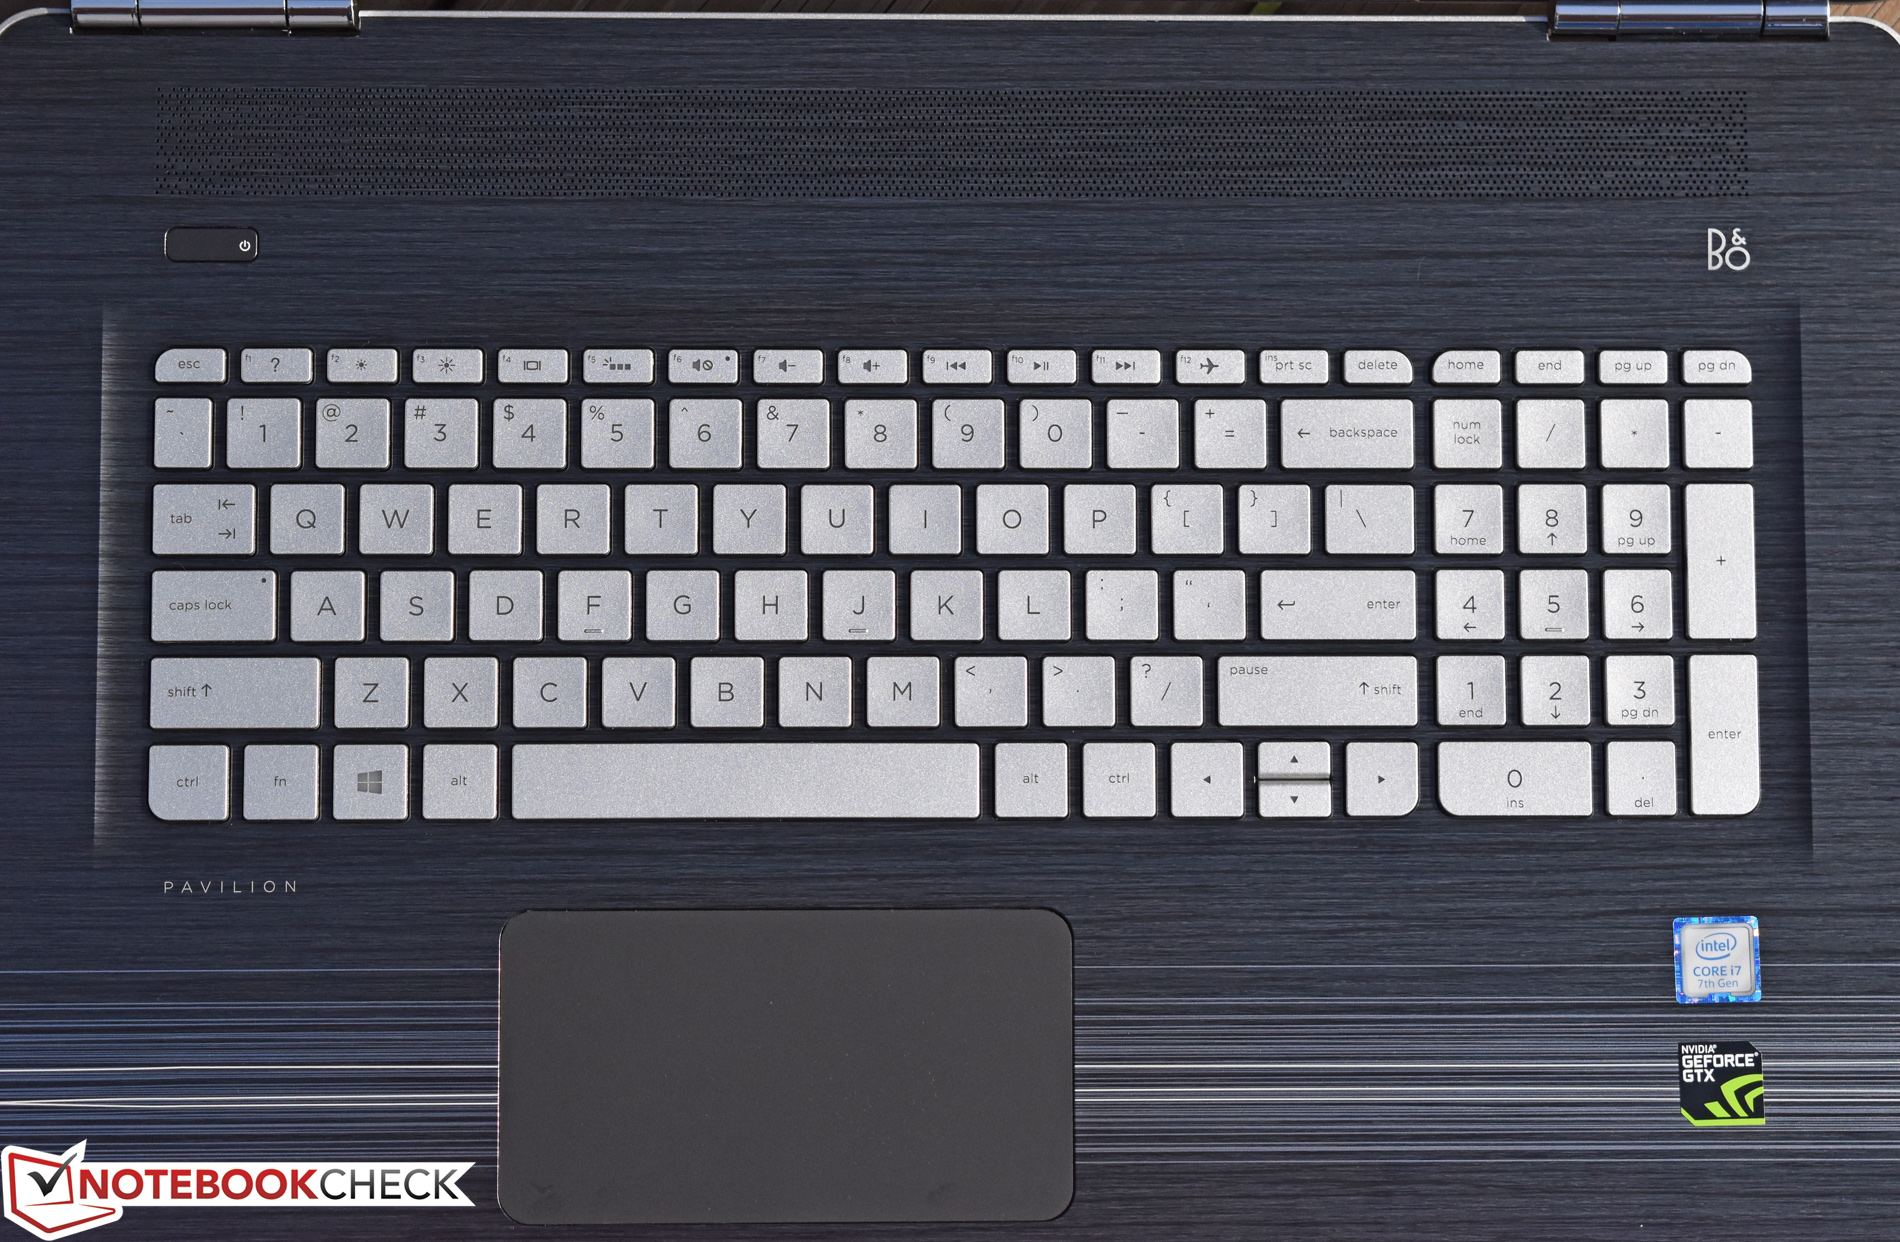
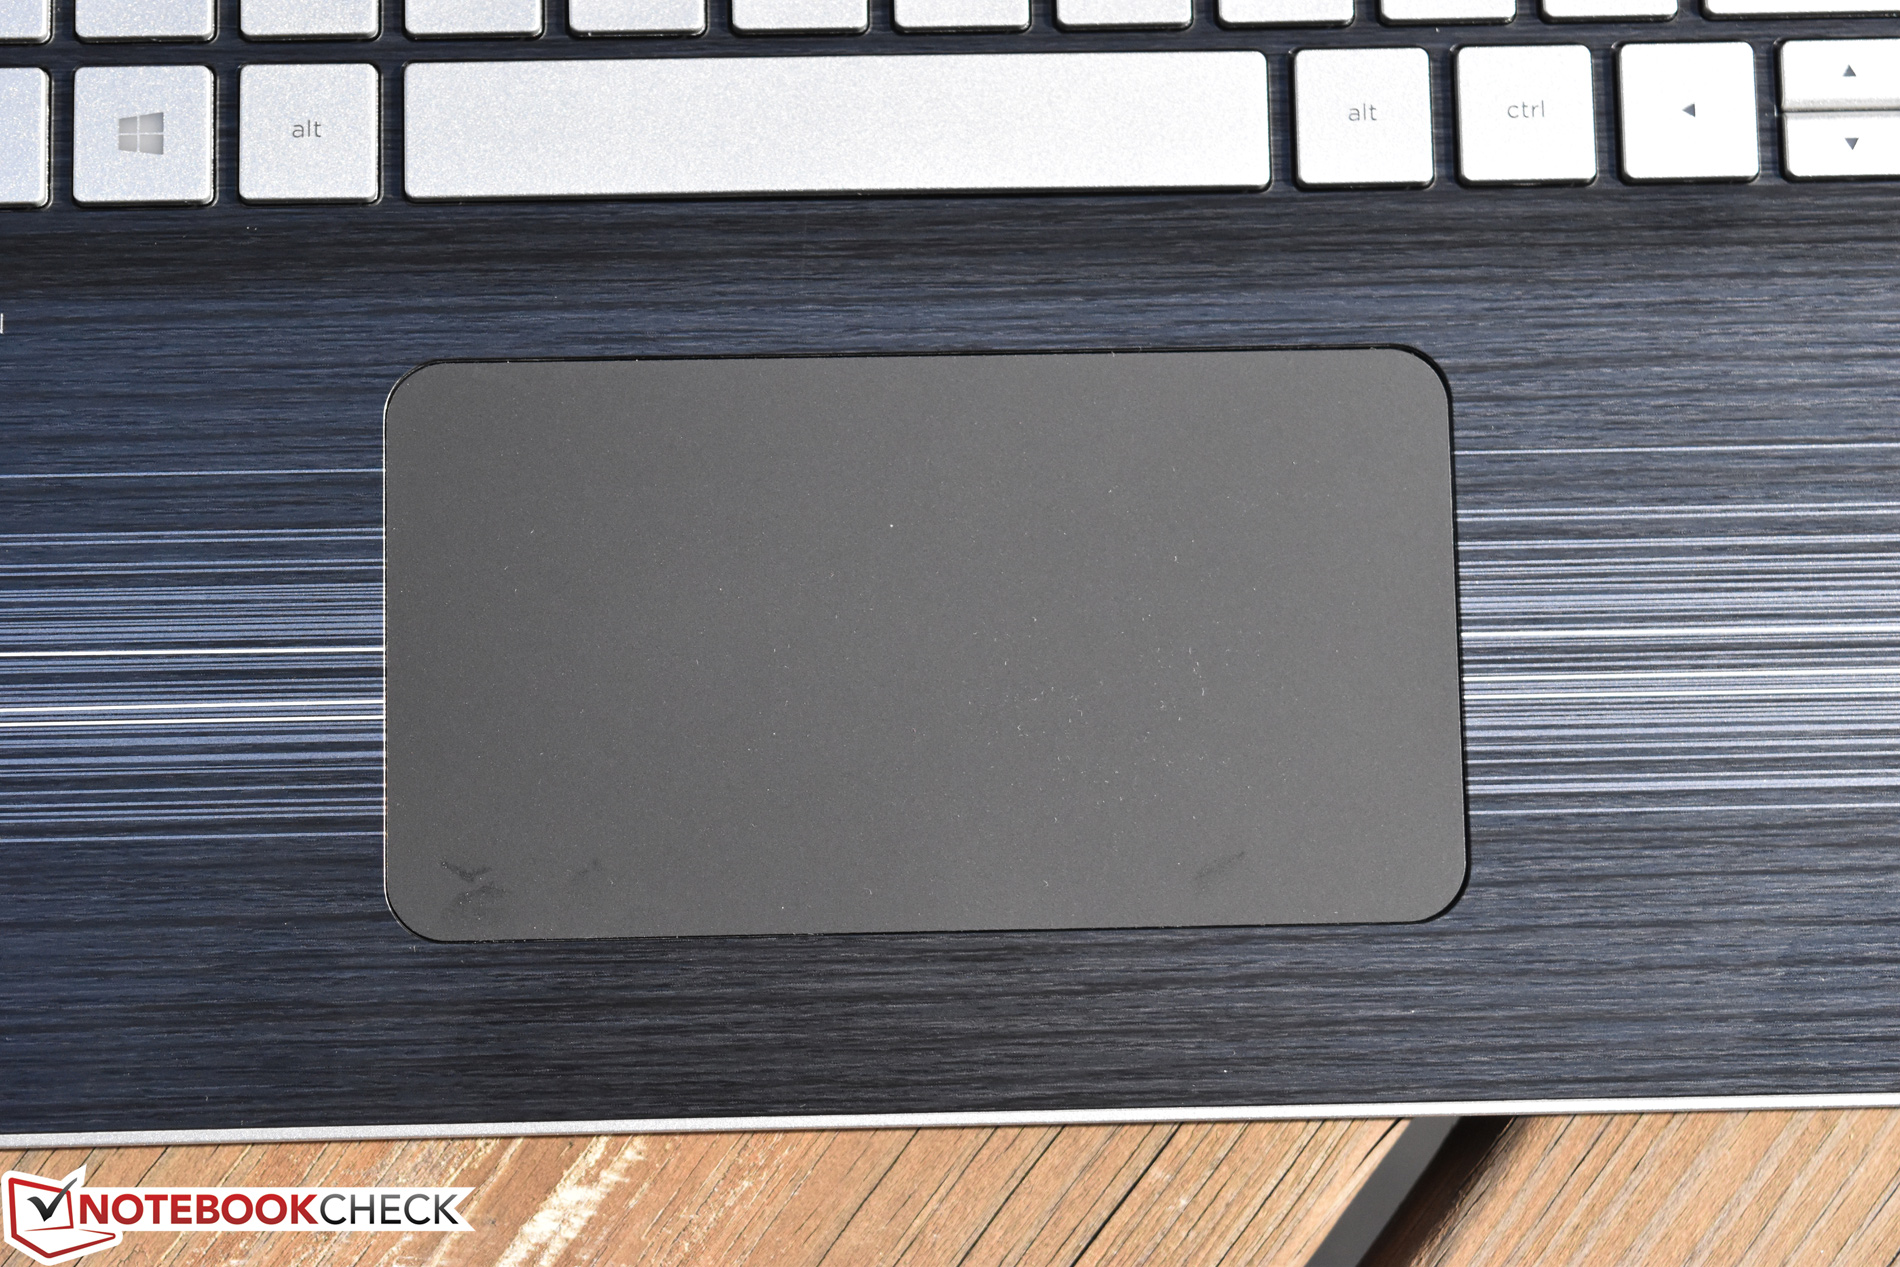
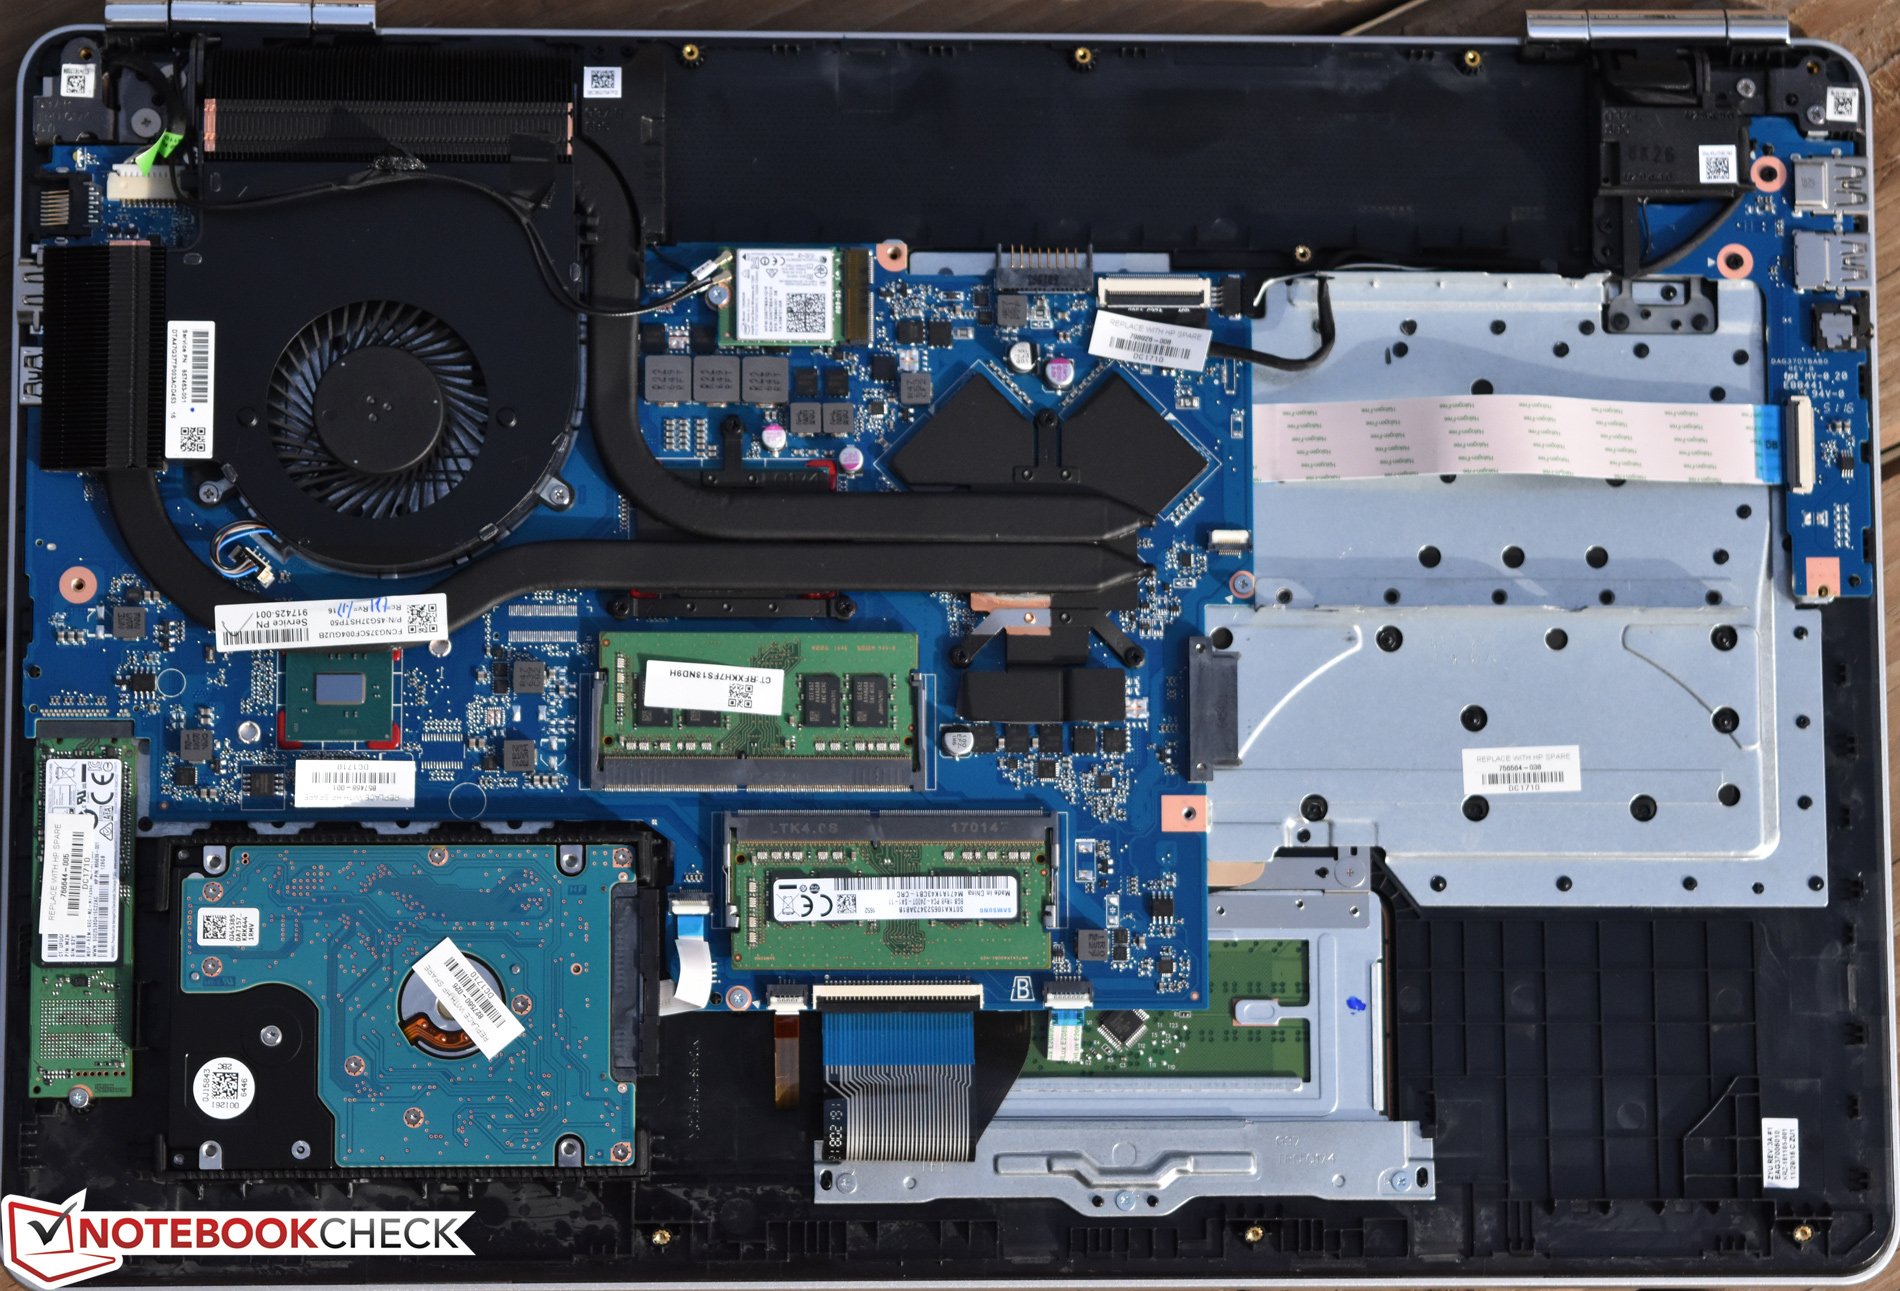
E não vamos nos esquecer sobre todos os outros pontos negativos que pragam este modelo em particular, incluindo a carcaça de plástico fino, manutenção desafiadora, touchpad ruim, pobre seleção de portas, e operação barulhenta. A conclusão é que você nem sequer precisa procurar muito, mais que entre outras máquinas da HP para encontrar melhores opções para quase qualquer propósito — qualquer um, desde um HP Spectre até uma Dell XPS 15 ou Lenovo Yoga 720, embora seja bastante mais caro, seria uma opção muito melhor para esse propósito. O Pavilion 17t um portátil que nós realmente lhe recomendaríamos que evite.
HP Pavilion 17t-ab200 UHD
- 03/27/2017 v6 (old)
Steve Schardein
Price comparison
