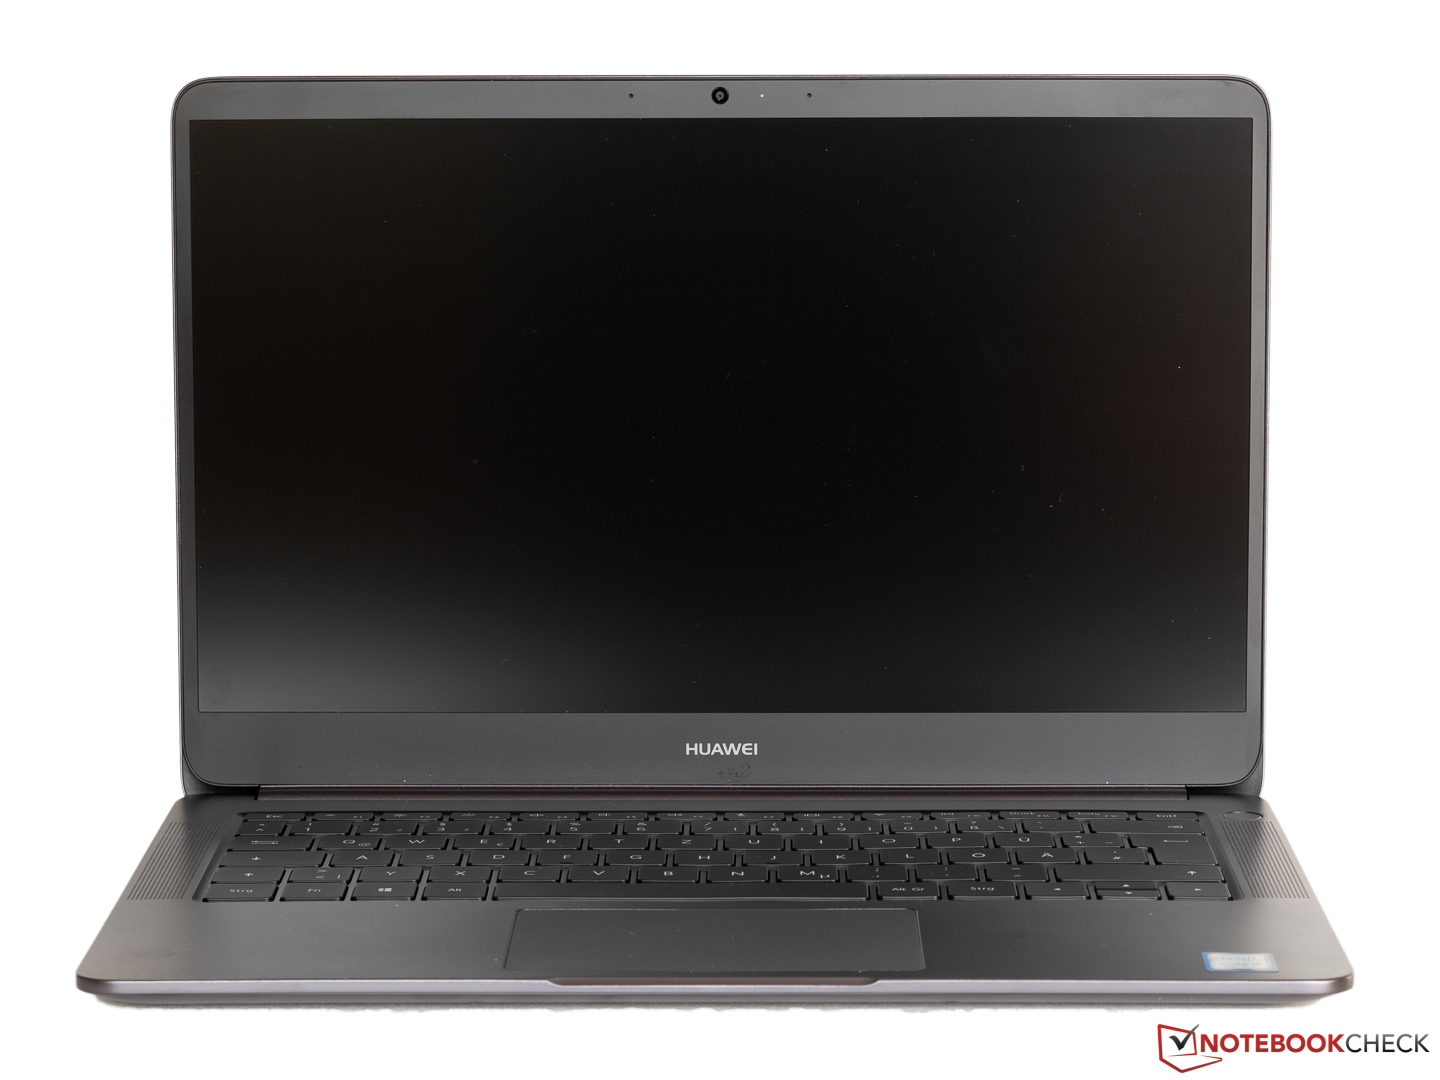
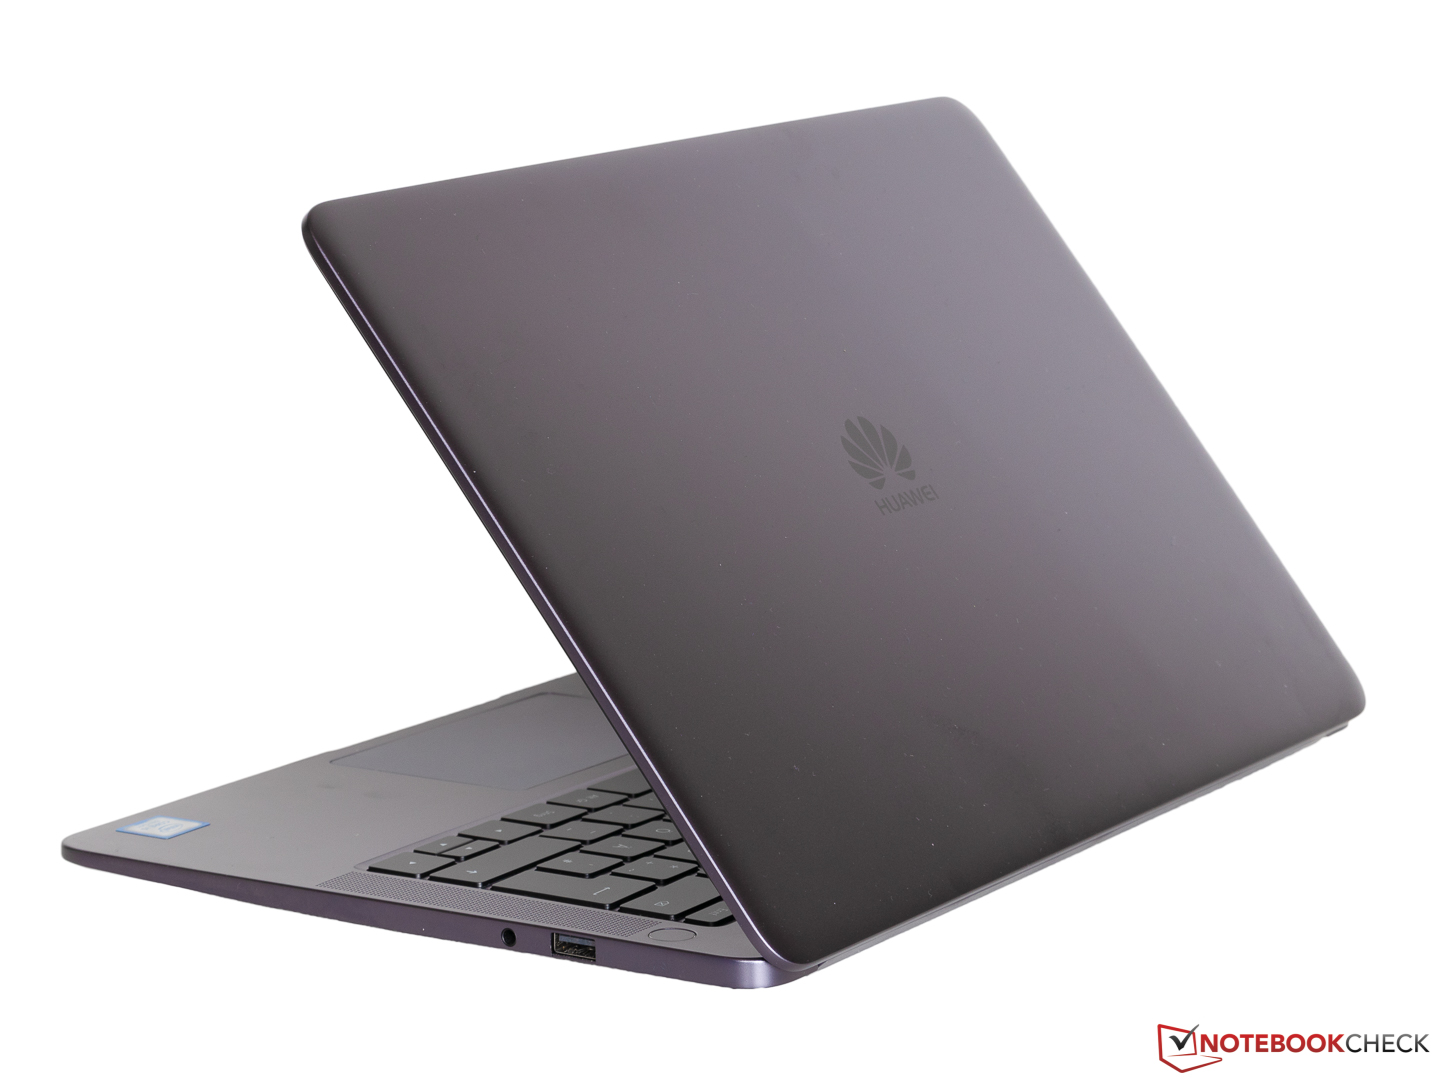
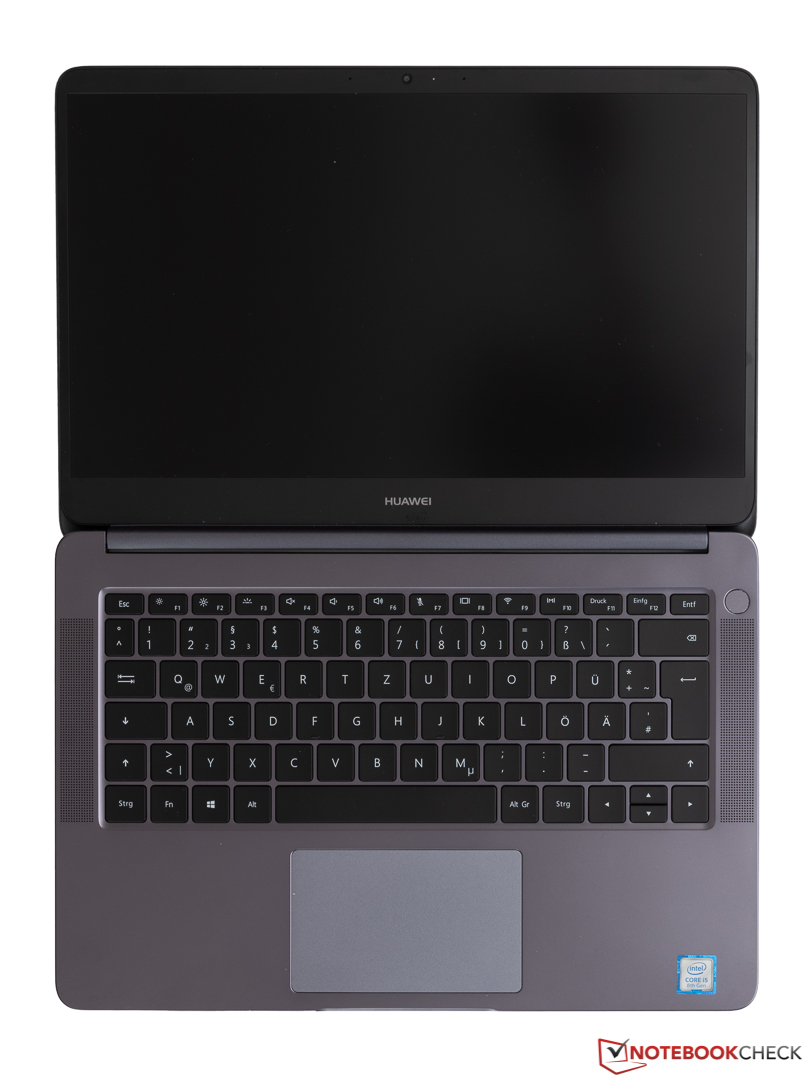
Breve Análise do Huawei MateBook D 14 W00D (Ryzen 5, RX Vega 8)
| Networking | |
| iperf3 transmit AX12 | |
| Asus VivoBook 14 F412FJ-EB084T | |
| Acer Swift 3 SF314-55-31N8 | |
| Huawei MateBook D 14 W50F | |
| HP ProBook 445 G6 | |
| Huawei MateBook D 14 W00D-53010GXL | |
| Lenovo ThinkPad E485-20KU000NGE | |
| iperf3 receive AX12 | |
| Huawei MateBook D 14 W00D-53010GXL | |
| Acer Swift 3 SF314-55-31N8 | |
| Asus VivoBook 14 F412FJ-EB084T | |
| HP ProBook 445 G6 | |
| Huawei MateBook D 14 W50F | |
| Lenovo ThinkPad E485-20KU000NGE | |
| |||||||||||||||||||||||||
iluminação: 86 %
iluminação com acumulador: 284 cd/m²
Contraste: 1148:1 (Preto: 0.25 cd/m²)
ΔE ColorChecker Calman: 5.4 | ∀{0.5-29.43 Ø4.72}
calibrated: 5
ΔE Greyscale Calman: 3.1 | ∀{0.09-98 Ø4.97}
64.6% sRGB (Argyll 1.6.3 3D)
41.8% AdobeRGB 1998 (Argyll 1.6.3 3D)
45.73% AdobeRGB 1998 (Argyll 3D)
65.1% sRGB (Argyll 3D)
44.26% Display P3 (Argyll 3D)
Gamma: 1.99
CCT: 6769 K
| Huawei MateBook D 14 W00D-53010GXL BOE083C, , 1920x1080, 14" | HP ProBook 445 G6 Chi Mei CMN14D4, , 1920x1080, 14" | Asus VivoBook 14 F412FJ-EB084T AU Optronics AUO403D B140HAN04.0, , 1920x1080, 14" | Lenovo ThinkPad E485-20KU000NGE B140HAN04.2, , 1920x1080, 14" | Acer Swift 3 SF314-55-31N8 Chi Mei N140HCE-EN2, , 1920x1080, 14" | |
|---|---|---|---|---|---|
| Display | -6% | -9% | -12% | 50% | |
| Display P3 Coverage (%) | 44.26 | 41.53 -6% | 39.71 -10% | 39.21 -11% 38.48 -13% | 66.2 50% |
| sRGB Coverage (%) | 65.1 | 62 -5% | 59.6 -8% | 58.8 -10% 57.9 -11% | 98.3 51% |
| AdobeRGB 1998 Coverage (%) | 45.73 | 42.94 -6% | 41.04 -10% | 40.52 -11% 39.76 -13% | 67.8 48% |
| Response Times | 14% | 9% | -4% | 6% | |
| Response Time Grey 50% / Grey 80% * (ms) | 42.4 ? | 40 ? 6% | 40 ? 6% | 44.8 ? -6% | 41 ? 3% |
| Response Time Black / White * (ms) | 32.8 ? | 26 ? 21% | 29 ? 12% | 33.6 ? -2% | 30 ? 9% |
| PWM Frequency (Hz) | 198.4 ? | 208 ? | 25000 ? | ||
| Screen | 1% | 14% | 3% | 10% | |
| Brightness middle (cd/m²) | 287 | 200 -30% | 267 -7% | 289 1% | 291 1% |
| Brightness (cd/m²) | 276 | 196 -29% | 257 -7% | 271 -2% | 276 0% |
| Brightness Distribution (%) | 86 | 67 -22% | 91 6% | 87 1% | 90 5% |
| Black Level * (cd/m²) | 0.25 | 0.17 32% | 0.2 20% | 0.19 24% | 0.27 -8% |
| Contrast (:1) | 1148 | 1176 2% | 1335 16% | 1521 32% | 1078 -6% |
| Colorchecker dE 2000 * | 5.4 | 4.26 21% | 3.79 30% | 5.6 -4% | 3.86 29% |
| Colorchecker dE 2000 max. * | 18.1 | 9.7 46% | 8.18 55% | 20.8 -15% | 8.26 54% |
| Colorchecker dE 2000 calibrated * | 5 | 4.71 6% | 4.7 6% | ||
| Greyscale dE 2000 * | 3.1 | 3.15 -2% | 1.49 52% | 2.7 13% | 5.33 -72% |
| Gamma | 1.99 111% | 2.31 95% | 2.48 89% | 1.96 112% | 2.25 98% |
| CCT | 6769 96% | 6882 94% | 6659 98% | 6506 100% | 7426 88% |
| Color Space (Percent of AdobeRGB 1998) (%) | 41.8 | 40 -4% | 38 -9% | 37.2 -11% | 62 48% |
| Color Space (Percent of sRGB) (%) | 64.6 | 62 -4% | 59 -9% | 58.5 -9% | 98 52% |
| Média Total (Programa/Configurações) | 3% /
1% | 5% /
9% | -4% /
-2% | 22% /
18% |
* ... menor é melhor
Exibir tempos de resposta
| ↔ Tempo de resposta preto para branco | ||
|---|---|---|
| 32.8 ms ... ascensão ↗ e queda ↘ combinadas | ↗ 18 ms ascensão | 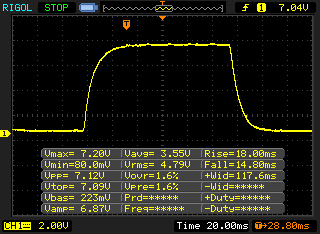 |
| ↘ 14.8 ms queda | ||
| A tela mostra taxas de resposta lentas em nossos testes e será insatisfatória para os jogadores. Em comparação, todos os dispositivos testados variam de 0.1 (mínimo) a 240 (máximo) ms. » 88 % de todos os dispositivos são melhores. Isso significa que o tempo de resposta medido é pior que a média de todos os dispositivos testados (19.8 ms). | ||
| ↔ Tempo de resposta 50% cinza a 80% cinza | ||
| 42.4 ms ... ascensão ↗ e queda ↘ combinadas | ↗ 22.8 ms ascensão | 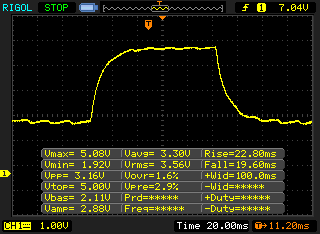 |
| ↘ 19.6 ms queda | ||
| A tela mostra taxas de resposta lentas em nossos testes e será insatisfatória para os jogadores. Em comparação, todos os dispositivos testados variam de 0.165 (mínimo) a 636 (máximo) ms. » 70 % de todos os dispositivos são melhores. Isso significa que o tempo de resposta medido é pior que a média de todos os dispositivos testados (31 ms). | ||
Cintilação da tela / PWM (modulação por largura de pulso)
| Tela tremeluzindo/PWM detectado | 198.4 Hz | ≤ 99 % configuração de brilho | 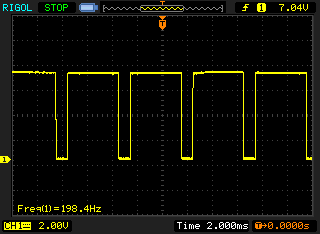 |
A luz de fundo da tela pisca em 198.4 Hz (pior caso, por exemplo, utilizando PWM) Cintilação detectada em uma configuração de brilho de 99 % e abaixo. Não deve haver cintilação ou PWM acima desta configuração de brilho. A frequência de 198.4 Hz é relativamente baixa, portanto, usuários sensíveis provavelmente notarão cintilação e sentirão fadiga ocular na configuração de brilho indicada e abaixo. [pwm_comparison] Em comparação: 52 % de todos os dispositivos testados não usam PWM para escurecer a tela. Se PWM foi detectado, uma média de 7769 (mínimo: 5 - máximo: 343500) Hz foi medida. | |||
| Cinebench R15 | |
| CPU Single 64Bit | |
| Média da turma Office (99.5 - 312, n=75, últimos 2 anos) | |
| Asus VivoBook 14 F412FJ-EB084T | |
| Acer Swift 3 SF314-55-31N8 | |
| Huawei MateBook D 14 W50F | |
| Lenovo ThinkPad E485-20KU000NGE | |
| Huawei MateBook D 14 W00D-53010GXL | |
| Média AMD Ryzen 5 2500U (124 - 142, n=15) | |
| HP ProBook 445 G6 | |
| CPU Multi 64Bit | |
| Média da turma Office (250 - 3380, n=75, últimos 2 anos) | |
| Asus VivoBook 14 F412FJ-EB084T | |
| Lenovo ThinkPad E485-20KU000NGE | |
| Huawei MateBook D 14 W00D-53010GXL | |
| HP ProBook 445 G6 | |
| Média AMD Ryzen 5 2500U (510 - 642, n=16) | |
| Huawei MateBook D 14 W50F | |
| Acer Swift 3 SF314-55-31N8 | |
| PCMark 8 | |
| Home Score Accelerated v2 | |
| Média da turma Office (n=1últimos 2 anos) | |
| Lenovo ThinkPad E485-20KU000NGE | |
| Huawei MateBook D 14 W00D-53010GXL | |
| Média AMD Ryzen 5 2500U, AMD Radeon RX Vega 8 (Ryzen 2000/3000) (3049 - 3550, n=14) | |
| Acer Swift 3 SF314-55-31N8 | |
| HP ProBook 445 G6 | |
| Work Score Accelerated v2 | |
| Média da turma Office (n=1últimos 2 anos) | |
| Lenovo ThinkPad E485-20KU000NGE | |
| Acer Swift 3 SF314-55-31N8 | |
| Huawei MateBook D 14 W00D-53010GXL | |
| HP ProBook 445 G6 | |
| Média AMD Ryzen 5 2500U, AMD Radeon RX Vega 8 (Ryzen 2000/3000) (3437 - 4870, n=11) | |
| PCMark 8 Home Score Accelerated v2 | 3420 pontos | |
| PCMark 8 Work Score Accelerated v2 | 4420 pontos | |
| PCMark 10 Score | 3534 pontos | |
Ajuda | ||
| Huawei MateBook D 14 W00D-53010GXL SK Hynix SC313 HFS256G39TNF | HP ProBook 445 G6 SK Hynix BC501 NVMe 256 GB | Asus VivoBook 14 F412FJ-EB084T Kingston RBU-SNS8180DS3512GJ | Lenovo ThinkPad E485-20KU000NGE Samsung PM961 MZVLW256HEHP | Acer Swift 3 SF314-55-31N8 Kingston RBUSNS8154P3128GJ | Huawei MateBook D 14 W50F SanDisk SD9SN8W256G1027 | Média SK Hynix SC313 HFS256G39TNF | |
|---|---|---|---|---|---|---|---|
| CrystalDiskMark 5.2 / 6 | 78% | -19% | 128% | 45% | -2% | -2% | |
| Write 4K (MB/s) | 72.3 | 110.4 53% | 55 -24% | 72.2 0% | 96.8 34% | 60.5 -16% | 71.3 ? -1% |
| Read 4K (MB/s) | 30.77 | 39.46 28% | 28.79 -6% | 35.25 15% | 36.99 20% | 21.63 -30% | 25.3 ? -18% |
| Write Seq (MB/s) | 468.1 | 808 73% | 307.5 -34% | 1412 202% | 463.1 -1% | 450.9 -4% | 473 ? 1% |
| Read Seq (MB/s) | 518 | 1130 118% | 430 -17% | 1523 194% | 794 53% | 482.3 -7% | 517 ? 0% |
| Write 4K Q32T1 (MB/s) | 214.2 | 260.8 22% | 149.5 -30% | 102.1 -52% | 291.7 36% | 248.9 16% | 209 ? -2% |
| Read 4K Q32T1 (MB/s) | 241.1 | 308 28% | 207.2 -14% | 170.9 -29% | 352 46% | 267.6 11% | 234 ? -3% |
| Write Seq Q32T1 (MB/s) | 482 | 816 69% | 389.2 -19% | 1429 196% | 468.1 -3% | 534 11% | 494 ? 2% |
| Read Seq Q32T1 (MB/s) | 537 | 1783 232% | 497.1 -7% | 3204 497% | 1489 177% | 563 5% | 552 ? 3% |
| AS SSD | 110% | -66% | 162% | 66% | -2% | 16% | |
| Seq Read (MB/s) | 500 | 1546 209% | 487.6 -2% | 2030 306% | 1201 140% | 458.3 -8% | 499 ? 0% |
| Seq Write (MB/s) | 457.9 | 708 55% | 392.7 -14% | 1395 205% | 434.5 -5% | 268.6 -41% | 474 ? 4% |
| 4K Read (MB/s) | 25.12 | 34.12 36% | 36.4 45% | 38.63 54% | 40.9 63% | 26.87 7% | 28.6 ? 14% |
| 4K Write (MB/s) | 51.7 | 76.7 48% | 26.46 -49% | 63.9 24% | 90 74% | 51.7 0% | 60.7 ? 17% |
| 4K-64 Read (MB/s) | 220.7 | 528 139% | 325.4 47% | 1035 369% | 425.5 93% | 364.2 65% | 298 ? 35% |
| 4K-64 Write (MB/s) | 195.6 | 588 201% | 87.2 -55% | 371.5 90% | 390.9 100% | 137.3 -30% | 233 ? 19% |
| Access Time Read * (ms) | 0.135 | 0.062 54% | 0.432 -220% | 0.054 60% | 0.184 -36% | 0.092 32% | 0.1193 ? 12% |
| Access Time Write * (ms) | 0.07 | 0.048 31% | 0.4 -471% | 0.059 16% | 0.048 31% | 0.13 -86% | 0.06033 ? 14% |
| Score Read (Points) | 296 | 717 142% | 411 39% | 1277 331% | 586 98% | 437 48% | 376 ? 27% |
| Score Write (Points) | 293 | 735 151% | 153 -48% | 575 96% | 524 79% | 216 -26% | 341 ? 16% |
| Score Total (Points) | 747 | 1785 139% | 782 5% | 2478 232% | 1386 86% | 875 17% | 918 ? 23% |
| Copy ISO MB/s (MB/s) | 576 | 310.1 | 514 ? | ||||
| Copy Program MB/s (MB/s) | 159.8 | 88.4 | 259 ? | ||||
| Copy Game MB/s (MB/s) | 330.8 | 166.4 | 521 ? | ||||
| Média Total (Programa/Configurações) | 94% /
96% | -43% /
-46% | 145% /
148% | 56% /
57% | -2% /
-2% | 7% /
9% |
* ... menor é melhor

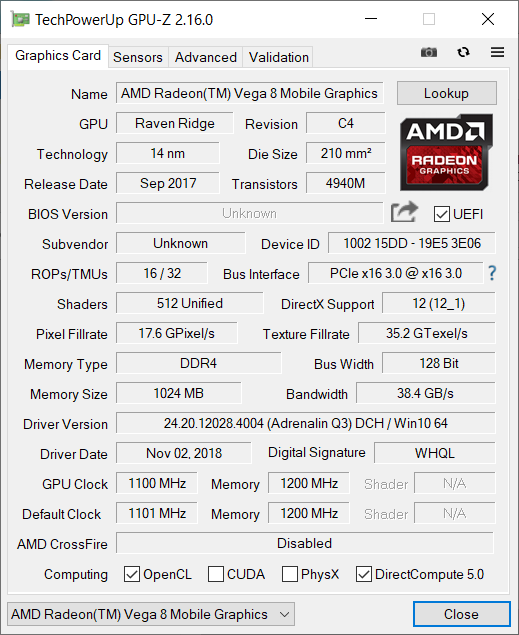
| 3DMark 11 - 1280x720 Performance GPU | |
| Média da turma Office (2551 - 18313, n=69, últimos 2 anos) | |
| Huawei MateBook D 14 W00D-53010GXL | |
| Média AMD Radeon RX Vega 8 (Ryzen 2000/3000) (1668 - 4317, n=44) | |
| Asus VivoBook 14 F412FJ-EB084T | |
| HP ProBook 445 G6 | |
| Lenovo ThinkPad E485-20KU000NGE | |
| Huawei MateBook D 14 W50F | |
| Acer Swift 3 SF314-55-31N8 | |
| 3DMark | |
| 1280x720 Cloud Gate Standard Graphics | |
| Média da turma Office (11640 - 118515, n=37, últimos 2 anos) | |
| Huawei MateBook D 14 W00D-53010GXL | |
| Média AMD Radeon RX Vega 8 (Ryzen 2000/3000) (7309 - 19399, n=37) | |
| Asus VivoBook 14 F412FJ-EB084T | |
| HP ProBook 445 G6 | |
| Lenovo ThinkPad E485-20KU000NGE | |
| Huawei MateBook D 14 W50F | |
| Acer Swift 3 SF314-55-31N8 | |
| 1920x1080 Fire Strike Graphics | |
| Média da turma Office (736 - 21871, n=73, últimos 2 anos) | |
| Huawei MateBook D 14 W00D-53010GXL | |
| Asus VivoBook 14 F412FJ-EB084T | |
| Média AMD Radeon RX Vega 8 (Ryzen 2000/3000) (1095 - 2901, n=41) | |
| HP ProBook 445 G6 | |
| Lenovo ThinkPad E485-20KU000NGE | |
| Huawei MateBook D 14 W50F | |
| Acer Swift 3 SF314-55-31N8 | |
| 2560x1440 Time Spy Graphics | |
| Média da turma Office (493 - 6679, n=68, últimos 2 anos) | |
| Asus VivoBook 14 F412FJ-EB084T | |
| Média AMD Radeon RX Vega 8 (Ryzen 2000/3000) (523 - 790, n=23) | |
| HP ProBook 445 G6 | |
| 3DMark 11 Performance | 3682 pontos | |
| 3DMark Cloud Gate Standard Score | 8316 pontos | |
| 3DMark Fire Strike Score | 2184 pontos | |
Ajuda | ||
| BioShock Infinite - 1920x1080 Ultra Preset, DX11 (DDOF) | |
| Asus VivoBook 14 F412FJ-EB084T | |
| Huawei MateBook D 14 W00D-53010GXL | |
| Média AMD Radeon RX Vega 8 (Ryzen 2000/3000) (7.6 - 28, n=30) | |
| HP ProBook 445 G6 | |
| Lenovo ThinkPad E485-20KU000NGE | |
| Huawei MateBook D 14 W50F | |
| Acer Swift 3 SF314-55-31N8 | |
| baixo | média | alto | ultra | |
|---|---|---|---|---|
| BioShock Infinite (2013) | 19.84 | |||
| The Witcher 3 (2015) | 28.98 | 16.37 | ||
| Dota 2 Reborn (2015) | 69 | 60 | 34.8 | 32.6 |
| X-Plane 11.11 (2018) | 26.5 | 19.4 | 18.2 | |
| F1 2019 (2019) | 47.1 | 19.8 | 18.4 | 12 |
Barulho
| Ocioso |
| 29.5 / 29.5 / 30.4 dB |
| Carga |
| 31.5 / 33.5 dB |
 | ||
30 dB silencioso 40 dB(A) audível 50 dB(A) ruidosamente alto |
||
min: | ||
(±) A temperatura máxima no lado superior é 44.3 °C / 112 F, em comparação com a média de 34.3 °C / 94 F , variando de 21.2 a 62.5 °C para a classe Office.
(±) A parte inferior aquece até um máximo de 45 °C / 113 F, em comparação com a média de 36.8 °C / 98 F
(+) Em uso inativo, a temperatura média para o lado superior é 22.9 °C / 73 F, em comparação com a média do dispositivo de 29.5 °C / ### class_avg_f### F.
(+) Os apoios para as mãos e o touchpad são mais frios que a temperatura da pele, com um máximo de 31.8 °C / 89.2 F e, portanto, são frios ao toque.
(-) A temperatura média da área do apoio para as mãos de dispositivos semelhantes foi 27.5 °C / 81.5 F (-4.3 °C / -7.7 F).
Huawei MateBook D 14 W00D-53010GXL análise de áudio
(±) | o volume do alto-falante é médio, mas bom (###valor### dB)
Graves 100 - 315Hz
(-) | quase nenhum baixo - em média 17.2% menor que a mediana
(±) | a linearidade dos graves é média (10.7% delta para a frequência anterior)
Médios 400 - 2.000 Hz
(+) | médios equilibrados - apenas 4.8% longe da mediana
(±) | a linearidade dos médios é média (10.2% delta para frequência anterior)
Altos 2 - 16 kHz
(±) | máximos mais altos - em média 5.1% maior que a mediana
(±) | a linearidade dos máximos é média (11% delta para frequência anterior)
Geral 100 - 16.000 Hz
(±) | a linearidade do som geral é média (24.5% diferença em relação à mediana)
Comparado com a mesma classe
» 71% de todos os dispositivos testados nesta classe foram melhores, 8% semelhantes, 21% piores
» O melhor teve um delta de 7%, a média foi 21%, o pior foi 53%
Comparado com todos os dispositivos testados
» 74% de todos os dispositivos testados foram melhores, 6% semelhantes, 20% piores
» O melhor teve um delta de 4%, a média foi 24%, o pior foi 134%
Apple MacBook 12 (Early 2016) 1.1 GHz análise de áudio
(+) | os alto-falantes podem tocar relativamente alto (###valor### dB)
Graves 100 - 315Hz
(±) | graves reduzidos - em média 11.3% menor que a mediana
(±) | a linearidade dos graves é média (14.2% delta para a frequência anterior)
Médios 400 - 2.000 Hz
(+) | médios equilibrados - apenas 2.4% longe da mediana
(+) | médios são lineares (5.5% delta para frequência anterior)
Altos 2 - 16 kHz
(+) | agudos equilibrados - apenas 2% longe da mediana
(+) | os máximos são lineares (4.5% delta da frequência anterior)
Geral 100 - 16.000 Hz
(+) | o som geral é linear (10.2% diferença em relação à mediana)
Comparado com a mesma classe
» 7% de todos os dispositivos testados nesta classe foram melhores, 2% semelhantes, 91% piores
» O melhor teve um delta de 5%, a média foi 18%, o pior foi 53%
Comparado com todos os dispositivos testados
» 5% de todos os dispositivos testados foram melhores, 1% semelhantes, 94% piores
» O melhor teve um delta de 4%, a média foi 24%, o pior foi 134%
| desligado | |
| Ocioso | |
| Carga |
|
Key:
min: | |
| Huawei MateBook D 14 W00D-53010GXL R5 2500U, Vega 8, SK Hynix SC313 HFS256G39TNF, IPS, 1920x1080, 14" | HP ProBook 445 G6 R5 2500U, Vega 8, SK Hynix BC501 NVMe 256 GB, IPS, 1920x1080, 14" | Asus VivoBook 14 F412FJ-EB084T i5-8265U, GeForce MX230, Kingston RBU-SNS8180DS3512GJ, IPS, 1920x1080, 14" | Lenovo ThinkPad E485-20KU000NGE R5 2500U, Vega 8, Samsung PM961 MZVLW256HEHP, IPS, 1920x1080, 14" | Acer Swift 3 SF314-55-31N8 i3-8145U, UHD Graphics 620, Kingston RBUSNS8154P3128GJ, IPS, 1920x1080, 14" | Huawei MateBook D 14 W50F i5-8250U, UHD Graphics 620, SanDisk SD9SN8W256G1027, IPS, 1920x1080, 14" | Média AMD Radeon RX Vega 8 (Ryzen 2000/3000) | Média da turma Office | |
|---|---|---|---|---|---|---|---|---|
| Power Consumption | 6% | 2% | -7% | 30% | 18% | -7% | -5% | |
| Idle Minimum * (Watt) | 5.3 | 4.8 9% | 3.7 30% | 6.2 -17% | 2.9 45% | 3.7 30% | 5.68 ? -7% | 4.39 ? 17% |
| Idle Average * (Watt) | 7.8 | 6.9 12% | 6.1 22% | 8.6 -10% | 5.6 28% | 6.9 12% | 8.75 ? -12% | 7.35 ? 6% |
| Idle Maximum * (Watt) | 8.46 | 9.8 -16% | 8.3 2% | 9.7 -15% | 6.1 28% | 8.4 1% | 10.1 ? -19% | 8.56 ? -1% |
| Load Average * (Watt) | 36.9 | 35 5% | 43 -17% | 37.4 -1% | 29 21% | 32 13% | 37.8 ? -2% | 43.3 ? -17% |
| Load Maximum * (Watt) | 49.4 | 39.7 20% | 61.6 -25% | 44.8 9% | 35.3 29% | 32.6 34% | 46.2 ? 6% | 64.6 ? -31% |
* ... menor é melhor
| Huawei MateBook D 14 W00D-53010GXL R5 2500U, Vega 8, 57.4 Wh | HP ProBook 445 G6 R5 2500U, Vega 8, 45 Wh | Asus VivoBook 14 F412FJ-EB084T i5-8265U, GeForce MX230, 37 Wh | Lenovo ThinkPad E485-20KU000NGE R5 2500U, Vega 8, 45 Wh | Acer Swift 3 SF314-55-31N8 i3-8145U, UHD Graphics 620, 50.7 Wh | Huawei MateBook D 14 W50F i5-8250U, UHD Graphics 620, 57 Wh | Média da turma Office | |
|---|---|---|---|---|---|---|---|
| Duração da bateria | -28% | -39% | -42% | 13% | 21% | 25% | |
| Reader / Idle (h) | 19 | 10.4 -45% | 9.1 -52% | 23.6 24% | 23.7 ? 25% | ||
| WiFi v1.3 (h) | 9 | 5.9 -34% | 5.5 -39% | 5.4 -40% | 10.2 13% | 10 11% | 12.9 ? 43% |
| Load (h) | 1.7 | 1.6 -6% | 1.1 -35% | 2.2 29% | 1.794 ? 6% |
Pro
Contra
Verdict - A good performance with a mediocre display
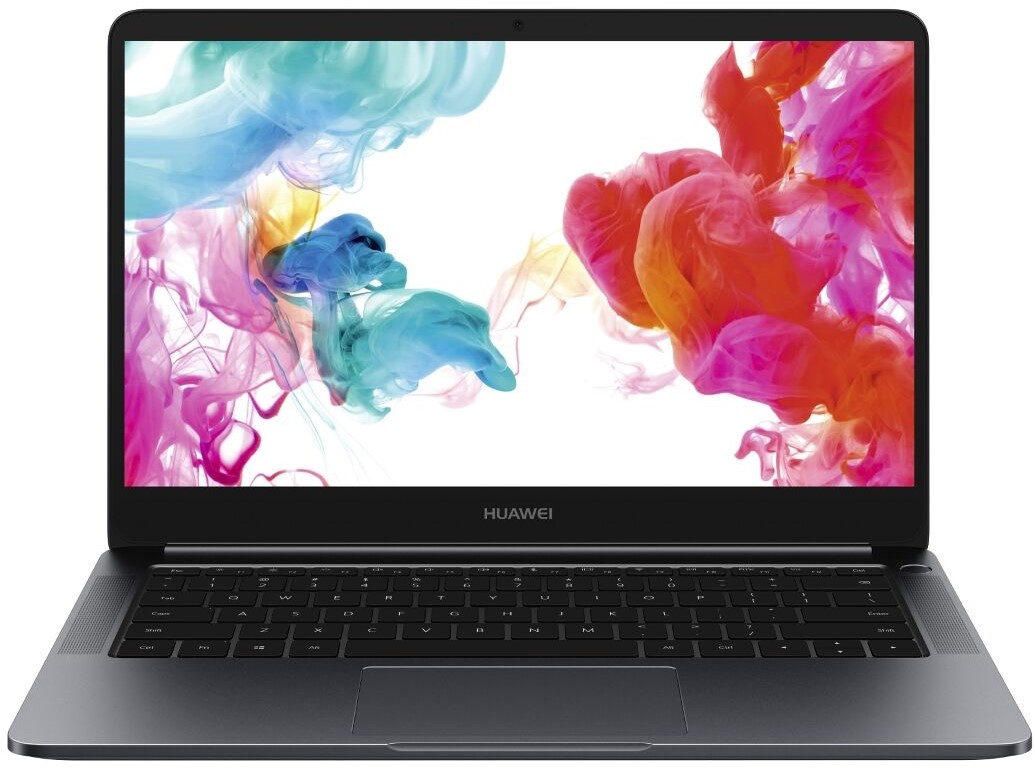
Enquanto a maioria dos outros fabricantes não oferece um bom desempenho com processadores AMD em seus casos estabelecidos, a Huawei demonstra uma boa implementação da tecnologia AMD em um portátil fino com o MateBook D. O desempenho está acima do modelo Intel, e somente a duração da bateria fica ligeiramente mais curta. No entanto, uma grande vantagem é a diferença de preço entre os dois dispositivos, já que o portátil com CPU AMD que testamos aqui está disponível por cerca de 300 Euros (~$335) menos que o modelo equipado com o processador Intel mais fraco.
O Huawei MateBook D oferece mais desempenho com o processador AMD, mas também herda os pontos fracos que já existiam na versão Intel.
Os pontos negativos listados anteriormente sobre a tela e equipamentos de conexão escassos foram transferidos da versão Intel e também impedem que o portátil Huawei obtenha uma avaliação mais alta desta vez. No geral, o dispositivo fino terá um visual apresentável em qualquer escritório e também será capaz de lidar com as demandas de tais ambientes no desempenho de portátil.
Huawei MateBook D 14 W00D-53010GXL
- 10/29/2019 v7 (old)
Mike Wobker
Price comparison
