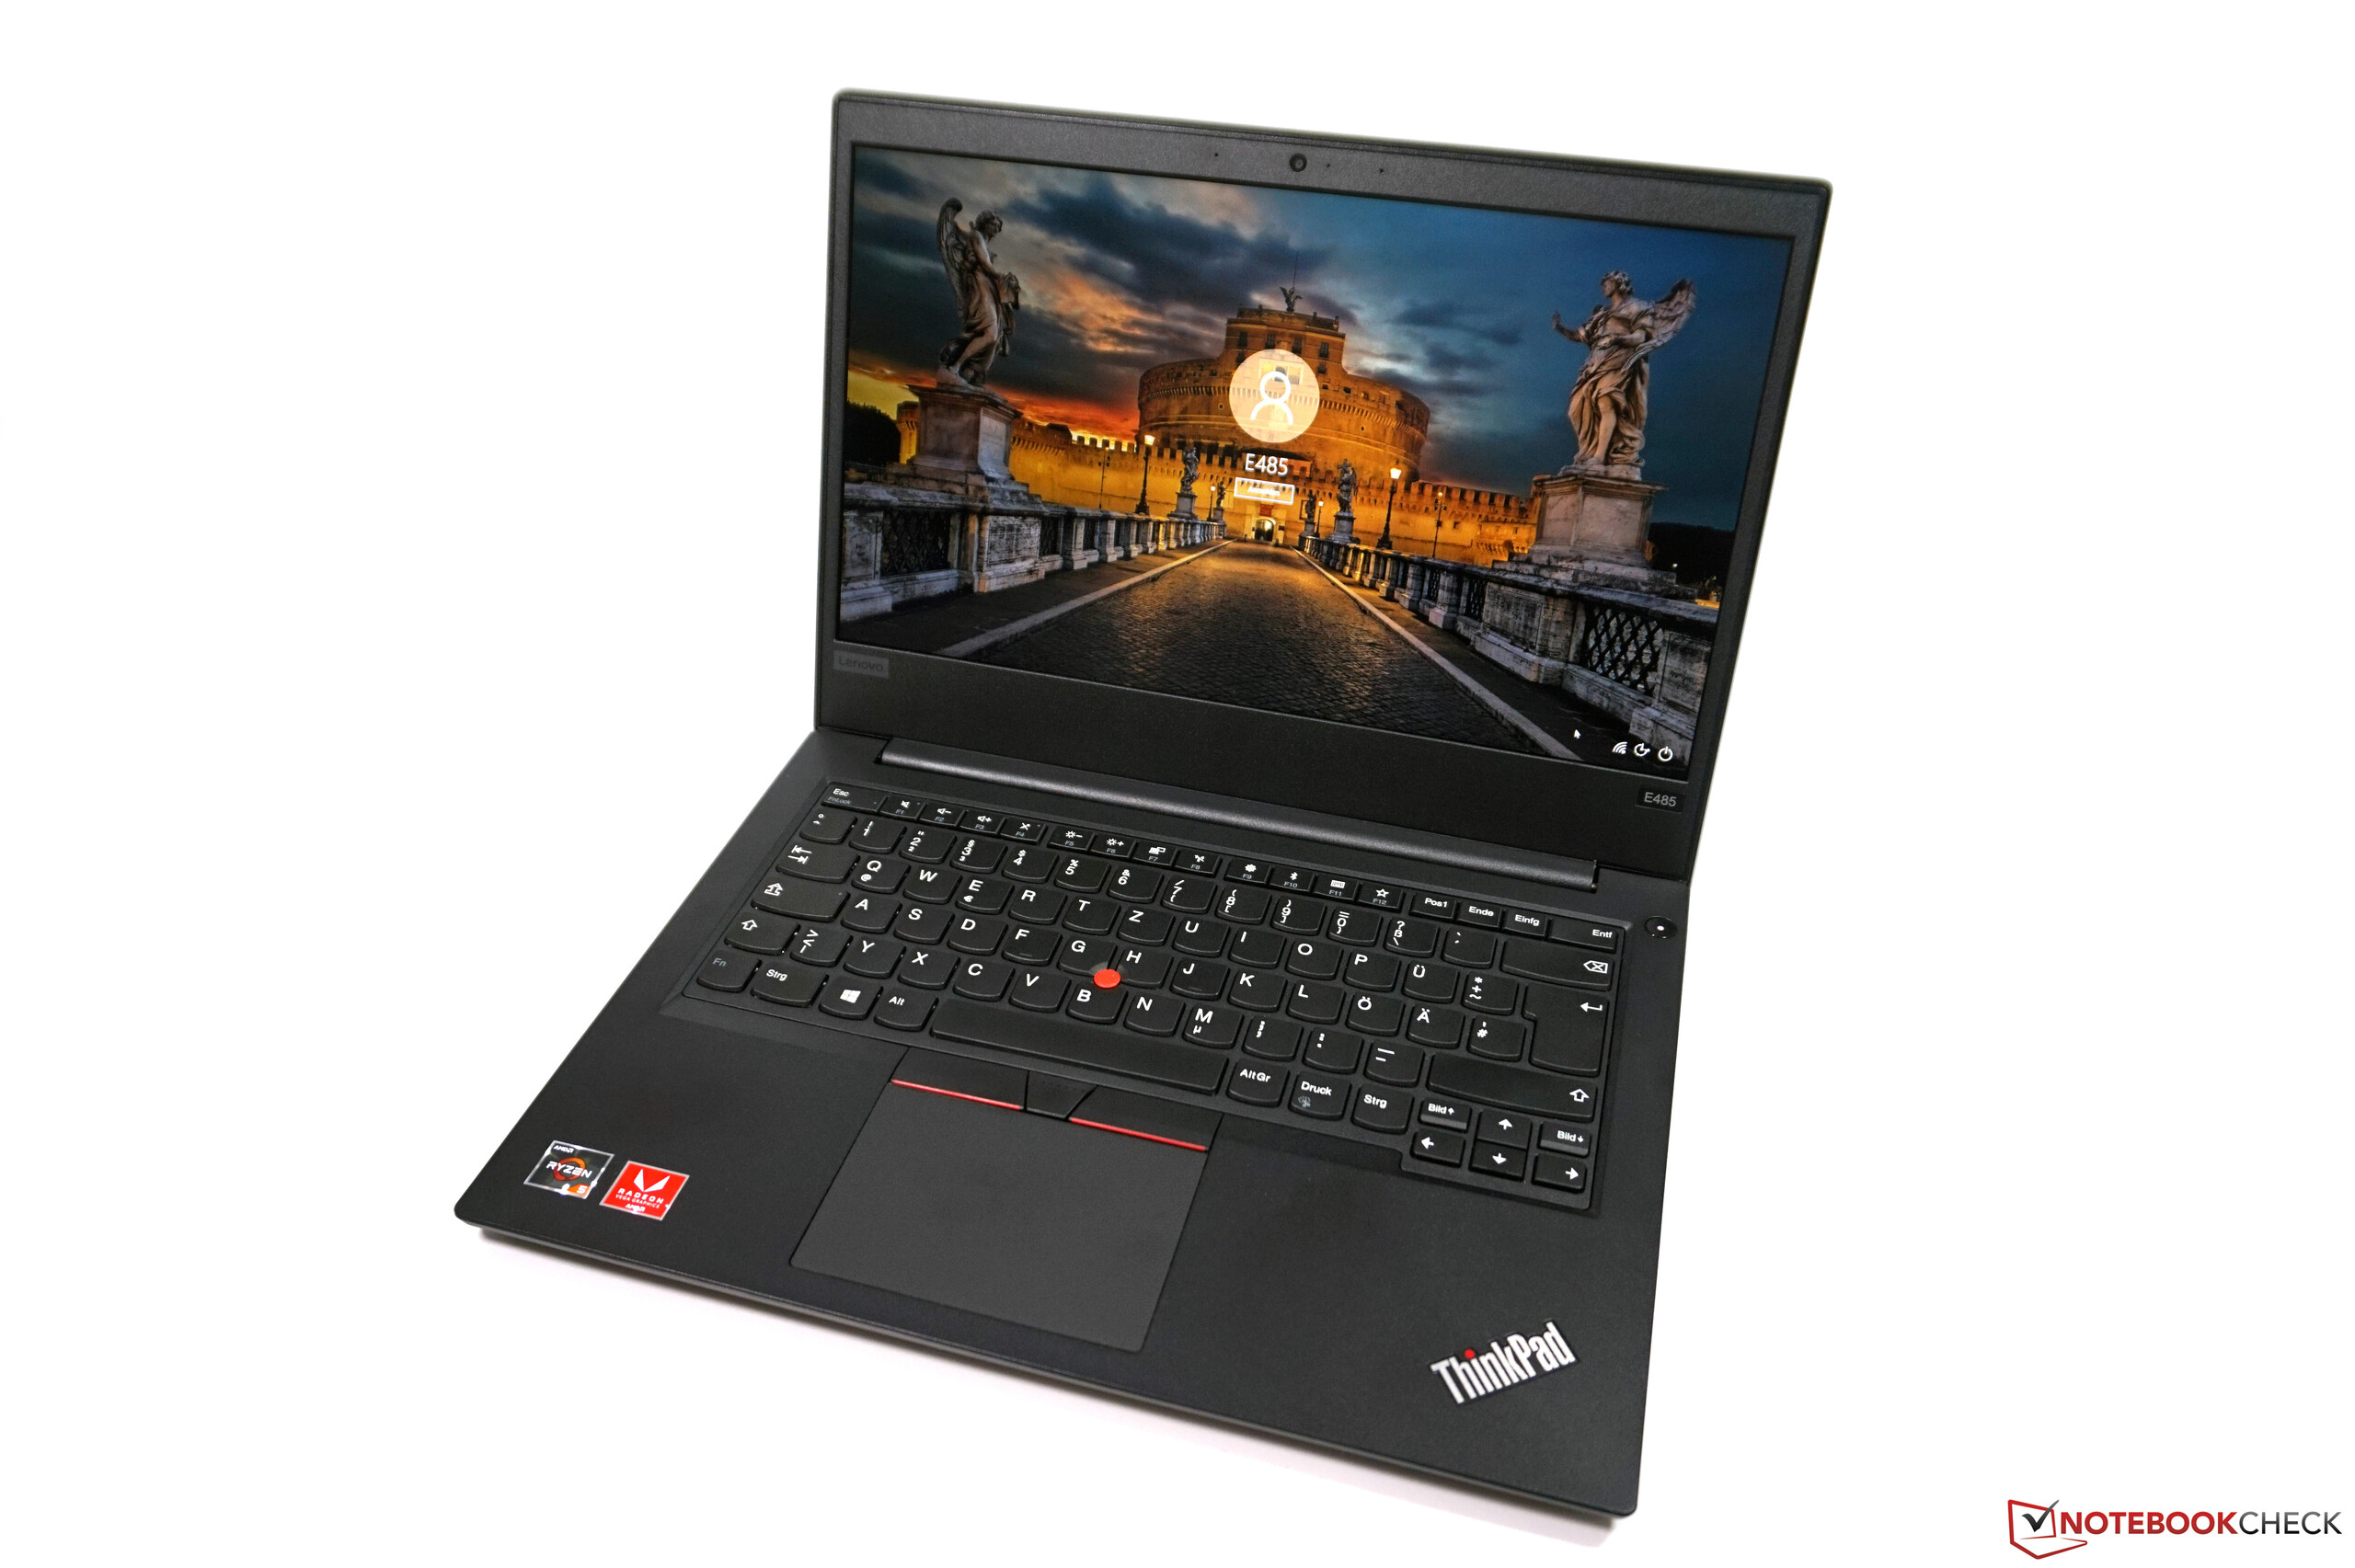
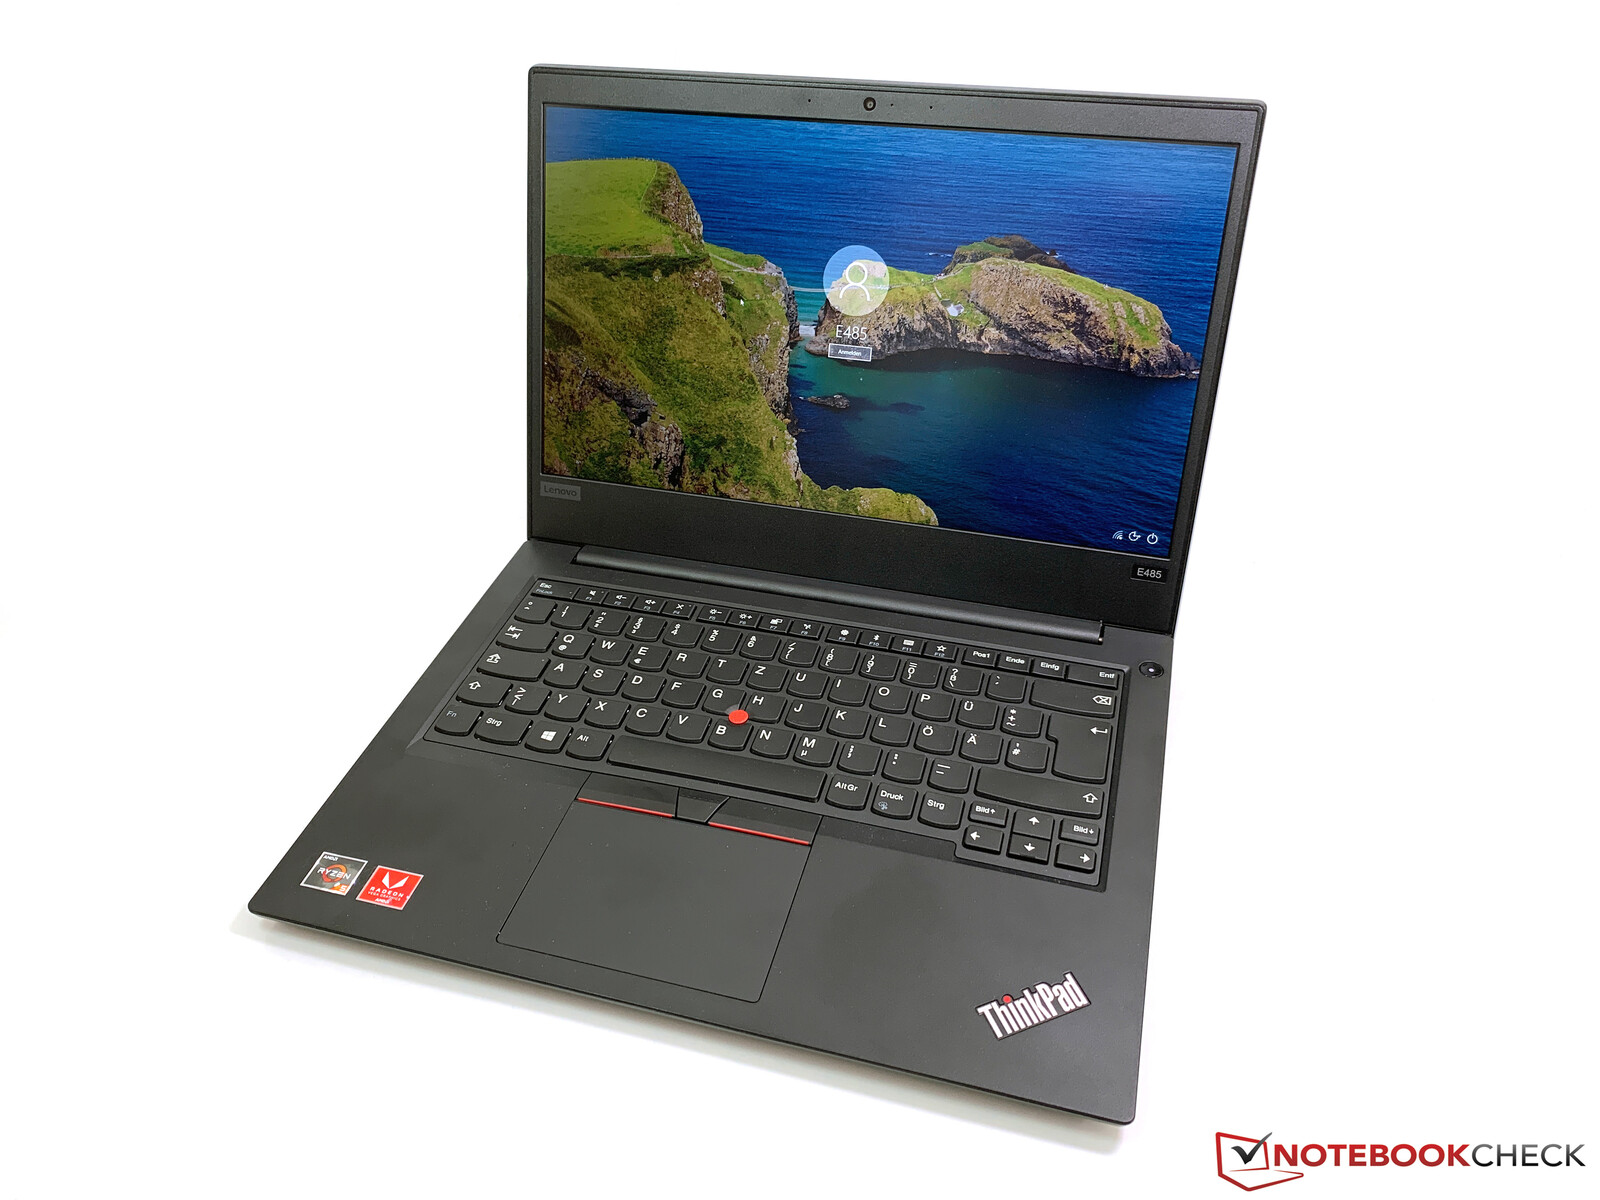
Breve Análise do Portátil Lenovo ThinkPad E485 (Ryzen 5, Vega 8)
| SD Card Reader | |
| average JPG Copy Test (av. of 3 runs) | |
| HP ProBook 440 G6-5TK01EA (Toshiba Exceria Pro SDXC 64 GB UHS-II) | |
| Lenovo ThinkPad E480-20KNCTO1WW (Toshiba Exceria Pro M501) | |
| Lenovo ThinkPad E485-20KU000NGE (Toshiba Exceria Pro M501) | |
| HP ProBook 645 G4 3UP62EA (Toshiba Exceria Pro M501 microSDXC 64GB) | |
| Média da turma Office (19.8 - 198.5, n=22, últimos 2 anos) | |
| Dell Latitude 3490 (Toshiba Exceria Pro SDXC 64 GB UHS-II) | |
| maximum AS SSD Seq Read Test (1GB) | |
| Lenovo ThinkPad E480-20KNCTO1WW (Toshiba Exceria Pro M501) | |
| HP ProBook 645 G4 3UP62EA (Toshiba Exceria Pro M501 microSDXC 64GB) | |
| Lenovo ThinkPad E485-20KU000NGE (Toshiba Exceria Pro M501) | |
| HP ProBook 440 G6-5TK01EA (Toshiba Exceria Pro SDXC 64 GB UHS-II) | |
| Média da turma Office (27.4 - 249, n=21, últimos 2 anos) | |
| Dell Latitude 3490 (Toshiba Exceria Pro SDXC 64 GB UHS-II) | |
| |||||||||||||||||||||||||
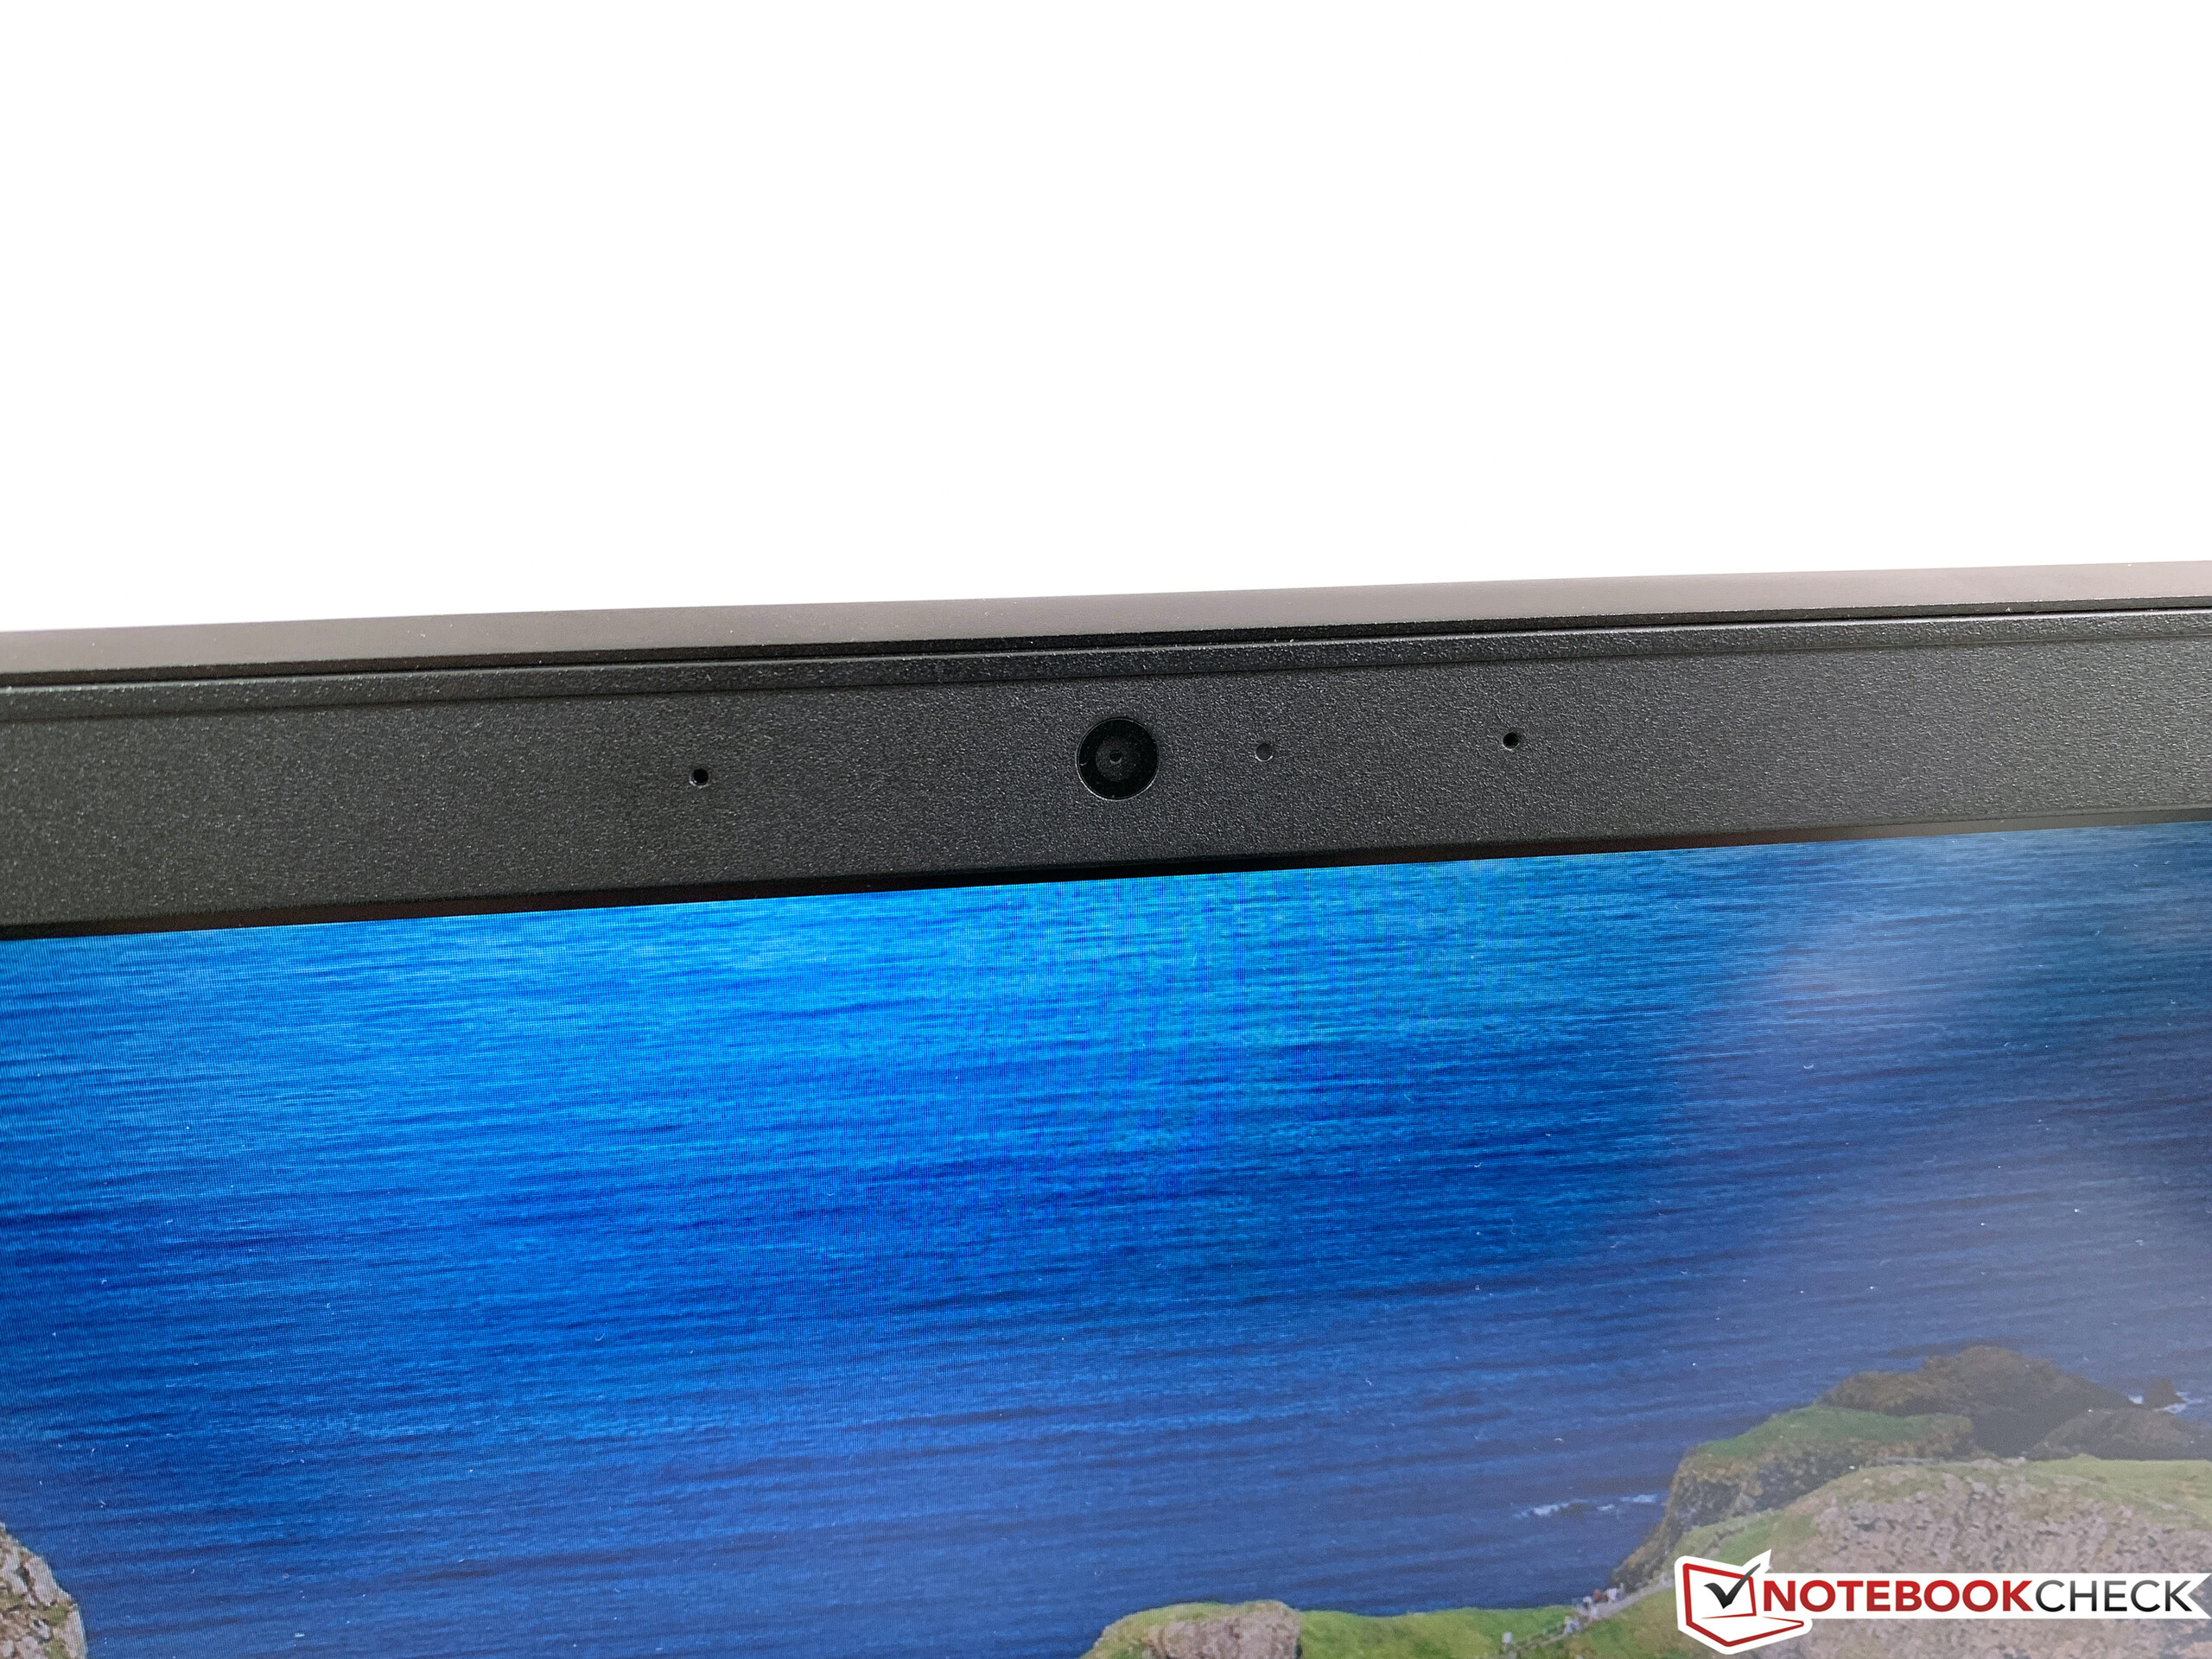
iluminação: 87 %
iluminação com acumulador: 289 cd/m²
Contraste: 1521:1 (Preto: 0.19 cd/m²)
ΔE ColorChecker Calman: 5.6 | ∀{0.5-29.43 Ø4.73}
calibrated: 4.7
ΔE Greyscale Calman: 2.7 | ∀{0.09-98 Ø4.97}
58.5% sRGB (Argyll 1.6.3 3D)
37.2% AdobeRGB 1998 (Argyll 1.6.3 3D)
39.76% AdobeRGB 1998 (Argyll 3D)
57.9% sRGB (Argyll 3D)
38.48% Display P3 (Argyll 3D)
Gamma: 1.96
CCT: 6506 K
| Lenovo ThinkPad E485-20KU000NGE B140HAN04.2, , 1920x1080, 14" | Lenovo ThinkPad E480-20KNCTO1WW Innolux N140HCA-EAC, , 1920x1080, 14" | HP ProBook 645 G4 3UP62EA Innolux N140HCA-EAB, , 1920x1080, 14" | Dell Latitude 3490 LP140WF6 / LGD059D, , 1920x1080, 14" | HP ProBook 440 G6-5TK01EA LG Philips, LGD05F1, , 1920x1080, 14" | |
|---|---|---|---|---|---|
| Display | 6% | 4% | 2% | -3% | |
| Display P3 Coverage (%) | 39.21 38.48 | 41.56 6% | 40.67 4% | 39.81 2% | 38.08 -3% |
| sRGB Coverage (%) | 58.8 57.9 | 62.2 6% | 61.2 4% | 59.6 1% | 57.2 -3% |
| AdobeRGB 1998 Coverage (%) | 40.52 39.76 | 42.96 6% | 42.03 4% | 41.16 2% | 39.37 -3% |
| Response Times | 4% | 25% | 24% | 13% | |
| Response Time Grey 50% / Grey 80% * (ms) | 44.8 ? | 44.8 ? -0% | 33 ? 26% | 36.4 ? 19% | 41.6 ? 7% |
| Response Time Black / White * (ms) | 33.6 ? | 31.2 ? 7% | 26 ? 23% | 24 ? 29% | 27.2 ? 19% |
| PWM Frequency (Hz) | 25000 ? | 100 ? | |||
| Screen | -20% | -27% | -12% | -12% | |
| Brightness middle (cd/m²) | 289 | 262 -9% | 225 -22% | 250 -13% | 256 -11% |
| Brightness (cd/m²) | 271 | 245 -10% | 209 -23% | 241 -11% | 238 -12% |
| Brightness Distribution (%) | 87 | 83 -5% | 89 2% | 81 -7% | 85 -2% |
| Black Level * (cd/m²) | 0.19 | 0.19 -0% | 0.68 -258% | 0.25 -32% | 0.23 -21% |
| Contrast (:1) | 1521 | 1379 -9% | 331 -78% | 1000 -34% | 1113 -27% |
| Colorchecker dE 2000 * | 5.6 | 7 -25% | 4.54 19% | 5.5 2% | 6.2 -11% |
| Colorchecker dE 2000 max. * | 20.8 | 23.6 -13% | 7.2 65% | 23.5 -13% | 18.2 13% |
| Colorchecker dE 2000 calibrated * | 4.7 | 2.87 39% | 4.8 -2% | 5.2 -11% | |
| Greyscale dE 2000 * | 2.7 | 6.4 -137% | 4.14 -53% | 3.5 -30% | 3.8 -41% |
| Gamma | 1.96 112% | 2.14 103% | 2.13 103% | 2.27 97% | 2.5 88% |
| CCT | 6506 100% | 6065 107% | 6624 98% | 7049 92% | 6643 98% |
| Color Space (Percent of AdobeRGB 1998) (%) | 37.2 | 39.5 6% | 39 5% | 37.9 2% | 36.1 -3% |
| Color Space (Percent of sRGB) (%) | 58.5 | 61.9 6% | 61 4% | 59.4 2% | 56.9 -3% |
| Média Total (Programa/Configurações) | -3% /
-11% | 1% /
-15% | 5% /
-5% | -1% /
-7% |
* ... menor é melhor
Exibir tempos de resposta
| ↔ Tempo de resposta preto para branco | ||
|---|---|---|
| 33.6 ms ... ascensão ↗ e queda ↘ combinadas | ↗ 18 ms ascensão | 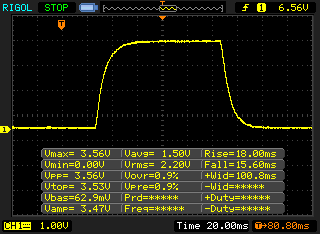 |
| ↘ 15.6 ms queda | ||
| A tela mostra taxas de resposta lentas em nossos testes e será insatisfatória para os jogadores. Em comparação, todos os dispositivos testados variam de 0.1 (mínimo) a 240 (máximo) ms. » 90 % de todos os dispositivos são melhores. Isso significa que o tempo de resposta medido é pior que a média de todos os dispositivos testados (19.9 ms). | ||
| ↔ Tempo de resposta 50% cinza a 80% cinza | ||
| 44.8 ms ... ascensão ↗ e queda ↘ combinadas | ↗ 20.4 ms ascensão | 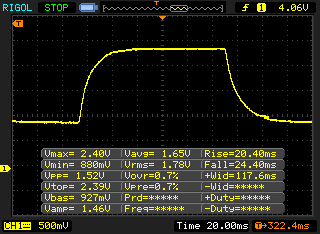 |
| ↘ 24.4 ms queda | ||
| A tela mostra taxas de resposta lentas em nossos testes e será insatisfatória para os jogadores. Em comparação, todos os dispositivos testados variam de 0.165 (mínimo) a 636 (máximo) ms. » 76 % de todos os dispositivos são melhores. Isso significa que o tempo de resposta medido é pior que a média de todos os dispositivos testados (31.1 ms). | ||
Cintilação da tela / PWM (modulação por largura de pulso)
| Tela tremeluzindo / PWM não detectado | 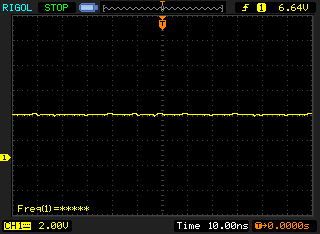 | ||
[pwm_comparison] Em comparação: 52 % de todos os dispositivos testados não usam PWM para escurecer a tela. Se PWM foi detectado, uma média de 7784 (mínimo: 5 - máximo: 343500) Hz foi medida. | |||
| PCMark 8 Home Score Accelerated v2 | 3550 pontos | |
| PCMark 8 Creative Score Accelerated v2 | 4249 pontos | |
| PCMark 8 Work Score Accelerated v2 | 4870 pontos | |
| PCMark 10 Score | 3321 pontos | |
Ajuda | ||
| Lenovo ThinkPad E485-20KU000NGE Samsung PM961 MZVLW256HEHP | Lenovo ThinkPad E480-20KNCTO1WW Toshiba KBG30ZMT128G | HP ProBook 645 G4 3UP62EA Toshiba XG5 KXG50ZNV256G | Dell Latitude 3490 SK hynix SC311 M.2 | HP ProBook 440 G6-5TK01EA Toshiba XG5 KXG50ZNV512G | Média Samsung PM961 MZVLW256HEHP | |
|---|---|---|---|---|---|---|
| AS SSD | -82% | -47% | -45% | -2% | -59% | |
| Score Total (Points) | 2478 | 638 -74% | 1290 -48% | 1006 -59% | 2040 -18% | 2565 ? 4% |
| Score Write (Points) | 575 | 182 -68% | 323 -44% | 387 -33% | 669 16% | 587 ? 2% |
| Score Read (Points) | 1277 | 324 -75% | 638 -50% | 409 -68% | 954 -25% | 1378 ? 8% |
| Access Time Write * (ms) | 0.059 | 0.235 -298% | 0.063 -7% | 0.052 12% | 0.047 20% | 0.4637 ? -686% |
| Access Time Read * (ms) | 0.054 | 0.106 -96% | 0.144 -167% | 0.097 -80% | 0.067 -24% | 0.06777 ? -25% |
| 4K-64 Write (MB/s) | 371.5 | 92.1 -75% | 216 -42% | 286.1 -23% | 499.5 34% | 419 ? 13% |
| 4K-64 Read (MB/s) | 1035 | 190.9 -82% | 433.3 -58% | 332.7 -68% | 724 -30% | 1112 ? 7% |
| 4K Write (MB/s) | 63.9 | 78.9 23% | 76.8 20% | 68.9 8% | 119.7 87% | 91.6 ? 43% |
| 4K Read (MB/s) | 38.63 | 31.13 -19% | 25.35 -34% | 27.67 -28% | 31.17 -19% | 45.1 ? 17% |
| Seq Write (MB/s) | 1395 | 115.4 -92% | 305.2 -78% | 318.8 -77% | 493.6 -65% | 960 ? -31% |
| Seq Read (MB/s) | 2030 | 1015 -50% | 1797 -11% | 484.7 -76% | 1983 -2% | 2019 ? -1% |
* ... menor é melhor

| 3DMark 11 - 1280x720 Performance GPU | |
| Média da turma Office (2551 - 18313, n=68, últimos 2 anos) | |
| Lenovo ThinkPad E485-20KU000NGE | |
| Média AMD Radeon RX Vega 8 (Ryzen 2000/3000) (1668 - 4317, n=44) | |
| HP ProBook 645 G4 3UP62EA | |
| Lenovo ThinkPad E485-20KU000NGE | |
| HP ProBook 440 G6-5TK01EA | |
| Dell Latitude 3490 | |
| Lenovo ThinkPad E480-20KNCTO1WW | |
| 3DMark - 1920x1080 Fire Strike Graphics | |
| Média da turma Office (736 - 21871, n=73, últimos 2 anos) | |
| Lenovo ThinkPad E485-20KU000NGE | |
| Média AMD Radeon RX Vega 8 (Ryzen 2000/3000) (1095 - 2901, n=41) | |
| HP ProBook 645 G4 3UP62EA | |
| Lenovo ThinkPad E485-20KU000NGE | |
| HP ProBook 440 G6-5TK01EA | |
| Dell Latitude 3490 | |
| Lenovo ThinkPad E480-20KNCTO1WW | |
| 3DMark 11 Performance | 2807 pontos | |
| 3DMark Cloud Gate Standard Score | 7035 pontos | |
| 3DMark Fire Strike Score | 1469 pontos | |
Ajuda | ||
| BioShock Infinite - 1920x1080 Ultra Preset, DX11 (DDOF) | |
| Lenovo ThinkPad E480-20KQS00000 | |
| Lenovo ThinkPad E485-20KU000NGE | |
| Média AMD Radeon RX Vega 8 (Ryzen 2000/3000) (7.6 - 28, n=30) | |
| Lenovo ThinkPad E485-20KU000NGE | |
| HP ProBook 645 G4 3UP62EA | |
| HP ProBook 440 G6-5TK01EA | |
| Dell Latitude 3490 | |
| Lenovo ThinkPad E480-20KNCTO1WW | |
| Rise of the Tomb Raider | |
| 1024x768 Lowest Preset | |
| Lenovo ThinkPad E485-20KU000NGE | |
| Média AMD Radeon RX Vega 8 (Ryzen 2000/3000) (27.7 - 49.3, n=10) | |
| Lenovo ThinkPad E485-20KU000NGE | |
| HP ProBook 645 G4 3UP62EA | |
| HP ProBook 440 G6-5TK01EA | |
| Lenovo ThinkPad E480-20KNCTO1WW | |
| 1920x1080 High Preset AA:FX AF:4x | |
| Lenovo ThinkPad E485-20KU000NGE | |
| Média AMD Radeon RX Vega 8 (Ryzen 2000/3000) (5.9 - 15.4, n=11) | |
| Lenovo ThinkPad E485-20KU000NGE | |
| HP ProBook 645 G4 3UP62EA | |
| HP ProBook 440 G6-5TK01EA | |
| Lenovo ThinkPad E480-20KNCTO1WW | |
| baixo | média | alto | ultra | |
|---|---|---|---|---|
| BioShock Infinite (2013) | 74.4 | 13.26 | ||
| Rise of the Tomb Raider (2016) | 30.4 | 10.8 | ||
| Doom (2016) | 25.1 | 10.4 | ||
| Civilization 6 (2016) | 56.3 | 12.4 | ||
| Star Wars Battlefront 2 (2017) | 26.5 | 9.1 |
Barulho
| Ocioso |
| 29.4 / 29.4 / 31.2 dB |
| Carga |
| 32.7 / 35.3 dB |
 | ||
30 dB silencioso 40 dB(A) audível 50 dB(A) ruidosamente alto |
||
min: | ||
| Lenovo ThinkPad E485-20KU000NGE Vega 8, R5 2500U, Samsung PM961 MZVLW256HEHP | Lenovo ThinkPad E480-20KNCTO1WW UHD Graphics 620, i5-8250U, Toshiba KBG30ZMT128G | HP ProBook 645 G4 3UP62EA Vega 8, R5 PRO 2500U, Toshiba XG5 KXG50ZNV256G | Dell Latitude 3490 UHD Graphics 620, i5-8250U, SK hynix SC311 M.2 | HP ProBook 440 G6-5TK01EA UHD Graphics 620, i7-8565U, Toshiba XG5 KXG50ZNV512G | |
|---|---|---|---|---|---|
| Noise | 2% | -4% | -7% | 2% | |
| desligado / ambiente * (dB) | 29.4 | 29.1 1% | 30.8 -5% | 29.8 -1% | 29.4 -0% |
| Idle Minimum * (dB) | 29.4 | 29.1 1% | 30.8 -5% | 29.8 -1% | 29.4 -0% |
| Idle Average * (dB) | 29.4 | 29.1 1% | 30.8 -5% | 29.8 -1% | 29.4 -0% |
| Idle Maximum * (dB) | 31.2 | 30.3 3% | 30.8 1% | 29.8 4% | 30.2 3% |
| Load Average * (dB) | 32.7 | 31.8 3% | 34.7 -6% | 39.1 -20% | 31.8 3% |
| Load Maximum * (dB) | 35.3 | 33.8 4% | 36.4 -3% | 44.3 -25% | 33.1 6% |
* ... menor é melhor
(±) A temperatura máxima no lado superior é 42.3 °C / 108 F, em comparação com a média de 34.3 °C / 94 F , variando de 21.2 a 62.5 °C para a classe Office.
(-) A parte inferior aquece até um máximo de 45.2 °C / 113 F, em comparação com a média de 36.8 °C / 98 F
(+) Em uso inativo, a temperatura média para o lado superior é 26.9 °C / 80 F, em comparação com a média do dispositivo de 29.5 °C / ### class_avg_f### F.
(+) Os apoios para as mãos e o touchpad são mais frios que a temperatura da pele, com um máximo de 25.7 °C / 78.3 F e, portanto, são frios ao toque.
(±) A temperatura média da área do apoio para as mãos de dispositivos semelhantes foi 27.5 °C / 81.5 F (+1.8 °C / 3.2 F).
Lenovo ThinkPad E485-20KU000NGE análise de áudio
(-) | alto-falantes não muito altos (###valor### dB)
Graves 100 - 315Hz
(-) | quase nenhum baixo - em média 21.5% menor que a mediana
(±) | a linearidade dos graves é média (12.6% delta para a frequência anterior)
Médios 400 - 2.000 Hz
(+) | médios equilibrados - apenas 4.3% longe da mediana
(±) | a linearidade dos médios é média (8.5% delta para frequência anterior)
Altos 2 - 16 kHz
(+) | agudos equilibrados - apenas 2.8% longe da mediana
(+) | os máximos são lineares (6.2% delta da frequência anterior)
Geral 100 - 16.000 Hz
(±) | a linearidade do som geral é média (26.4% diferença em relação à mediana)
Comparado com a mesma classe
» 81% de todos os dispositivos testados nesta classe foram melhores, 7% semelhantes, 13% piores
» O melhor teve um delta de 7%, a média foi 21%, o pior foi 53%
Comparado com todos os dispositivos testados
» 81% de todos os dispositivos testados foram melhores, 4% semelhantes, 15% piores
» O melhor teve um delta de 4%, a média foi 24%, o pior foi 134%
HP ProBook 440 G6-5TK01EA análise de áudio
(±) | o volume do alto-falante é médio, mas bom (###valor### dB)
Graves 100 - 315Hz
(-) | quase nenhum baixo - em média 17.2% menor que a mediana
(±) | a linearidade dos graves é média (12.1% delta para a frequência anterior)
Médios 400 - 2.000 Hz
(+) | médios equilibrados - apenas 3.3% longe da mediana
(+) | médios são lineares (6.7% delta para frequência anterior)
Altos 2 - 16 kHz
(±) | máximos mais altos - em média 5.7% maior que a mediana
(±) | a linearidade dos máximos é média (7.1% delta para frequência anterior)
Geral 100 - 16.000 Hz
(±) | a linearidade do som geral é média (20.8% diferença em relação à mediana)
Comparado com a mesma classe
» 48% de todos os dispositivos testados nesta classe foram melhores, 9% semelhantes, 42% piores
» O melhor teve um delta de 7%, a média foi 21%, o pior foi 53%
Comparado com todos os dispositivos testados
» 56% de todos os dispositivos testados foram melhores, 8% semelhantes, 36% piores
» O melhor teve um delta de 4%, a média foi 24%, o pior foi 134%
| desligado | |
| Ocioso | |
| Carga |
|
Key:
min: | |
| Lenovo ThinkPad E485-20KU000NGE R5 2500U, Vega 8, Samsung PM961 MZVLW256HEHP, IPS, 1920x1080, 14" | Lenovo ThinkPad E480-20KNCTO1WW i5-8250U, UHD Graphics 620, Toshiba KBG30ZMT128G, IPS LED, 1920x1080, 14" | HP ProBook 645 G4 3UP62EA R5 PRO 2500U, Vega 8, Toshiba XG5 KXG50ZNV256G, IPS, 1920x1080, 14" | Dell Latitude 3490 i5-8250U, UHD Graphics 620, SK hynix SC311 M.2, IPS LED, 1920x1080, 14" | HP ProBook 440 G6-5TK01EA i7-8565U, UHD Graphics 620, Toshiba XG5 KXG50ZNV512G, IPS, 1920x1080, 14" | Média AMD Radeon RX Vega 8 (Ryzen 2000/3000) | Média da turma Office | |
|---|---|---|---|---|---|---|---|
| Power Consumption | 29% | -9% | 8% | 24% | -0% | -1% | |
| Idle Minimum * (Watt) | 6.2 | 3.5 44% | 7.2 -16% | 3.2 48% | 2.98 52% | 5.68 ? 8% | 4.41 ? 29% |
| Idle Average * (Watt) | 8.6 | 5.3 38% | 9.7 -13% | 5.5 36% | 5.4 37% | 8.75 ? -2% | 7.37 ? 14% |
| Idle Maximum * (Watt) | 9.7 | 6.1 37% | 10.3 -6% | 8.1 16% | 7.9 19% | 10.1 ? -4% | 8.58 ? 12% |
| Load Average * (Watt) | 37.4 | 30 20% | 42 -12% | 40.8 -9% | 34.5 8% | 37.8 ? -1% | 43 ? -15% |
| Load Maximum * (Watt) | 44.8 | 42.3 6% | 44.2 1% | 68.1 -52% | 43.3 3% | 46.2 ? -3% | 64.6 ? -44% |
* ... menor é melhor
| Lenovo ThinkPad E485-20KU000NGE R5 2500U, Vega 8, 45 Wh | Lenovo ThinkPad E480-20KNCTO1WW i5-8250U, UHD Graphics 620, 45 Wh | HP ProBook 645 G4 3UP62EA R5 PRO 2500U, Vega 8, 48 Wh | Dell Latitude 3490 i5-8250U, UHD Graphics 620, 56 Wh | HP ProBook 440 G6-5TK01EA i7-8565U, UHD Graphics 620, 45 Wh | Média da turma Office | |
|---|---|---|---|---|---|---|
| Duração da bateria | 62% | 0% | 115% | 76% | 131% | |
| Reader / Idle (h) | 9.1 | 18.4 102% | 9.3 2% | 17.1 88% | 23.7 ? 160% | |
| H.264 (h) | 5.7 | 7.2 26% | 4.2 -26% | 7.6 33% | 15 ? 163% | |
| WiFi v1.3 (h) | 5.4 | 8.3 54% | 4.8 -11% | 11.6 115% | 8.4 56% | 12.9 ? 139% |
| Load (h) | 1.1 | 1.8 64% | 1.5 36% | 2.5 127% | 1.794 ? 63% |
Pro
Contra
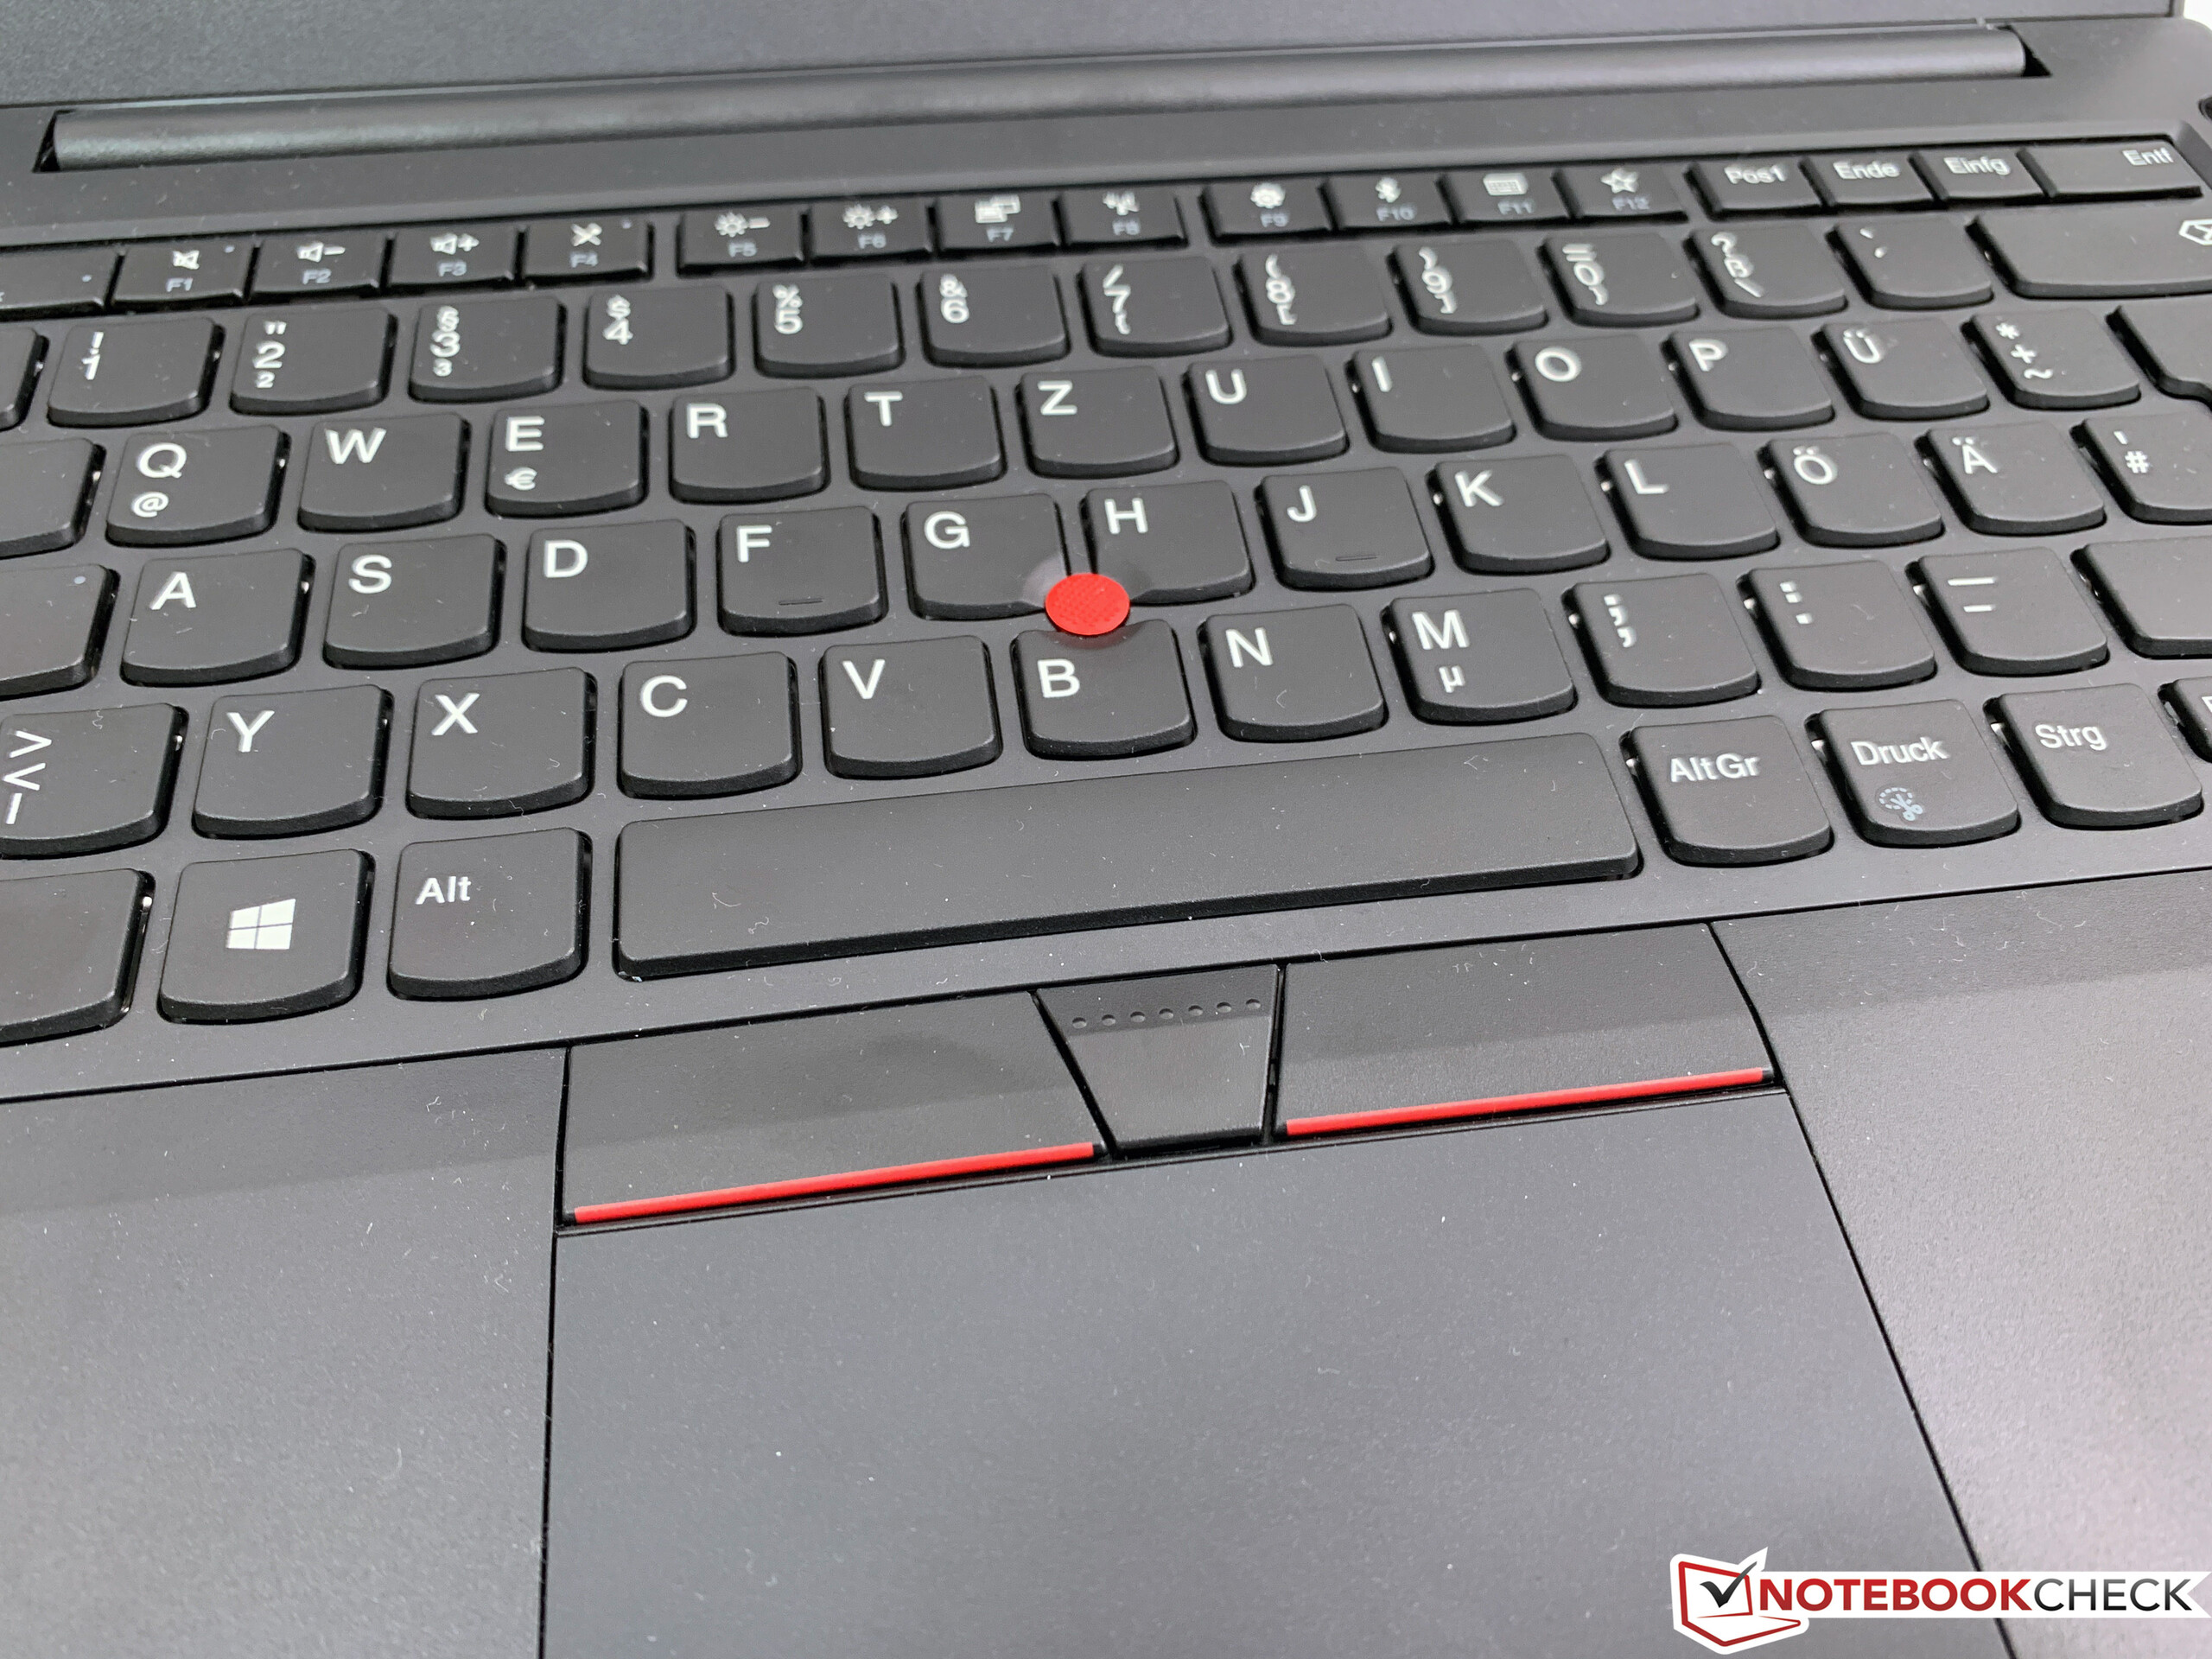
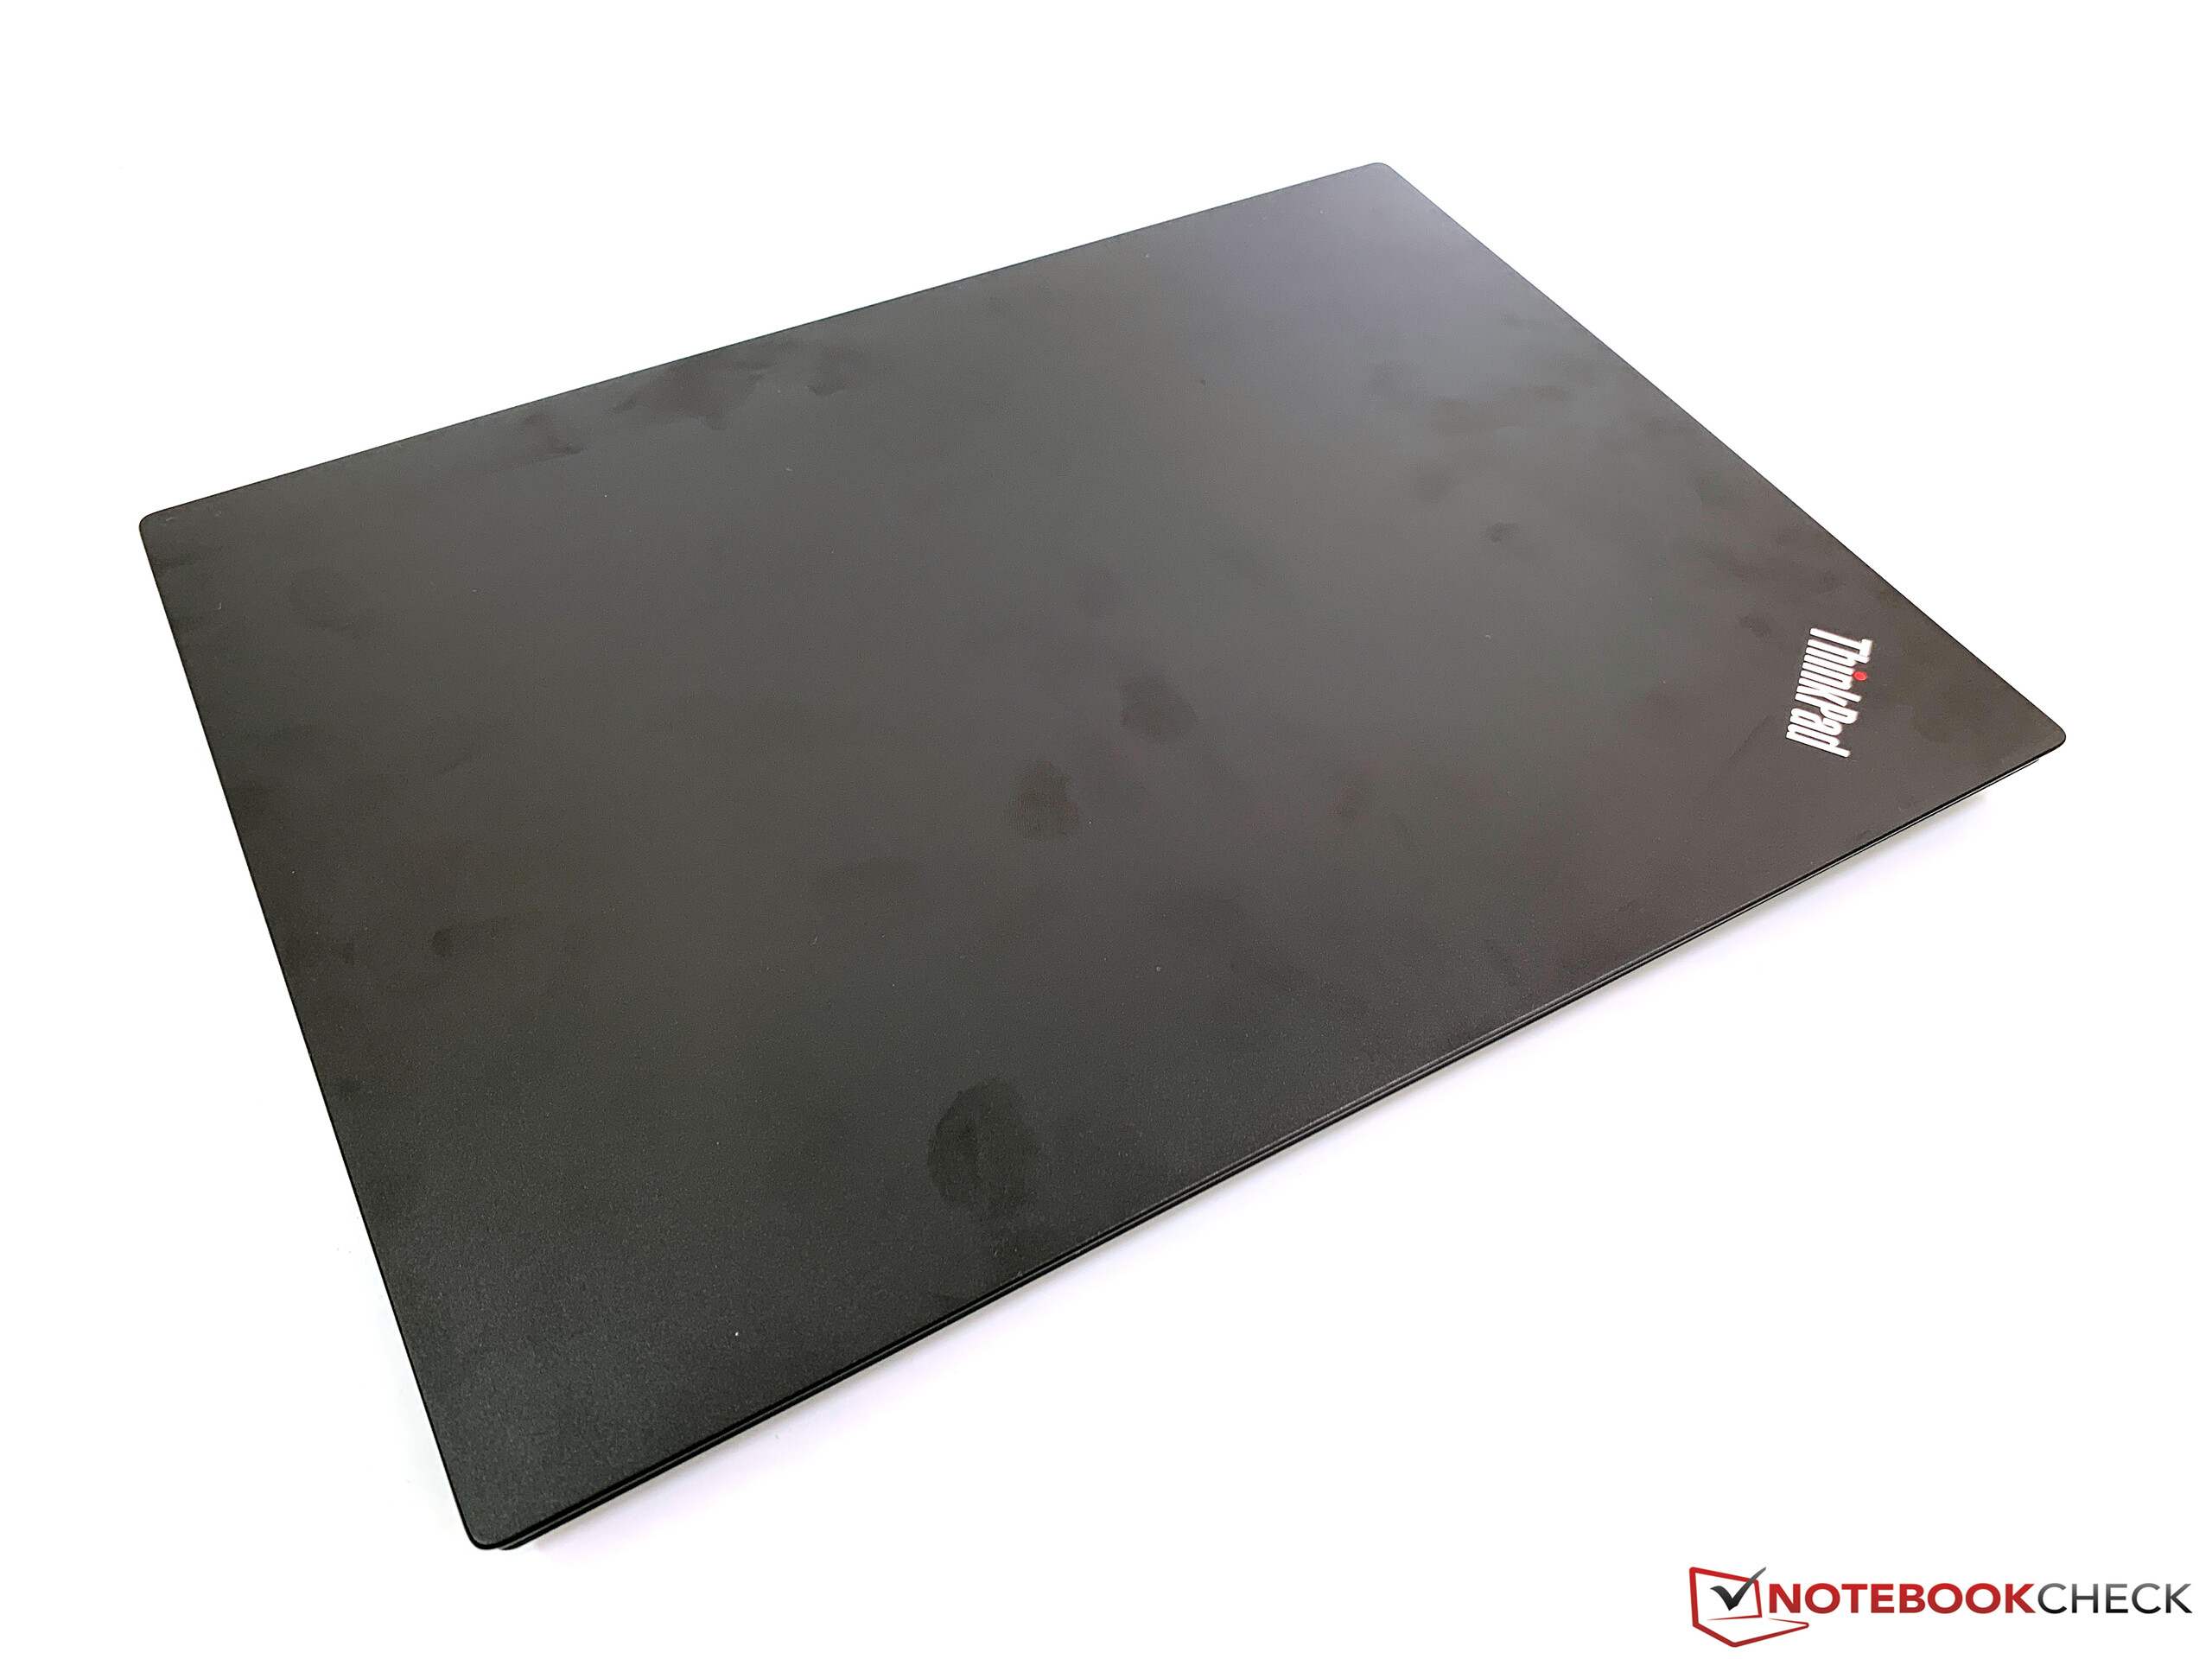
O ThinkPad E485 deixa uma impressão um pouco confusa. Olhando para ele por si só, é um sólido portátil empresarial de nível de entrada com uma carcaça robusta, uma tela decente e ótimos dispositivos de entrada. No entanto, se você compará-lo ao ThinkPad E480, o modelo supostamente idêntico com um processador Intel, existem várias diferenças. Estamos falando principalmente da falta da iluminação de fundo do teclado, que não está disponível nem como opção, e também do material plástico na parte superior da unidade base, que é de qualidade um pouco inferior. Às vezes, temos a sensação de que o fabricante quer distanciá-lo artificialmente dos modelos da Intel.
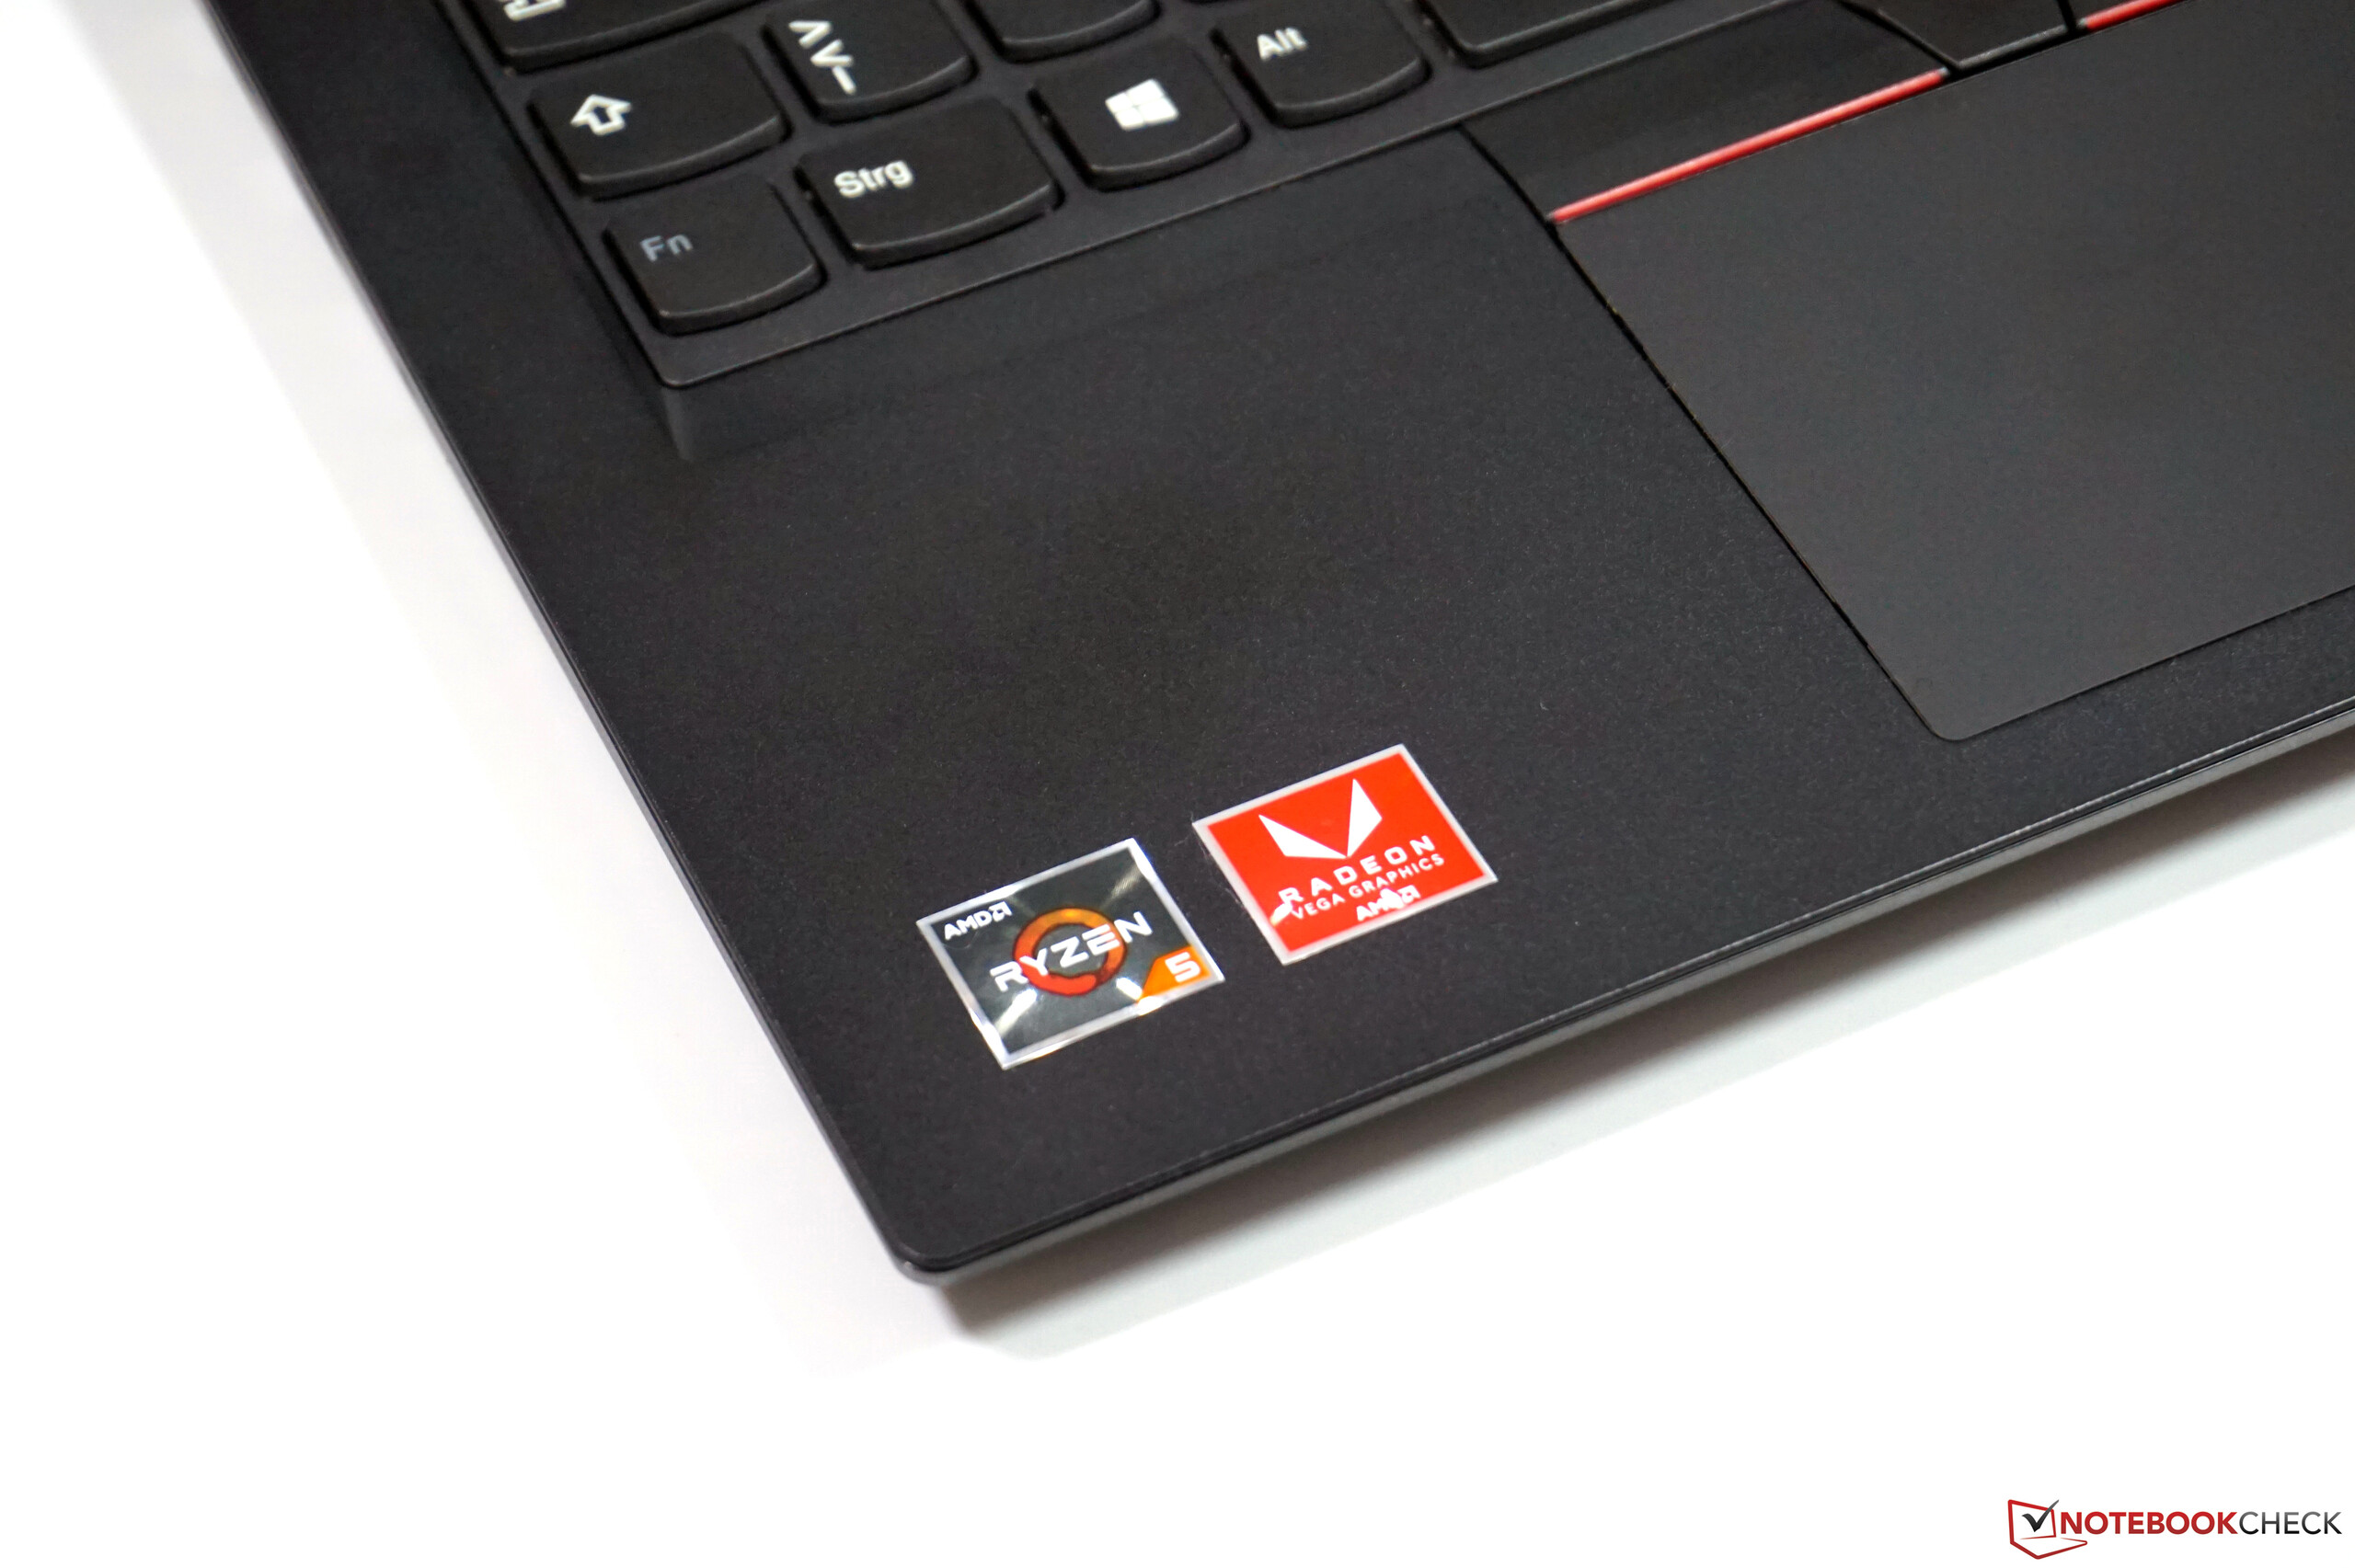
Por outro lado, há, claro, o preço mais baixo do ThinkPad E485 e a maioria dos usuários deve ser capaz de conviver com as diferenças nos materiais. Outra questão é o equipamento um pouco inferior. Embora todos saibam que as GPUs AMD integradas se beneficiam enormemente da RAM de canal duplo, infelizmente todos os modelos pré-configurados estão equipados apenas com um único módulo de RAM. Embora você possa atualizar de forma relativamente fácil, em princípio 8 GB devem ser suficientes para muitos usuários e mais RAM também custa mais. Teria sido melhor se a Lenovo tivesse colocado dois módulos de 4 GB diretamente. Mas o problema mais significativo é provavelmente o maior consumo de energia que leva a uma duração de bateria muito mais curta. Se isso é apenas devido a uma falta de otimização ou a plataforma da AMD simplesmente consome mais energia é uma questão diferente.
Uma oportunidade perdida: Comparado ao seu irmão Intel, o ThinkPad E485 mostra alguns pontos fracos que nada têm a ver com o seu processador AMD. Por exemplo, é incompreensível que os usuários do E485 tenham que se contentar em não ter luz de fundo do teclado. No entanto, quem pode viver com isso e também com a duração da bateria mais curta terá um dispositivo de nível de entrada muito sólido a um preço atraente com o ThinkPad E485.
O ThinkPad E485 também oferece toda uma série de vantagens que não são oferecidas nessa faixa de preço. O processador oferece desempenho mais que suficiente para a maioria das tarefas e, graças ao rápido SSD da Samsung, você pode esperar um dispositivo muito responsivo na operação cotidiana. Além disso, há uma tela IPS decente (no entanto, pode haver algumas pequenas diferenças dependendo do fornecedor). Particularmente para o baixo preço, podemos recomendar o E485 em qualquer caso.
Lenovo ThinkPad E485-20KU000NGE
- 04/05/2019 v6 (old)
Andreas Osthoff
Price comparison
