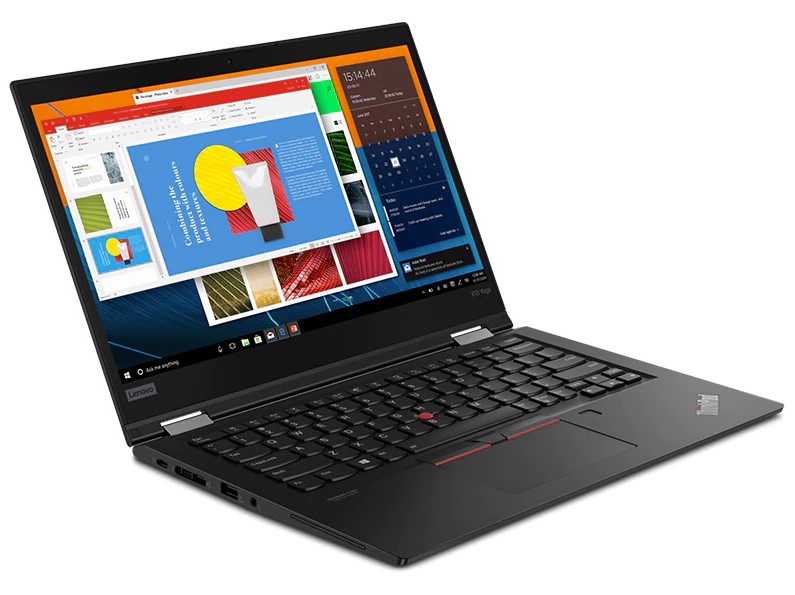
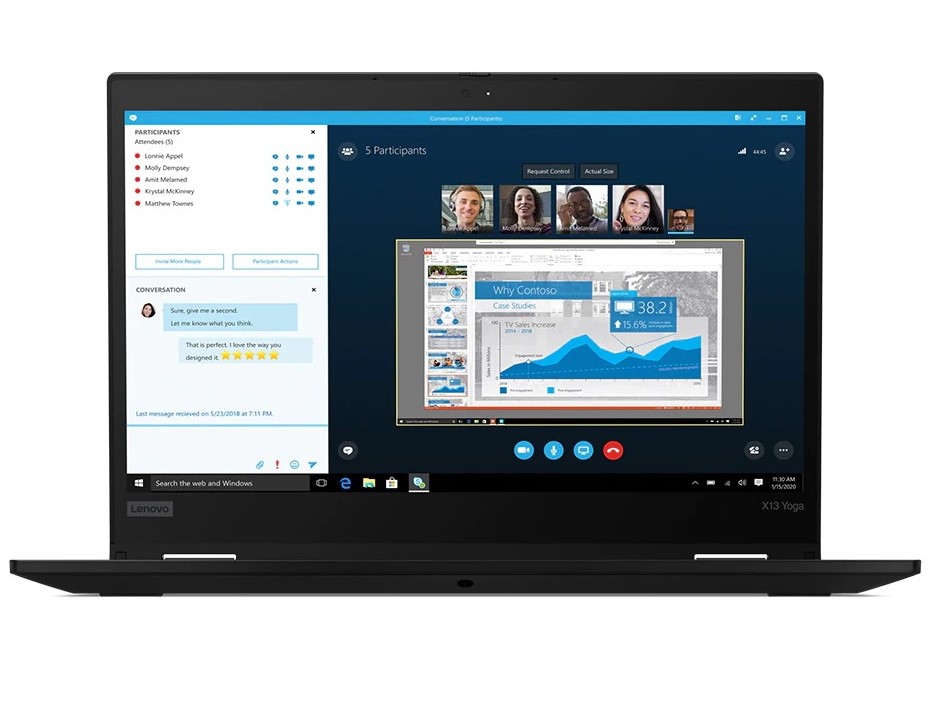
Breve Análise do Lenovo ThinkPad X13 Yoga: Conversível empresarial totalmente equipado
Avaliação | Data | Modelo | Peso | Altura | Size | Resolução | Preço |
|---|---|---|---|---|---|---|---|
| 87.9 % v7 (old) | 10/2020 | Lenovo ThinkPad X13 Yoga 20SX0004GE i7-10510U, UHD Graphics 620 | 1.3 kg | 15.95 mm | 13.30" | 1920x1080 | |
| 87.4 % v6 (old) | 06/2019 | Lenovo ThinkPad X390 Yoga-20NQS05R00 i7-8565U, UHD Graphics 620 | 1.3 kg | 15.95 mm | 13.30" | 1920x1080 | |
| 88.1 % v7 (old) | 09/2020 | Acer Spin 5 SP513-54N-79EY i7-1065G7, Iris Plus Graphics G7 (Ice Lake 64 EU) | 1.2 kg | 14.9 mm | 13.50" | 2256x1504 | |
| 80.7 % v7 (old) | 09/2020 | Asus VivoBook Flip 14 TM420IA R7 4700U, Vega 7 | 1.6 kg | 18.2 mm | 14.00" | 1920x1080 | |
| 80.4 % v7 (old) | 06/2020 | HP Envy x360 15-dr1679cl i7-10510U, UHD Graphics 620 | 2.1 kg | 17.2 mm | 15.60" | 1920x1080 |
| SD Card Reader | |
| average JPG Copy Test (av. of 3 runs) | |
| Lenovo ThinkPad X13 Yoga 20SX0004GE (Toshiba Exceria Pro M501 64 GB UHS-II) | |
| Lenovo ThinkPad X390 Yoga-20NQS05R00 (Toshiba Exceria Pro M501) | |
| HP Envy x360 15-dr1679cl (Toshiba Exceria Pro SDXC 64 GB UHS-II) | |
| Média da turma Office (19.8 - 198.5, n=22, últimos 2 anos) | |
| Asus VivoBook Flip 14 TM420IA (Toshiba Exceria Pro M501 microSDXC 64GB) | |
| Acer Spin 5 SP513-54N-79EY (Toshiba Exceria Pro M501 microSDXC 64GB) | |
| maximum AS SSD Seq Read Test (1GB) | |
| Lenovo ThinkPad X13 Yoga 20SX0004GE (Toshiba Exceria Pro M501 64 GB UHS-II) | |
| Lenovo ThinkPad X390 Yoga-20NQS05R00 (Toshiba Exceria Pro M501) | |
| HP Envy x360 15-dr1679cl (Toshiba Exceria Pro SDXC 64 GB UHS-II) | |
| Média da turma Office (27.4 - 249, n=21, últimos 2 anos) | |
| Asus VivoBook Flip 14 TM420IA (Toshiba Exceria Pro M501 microSDXC 64GB) | |
| Acer Spin 5 SP513-54N-79EY (Toshiba Exceria Pro M501 microSDXC 64GB) | |


| |||||||||||||||||||||||||
iluminação: 91 %
iluminação com acumulador: 401 cd/m²
Contraste: 2506:1 (Preto: 0.16 cd/m²)
ΔE ColorChecker Calman: 2.6 | ∀{0.5-29.43 Ø4.72}
calibrated: 0.9
ΔE Greyscale Calman: 3.3 | ∀{0.09-98 Ø4.97}
98.1% sRGB (Argyll 1.6.3 3D)
62.7% AdobeRGB 1998 (Argyll 1.6.3 3D)
69% AdobeRGB 1998 (Argyll 3D)
98.1% sRGB (Argyll 3D)
67.2% Display P3 (Argyll 3D)
Gamma: 2.01
CCT: 6076 K
| Lenovo ThinkPad X13 Yoga 20SX0004GE N133HCG-GR3, IPS, 1920x1080, 13.3" | Lenovo ThinkPad X390 Yoga-20NQS05R00 LP133WF7-SPA1, IPS LED, 1920x1080, 13.3" | Acer Spin 5 SP513-54N-79EY BOE08BC, IPS, 2256x1504, 13.5" | Asus VivoBook Flip 14 TM420IA BOE NV140FHM-N49, IPS, 1920x1080, 14" | HP Envy x360 15-dr1679cl AU Optronics B156HW02, IPS, 1920x1080, 15.6" | |
|---|---|---|---|---|---|
| Display | -2% | 3% | -39% | -41% | |
| Display P3 Coverage (%) | 67.2 | 65.2 -3% | 69.4 3% | 40.47 -40% | 39.28 -42% |
| sRGB Coverage (%) | 98.1 | 97 -1% | 99.6 2% | 60 -39% | 58.8 -40% |
| AdobeRGB 1998 Coverage (%) | 69 | 67.3 -2% | 71 3% | 41.81 -39% | 40.58 -41% |
| Response Times | -8% | 6% | 13% | 23% | |
| Response Time Grey 50% / Grey 80% * (ms) | 56 ? | 59.2 ? -6% | 49 ? 12% | 36.4 ? 35% | 39.6 ? 29% |
| Response Time Black / White * (ms) | 28 ? | 30.8 ? -10% | 28 ? -0% | 30.4 ? -9% | 23.6 ? 16% |
| PWM Frequency (Hz) | 208 ? | ||||
| Screen | -45% | 5% | -109% | -100% | |
| Brightness middle (cd/m²) | 401 | 319 -20% | 454 13% | 272.5 -32% | 261.2 -35% |
| Brightness (cd/m²) | 383 | 306 -20% | 426 11% | 260 -32% | 248 -35% |
| Brightness Distribution (%) | 91 | 90 -1% | 91 0% | 88 -3% | 92 1% |
| Black Level * (cd/m²) | 0.16 | 0.15 6% | 0.33 -106% | 0.42 -163% | 0.38 -138% |
| Contrast (:1) | 2506 | 2127 -15% | 1376 -45% | 649 -74% | 687 -73% |
| Colorchecker dE 2000 * | 2.6 | 6.1 -135% | 1.27 51% | 4.65 -79% | 5.4 -108% |
| Colorchecker dE 2000 max. * | 4.2 | 9.7 -131% | 2.42 42% | 17.78 -323% | 16.31 -288% |
| Colorchecker dE 2000 calibrated * | 0.9 | 1 -11% | 0.78 13% | 4.34 -382% | 3.81 -323% |
| Greyscale dE 2000 * | 3.3 | 8.6 -161% | 1.07 68% | 4.4 -33% | 4.1 -24% |
| Gamma | 2.01 109% | 2.62 84% | 2.39 92% | 2.2 100% | 2.53 87% |
| CCT | 6076 107% | 6613 98% | 6530 100% | 6984 93% | 6611 98% |
| Color Space (Percent of AdobeRGB 1998) (%) | 62.7 | 61.9 -1% | 65 4% | 38.4 -39% | 37.4 -40% |
| Color Space (Percent of sRGB) (%) | 98.1 | 96.8 -1% | 100 2% | 59.8 -39% | 58.7 -40% |
| Média Total (Programa/Configurações) | -18% /
-32% | 5% /
5% | -45% /
-81% | -39% /
-74% |
* ... menor é melhor
Exibir tempos de resposta
| ↔ Tempo de resposta preto para branco | ||
|---|---|---|
| 28 ms ... ascensão ↗ e queda ↘ combinadas | ↗ 11.2 ms ascensão | 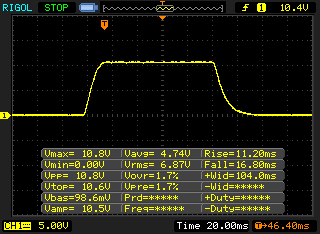 |
| ↘ 16.8 ms queda | ||
| A tela mostra taxas de resposta relativamente lentas em nossos testes e pode ser muito lenta para os jogadores. Em comparação, todos os dispositivos testados variam de 0.1 (mínimo) a 240 (máximo) ms. » 71 % de todos os dispositivos são melhores. Isso significa que o tempo de resposta medido é pior que a média de todos os dispositivos testados (19.8 ms). | ||
| ↔ Tempo de resposta 50% cinza a 80% cinza | ||
| 56 ms ... ascensão ↗ e queda ↘ combinadas | ↗ 26.8 ms ascensão | 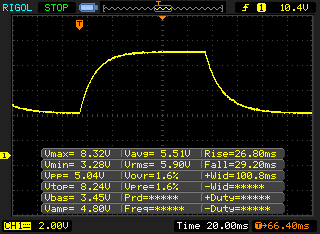 |
| ↘ 29.2 ms queda | ||
| A tela mostra taxas de resposta lentas em nossos testes e será insatisfatória para os jogadores. Em comparação, todos os dispositivos testados variam de 0.165 (mínimo) a 636 (máximo) ms. » 93 % de todos os dispositivos são melhores. Isso significa que o tempo de resposta medido é pior que a média de todos os dispositivos testados (31 ms). | ||
Cintilação da tela / PWM (modulação por largura de pulso)
| Tela tremeluzindo / PWM não detectado | 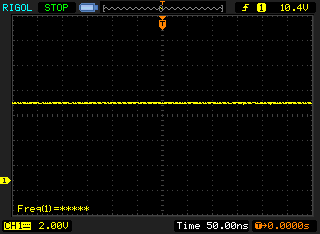 | ||
[pwm_comparison] Em comparação: 52 % de todos os dispositivos testados não usam PWM para escurecer a tela. Se PWM foi detectado, uma média de 7781 (mínimo: 5 - máximo: 343500) Hz foi medida. | |||

Cinebench R15: CPU Single 64Bit | CPU Multi 64Bit
Blender: v2.79 BMW27 CPU
7-Zip 18.03: 7z b 4 -mmt1 | 7z b 4
Geekbench 5.5: Single-Core | Multi-Core
HWBOT x265 Benchmark v2.2: 4k Preset
LibreOffice : 20 Documents To PDF
R Benchmark 2.5: Overall mean
| Cinebench R20 / CPU (Single Core) | |
| Média da turma Office (345 - 816, n=73, últimos 2 anos) | |
| Asus VivoBook Flip 14 TM420IA | |
| Acer Spin 5 SP513-54N-79EY | |
| Média Intel Core i7-10510U (362 - 497, n=37) | |
| Lenovo ThinkPad X390 Yoga-20NQS05R00 | |
| HP Envy x360 15-dr1679cl | |
| Lenovo ThinkPad X13 Yoga 20SX0004GE | |
| Cinebench R20 / CPU (Multi Core) | |
| Média da turma Office (648 - 8840, n=73, últimos 2 anos) | |
| Asus VivoBook Flip 14 TM420IA | |
| Acer Spin 5 SP513-54N-79EY | |
| HP Envy x360 15-dr1679cl | |
| Média Intel Core i7-10510U (1015 - 1897, n=38) | |
| Lenovo ThinkPad X390 Yoga-20NQS05R00 | |
| Lenovo ThinkPad X13 Yoga 20SX0004GE | |
| Cinebench R15 / CPU Single 64Bit | |
| Média da turma Office (99.5 - 312, n=75, últimos 2 anos) | |
| Asus VivoBook Flip 14 TM420IA | |
| Lenovo ThinkPad X390 Yoga-20NQS05R00 | |
| Média Intel Core i7-10510U (113 - 202, n=42) | |
| Acer Spin 5 SP513-54N-79EY | |
| HP Envy x360 15-dr1679cl | |
| Lenovo ThinkPad X13 Yoga 20SX0004GE | |
| Cinebench R15 / CPU Multi 64Bit | |
| Média da turma Office (250 - 3380, n=75, últimos 2 anos) | |
| Asus VivoBook Flip 14 TM420IA | |
| Média Intel Core i7-10510U (482 - 856, n=45) | |
| Acer Spin 5 SP513-54N-79EY | |
| HP Envy x360 15-dr1679cl | |
| Lenovo ThinkPad X390 Yoga-20NQS05R00 | |
| Lenovo ThinkPad X13 Yoga 20SX0004GE | |
| Blender / v2.79 BMW27 CPU | |
| Lenovo ThinkPad X390 Yoga-20NQS05R00 | |
| Lenovo ThinkPad X13 Yoga 20SX0004GE | |
| Média Intel Core i7-10510U (628 - 1051, n=31) | |
| HP Envy x360 15-dr1679cl | |
| Acer Spin 5 SP513-54N-79EY | |
| Asus VivoBook Flip 14 TM420IA | |
| Média da turma Office (158 - 1940, n=74, últimos 2 anos) | |
| 7-Zip 18.03 / 7z b 4 -mmt1 | |
| Média da turma Office (3387 - 6469, n=75, últimos 2 anos) | |
| Lenovo ThinkPad X390 Yoga-20NQS05R00 | |
| HP Envy x360 15-dr1679cl | |
| Média Intel Core i7-10510U (3747 - 4981, n=31) | |
| Lenovo ThinkPad X13 Yoga 20SX0004GE | |
| Asus VivoBook Flip 14 TM420IA | |
| Acer Spin 5 SP513-54N-79EY | |
| 7-Zip 18.03 / 7z b 4 | |
| Média da turma Office (7098 - 76886, n=75, últimos 2 anos) | |
| Asus VivoBook Flip 14 TM420IA | |
| Acer Spin 5 SP513-54N-79EY | |
| HP Envy x360 15-dr1679cl | |
| Média Intel Core i7-10510U (12196 - 21298, n=31) | |
| Lenovo ThinkPad X390 Yoga-20NQS05R00 | |
| Lenovo ThinkPad X13 Yoga 20SX0004GE | |
| Geekbench 5.5 / Single-Core | |
| Média da turma Office (811 - 2128, n=71, últimos 2 anos) | |
| Acer Spin 5 SP513-54N-79EY | |
| Lenovo ThinkPad X13 Yoga 20SX0004GE | |
| Média Intel Core i7-10510U (977 - 1287, n=31) | |
| Asus VivoBook Flip 14 TM420IA | |
| HP Envy x360 15-dr1679cl | |
| Geekbench 5.5 / Multi-Core | |
| Média da turma Office (1483 - 16999, n=71, últimos 2 anos) | |
| Asus VivoBook Flip 14 TM420IA | |
| Acer Spin 5 SP513-54N-79EY | |
| Média Intel Core i7-10510U (2474 - 4484, n=31) | |
| Lenovo ThinkPad X13 Yoga 20SX0004GE | |
| HP Envy x360 15-dr1679cl | |
| HWBOT x265 Benchmark v2.2 / 4k Preset | |
| Média da turma Office (2.21 - 26, n=74, últimos 2 anos) | |
| Asus VivoBook Flip 14 TM420IA | |
| HP Envy x360 15-dr1679cl | |
| Média Intel Core i7-10510U (3.41 - 6.04, n=31) | |
| Lenovo ThinkPad X13 Yoga 20SX0004GE | |
| Lenovo ThinkPad X390 Yoga-20NQS05R00 | |
| LibreOffice / 20 Documents To PDF | |
| HP Envy x360 15-dr1679cl | |
| Média Intel Core i7-10510U (50.7 - 77.8, n=27) | |
| Média da turma Office (39.9 - 102.3, n=74, últimos 2 anos) | |
| Asus VivoBook Flip 14 TM420IA | |
| Lenovo ThinkPad X13 Yoga 20SX0004GE | |
| Acer Spin 5 SP513-54N-79EY | |
| R Benchmark 2.5 / Overall mean | |
| HP Envy x360 15-dr1679cl | |
| Média Intel Core i7-10510U (0.637 - 0.81, n=28) | |
| Lenovo ThinkPad X13 Yoga 20SX0004GE | |
| Asus VivoBook Flip 14 TM420IA | |
| Média da turma Office (0.4098 - 0.888, n=74, últimos 2 anos) | |
* ... menor é melhor
| PCMark 10 Score | 4276 pontos | |
Ajuda | ||
| DPC Latencies / LatencyMon - interrupt to process latency (max), Web, Youtube, Prime95 | |
| HP Envy x360 15-dr1679cl | |
| Lenovo ThinkPad X13 Yoga 20SX0004GE | |
| Acer Spin 5 SP513-54N-79EY | |
| Asus VivoBook Flip 14 TM420IA | |
* ... menor é melhor
| Lenovo ThinkPad X13 Yoga 20SX0004GE Samsung SSD PM981a MZVLB512HBJQ | Lenovo ThinkPad X390 Yoga-20NQS05R00 Intel SSD Pro 7600p SSDPEKKF512G8L | Acer Spin 5 SP513-54N-79EY Samsung PM991 MZVLQ1T0HALB | Asus VivoBook Flip 14 TM420IA Samsung PM991 MZVLQ512HALU | HP Envy x360 15-dr1679cl Intel Optane Memory H10 with Solid State Storage 32GB + 512GB HBRPEKNX0202A(L/H) | Média Samsung SSD PM981a MZVLB512HBJQ | |
|---|---|---|---|---|---|---|
| CrystalDiskMark 5.2 / 6 | 21% | 19% | -4% | 5% | 45% | |
| Write 4K (MB/s) | 134.5 | 144.1 7% | 168.4 25% | 121.2 -10% | 125.6 -7% | 140.8 ? 5% |
| Read 4K (MB/s) | 61.2 | 63.5 4% | 55 -10% | 49.91 -18% | 145.8 138% | 48.6 ? -21% |
| Write Seq (MB/s) | 931 | 1496 61% | 1090 17% | 509 -45% | 2106 ? 126% | |
| Read Seq (MB/s) | 2534 | 2677 6% | 1533 -40% | 1536 -39% | 2099 ? -17% | |
| Write 4K Q32T1 (MB/s) | 375.9 | 357.4 -5% | 476.1 27% | 393.3 5% | 362.4 -4% | 451 ? 20% |
| Read 4K Q32T1 (MB/s) | 343.7 | 482.3 40% | 506 47% | 406 18% | 307.3 -11% | 482 ? 40% |
| Write Seq Q32T1 (MB/s) | 934 | 1558 67% | 1492 60% | 1225 31% | 1320 41% | 2903 ? 211% |
| Read Seq Q32T1 (MB/s) | 3548 | 3021 -15% | 2357 -34% | 2277 -36% | 2489 -30% | 3511 ? -1% |
| Write 4K Q8T8 (MB/s) | 989 | 930 | 914 ? | |||
| Read 4K Q8T8 (MB/s) | 883 | 963 | 1017 ? | |||
| AS SSD | -2% | -17% | -48% | -78% | 4% | |
| Seq Read (MB/s) | 2844 | 2742 -4% | 2071 -27% | 1397 -51% | 931 -67% | 2412 ? -15% |
| Seq Write (MB/s) | 1483 | 1511 2% | 1462 -1% | 783 -47% | 331.5 -78% | 1983 ? 34% |
| 4K Read (MB/s) | 56.1 | 66.3 18% | 49.82 -11% | 48.08 -14% | 72.8 30% | 53.1 ? -5% |
| 4K Write (MB/s) | 138.1 | 175.2 27% | 140.7 2% | 134.6 -3% | 119 -14% | 131.1 ? -5% |
| 4K-64 Read (MB/s) | 870 | 873 0% | 869 0% | 835 -4% | 389.7 -55% | 1201 ? 38% |
| 4K-64 Write (MB/s) | 1311 | 594 -55% | 729 -44% | 734 -44% | 573 -56% | 1726 ? 32% |
| Access Time Read * (ms) | 0.049 | 0.035 29% | 0.069 -41% | 0.081 -65% | 0.07 -43% | 0.05525 ? -13% |
| Access Time Write * (ms) | 0.027 | 0.021 22% | 0.028 -4% | 0.084 -211% | 0.138 -411% | 0.05394 ? -100% |
| Score Read (Points) | 1210 | 1213 0% | 1126 -7% | 1022 -16% | 556 -54% | 1495 ? 24% |
| Score Write (Points) | 1598 | 920 -42% | 1016 -36% | 947 -41% | 725 -55% | 2055 ? 29% |
| Score Total (Points) | 3373 | 2712 -20% | 2700 -20% | 2474 -27% | 1565 -54% | 4303 ? 28% |
| Média Total (Programa/Configurações) | 10% /
7% | 1% /
-4% | -26% /
-29% | -37% /
-43% | 25% /
22% |
* ... menor é melhor

Continuous load read: DiskSpd Read Loop, Queue Depth 8
| 3DMark 11 Performance | 2046 pontos | |
| 3DMark Cloud Gate Standard Score | 8824 pontos | |
| 3DMark Fire Strike Score | 1118 pontos | |
| 3DMark Time Spy Score | 451 pontos | |
Ajuda | ||
| Far Cry 5 - 1280x720 Low Preset AA:T | |
| Média da turma Office (35 - 99, n=14, últimos 2 anos) | |
| Acer Spin 5 SP513-54N-79EY | |
| Média Intel UHD Graphics 620 (6 - 16, n=12) | |
| Lenovo ThinkPad X13 Yoga 20SX0004GE | |
| baixo | média | alto | ultra | |
|---|---|---|---|---|
| Dota 2 Reborn (2015) | 76.7 | 44.7 | 21.4 | 19 |
| X-Plane 11.11 (2018) | 15.7 | 11.9 | 12.5 | |
| Far Cry 5 (2018) | 12 |
Barulho
| Ocioso |
| 29.3 / 29.3 / 31.4 dB |
| Carga |
| 33 / 34.9 dB |
 | ||
30 dB silencioso 40 dB(A) audível 50 dB(A) ruidosamente alto |
||
min: | ||
(±) A temperatura máxima no lado superior é 43.8 °C / 111 F, em comparação com a média de 34.3 °C / 94 F , variando de 21.2 a 62.5 °C para a classe Office.
(-) A parte inferior aquece até um máximo de 65 °C / 149 F, em comparação com a média de 36.8 °C / 98 F
(+) Em uso inativo, a temperatura média para o lado superior é 27.3 °C / 81 F, em comparação com a média do dispositivo de 29.5 °C / ### class_avg_f### F.
(+) Os apoios para as mãos e o touchpad são mais frios que a temperatura da pele, com um máximo de 25.6 °C / 78.1 F e, portanto, são frios ao toque.
(±) A temperatura média da área do apoio para as mãos de dispositivos semelhantes foi 27.5 °C / 81.5 F (+1.9 °C / 3.4 F).
Lenovo ThinkPad X13 Yoga 20SX0004GE análise de áudio
(±) | o volume do alto-falante é médio, mas bom (###valor### dB)
Graves 100 - 315Hz
(-) | quase nenhum baixo - em média 17.7% menor que a mediana
(±) | a linearidade dos graves é média (14.9% delta para a frequência anterior)
Médios 400 - 2.000 Hz
(±) | médios mais altos - em média 7.8% maior que a mediana
(+) | médios são lineares (3.9% delta para frequência anterior)
Altos 2 - 16 kHz
(±) | máximos reduzidos - em média 6.6% menor que a mediana
(±) | a linearidade dos máximos é média (7.6% delta para frequência anterior)
Geral 100 - 16.000 Hz
(±) | a linearidade do som geral é média (28.8% diferença em relação à mediana)
Comparado com a mesma classe
» 89% de todos os dispositivos testados nesta classe foram melhores, 2% semelhantes, 8% piores
» O melhor teve um delta de 7%, a média foi 21%, o pior foi 53%
Comparado com todos os dispositivos testados
» 86% de todos os dispositivos testados foram melhores, 3% semelhantes, 11% piores
» O melhor teve um delta de 4%, a média foi 24%, o pior foi 134%
Lenovo ThinkPad X390 Yoga-20NQS05R00 análise de áudio
(±) | o volume do alto-falante é médio, mas bom (###valor### dB)
Graves 100 - 315Hz
(-) | quase nenhum baixo - em média 15.8% menor que a mediana
(±) | a linearidade dos graves é média (10.6% delta para a frequência anterior)
Médios 400 - 2.000 Hz
(±) | médios mais altos - em média 6.5% maior que a mediana
(±) | a linearidade dos médios é média (10.3% delta para frequência anterior)
Altos 2 - 16 kHz
(+) | agudos equilibrados - apenas 2.8% longe da mediana
(±) | a linearidade dos máximos é média (11% delta para frequência anterior)
Geral 100 - 16.000 Hz
(±) | a linearidade do som geral é média (24% diferença em relação à mediana)
Comparado com a mesma classe
» 73% de todos os dispositivos testados nesta classe foram melhores, 5% semelhantes, 22% piores
» O melhor teve um delta de 6%, a média foi 20%, o pior foi 57%
Comparado com todos os dispositivos testados
» 72% de todos os dispositivos testados foram melhores, 6% semelhantes, 22% piores
» O melhor teve um delta de 4%, a média foi 24%, o pior foi 134%
| desligado | |
| Ocioso | |
| Carga |
|
Key:
min: | |
| Lenovo ThinkPad X13 Yoga 20SX0004GE i7-10510U, UHD Graphics 620, Samsung SSD PM981a MZVLB512HBJQ, IPS, 1920x1080, 13.3" | Lenovo ThinkPad X390 Yoga-20NQS05R00 i7-8565U, UHD Graphics 620, Intel SSD Pro 7600p SSDPEKKF512G8L, IPS LED, 1920x1080, 13.3" | Acer Spin 5 SP513-54N-79EY i7-1065G7, Iris Plus Graphics G7 (Ice Lake 64 EU), Samsung PM991 MZVLQ1T0HALB, IPS, 2256x1504, 13.5" | Asus VivoBook Flip 14 TM420IA R7 4700U, Vega 7, Samsung PM991 MZVLQ512HALU, IPS, 1920x1080, 14" | HP Envy x360 15-dr1679cl i7-10510U, UHD Graphics 620, Intel Optane Memory H10 with Solid State Storage 32GB + 512GB HBRPEKNX0202A(L/H), IPS, 1920x1080, 15.6" | Média Intel UHD Graphics 620 | Média da turma Office | |
|---|---|---|---|---|---|---|---|
| Power Consumption | -12% | 12% | 1% | -15% | -6% | -20% | |
| Idle Minimum * (Watt) | 3.4 | 3.46 -2% | 2.8 18% | 4 -18% | 4.3 -26% | 3.81 ? -12% | 4.41 ? -30% |
| Idle Average * (Watt) | 4.98 | 5.88 -18% | 5.4 -8% | 6.4 -29% | 7.2 -45% | 6.94 ? -39% | 7.37 ? -48% |
| Idle Maximum * (Watt) | 8.1 | 9.12 -13% | 7.6 6% | 7 14% | 7.5 7% | 8.75 ? -8% | 8.58 ? -6% |
| Load Average * (Watt) | 37.2 | 45.6 -23% | 36.6 2% | 34.6 7% | 40.4 -9% | 35 ? 6% | 43 ? -16% |
| Load Maximum * (Watt) | 63.3 | 65.9 -4% | 37 42% | 45.1 29% | 65.7 -4% | 47.5 ? 25% | 64.6 ? -2% |
| Witcher 3 ultra * (Watt) | 35 |
* ... menor é melhor
| Lenovo ThinkPad X13 Yoga 20SX0004GE i7-10510U, UHD Graphics 620, 50 Wh | Lenovo ThinkPad X390 Yoga-20NQS05R00 i7-8565U, UHD Graphics 620, 50 Wh | Acer Spin 5 SP513-54N-79EY i7-1065G7, Iris Plus Graphics G7 (Ice Lake 64 EU), 55 Wh | Asus VivoBook Flip 14 TM420IA R7 4700U, Vega 7, 42 Wh | HP Envy x360 15-dr1679cl i7-10510U, UHD Graphics 620, 55.67 Wh | Média da turma Office | |
|---|---|---|---|---|---|---|
| Duração da bateria | -24% | 9% | -2% | -5% | 10% | |
| WiFi v1.3 (h) | 8.2 | 8.2 0% | 10.8 32% | 8 -2% | 9.2 12% | 12.9 ? 57% |
| Load (h) | 2.9 | 1.5 -48% | 2.5 -14% | 2.3 -21% | 1.794 ? -38% |
Pro
Contra
Veredicto - Nada novo com Comet Lake
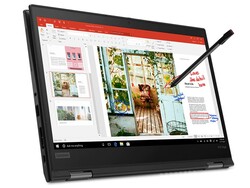

Com o ThinkPad X13 Yoga, a Lenovo oferece uma atualização de hardware para a última geração de processadores da Intel. No entanto, isso não resulta em um aumento significativo de desempenho, e o Intel Core i7-10510U, que é, na verdade, mais eficiente em termos de energia, também não tem um efeito positivo na duração da bateria. No entanto, o conversível Windows continua sendo um dispositivo sólido com acabamento de alta qualidade que pode ser usado bem no dia a dia.
O Lenovo ThinkPad X13 Yoga é praticamente idêntico ao 390 Yoga, mas isso também é verdade em termos de desempenho.
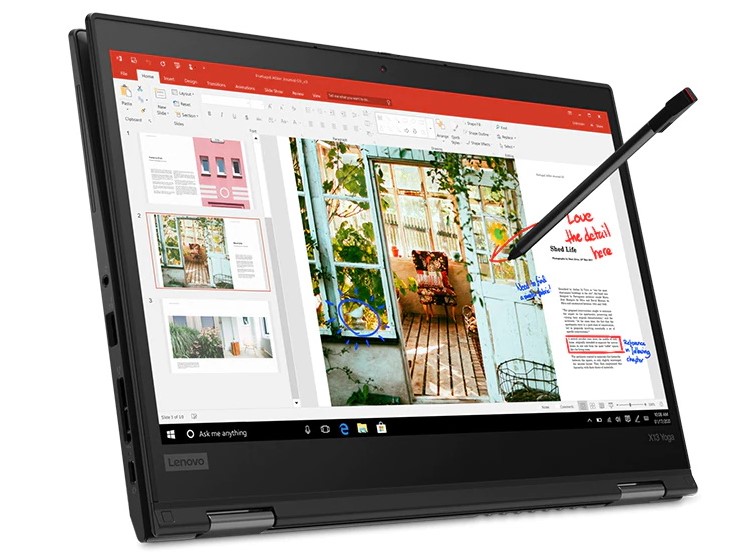
Para os compradores em potencial, isso levanta a questão de saber se eles deveriam investir seu dinheiro no modelo anterior. No final, oferece tudo o que também está disponível na nova edição, inclusive a ThinkPad Pen Pro, que vem na caixa. Dependendo do preço, você pode economizar alguns euros.
Lenovo ThinkPad X13 Yoga 20SX0004GE
- 09/24/2020 v7 (old)
Mike Wobker
Price comparison
