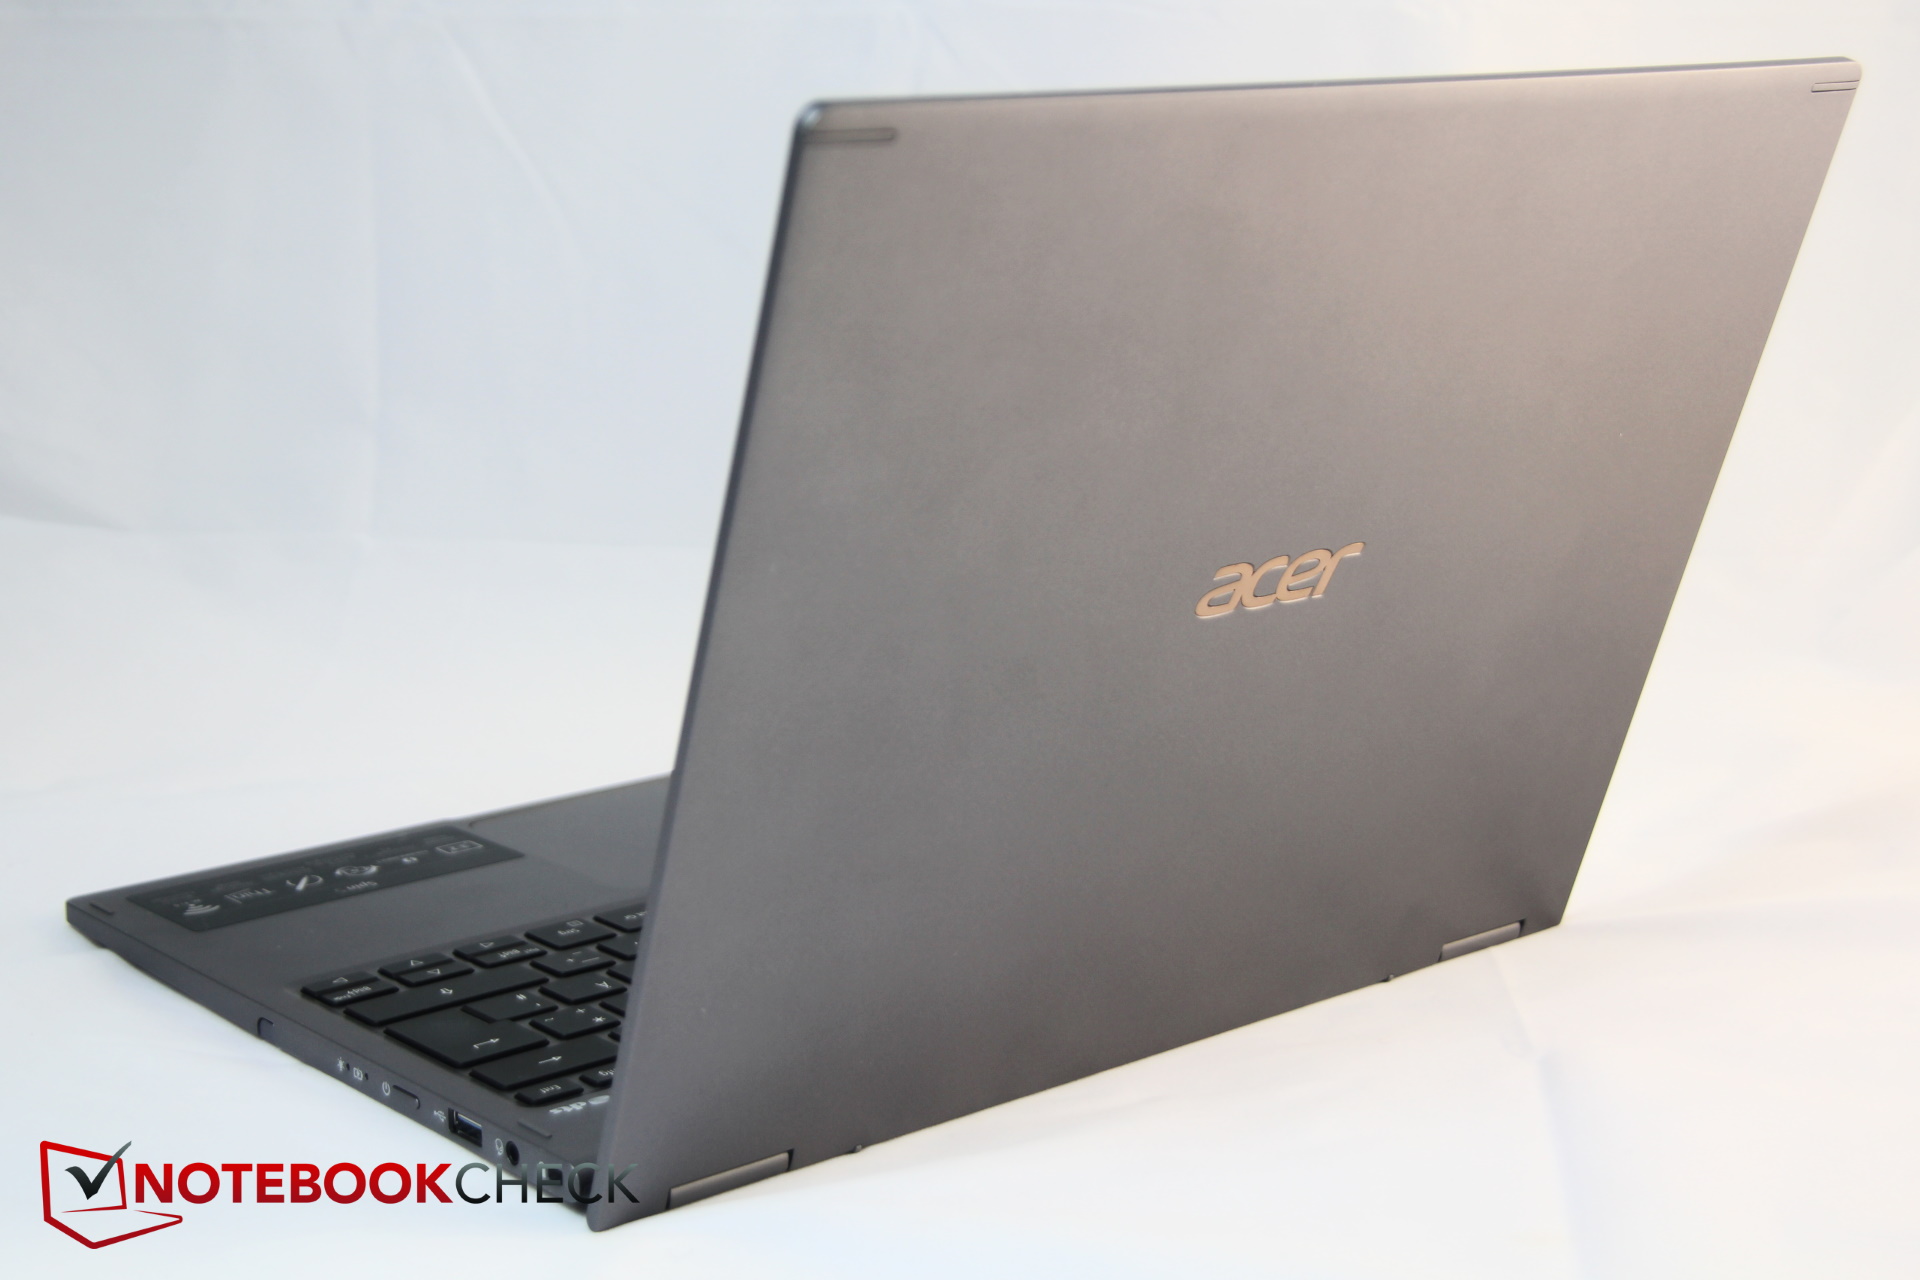
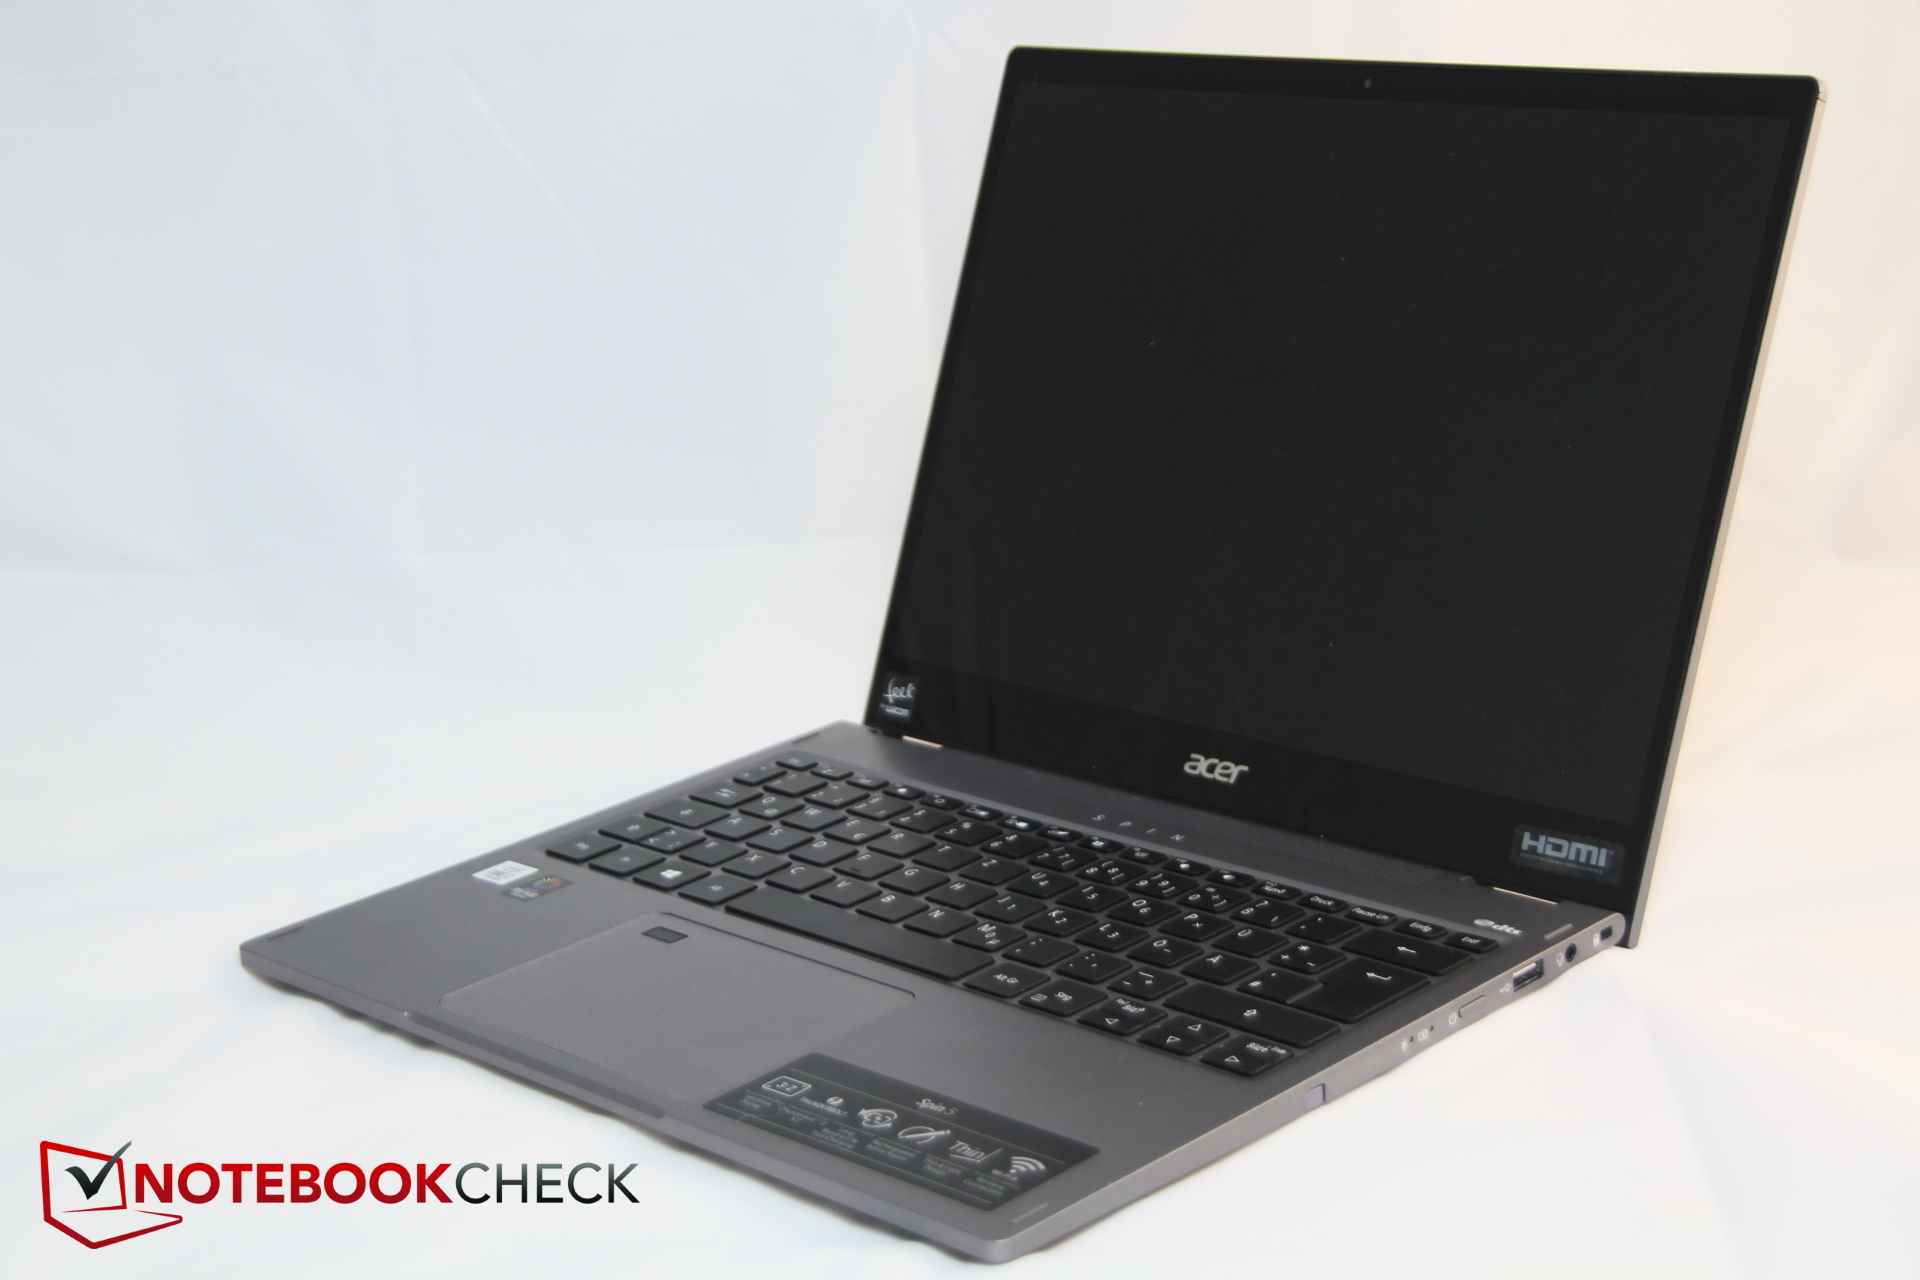
Breve Análise do Portátil Acer Spin 5 SP513: Conversível de 13 polegadas sensivelmente otimizado e balanceado
Avaliação | Data | Modelo | Peso | Altura | Size | Resolução | Preço |
|---|---|---|---|---|---|---|---|
| 88.1 % v7 (old) | 09/2020 | Acer Spin 5 SP513-54N-79EY i7-1065G7, Iris Plus Graphics G7 (Ice Lake 64 EU) | 1.2 kg | 14.9 mm | 13.50" | 2256x1504 | |
| 84.4 % v6 (old) | 08/2018 | Acer Spin 5 SP513-52N-54SF i5-8250U, UHD Graphics 620 | 1.5 kg | 15.9 mm | 13.30" | 1920x1080 | |
| 88.4 % v7 (old) | 12/2019 | HP Spectre x360 13-aw0013dx i7-1065G7, Iris Plus Graphics G7 (Ice Lake 64 EU) | 1.2 kg | 16.9 mm | 13.30" | 1920x1080 | |
| 86.3 % v7 (old) | 10/2019 | Dell XPS 13 7390 2-in-1 Core i7 i7-1065G7, Iris Plus Graphics G7 (Ice Lake 64 EU) | 1.3 kg | 13 mm | 13.40" | 1920x1200 | |
| 85.5 % v7 (old) | 07/2020 | HP Envy x360 13-ay0010nr R5 4500U, Vega 6 | 1.3 kg | 16.4 mm | 13.30" | 1920x1080 | |
| 84.4 % v7 (old) | 07/2020 | Samsung Galaxy Book Flex 13.3 i5-1035G4, Iris Plus Graphics G4 (Ice Lake 48 EU) | 1.2 kg | 13 mm | 13.30" | 1920x1080 |
| SD Card Reader | |
| average JPG Copy Test (av. of 3 runs) | |
| HP Spectre x360 13-aw0013dx (Toshiba Exceria Pro M501 microSDXC 64GB) | |
| Dell XPS 13 7390 2-in-1 Core i7 (Toshiba Exceria Pro M501 64 GB UHS-II) | |
| Samsung Galaxy Book Flex 13.3 (Toshiba Exceria Pro M501 microSDXC 64GB) | |
| HP Envy x360 13-ay0010nr (Toshiba Exceria Pro M501 64 GB UHS-II) | |
| Média da turma Convertible (29.4 - 141, n=20, últimos 2 anos) | |
| Acer Spin 5 SP513-52N-54SF (Toshiba Exceria Pro SDXC 64 GB UHS-II) | |
| Acer Spin 5 SP513-54N-79EY (Toshiba Exceria Pro M501 microSDXC 64GB) | |
| maximum AS SSD Seq Read Test (1GB) | |
| Dell XPS 13 7390 2-in-1 Core i7 (Toshiba Exceria Pro M501 64 GB UHS-II) | |
| HP Spectre x360 13-aw0013dx (Toshiba Exceria Pro M501 microSDXC 64GB) | |
| Média da turma Convertible (67.5 - 254, n=19, últimos 2 anos) | |
| Samsung Galaxy Book Flex 13.3 (Toshiba Exceria Pro M501 microSDXC 64GB) | |
| HP Envy x360 13-ay0010nr (Toshiba Exceria Pro M501 64 GB UHS-II) | |
| Acer Spin 5 SP513-54N-79EY (Toshiba Exceria Pro M501 microSDXC 64GB) | |
| Acer Spin 5 SP513-52N-54SF (Toshiba Exceria Pro SDXC 64 GB UHS-II) | |


, i5-1035G4, Samsung SSD PM981a MZVLB256HBHQ")
, i5-1035G4, Samsung SSD PM981a MZVLB256HBHQ")


, i7-1065G7, Samsung PM991 MZVLQ1T0HALB")
, i7-1065G7, Samsung PM991 MZVLQ1T0HALB")
| |||||||||||||||||||||||||
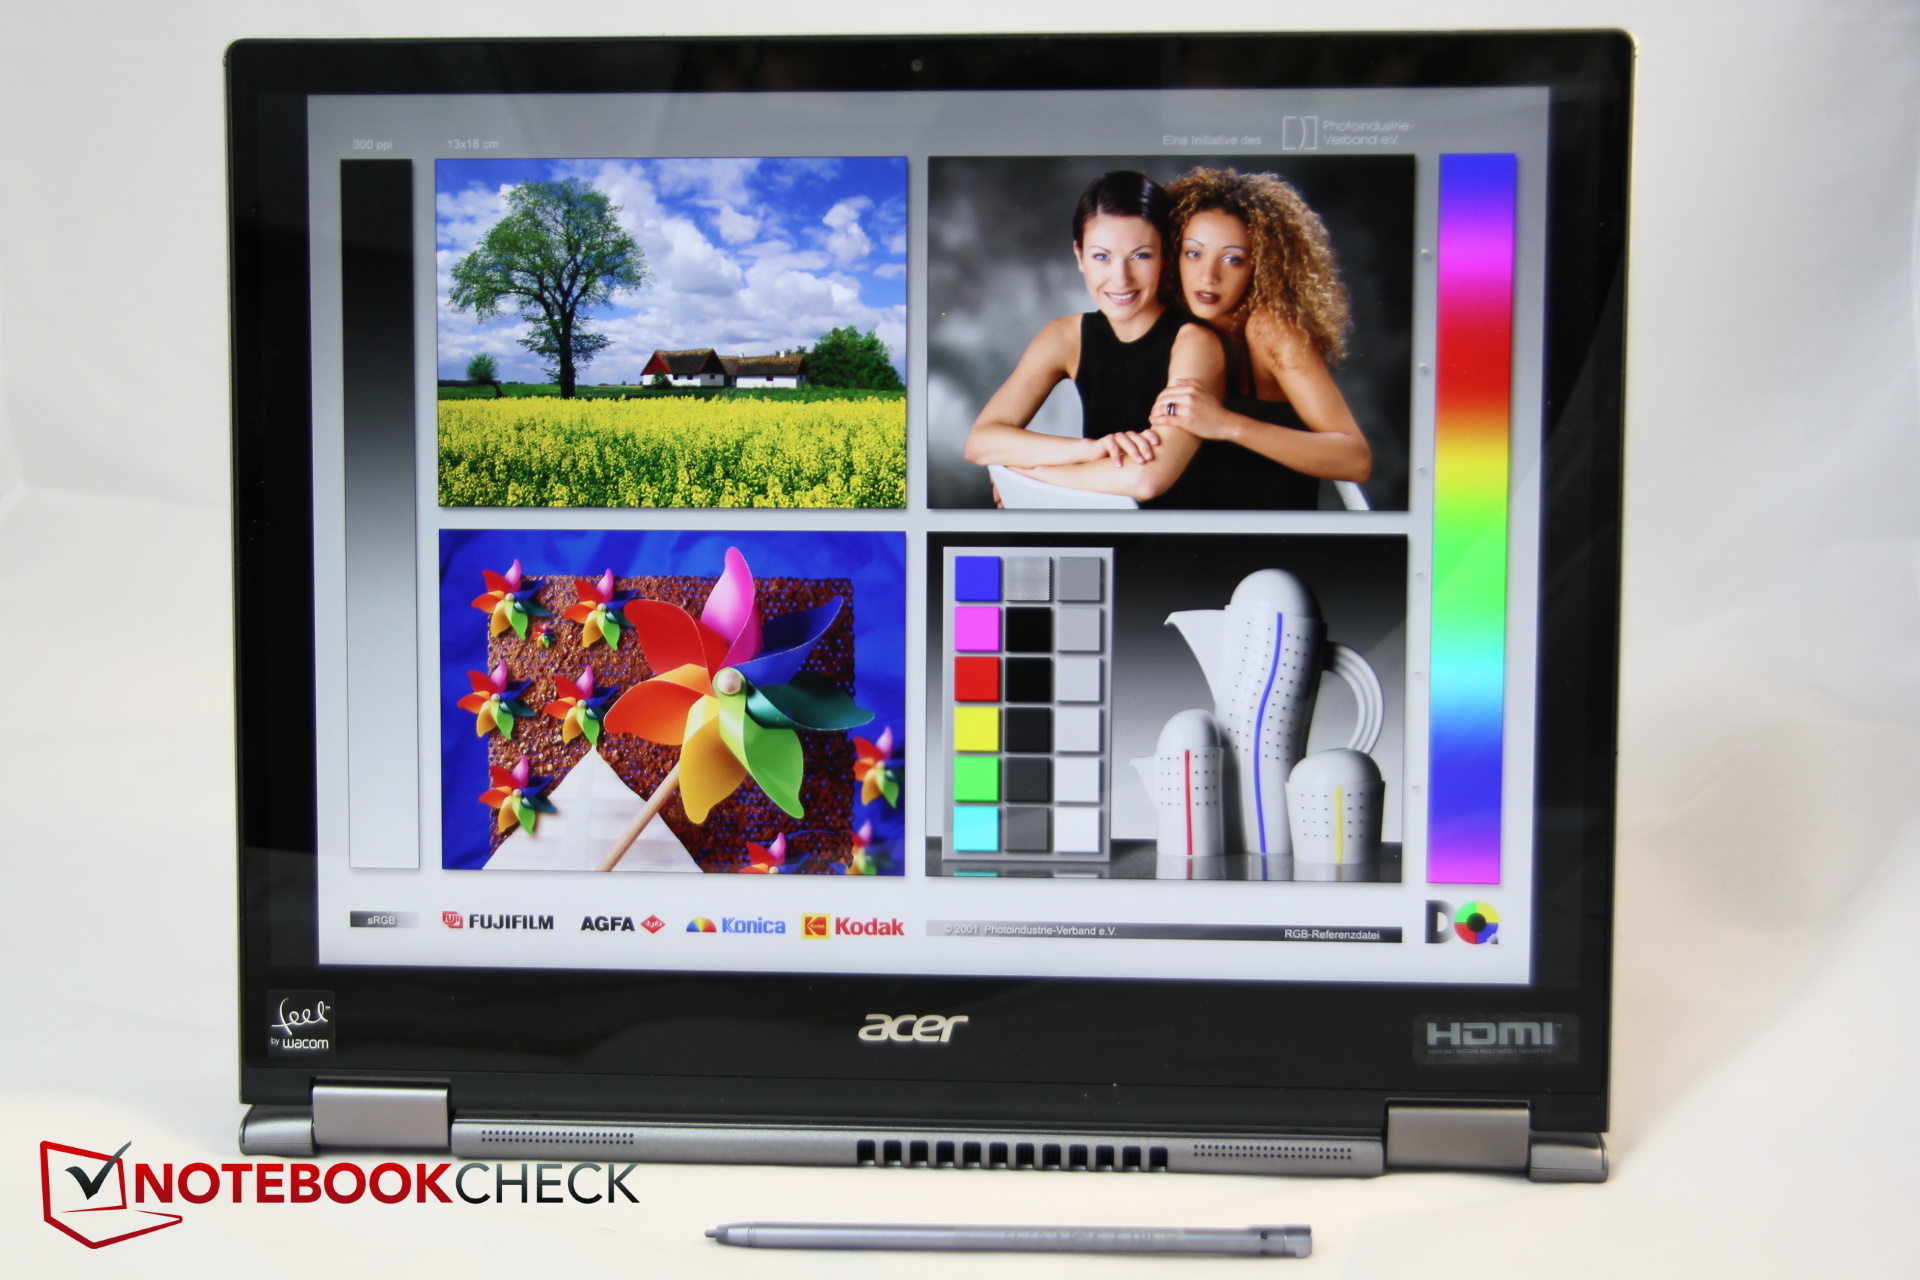
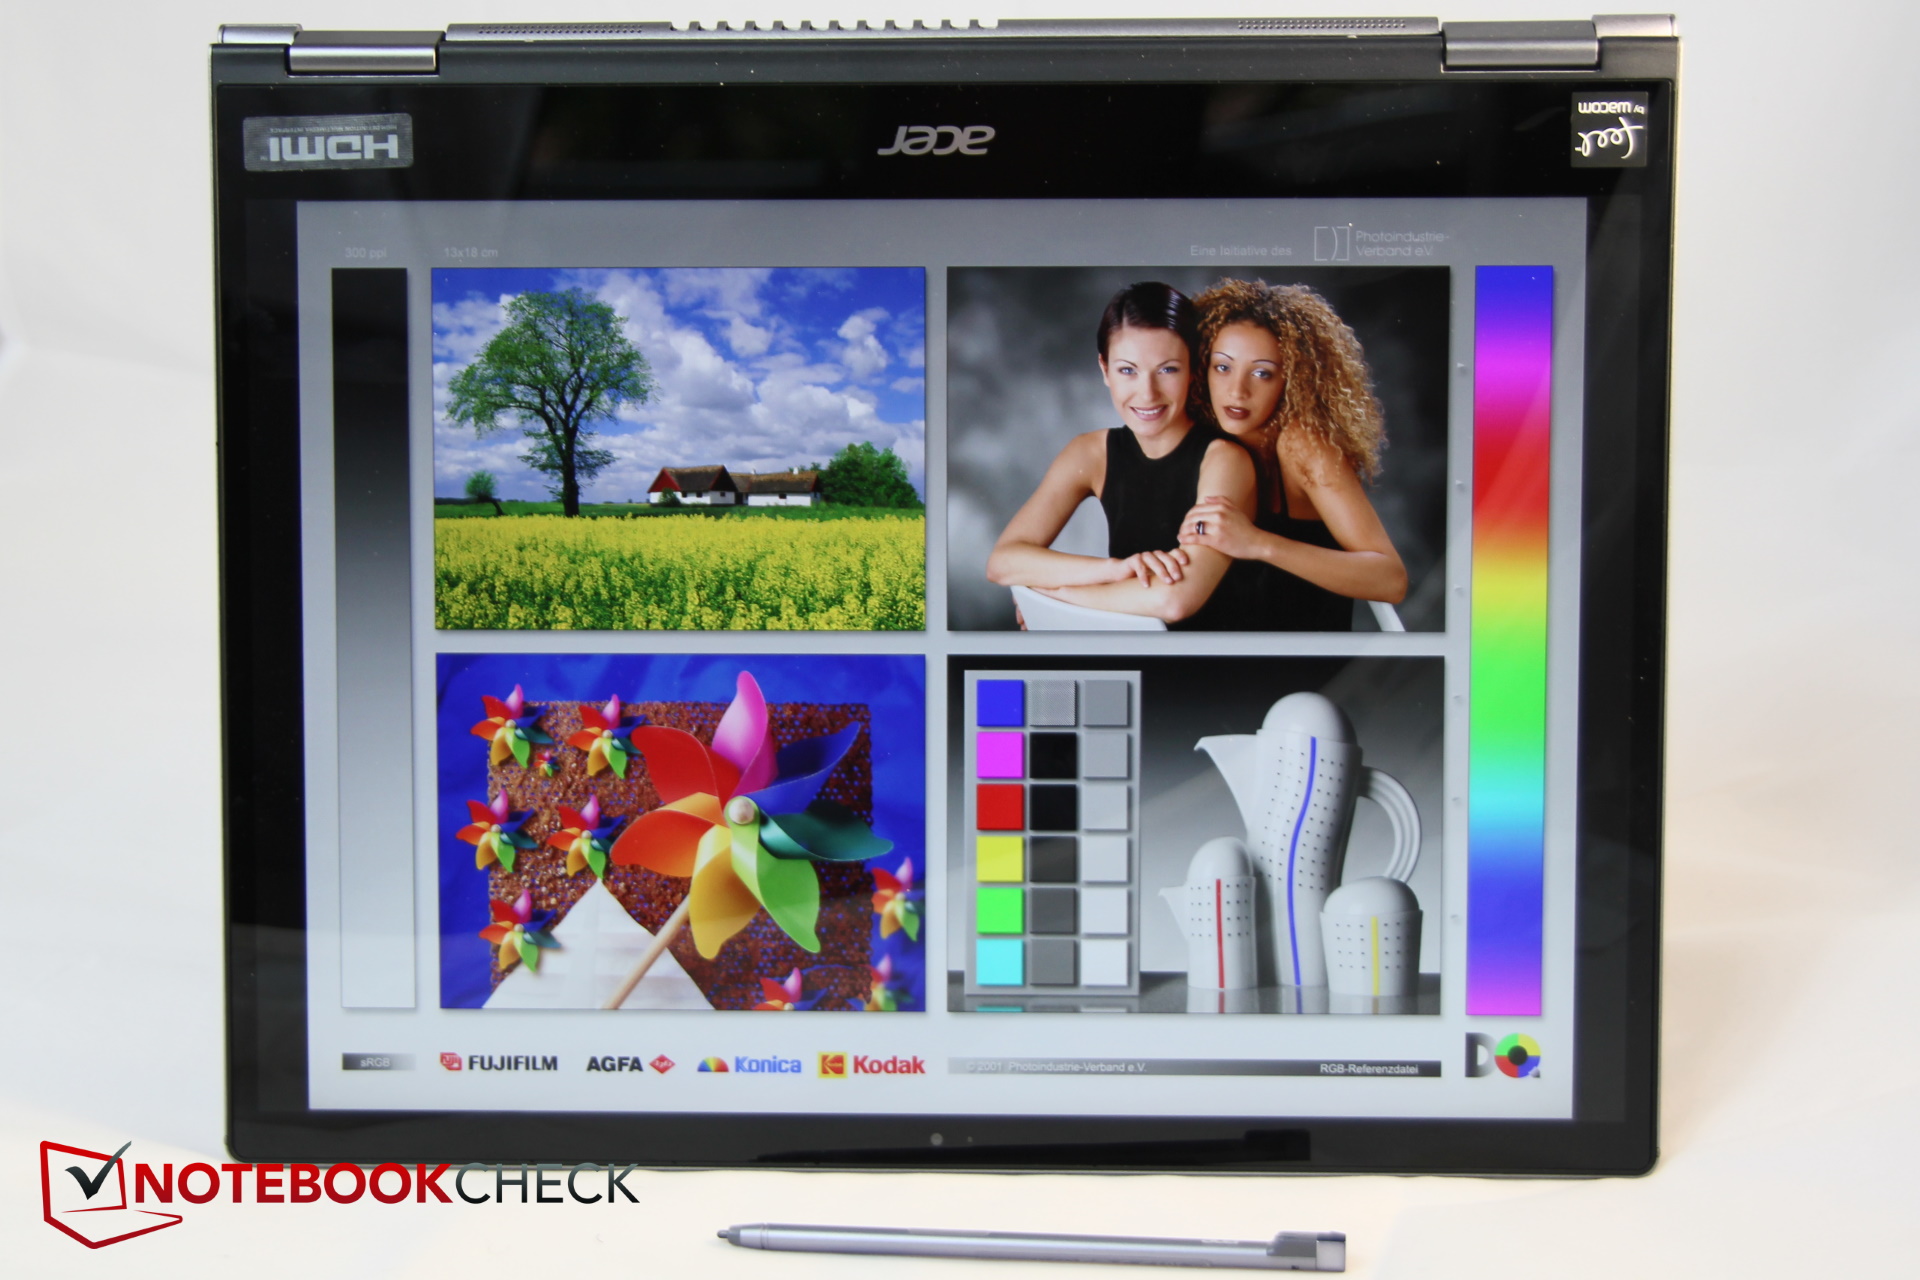
iluminação: 91 %
iluminação com acumulador: 442 cd/m²
Contraste: 1376:1 (Preto: 0.33 cd/m²)
ΔE ColorChecker Calman: 1.27 | ∀{0.5-29.43 Ø4.71}
calibrated: 0.78
ΔE Greyscale Calman: 1.07 | ∀{0.09-98 Ø4.96}
100% sRGB (Argyll 1.6.3 3D)
65% AdobeRGB 1998 (Argyll 1.6.3 3D)
71% AdobeRGB 1998 (Argyll 3D)
99.6% sRGB (Argyll 3D)
69.4% Display P3 (Argyll 3D)
Gamma: 2.39
CCT: 6530 K
| Acer Spin 5 SP513-54N-79EY BOE08BC, IPS, 2256x1504, 13.5" | Acer Spin 5 SP513-52N-54SF LC133LF102, IPS, 1920x1080, 13.3" | HP Envy x360 13-ay0010nr IPS, 1920x1080, 13.3" | Samsung Galaxy Book Flex 13.3 BOE087A, IPS, 1920x1080, 13.3" | Dell XPS 13 7390 2-in-1 Core i7 Sharp LQ134N1, IPS, 1920x1200, 13.4" | HP Spectre x360 13-aw0013dx AU Optronics AUO5E2D, IPS, 1920x1080, 13.3" | |
|---|---|---|---|---|---|---|
| Display | -2% | -4% | 1% | 0% | ||
| Display P3 Coverage (%) | 69.4 | 69.8 1% | 65.9 -5% | 69.9 1% | 69.6 0% | |
| sRGB Coverage (%) | 99.6 | 94.6 -5% | 97.4 -2% | 99.2 0% | 98.9 -1% | |
| AdobeRGB 1998 Coverage (%) | 71 | 69.3 -2% | 67.8 -5% | 71.5 1% | 71.5 1% | |
| Response Times | 2% | -7% | 7% | -1% | -28% | |
| Response Time Grey 50% / Grey 80% * (ms) | 49 ? | 49 ? -0% | 47.6 ? 3% | 44 ? 10% | 47.6 ? 3% | 60.8 ? -24% |
| Response Time Black / White * (ms) | 28 ? | 27 ? 4% | 32.4 ? -16% | 27 ? 4% | 29.2 ? -4% | 36.8 ? -31% |
| PWM Frequency (Hz) | 208 ? | 1000 ? | 25000 ? | 2500 ? | ||
| Screen | -55% | -30% | -151% | -29% | -96% | |
| Brightness middle (cd/m²) | 454 | 295 -35% | 452.6 0% | 473 4% | 549.8 21% | 447.4 -1% |
| Brightness (cd/m²) | 426 | 276 -35% | 438 3% | 434 2% | 520 22% | 420 -1% |
| Brightness Distribution (%) | 91 | 88 -3% | 93 2% | 86 -5% | 86 -5% | 85 -7% |
| Black Level * (cd/m²) | 0.33 | 0.27 18% | 0.29 12% | 0.39 -18% | 0.39 -18% | 0.31 6% |
| Contrast (:1) | 1376 | 1093 -21% | 1561 13% | 1213 -12% | 1410 2% | 1443 5% |
| Colorchecker dE 2000 * | 1.27 | 2.97 -134% | 2.67 -110% | 5.18 -308% | 2.12 -67% | 4.23 -233% |
| Colorchecker dE 2000 max. * | 2.42 | 5.67 -134% | 4.11 -70% | 10.01 -314% | 3.66 -51% | 9.34 -286% |
| Colorchecker dE 2000 calibrated * | 0.78 | 1.36 -74% | 1.37 -76% | 1.32 -69% | ||
| Greyscale dE 2000 * | 1.07 | 3.12 -192% | 2.1 -96% | 7.04 -558% | 2.6 -143% | 6.1 -470% |
| Gamma | 2.39 92% | 2.45 90% | 2.01 109% | 2.35 94% | 2.3 96% | 2.11 104% |
| CCT | 6530 100% | 6676 97% | 6505 100% | 6753 96% | 6884 94% | 6136 106% |
| Color Space (Percent of AdobeRGB 1998) (%) | 65 | 62 -5% | 62.2 -4% | 65.4 1% | 64.8 0% | |
| Color Space (Percent of sRGB) (%) | 100 | 94 -6% | 97.6 -2% | 99.7 0% | 98.9 -1% | |
| Média Total (Programa/Configurações) | -18% /
-37% | -14% /
-22% | -72% /
-120% | -10% /
-20% | -41% /
-70% |
* ... menor é melhor
Exibir tempos de resposta
| ↔ Tempo de resposta preto para branco | ||
|---|---|---|
| 28 ms ... ascensão ↗ e queda ↘ combinadas | ↗ 16 ms ascensão | 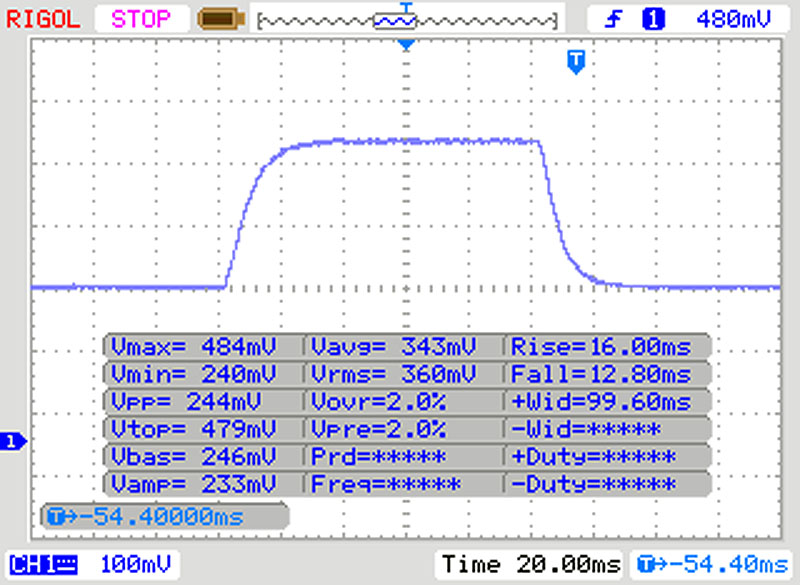 |
| ↘ 12 ms queda | ||
| A tela mostra taxas de resposta relativamente lentas em nossos testes e pode ser muito lenta para os jogadores. Em comparação, todos os dispositivos testados variam de 0.1 (mínimo) a 240 (máximo) ms. » 71 % de todos os dispositivos são melhores. Isso significa que o tempo de resposta medido é pior que a média de todos os dispositivos testados (19.8 ms). | ||
| ↔ Tempo de resposta 50% cinza a 80% cinza | ||
| 49 ms ... ascensão ↗ e queda ↘ combinadas | ↗ 22 ms ascensão | 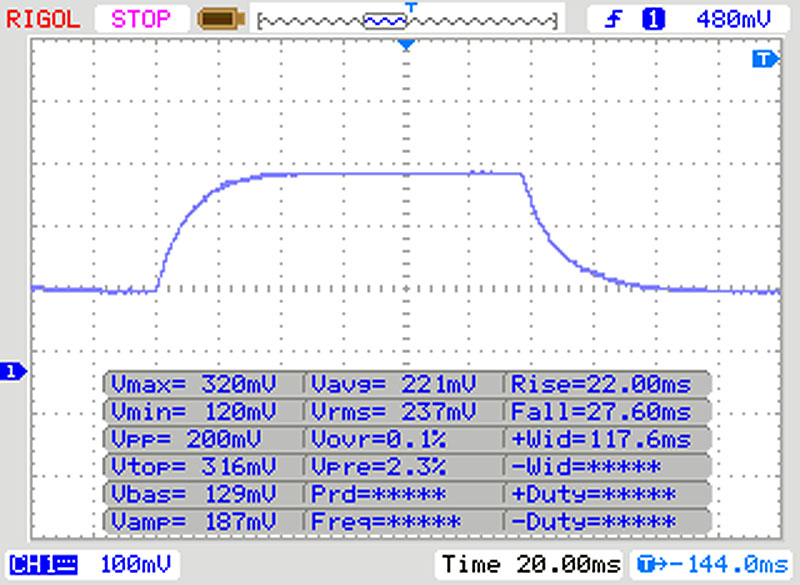 |
| ↘ 27 ms queda | ||
| A tela mostra taxas de resposta lentas em nossos testes e será insatisfatória para os jogadores. Em comparação, todos os dispositivos testados variam de 0.165 (mínimo) a 636 (máximo) ms. » 85 % de todos os dispositivos são melhores. Isso significa que o tempo de resposta medido é pior que a média de todos os dispositivos testados (31 ms). | ||
Cintilação da tela / PWM (modulação por largura de pulso)
| Tela tremeluzindo/PWM detectado | 208 Hz | ≤ 90 % configuração de brilho | 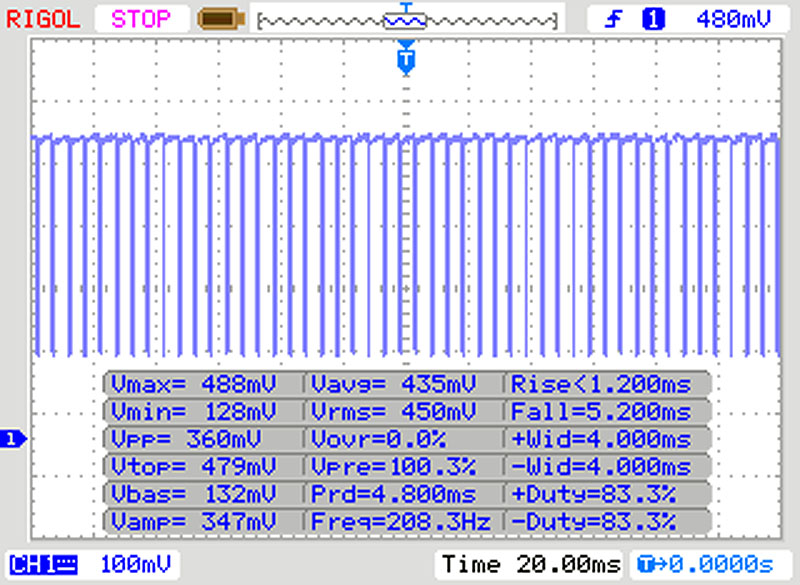 |
A luz de fundo da tela pisca em 208 Hz (pior caso, por exemplo, utilizando PWM) Cintilação detectada em uma configuração de brilho de 90 % e abaixo. Não deve haver cintilação ou PWM acima desta configuração de brilho. A frequência de 208 Hz é relativamente baixa, portanto, usuários sensíveis provavelmente notarão cintilação e sentirão fadiga ocular na configuração de brilho indicada e abaixo. [pwm_comparison] Em comparação: 52 % de todos os dispositivos testados não usam PWM para escurecer a tela. Se PWM foi detectado, uma média de 7754 (mínimo: 5 - máximo: 343500) Hz foi medida. | |||
Cinebench R15: CPU Single 64Bit | CPU Multi 64Bit
Blender: v2.79 BMW27 CPU
7-Zip 18.03: 7z b 4 -mmt1 | 7z b 4
Geekbench 5.5: Single-Core | Multi-Core
HWBOT x265 Benchmark v2.2: 4k Preset
LibreOffice : 20 Documents To PDF
R Benchmark 2.5: Overall mean
| Cinebench R20 / CPU (Single Core) | |
| Média da turma Convertible (273 - 834, n=48, últimos 2 anos) | |
| Dell XPS 13 7390 2-in-1 Core i7 | |
| Acer Spin 5 SP513-54N-79EY | |
| Média Intel Core i7-1065G7 (358 - 474, n=31) | |
| HP Envy x360 13-ay0010nr | |
| Samsung Galaxy Book Flex 13.3 | |
| HP Spectre x360 13-aw0013dx | |
| Cinebench R20 / CPU (Multi Core) | |
| Média da turma Convertible (595 - 12102, n=48, últimos 2 anos) | |
| HP Envy x360 13-ay0010nr | |
| Dell XPS 13 7390 2-in-1 Core i7 | |
| HP Spectre x360 13-aw0013dx | |
| Acer Spin 5 SP513-54N-79EY | |
| Média Intel Core i7-1065G7 (1081 - 2024, n=31) | |
| Samsung Galaxy Book Flex 13.3 | |
| Cinebench R15 / CPU Single 64Bit | |
| Média da turma Convertible (149.8 - 317, n=47, últimos 2 anos) | |
| Acer Spin 5 SP513-54N-79EY | |
| HP Spectre x360 13-aw0013dx | |
| Média Intel Core i7-1065G7 (141 - 190, n=35) | |
| Dell XPS 13 7390 2-in-1 Core i7 | |
| HP Envy x360 13-ay0010nr | |
| Samsung Galaxy Book Flex 13.3 | |
| Acer Spin 5 SP513-52N-54SF | |
| Cinebench R15 / CPU Multi 64Bit | |
| Média da turma Convertible (478 - 4940, n=47, últimos 2 anos) | |
| HP Envy x360 13-ay0010nr | |
| Dell XPS 13 7390 2-in-1 Core i7 | |
| Acer Spin 5 SP513-54N-79EY | |
| Média Intel Core i7-1065G7 (288 - 836, n=36) | |
| HP Spectre x360 13-aw0013dx | |
| Samsung Galaxy Book Flex 13.3 | |
| Acer Spin 5 SP513-52N-54SF | |
| Blender / v2.79 BMW27 CPU | |
| Samsung Galaxy Book Flex 13.3 | |
| Média Intel Core i7-1065G7 (675 - 1650, n=23) | |
| Acer Spin 5 SP513-54N-79EY | |
| Dell XPS 13 7390 2-in-1 Core i7 | |
| HP Envy x360 13-ay0010nr | |
| Média da turma Convertible (105 - 1051, n=47, últimos 2 anos) | |
| 7-Zip 18.03 / 7z b 4 -mmt1 | |
| Média da turma Convertible (3672 - 6655, n=47, últimos 2 anos) | |
| Dell XPS 13 7390 2-in-1 Core i7 | |
| Acer Spin 5 SP513-54N-79EY | |
| Média Intel Core i7-1065G7 (3289 - 4589, n=24) | |
| HP Envy x360 13-ay0010nr | |
| Samsung Galaxy Book Flex 13.3 | |
| 7-Zip 18.03 / 7z b 4 | |
| Média da turma Convertible (12977 - 121368, n=47, últimos 2 anos) | |
| HP Envy x360 13-ay0010nr | |
| Dell XPS 13 7390 2-in-1 Core i7 | |
| Acer Spin 5 SP513-54N-79EY | |
| Média Intel Core i7-1065G7 (10406 - 22898, n=24) | |
| Samsung Galaxy Book Flex 13.3 | |
| Geekbench 5.5 / Single-Core | |
| Média da turma Convertible (806 - 2275, n=48, últimos 2 anos) | |
| Samsung Galaxy Book Flex 13.3 | |
| Acer Spin 5 SP513-54N-79EY | |
| Média Intel Core i7-1065G7 (948 - 1348, n=18) | |
| HP Envy x360 13-ay0010nr | |
| Geekbench 5.5 / Multi-Core | |
| Média da turma Convertible (1608 - 22023, n=48, últimos 2 anos) | |
| HP Envy x360 13-ay0010nr | |
| Samsung Galaxy Book Flex 13.3 | |
| Média Intel Core i7-1065G7 (2464 - 4855, n=18) | |
| Acer Spin 5 SP513-54N-79EY | |
| HWBOT x265 Benchmark v2.2 / 4k Preset | |
| Média da turma Convertible (3.43 - 36.2, n=47, últimos 2 anos) | |
| HP Envy x360 13-ay0010nr | |
| Dell XPS 13 7390 2-in-1 Core i7 | |
| Média Intel Core i7-1065G7 (2.2 - 6.38, n=22) | |
| Samsung Galaxy Book Flex 13.3 | |
| LibreOffice / 20 Documents To PDF | |
| HP Envy x360 13-ay0010nr | |
| Média Intel Core i7-1065G7 (46.9 - 85.3, n=19) | |
| Samsung Galaxy Book Flex 13.3 | |
| Acer Spin 5 SP513-54N-79EY | |
| Média da turma Convertible (42.5 - 84.3, n=47, últimos 2 anos) | |
| R Benchmark 2.5 / Overall mean | |
| Samsung Galaxy Book Flex 13.3 | |
| Média Intel Core i7-1065G7 (0.661 - 0.798, n=18) | |
| HP Envy x360 13-ay0010nr | |
| Média da turma Convertible (0.3915 - 0.84, n=47, últimos 2 anos) | |
* ... menor é melhor
| PCMark 8 Home Score Accelerated v2 | 4275 pontos | |
| PCMark 8 Work Score Accelerated v2 | 2723 pontos | |
| PCMark 10 Score | 4158 pontos | |
Ajuda | ||
| DPC Latencies / LatencyMon - interrupt to process latency (max), Web, Youtube, Prime95 | |
| HP Envy x360 13-ay0010nr | |
| Samsung Galaxy Book Flex 13.3 | |
| Acer Spin 5 SP513-54N-79EY | |
* ... menor é melhor
| Acer Spin 5 SP513-54N-79EY Samsung PM991 MZVLQ1T0HALB | Acer Spin 5 SP513-52N-54SF Micron 1100 MTFDDAV256TBN | HP Spectre x360 13-aw0013dx Intel Optane Memory H10 with Solid State Storage 32GB + 512GB HBRPEKNX0202A(L/H) | Dell XPS 13 7390 2-in-1 Core i7 Toshiba BG4 KBG40ZPZ512G | HP Envy x360 13-ay0010nr Toshiba KBG30ZMV256G | Samsung Galaxy Book Flex 13.3 Samsung SSD PM981a MZVLB256HBHQ | Média Samsung PM991 MZVLQ1T0HALB | |
|---|---|---|---|---|---|---|---|
| CrystalDiskMark 5.2 / 6 | 4% | -15% | -36% | 15% | -4% | ||
| Write 4K (MB/s) | 168.4 | 112.6 -33% | 106.7 -37% | 94.8 -44% | 157.9 -6% | 139.1 ? -17% | |
| Read 4K (MB/s) | 55 | 131 138% | 49.94 -9% | 45.5 -17% | 48.37 -12% | 42.3 ? -23% | |
| Write Seq (MB/s) | 458.9 | 1223 | 732 | 2196 | 1397 ? | ||
| Read Seq (MB/s) | 1355 | 1801 | 959 | 2064 | 1608 ? | ||
| Write 4K Q32T1 (MB/s) | 476.1 | 341.3 -28% | 325.3 -32% | 224.6 -53% | 457 -4% | 420 ? -12% | |
| Read 4K Q32T1 (MB/s) | 506 | 320.6 -37% | 551 9% | 365.2 -28% | 514 2% | 479 ? -5% | |
| Write Seq Q32T1 (MB/s) | 1492 | 1219 -18% | 1224 -18% | 864 -42% | 2354 58% | 1623 ? 9% | |
| Read Seq Q32T1 (MB/s) | 2357 | 2462 4% | 2350 0% | 1580 -33% | 3557 51% | 2592 ? 10% | |
| Write 4K Q8T8 (MB/s) | 930 | 724 ? -22% | |||||
| Read 4K Q8T8 (MB/s) | 963 | 1208 ? 25% | |||||
| AS SSD | -70% | -57% | -166% | -188% | 7% | -5% | |
| Seq Read (MB/s) | 2071 | 486.3 -77% | 1039 -50% | 1801 -13% | 1135 -45% | 2637 27% | 2181 ? 5% |
| Seq Write (MB/s) | 1462 | 421.4 -71% | 310.1 -79% | 1125 -23% | 628 -57% | 2000 37% | 1266 ? -13% |
| 4K Read (MB/s) | 49.82 | 25.48 -49% | 76 53% | 39.7 -20% | 42.49 -15% | 52.7 6% | 43.8 ? -12% |
| 4K Write (MB/s) | 140.7 | 80.8 -43% | 118 -16% | 67 -52% | 96.9 -31% | 148.4 5% | 138.4 ? -2% |
| 4K-64 Read (MB/s) | 869 | 235.5 -73% | 371.8 -57% | 1253 44% | 614 -29% | 647 -26% | 961 ? 11% |
| 4K-64 Write (MB/s) | 729 | 216.5 -70% | 469.5 -36% | 209 -71% | 256.4 -65% | 865 19% | 794 ? 9% |
| Access Time Read * (ms) | 0.069 | 0.11 -59% | 0.067 3% | 0.069 -0% | 0.162 -135% | 0.072 -4% | 0.07567 ? -10% |
| Access Time Write * (ms) | 0.028 | 0.055 -96% | 0.138 -393% | 0.625 -2132% | 0.592 -2014% | 0.026 7% | 0.048 ? -71% |
| Score Read (Points) | 1126 | 310 -72% | 552 -51% | 1472 31% | 770 -32% | 963 -14% | 1223 ? 9% |
| Score Write (Points) | 1016 | 340 -67% | 618 -39% | 388 -62% | 416 -59% | 1214 19% | 1059 ? 4% |
| Score Total (Points) | 2700 | 813 -70% | 1448 -46% | 2583 -4% | 1567 -42% | 2653 -2% | 2869 ? 6% |
| Copy ISO MB/s (MB/s) | 1574 | 327.5 -79% | 764 -51% | 1293 -18% | 843 -46% | 1694 ? 8% | |
| Copy Program MB/s (MB/s) | 553 | 157.3 -72% | 465.8 -16% | 560 1% | 367.9 -33% | 479 ? -13% | |
| Copy Game MB/s (MB/s) | 993 | 246.6 -75% | 764 -23% | 927 -7% | 727 -27% | 1023 ? 3% | |
| Média Total (Programa/Configurações) | -70% /
-70% | -27% /
-39% | -91% /
-121% | -112% /
-142% | 11% /
10% | -5% /
-5% |
* ... menor é melhor

Constant Performance Reads: DiskSpd Read Loop, Queue Depth 8
| 3DMark 11 Performance | 4748 pontos | |
| 3DMark Cloud Gate Standard Score | 11239 pontos | |
| 3DMark Fire Strike Score | 2383 pontos | |
| 3DMark Time Spy Score | 892 pontos | |
Ajuda | ||
| baixo | média | alto | ultra | |
|---|---|---|---|---|
| The Witcher 3 (2015) | 47.5 | 32.4 | 12.8 | |
| Dota 2 Reborn (2015) | 93.9 | 59.9 | 34.3 | 31.8 |
| Far Cry 5 (2018) | 30 | 15 | ||
| Battlefield V (2018) | 26.7 | 15.4 | 14 |
| Acer Spin 5 SP513-54N-79EY Iris Plus Graphics G7 (Ice Lake 64 EU), i7-1065G7, Samsung PM991 MZVLQ1T0HALB | Acer Spin 5 SP513-52N-54SF UHD Graphics 620, i5-8250U, Micron 1100 MTFDDAV256TBN | Dell XPS 13 7390 2-in-1 Core i7 Iris Plus Graphics G7 (Ice Lake 64 EU), i7-1065G7, Toshiba BG4 KBG40ZPZ512G | HP Spectre x360 13-aw0013dx Iris Plus Graphics G7 (Ice Lake 64 EU), i7-1065G7, Intel Optane Memory H10 with Solid State Storage 32GB + 512GB HBRPEKNX0202A(L/H) | HP Envy x360 13-ay0010nr Vega 6, R5 4500U, Toshiba KBG30ZMV256G | Samsung Galaxy Book Flex 13.3 Iris Plus Graphics G4 (Ice Lake 48 EU), i5-1035G4, Samsung SSD PM981a MZVLB256HBHQ | |
|---|---|---|---|---|---|---|
| Noise | -11% | -9% | -4% | -14% | -12% | |
| desligado / ambiente * (dB) | 26.9 | 30.4 -13% | 28.1 -4% | 28.5 -6% | 28 -4% | 30.7 -14% |
| Idle Minimum * (dB) | 26.9 | 30.4 -13% | 28.1 -4% | 28.5 -6% | 28 -4% | 30.7 -14% |
| Idle Average * (dB) | 26.9 | 30.4 -13% | 28.1 -4% | 28.5 -6% | 28 -4% | 30.7 -14% |
| Idle Maximum * (dB) | 27.8 | 30.9 -11% | 28.1 -1% | 28.5 -3% | 28.5 -3% | 30.7 -10% |
| Load Average * (dB) | 30.5 | 34 -11% | 31.7 -4% | 28.5 7% | 41.1 -35% | 34.8 -14% |
| Load Maximum * (dB) | 32.4 | 33.5 -3% | 43.4 -34% | 35.3 -9% | 43.5 -34% | 34.5 -6% |
| Witcher 3 ultra * (dB) | 43.4 | 35.3 | 34.5 |
* ... menor é melhor
Barulho
| Ocioso |
| 26.9 / 26.9 / 27.8 dB |
| Carga |
| 30.5 / 32.4 dB |
 | ||
30 dB silencioso 40 dB(A) audível 50 dB(A) ruidosamente alto |
||
min: | ||
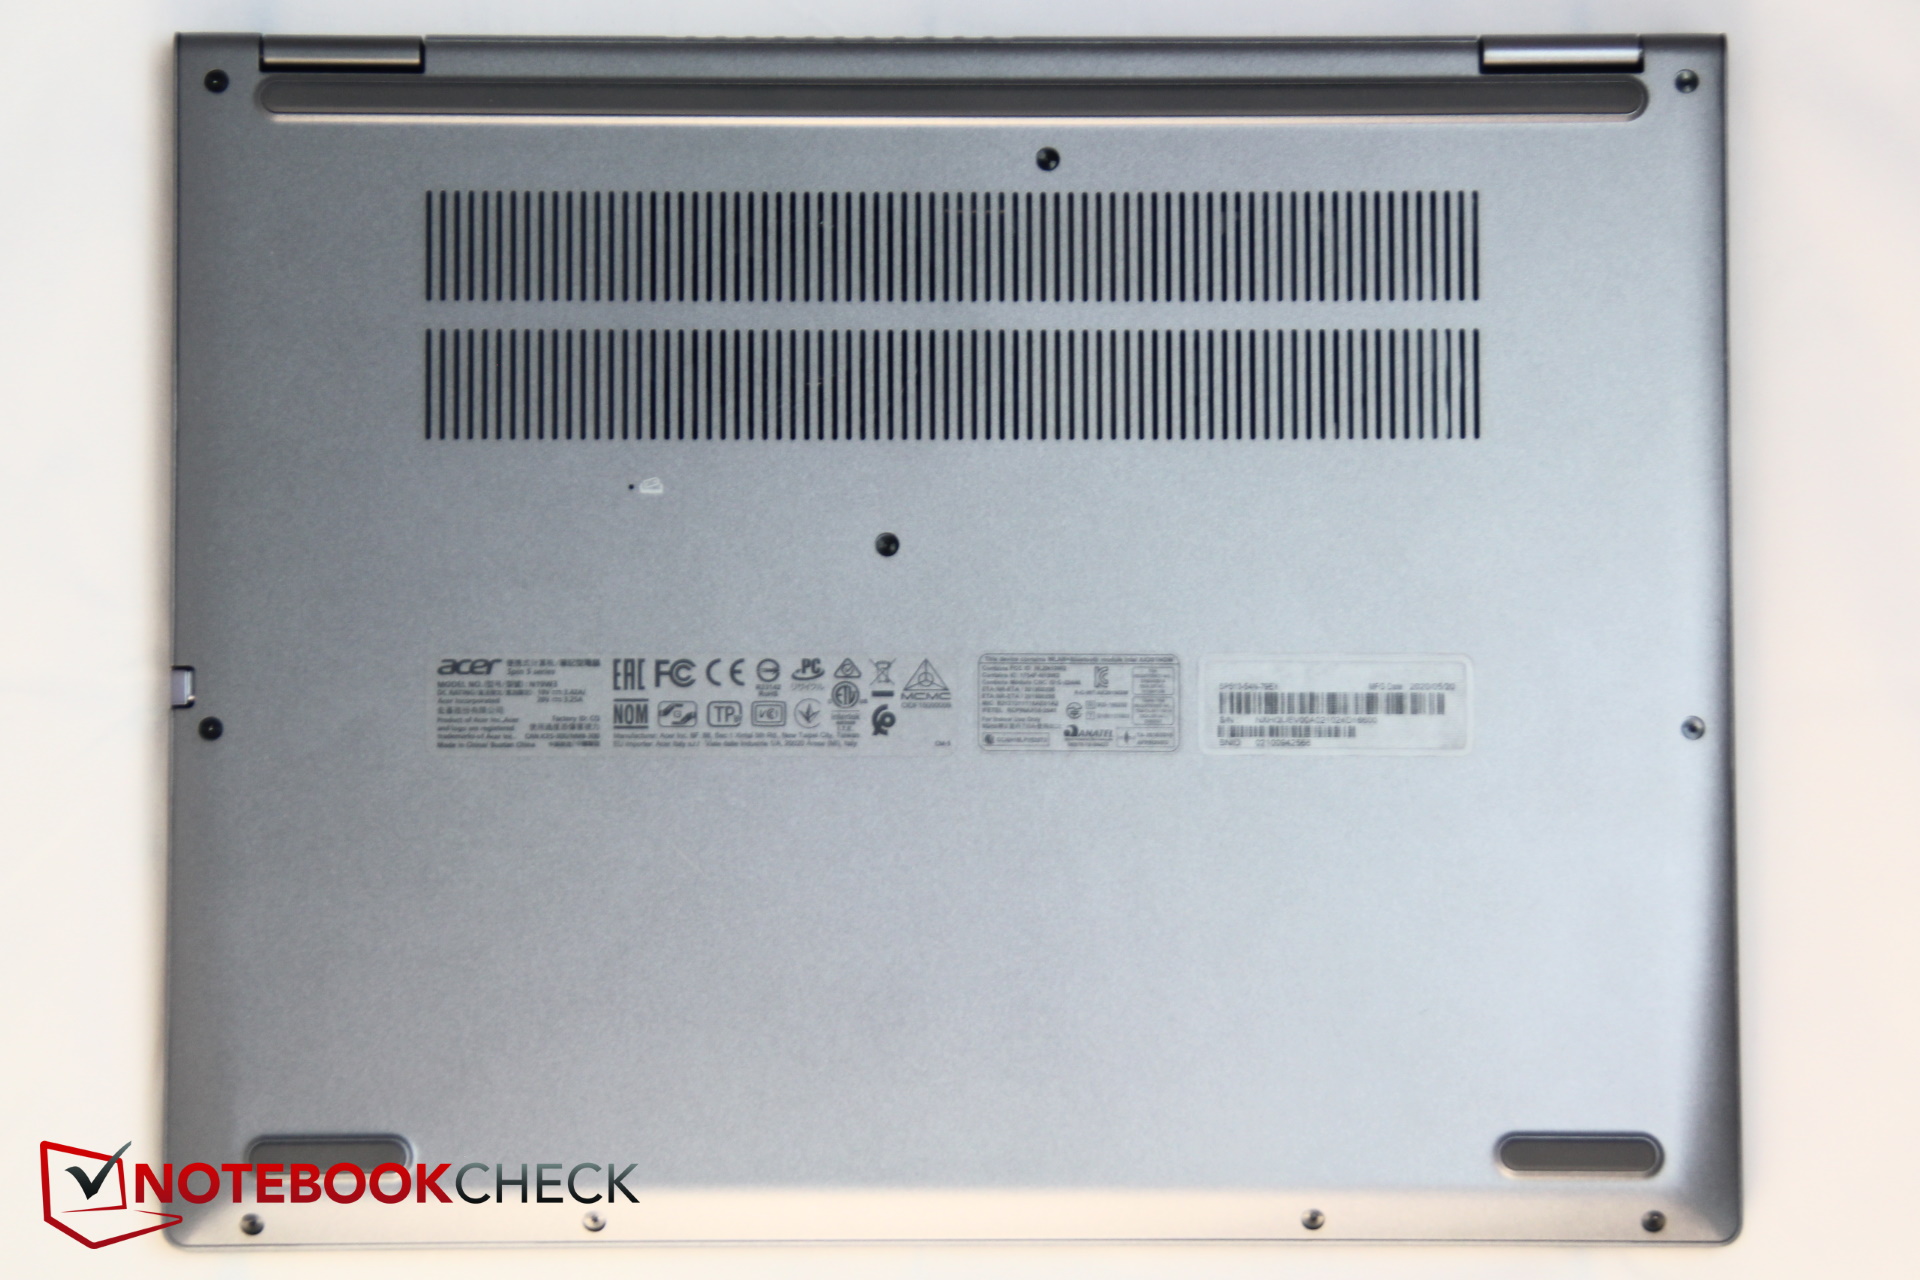
(+) A temperatura máxima no lado superior é 38.7 °C / 102 F, em comparação com a média de 35.4 °C / 96 F , variando de 19.6 a 60 °C para a classe Convertible.
(±) A parte inferior aquece até um máximo de 40.2 °C / 104 F, em comparação com a média de 36.9 °C / 98 F
(+) Em uso inativo, a temperatura média para o lado superior é 26.7 °C / 80 F, em comparação com a média do dispositivo de 30.3 °C / ### class_avg_f### F.
(+) Os apoios para as mãos e o touchpad são mais frios que a temperatura da pele, com um máximo de 29.6 °C / 85.3 F e, portanto, são frios ao toque.
(±) A temperatura média da área do apoio para as mãos de dispositivos semelhantes foi 28 °C / 82.4 F (-1.6 °C / -2.9 F).
Acer Spin 5 SP513-54N-79EY análise de áudio
(±) | o volume do alto-falante é médio, mas bom (###valor### dB)
Graves 100 - 315Hz
(-) | quase nenhum baixo - em média 31.1% menor que a mediana
(±) | a linearidade dos graves é média (11.3% delta para a frequência anterior)
Médios 400 - 2.000 Hz
(+) | médios equilibrados - apenas 4.5% longe da mediana
(±) | a linearidade dos médios é média (9.3% delta para frequência anterior)
Altos 2 - 16 kHz
(+) | agudos equilibrados - apenas 3.1% longe da mediana
(+) | os máximos são lineares (4.8% delta da frequência anterior)
Geral 100 - 16.000 Hz
(±) | a linearidade do som geral é média (23.6% diferença em relação à mediana)
Comparado com a mesma classe
» 71% de todos os dispositivos testados nesta classe foram melhores, 5% semelhantes, 24% piores
» O melhor teve um delta de 6%, a média foi 20%, o pior foi 57%
Comparado com todos os dispositivos testados
» 71% de todos os dispositivos testados foram melhores, 6% semelhantes, 23% piores
» O melhor teve um delta de 4%, a média foi 23%, o pior foi 134%
Apple MacBook 12 (Early 2016) 1.1 GHz análise de áudio
(+) | os alto-falantes podem tocar relativamente alto (###valor### dB)
Graves 100 - 315Hz
(±) | graves reduzidos - em média 11.3% menor que a mediana
(±) | a linearidade dos graves é média (14.2% delta para a frequência anterior)
Médios 400 - 2.000 Hz
(+) | médios equilibrados - apenas 2.4% longe da mediana
(+) | médios são lineares (5.5% delta para frequência anterior)
Altos 2 - 16 kHz
(+) | agudos equilibrados - apenas 2% longe da mediana
(+) | os máximos são lineares (4.5% delta da frequência anterior)
Geral 100 - 16.000 Hz
(+) | o som geral é linear (10.2% diferença em relação à mediana)
Comparado com a mesma classe
» 7% de todos os dispositivos testados nesta classe foram melhores, 2% semelhantes, 90% piores
» O melhor teve um delta de 5%, a média foi 18%, o pior foi 53%
Comparado com todos os dispositivos testados
» 5% de todos os dispositivos testados foram melhores, 1% semelhantes, 94% piores
» O melhor teve um delta de 4%, a média foi 23%, o pior foi 134%
| desligado | |
| Ocioso | |
| Carga |
|
Key:
min: | |
| Acer Spin 5 SP513-54N-79EY i7-1065G7, Iris Plus Graphics G7 (Ice Lake 64 EU), Samsung PM991 MZVLQ1T0HALB, IPS, 2256x1504, 13.5" | Acer Spin 5 SP513-52N-54SF i5-8250U, UHD Graphics 620, Micron 1100 MTFDDAV256TBN, IPS, 1920x1080, 13.3" | Dell XPS 13 7390 2-in-1 Core i7 i7-1065G7, Iris Plus Graphics G7 (Ice Lake 64 EU), Toshiba BG4 KBG40ZPZ512G, IPS, 1920x1200, 13.4" | HP Spectre x360 13-aw0013dx i7-1065G7, Iris Plus Graphics G7 (Ice Lake 64 EU), Intel Optane Memory H10 with Solid State Storage 32GB + 512GB HBRPEKNX0202A(L/H), IPS, 1920x1080, 13.3" | HP Envy x360 13-ay0010nr R5 4500U, Vega 6, Toshiba KBG30ZMV256G, IPS, 1920x1080, 13.3" | Samsung Galaxy Book Flex 13.3 i5-1035G4, Iris Plus Graphics G4 (Ice Lake 48 EU), Samsung SSD PM981a MZVLB256HBHQ, IPS, 1920x1080, 13.3" | Média Intel Iris Plus Graphics G7 (Ice Lake 64 EU) | Média da turma Convertible | |
|---|---|---|---|---|---|---|---|---|
| Power Consumption | -14% | -7% | -19% | -15% | -23% | -28% | -38% | |
| Idle Minimum * (Watt) | 2.8 | 3.9 -39% | 2.6 7% | 3.9 -39% | 3.9 -39% | 3.3 -18% | 3.91 ? -40% | 4.2 ? -50% |
| Idle Average * (Watt) | 5.4 | 8.2 -52% | 5.3 2% | 6.3 -17% | 5.8 -7% | 8.9 -65% | 7.33 ? -36% | 6.89 ? -28% |
| Idle Maximum * (Watt) | 7.6 | 8.8 -16% | 7 8% | 6.8 11% | 6 21% | 10.4 -37% | 9.16 ? -21% | 8.63 ? -14% |
| Load Average * (Watt) | 36.6 | 28.5 22% | 43.1 -18% | 32.6 11% | 41.5 -13% | 40 -9% | 39.2 ? -7% | 44.1 ? -20% |
| Load Maximum * (Watt) | 37 | 30.7 17% | 49 -32% | 59 -59% | 50.4 -36% | 32 14% | 49.8 ? -35% | 66.5 ? -80% |
| Witcher 3 ultra * (Watt) | 43.1 | 25.6 | 28 |
* ... menor é melhor
| Acer Spin 5 SP513-54N-79EY i7-1065G7, Iris Plus Graphics G7 (Ice Lake 64 EU), 55 Wh | Acer Spin 5 SP513-52N-54SF i5-8250U, UHD Graphics 620, 53.9 Wh | Dell XPS 13 7390 2-in-1 Core i7 i7-1065G7, Iris Plus Graphics G7 (Ice Lake 64 EU), 51 Wh | HP Spectre x360 13-aw0013dx i7-1065G7, Iris Plus Graphics G7 (Ice Lake 64 EU), 60 Wh | HP Envy x360 13-ay0010nr R5 4500U, Vega 6, 51 Wh | Samsung Galaxy Book Flex 13.3 i5-1035G4, Iris Plus Graphics G4 (Ice Lake 48 EU), 69.7 Wh | Média da turma Convertible | |
|---|---|---|---|---|---|---|---|
| Duração da bateria | -23% | -17% | 24% | 11% | -25% | 12% | |
| Reader / Idle (h) | 21.7 | 37.1 71% | 31.9 47% | 11.6 -47% | 26.7 ? 23% | ||
| H.264 (h) | 10.5 | 15 ? 43% | |||||
| WiFi v1.3 (h) | 10.8 | 8.3 -23% | 9 -17% | 9.9 -8% | 11.8 9% | 7.2 -33% | 12 ? 11% |
| Load (h) | 2.5 | 2.7 8% | 1.9 -24% | 2.6 4% | 1.713 ? -31% |
Pro
Contra
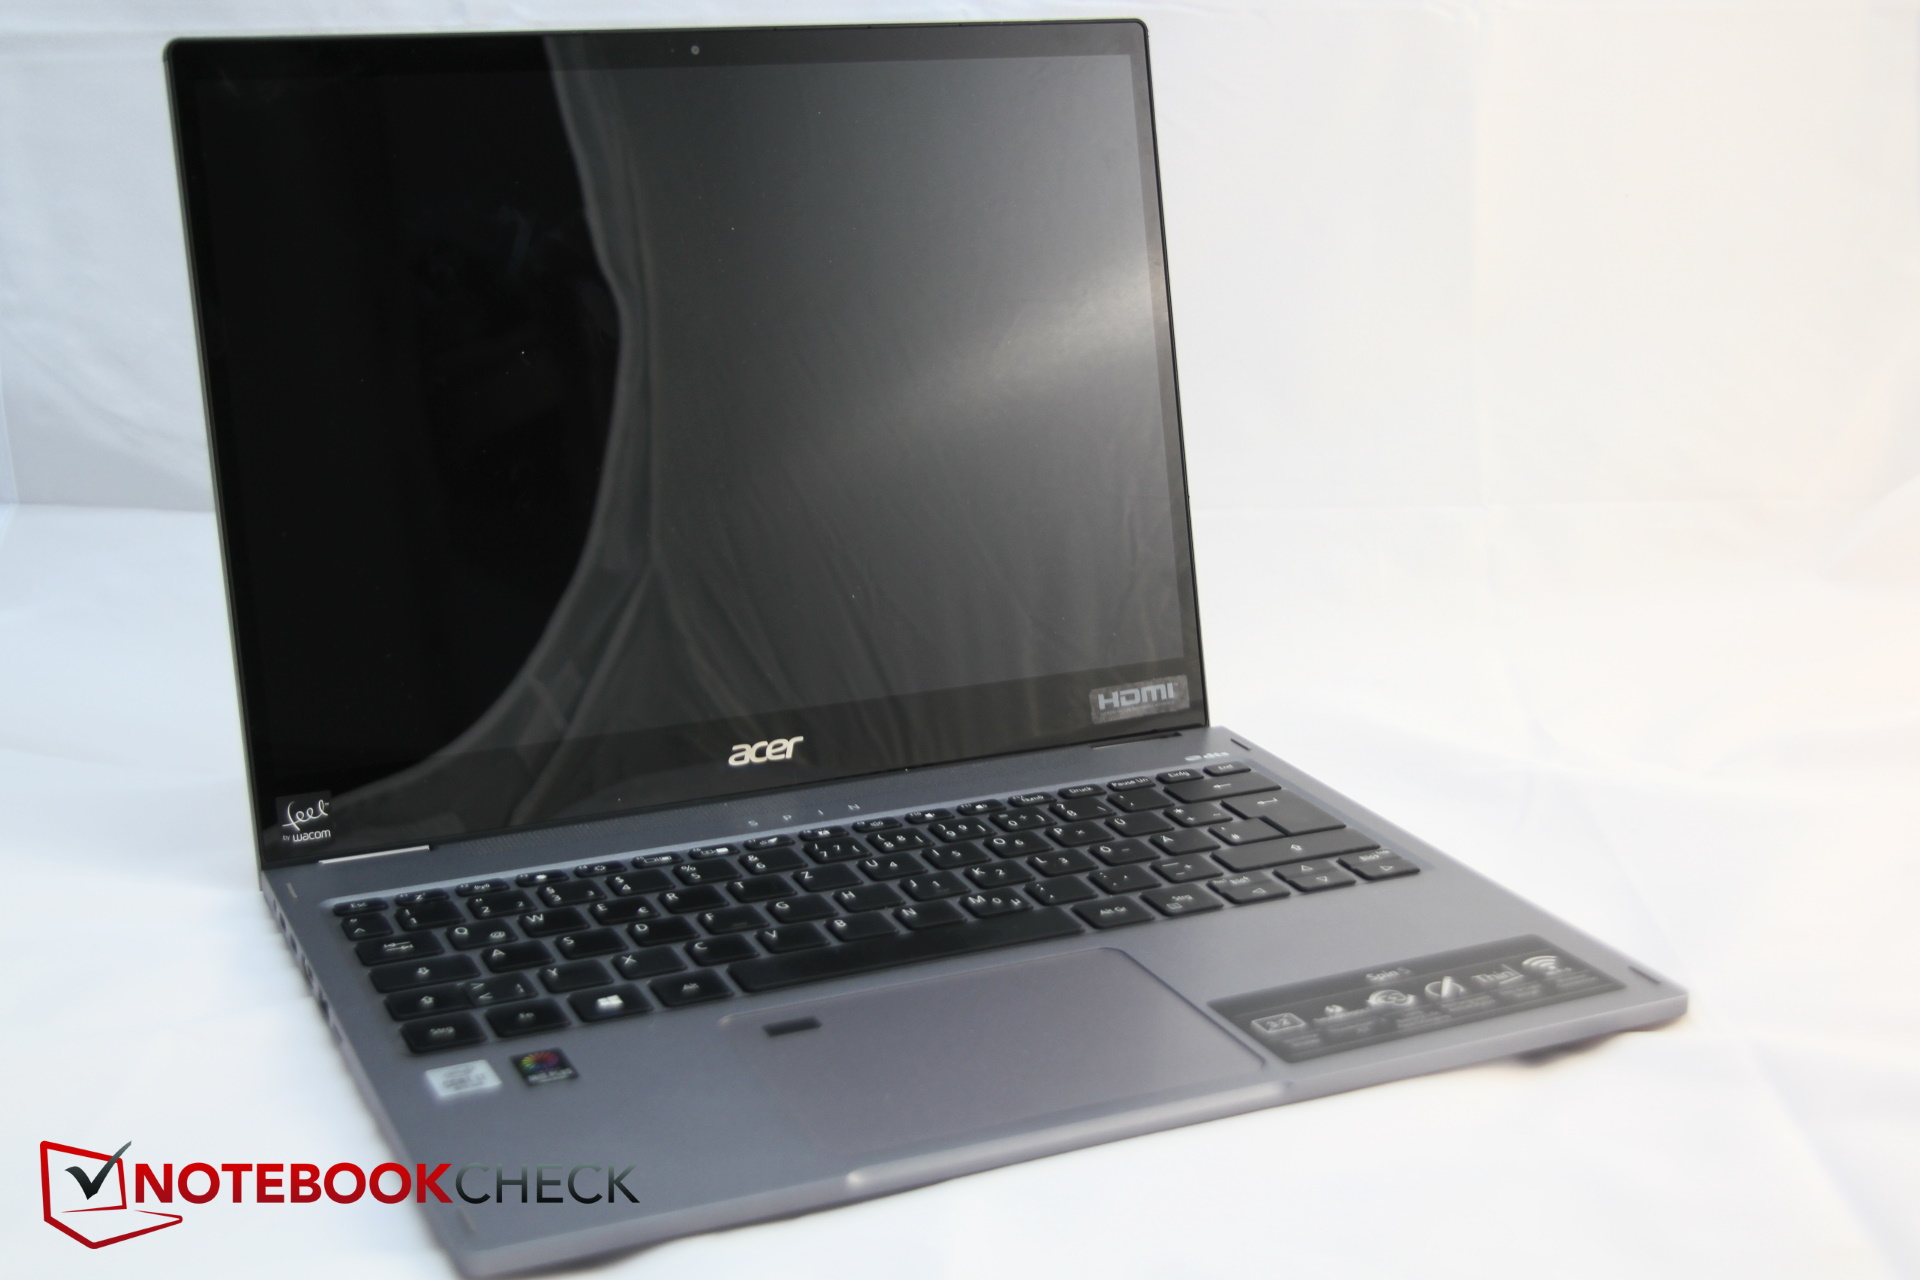
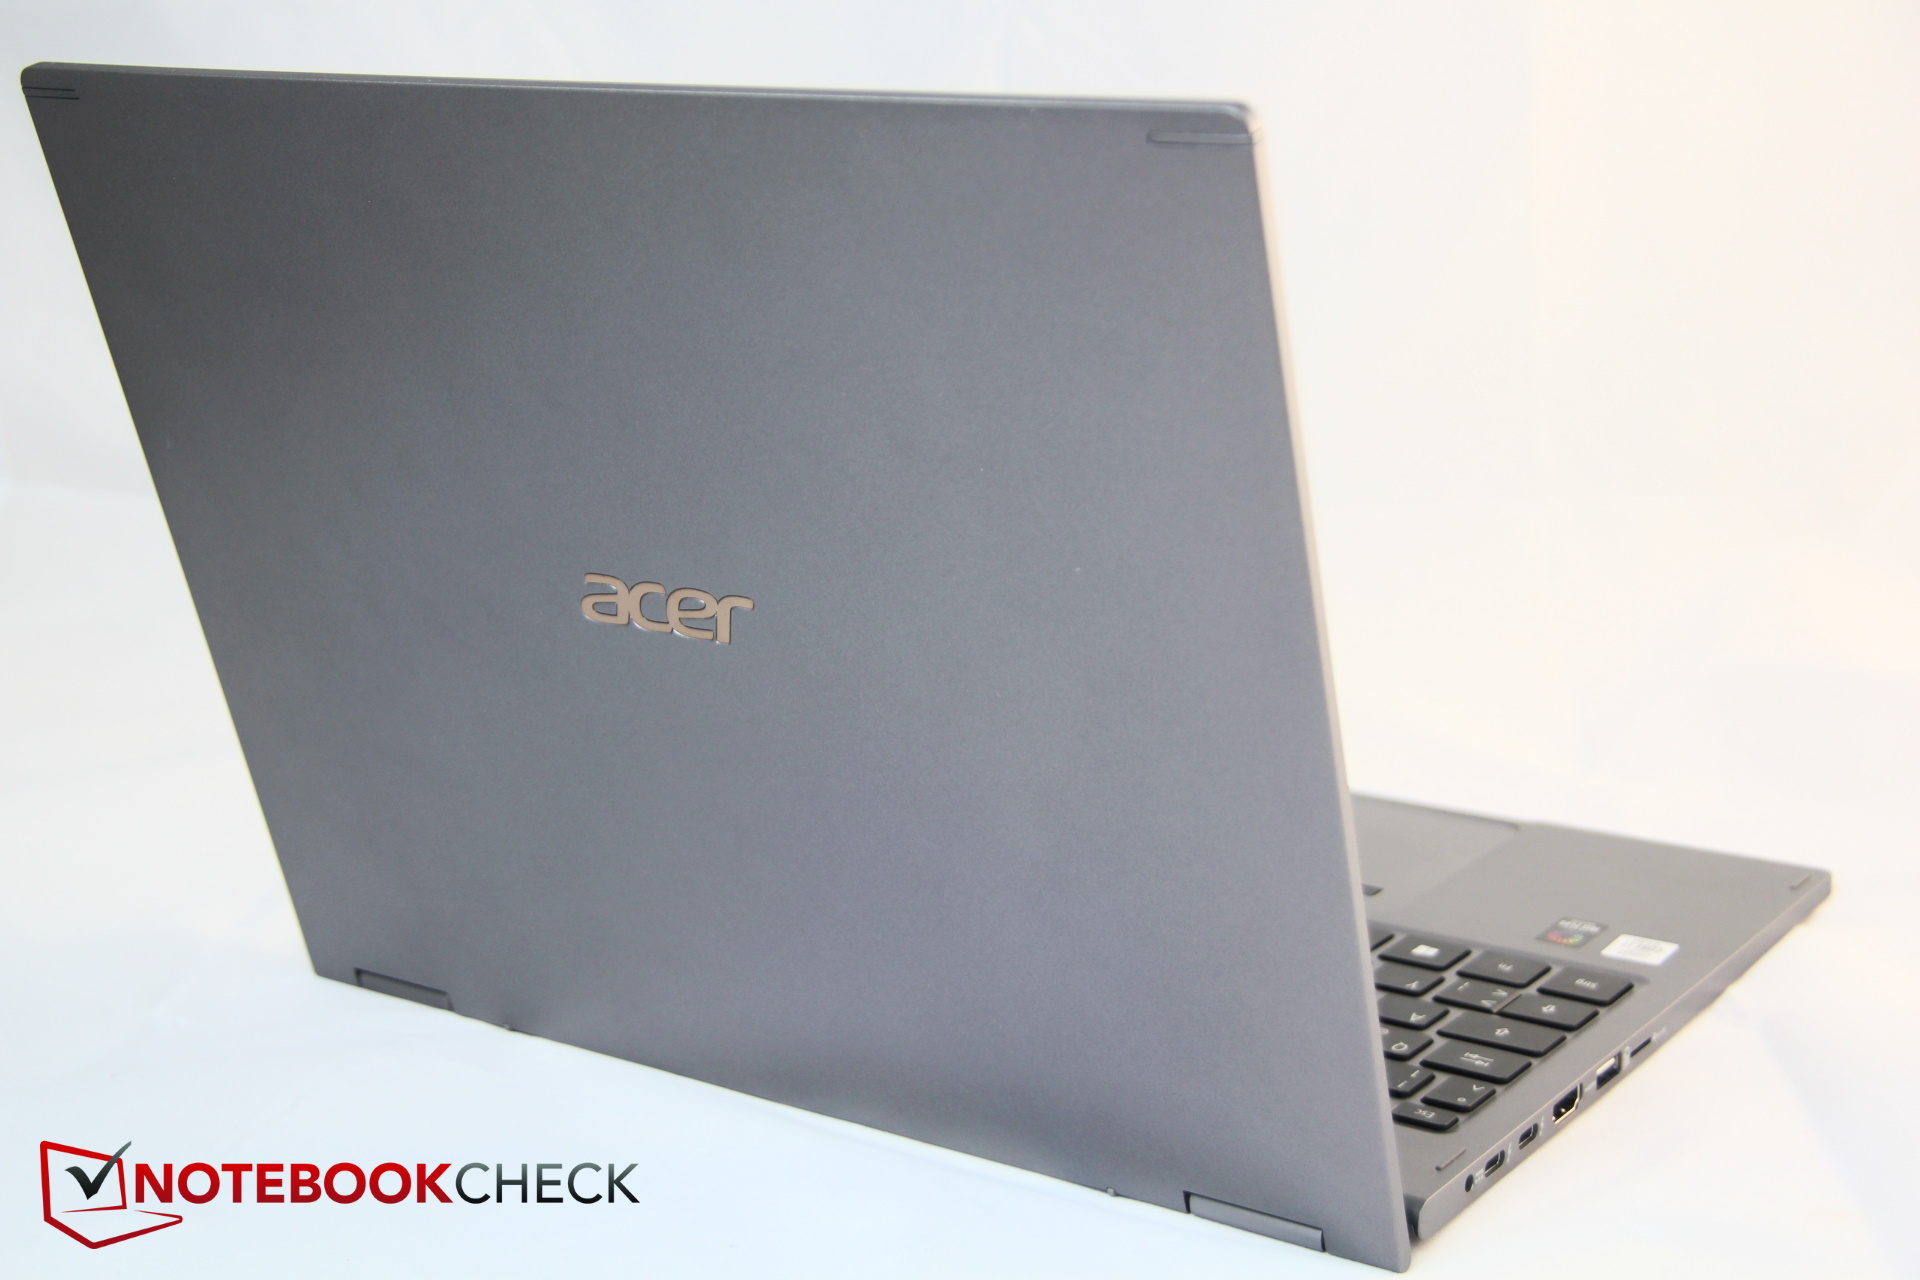
Veredicto - Um conversível otimizado
Com o novo Spin 5, a Acer apresenta um conversível equilibrado que executa muito bem suas tarefas. Você quase pode sentir como o fabricante otimizou a série ao longo do tempo.
Um ponto de reclamação é o leitor de cartão lento, que também aceita apenas cartões microSD. O uso de PWM em baixa frequência para controle de brilho pode se tornar problemático para compradores sensíveis, causando desconforto visual.
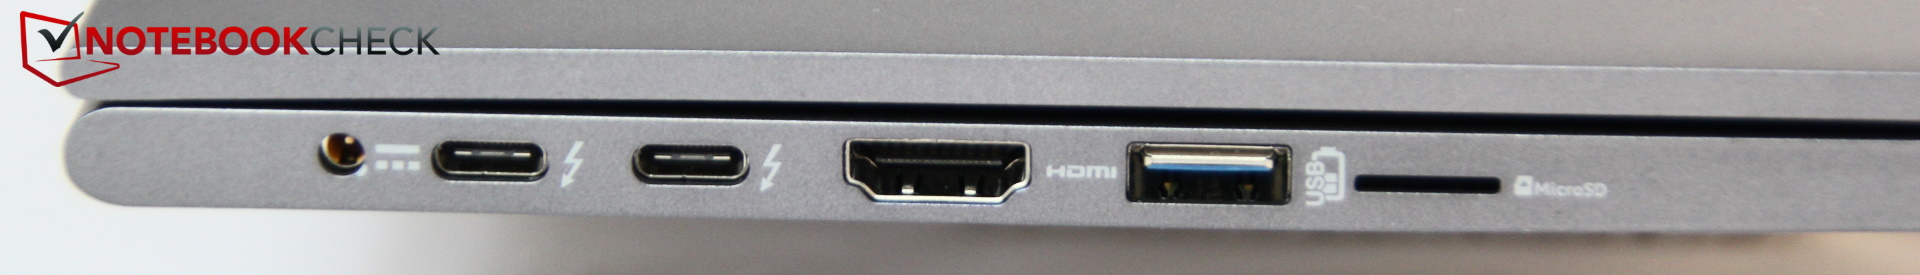
Em contraste, há também muitos aspectos positivos: a tela é uma das melhores no teste, o conversível sempre funciona silenciosamente e na maioria das vezes também frio, Thunderbolt está a bordo duas vezes, e assim por diante.
É notável que o Acer Spin 5 é o resultado da otimização contínua da Acer. Parece extremamente equilibrado e faz quase tudo certo. Além do controle de brilho PWM, quase não há razões para reclamar.
Podemos recomendar o Spin 5 com a consciência limpa. Neste ponto, custa 1.209 Euros (~ $ 1.427). Aqueles que precisam de mais desempenho e ainda mais bateria devem dar uma olhada no novo portátil HP Envy x360 AMD Renoir, que inclusive custa menos! Por outro lado, o portátil AMD não oferece Thunderbolt 3.
Acer Spin 5 SP513-54N-79EY
- 08/27/2020 v7 (old)
Christian Hintze
Price comparison
