Breve Análise do Conversível Microsoft Surface Pro 6 (2018) (Core i7, 512GB, 16GB)
| SD Card Reader | |
| average JPG Copy Test (av. of 3 runs) | |
| Microsoft Surface Book 2 (Toshiba Exceria Pro SDXC 64 GB UHS-II) | |
| Dell Latitude 5290 2-in-1 (Toshiba Exceria Pro M501 UHS-II) | |
| Microsoft Surface Pro 6, Core i7, 512 GB (Toshiba Exceria Pro M501 microSDXC 64GB) | |
| Média da turma Convertible (29.4 - 186, n=21, últimos 2 anos) | |
| Microsoft Surface Go MHN-00003 (Toshiba Exceria Pro M501) | |
| maximum AS SSD Seq Read Test (1GB) | |
| Microsoft Surface Book 2 (Toshiba Exceria Pro SDXC 64 GB UHS-II) | |
| Dell Latitude 5290 2-in-1 (Toshiba Exceria Pro M501 UHS-II) | |
| Média da turma Convertible (67.5 - 254, n=20, últimos 2 anos) | |
| Microsoft Surface Pro 6, Core i7, 512 GB (Toshiba Exceria Pro M501 microSDXC 64GB) | |
| Microsoft Surface Go MHN-00003 (Toshiba Exceria Pro M501) | |
| |||||||||||||||||||||||||
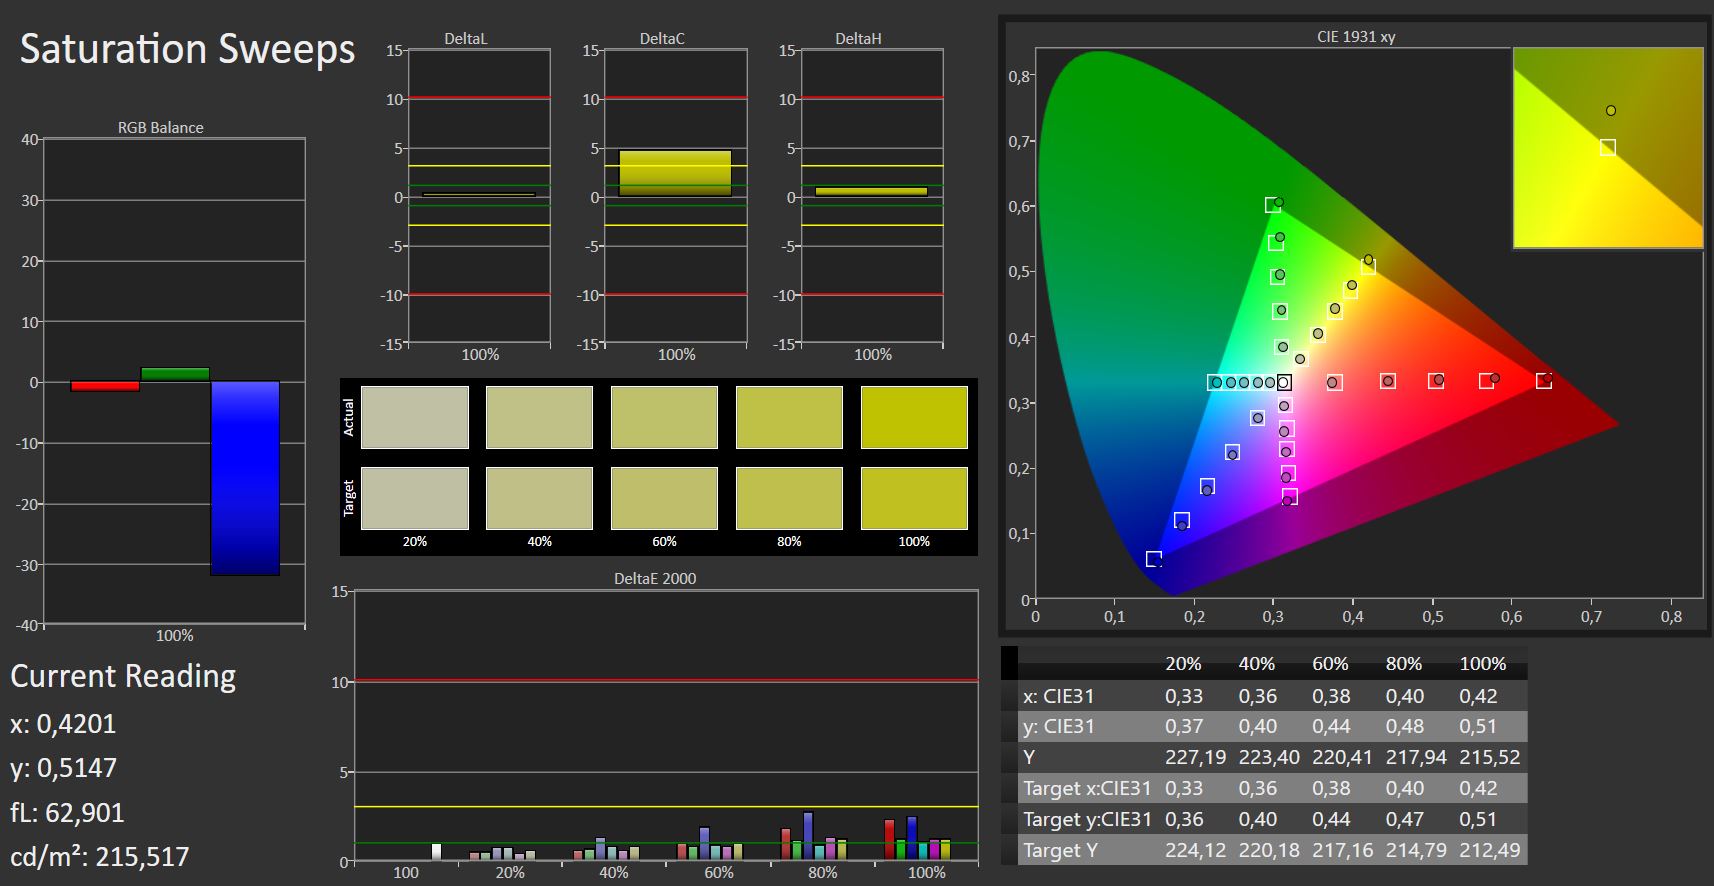
iluminação: 91 %
iluminação com acumulador: 484 cd/m²
Contraste: 1467:1 (Preto: 0.33 cd/m²)
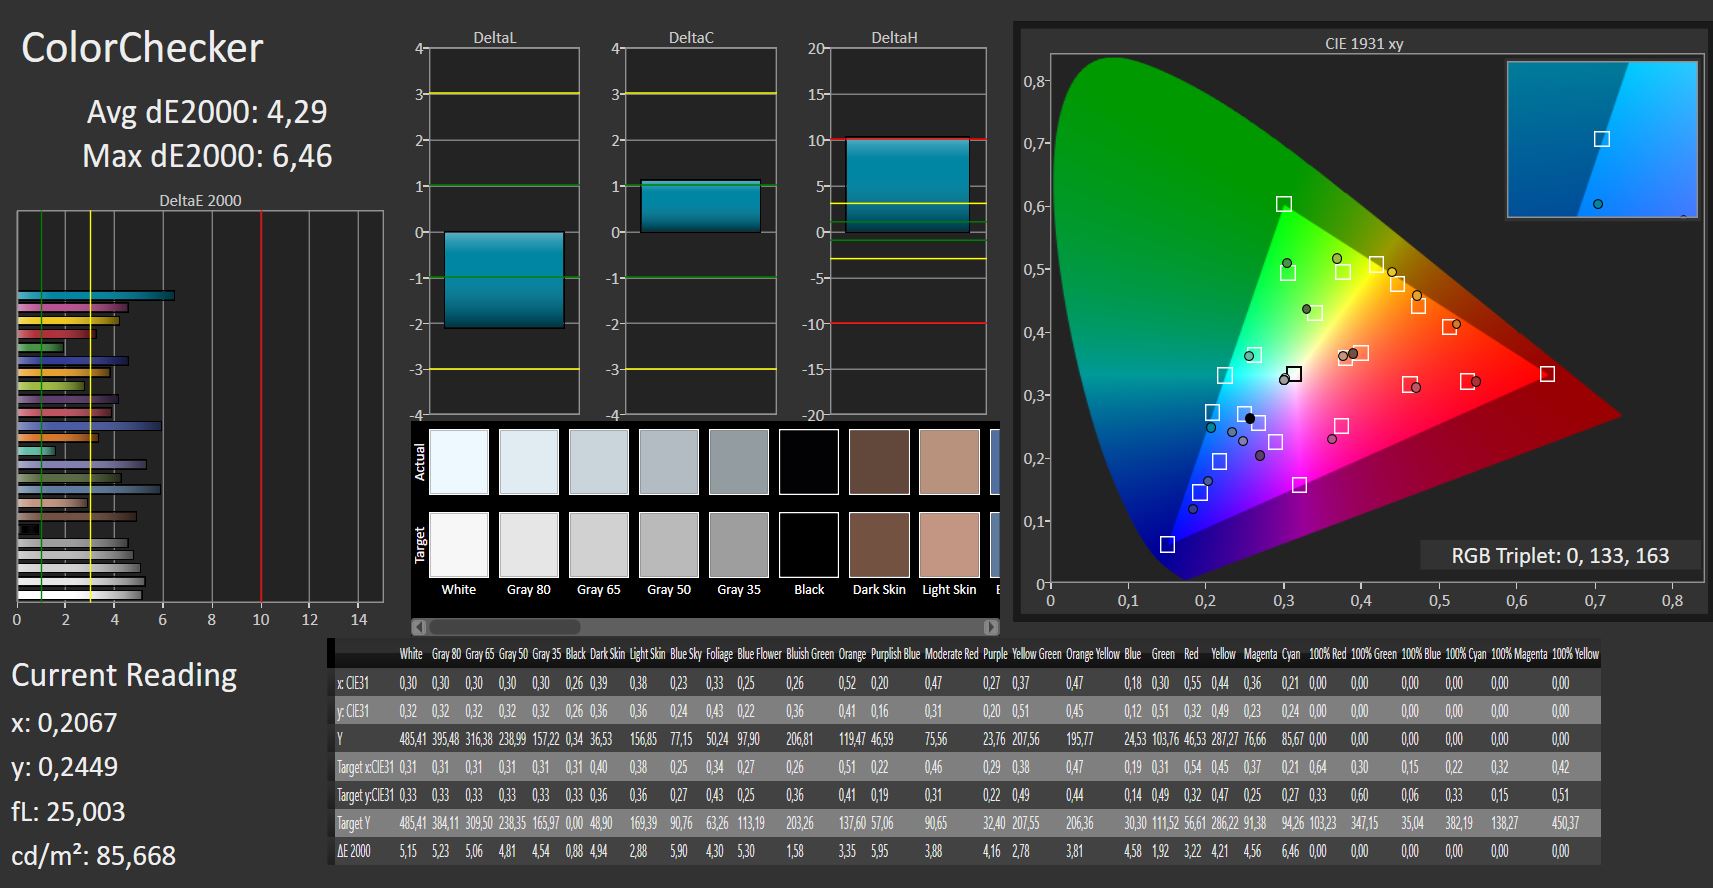
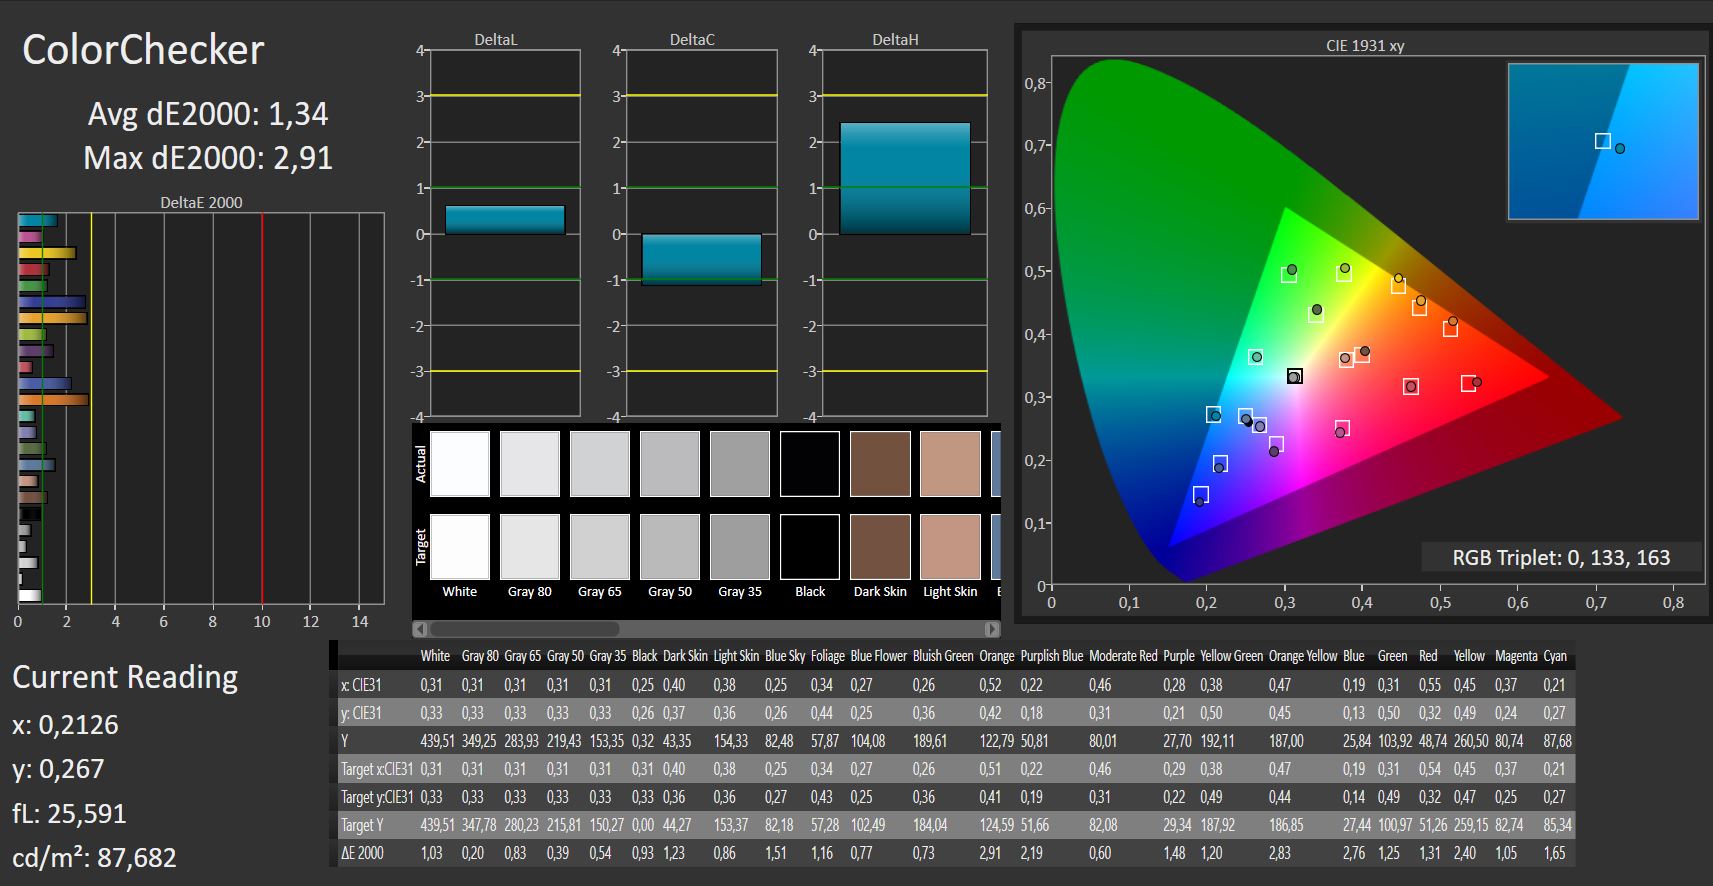
ΔE ColorChecker Calman: 4.29 | ∀{0.5-29.43 Ø4.71}
calibrated: 1.34
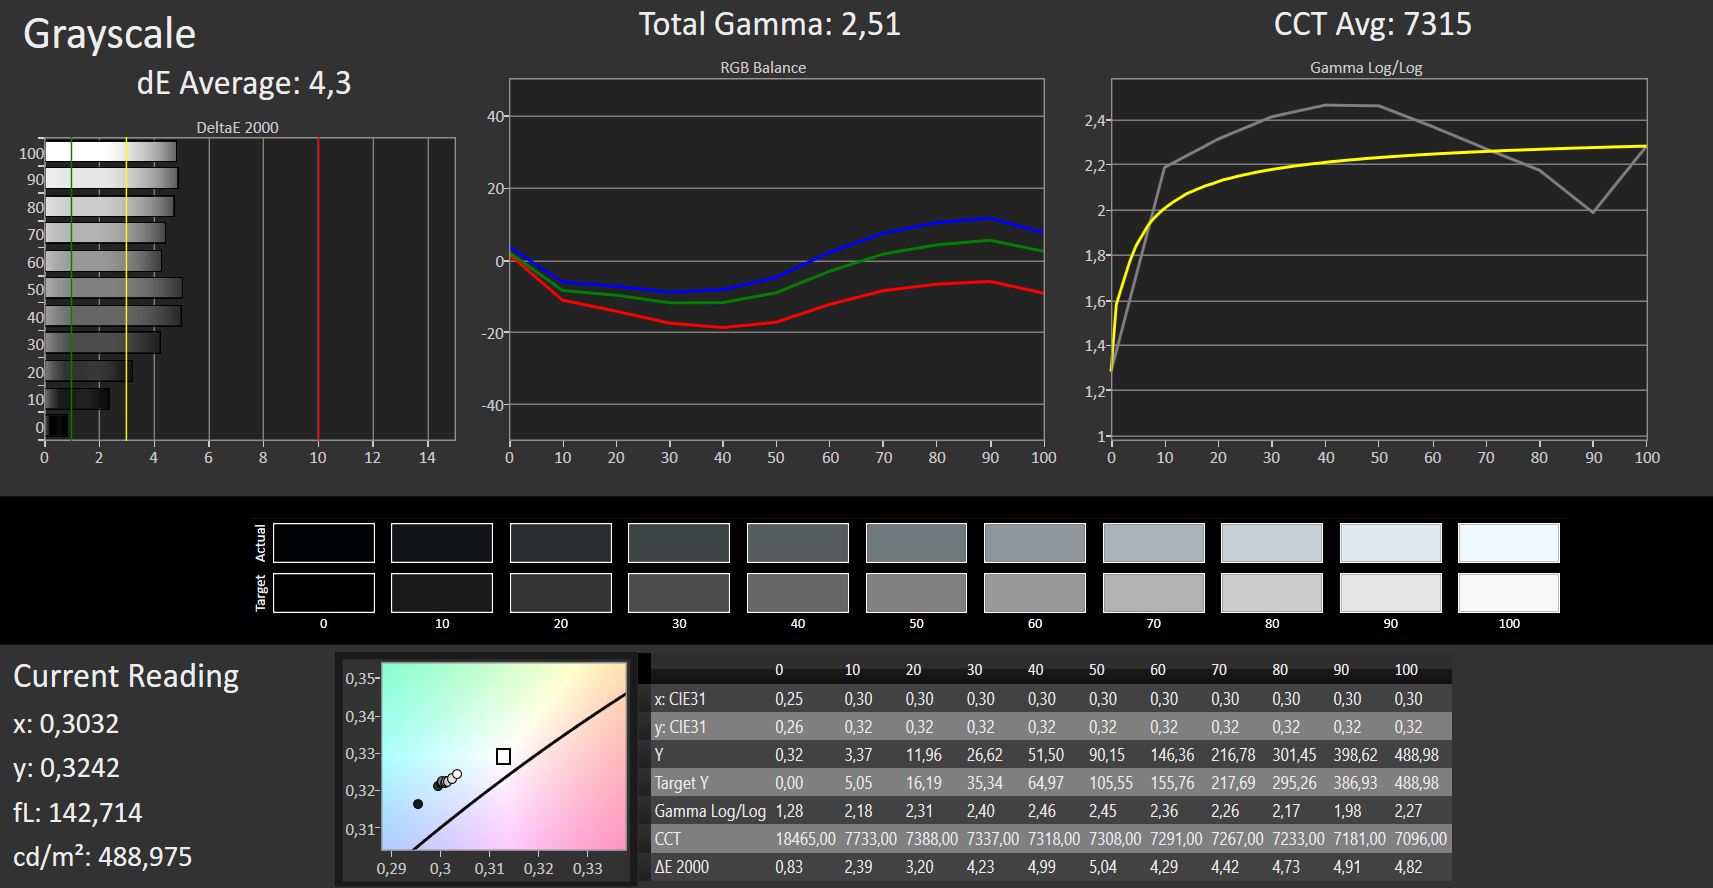
ΔE Greyscale Calman: 4.3 | ∀{0.09-98 Ø4.96}
95% sRGB (Argyll 1.6.3 3D)
62% AdobeRGB 1998 (Argyll 1.6.3 3D)
67.9% AdobeRGB 1998 (Argyll 3D)
95.5% sRGB (Argyll 3D)
67.1% Display P3 (Argyll 3D)
Gamma: 2.51
CCT: 7315 K
| Microsoft Surface Pro 6, Core i7, 512 GB LGPhilips LP123WQ112604, , 2736x1824, 12.3" | Microsoft Surface Pro (2017) i5 LG Display LP123WQ112604, , 2736x1824, 12.3" | Dell Latitude 5290 2-in-1 SHP1479, , 1920x1280, 12.3" | HP Elite x2 1013 G3-2TT14EA AU Optronics AUO101A, , 3000x2000, 13" | Lenovo ThinkPad X1 Tablet G3-20KJ001NGE LP130QP1-SPA1, , 3000x2000, 13" | Samsung Galaxy Book 12 SM-W728 Samsung SDCA029, , 2160x1440, 12" | Microsoft Surface Book 2 Panasonic MEI96A2 , , 3000x2000, 13.5" | Microsoft Surface Go MHN-00003 Sharp SHP14A6, , 1800x1200, 10" | Huawei Matebook E Chi Mei CMN7801, , 2160x1440, 12" | Lenovo Miix 520-12IKB 20M3000LGE Unbekannt, , 1920x1200, 12.2" | |
|---|---|---|---|---|---|---|---|---|---|---|
| Display | 2% | 4% | 1% | 3% | 11% | 1% | 0% | 17% | -2% | |
| Display P3 Coverage (%) | 67.1 | 67.6 1% | 70.5 5% | 67.5 1% | 68.1 1% 67.8 1% | 77.3 15% | 67.9 1% | 66.5 -1% | 84.9 27% | 66.1 -1% |
| sRGB Coverage (%) | 95.5 | 99 4% | 98.6 3% | 96.7 1% | 99.4 4% 99.1 4% | 92.8 -3% | 95.7 0% | 97.5 2% | 99.8 5% | 91.6 -4% |
| AdobeRGB 1998 Coverage (%) | 67.9 | 69.1 2% | 71.5 5% | 68.2 0% | 69.9 3% 69.3 2% | 83.1 22% | 69.4 2% | 67.5 -1% | 79.9 18% | 66.7 -2% |
| Response Times | -7% | -38% | -7% | -40% | 56% | -22% | -2% | 26% | 12% | |
| Response Time Grey 50% / Grey 80% * (ms) | 43 ? | 42 ? 2% | 56.8 ? -32% | 47 ? -9% | 47.2 ? -10% | 4 ? 91% | 52.8 ? -23% | 44 ? -2% | 26 ? 40% | 36 ? 16% |
| Response Time Black / White * (ms) | 25 ? | 29 ? -16% | 36 ? -44% | 26 ? -4% | 42.4 ? -70% | 20 ? 20% | 30 ? -20% | 25.6 ? -2% | 22 ? 12% | 23 ? 8% |
| PWM Frequency (Hz) | 22000 ? | 21000 | 1852 ? | 250 ? | 1020 ? | 200 ? | ||||
| Screen | 4% | -10% | -12% | 3% | 84% | 18% | 18% | -9% | -31% | |
| Brightness middle (cd/m²) | 484 | 417 -14% | 548 13% | 452 -7% | 474 -2% | 376 -22% | 385 -20% | 456 -6% | 439 -9% | 384 -21% |
| Brightness (cd/m²) | 473 | 401 -15% | 545 15% | 412 -13% | 418 -12% | 378 -20% | 372 -21% | 426 -10% | 428 -10% | 355 -25% |
| Brightness Distribution (%) | 91 | 88 -3% | 86 -5% | 85 -7% | 76 -16% | 91 0% | 89 -2% | 88 -3% | 92 1% | 80 -12% |
| Black Level * (cd/m²) | 0.33 | 0.29 12% | 0.51 -55% | 0.48 -45% | 0.33 -0% | 0.03 91% | 0.21 36% | 0.31 6% | 0.35 -6% | 0.56 -70% |
| Contrast (:1) | 1467 | 1438 -2% | 1075 -27% | 942 -36% | 1436 -2% | 12533 754% | 1833 25% | 1471 0% | 1254 -15% | 686 -53% |
| Colorchecker dE 2000 * | 4.29 | 3.63 15% | 3.65 15% | 4.05 6% | 3.2 25% | 4.1 4% | 1.6 63% | 1.3 70% | 5.17 -21% | 4.58 -7% |
| Colorchecker dE 2000 max. * | 6.46 | 6.74 -4% | 7.15 -11% | 6.64 -3% | 6.1 6% | 6.45 -0% | 4.5 30% | 3 54% | 7.68 -19% | 11.63 -80% |
| Colorchecker dE 2000 calibrated * | 1.34 | 1.81 -35% | 1.56 -16% | 0.9 33% | 1.1 18% | |||||
| Greyscale dE 2000 * | 4.3 | 2.18 49% | 5.5 -28% | 4.87 -13% | 4.5 -5% | 3.64 15% | 1.5 65% | 1.4 67% | 5.69 -32% | 5.63 -31% |
| Gamma | 2.51 88% | 3.09 71% | 2.154 102% | 2.71 81% | 2.07 106% | 2.58 85% | 2.22 99% | 2.24 98% | 2.42 91% | 2.45 90% |
| CCT | 7315 89% | 6767 96% | 7052 92% | 7160 91% | 5881 111% | 7113 91% | 6502 100% | 6687 97% | 7999 81% | 7571 86% |
| Color Space (Percent of AdobeRGB 1998) (%) | 62 | 63 2% | 65.2 5% | 62 0% | 64 3% | 74 19% | 64 3% | 62.3 0% | 71 15% | 60 -3% |
| Color Space (Percent of sRGB) (%) | 95 | 99 4% | 99.1 4% | 97 2% | 99.4 5% | 93 -2% | 95.9 1% | 96.8 2% | 100 5% | 92 -3% |
| Média Total (Programa/Configurações) | -0% /
2% | -15% /
-11% | -6% /
-9% | -11% /
-2% | 50% /
66% | -1% /
9% | 5% /
12% | 11% /
1% | -7% /
-19% |
* ... menor é melhor
Exibir tempos de resposta
| ↔ Tempo de resposta preto para branco | ||
|---|---|---|
| 25 ms ... ascensão ↗ e queda ↘ combinadas | ↗ 13 ms ascensão | 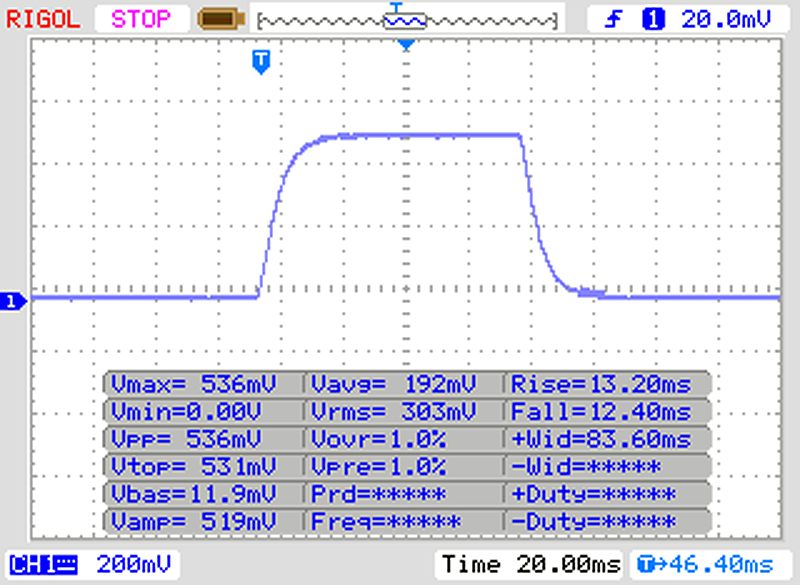 |
| ↘ 12 ms queda | ||
| A tela mostra taxas de resposta relativamente lentas em nossos testes e pode ser muito lenta para os jogadores. Em comparação, todos os dispositivos testados variam de 0.1 (mínimo) a 240 (máximo) ms. » 59 % de todos os dispositivos são melhores. Isso significa que o tempo de resposta medido é pior que a média de todos os dispositivos testados (19.8 ms). | ||
| ↔ Tempo de resposta 50% cinza a 80% cinza | ||
| 43 ms ... ascensão ↗ e queda ↘ combinadas | ↗ 21 ms ascensão | 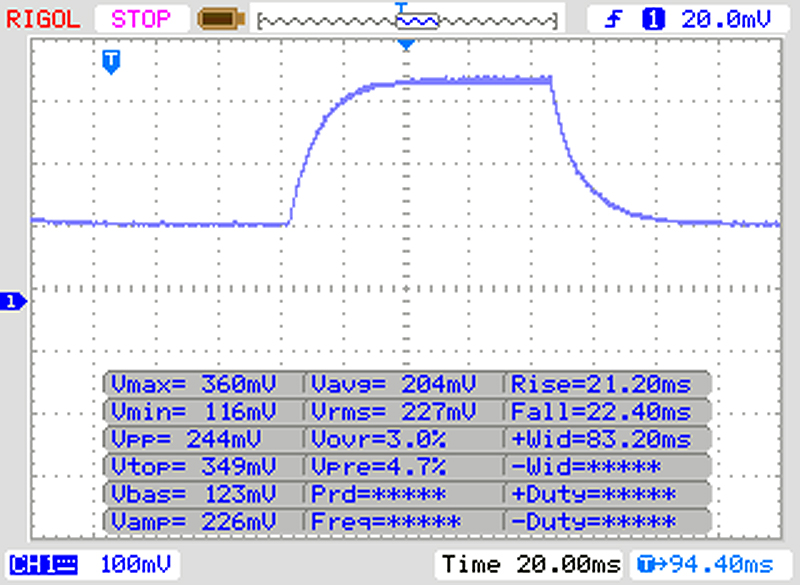 |
| ↘ 22 ms queda | ||
| A tela mostra taxas de resposta lentas em nossos testes e será insatisfatória para os jogadores. Em comparação, todos os dispositivos testados variam de 0.165 (mínimo) a 636 (máximo) ms. » 71 % de todos os dispositivos são melhores. Isso significa que o tempo de resposta medido é pior que a média de todos os dispositivos testados (30.9 ms). | ||
Cintilação da tela / PWM (modulação por largura de pulso)
| Tela tremeluzindo/PWM detectado | 22000 Hz | ≤ 50 % configuração de brilho | 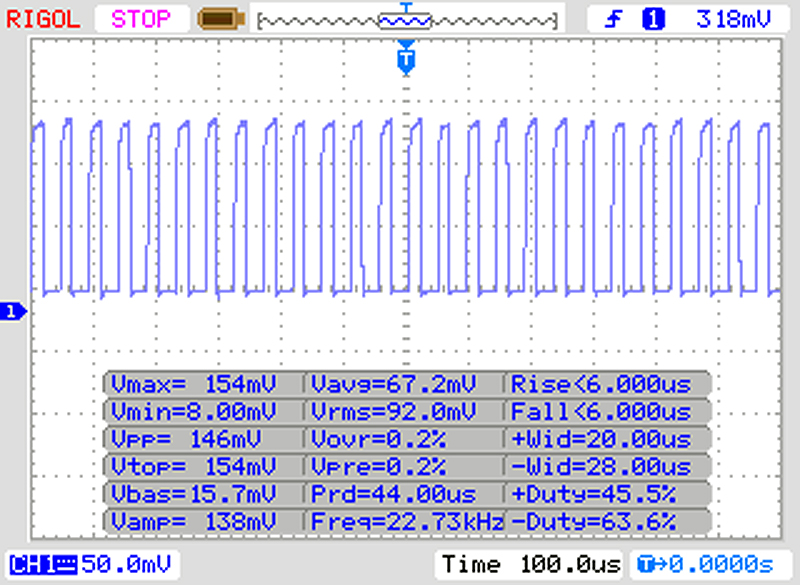 |
A luz de fundo da tela pisca em 22000 Hz (pior caso, por exemplo, utilizando PWM) Cintilação detectada em uma configuração de brilho de 50 % e abaixo. Não deve haver cintilação ou PWM acima desta configuração de brilho. A frequência de 22000 Hz é bastante alta, então a maioria dos usuários sensíveis ao PWM não deve notar nenhuma oscilação. [pwm_comparison] Em comparação: 52 % de todos os dispositivos testados não usam PWM para escurecer a tela. Se PWM foi detectado, uma média de 7748 (mínimo: 5 - máximo: 343500) Hz foi medida. | |||
| PCMark 8 Home Score Accelerated v2 | 3281 pontos | |
| PCMark 8 Creative Score Accelerated v2 | 4454 pontos | |
| PCMark 8 Work Score Accelerated v2 | 4262 pontos | |
| PCMark 10 Score | 3448 pontos | |
Ajuda | ||
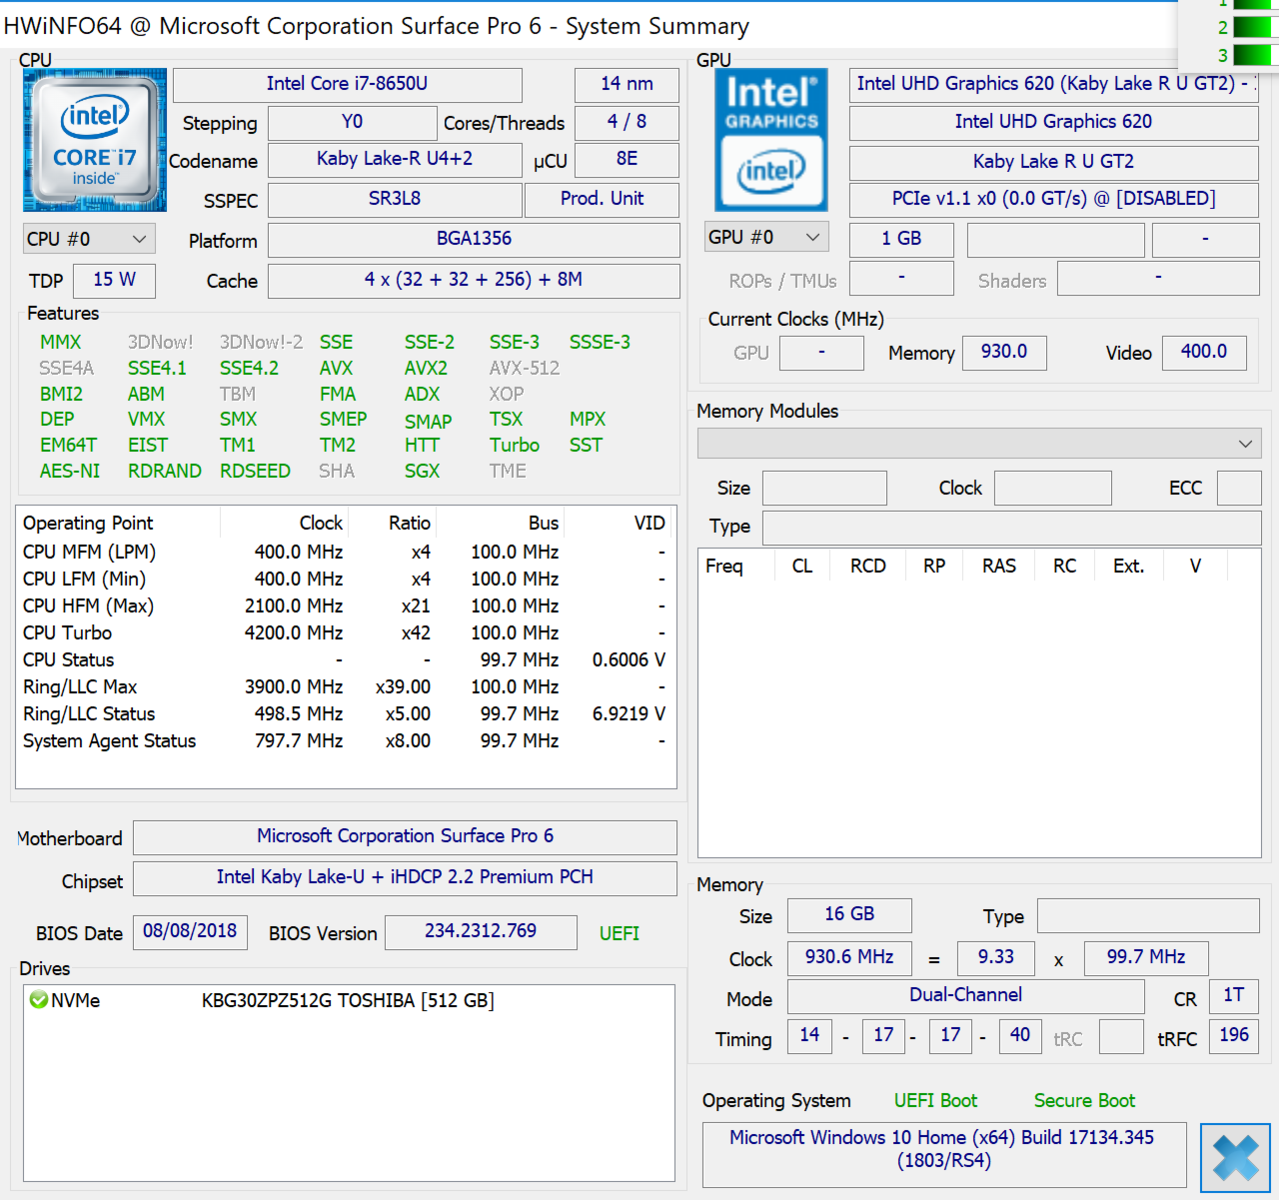
| Microsoft Surface Pro 6, Core i7, 512 GB Toshiba KBG30ZPZ512G | Microsoft Surface Pro (2017) i7 Samsung PM971 KUS040202M | Microsoft Surface Pro 6, Core i5, 128 GB Toshiba KBG30ZPZ128G | HP Elite x2 1013 G3-2TT14EA Samsung PM961 MZVLW256HEHP | Samsung Galaxy Book 12 SM-W728 Samsung SSD PM871a MZNLN256HMHQ | Microsoft Surface Book 2 Samsung PM961 MZVLW256HEHP | Microsoft Surface Go MHN-00003 64 GB eMMC Flash | Huawei Matebook E SanDisk SD8SN8U256G1027 | Lenovo Miix 520-12IKB 20M3000LGE Samsung SSD PM961 1TB M.2 PCIe 3.0 x4 NVMe (MZVLW1T0) | Média Toshiba KBG30ZPZ512G | |
|---|---|---|---|---|---|---|---|---|---|---|
| CrystalDiskMark 3.0 | 40% | -43% | 49% | -11% | 30% | -73% | -21% | 50% | 0% | |
| Read Seq (MB/s) | 651 | 1308 101% | 748 15% | 1786 174% | 511 -22% | 1370 110% | 259.6 -60% | 506 -22% | 883 36% | 651 ? 0% |
| Write Seq (MB/s) | 792 | 961 21% | 127.6 -84% | 1209 53% | 473.7 -40% | 341.2 -57% | 122.4 -85% | 461 -42% | 932 18% | 792 ? 0% |
| Read 512 (MB/s) | 388.2 | 227.5 -41% | 385.3 -1% | 717 85% | 443.7 14% | 654 68% | 190.6 -51% | 341.9 -12% | 586 51% | 388 ? 0% |
| Write 512 (MB/s) | 575 | 792 38% | 115.8 -80% | 798 39% | 395.4 -31% | 337.9 -41% | 107.1 -81% | 294.7 -49% | 627 9% | 575 ? 0% |
| Read 4k (MB/s) | 43.75 | 53.6 23% | 29.93 -32% | 49.66 14% | 40.46 -8% | 43.64 0% | 19.06 -56% | 32.46 -26% | 54.8 25% | 43.8 ? 0% |
| Write 4k (MB/s) | 97.2 | 136.3 40% | 39.77 -59% | 104.2 7% | 91.9 -5% | 148.5 53% | 24.27 -75% | 65.3 -33% | 139.3 43% | 97.2 ? 0% |
| Read 4k QD32 (MB/s) | 241.2 | 485.6 101% | 192.7 -20% | 286 19% | 289.1 20% | 465.5 93% | 34.45 -86% | 381.8 58% | 607 152% | 241 ? 0% |
| Write 4k QD32 (MB/s) | 304.9 | 421.5 38% | 45.38 -85% | 298.4 -2% | 260.7 -14% | 337.1 11% | 33.64 -89% | 184.4 -40% | 498.5 63% | 305 ? 0% |

| 3DMark 11 Performance | 2202 pontos | |
| 3DMark Cloud Gate Standard Score | 9052 pontos | |
Ajuda | ||
| Civilization 6 - 1024x768 Minimum Preset | |
| Microsoft Surface Pro 6, Core i7, 512 GB | |
| Microsoft Surface Pro 6, Core i5, 128 GB | |
| Média Intel UHD Graphics 620 (27.8 - 54.4, n=13) | |
| Farming Simulator 17 - 1366x768 Medium Preset | |
| Microsoft Surface Pro (2017) i7 | |
| Microsoft Surface Pro 6, Core i7, 512 GB | |
| Média Intel UHD Graphics 620 (8 - 67.9, n=12) | |
| Microsoft Surface Pro 6, Core i5, 128 GB | |
| Samsung Galaxy Book 12 SM-W728 | |
| Dirt 4 - 1280x720 Ultra Low Preset | |
| Microsoft Surface Pro 6, Core i7, 512 GB | |
| Média Intel UHD Graphics 620 (46.6 - 50, n=2) | |
| Playerunknown's Battlegrounds (PUBG) - 1280x720 Very Low Preset | |
| Microsoft Surface Pro 6, Core i7, 512 GB | |
| Média Intel UHD Graphics 620 (18 - 21.9, n=2) | |
| Middle-earth: Shadow of War - 1280x720 Lowest Preset | |
| Microsoft Surface Pro 6, Core i7, 512 GB | |
| Média Intel UHD Graphics 620 (18 - 23, n=3) | |
| Microsoft Surface Pro 6, Core i5, 128 GB | |
| F1 2018 - 1280x720 Ultra Low Preset | |
| Microsoft Surface Pro 6, Core i5, 128 GB | |
| Média Intel UHD Graphics 620 (31 - 35.8, n=5) | |
| Microsoft Surface Pro 6, Core i7, 512 GB | |
| Shadow of the Tomb Raider - 1280x720 Lowest Preset | |
| Média da turma Convertible (24 - 180, n=2, últimos 2 anos) | |
| Microsoft Surface Pro 6, Core i5, 128 GB | |
| Microsoft Surface Pro 6, Core i7, 512 GB | |
| Média Intel UHD Graphics 620 (12 - 21.7, n=13) | |
| baixo | média | alto | ultra | QHD | |
|---|---|---|---|---|---|
| BioShock Infinite (2013) | 78.1 | 40.9 | 33.7 | 10.2 | |
| Thief (2014) | 26.5 | 13.3 | 12.1 | ||
| Rise of the Tomb Raider (2016) | 21.7 | 14 | 7.5 | ||
| Civilization 6 (2016) | 45.3 | 16.9 | |||
| Farming Simulator 17 (2016) | 80.5 | 56.9 | 23.9 | ||
| Dirt 4 (2017) | 50 | 13.6 | 11.2 | ||
| Playerunknown's Battlegrounds (PUBG) (2017) | 21.9 | 12 | 9.5 | ||
| Middle-earth: Shadow of War (2017) | 23 | 12 | |||
| F1 2018 (2018) | 32 | 15 | 12 | ||
| Shadow of the Tomb Raider (2018) | 16 | 6 |
Barulho
| Ocioso |
| 30.3 / 30.3 / 30.3 dB |
| Carga |
| 33.5 / 33.5 dB |
 | ||
30 dB silencioso 40 dB(A) audível 50 dB(A) ruidosamente alto |
||
min: | ||
(±) A temperatura máxima no lado superior é 40.4 °C / 105 F, em comparação com a média de 35.4 °C / 96 F , variando de 19.6 a 60 °C para a classe Convertible.
(±) A parte inferior aquece até um máximo de 43.8 °C / 111 F, em comparação com a média de 36.9 °C / 98 F
(+) Em uso inativo, a temperatura média para o lado superior é 30.3 °C / 87 F, em comparação com a média do dispositivo de 30.3 °C / ### class_avg_f### F.
(±) Os apoios para as mãos e o touchpad podem ficar muito quentes ao toque, com um máximo de 39 °C / 102.2 F.
(-) A temperatura média da área do apoio para as mãos de dispositivos semelhantes foi 28 °C / 82.4 F (-11 °C / -19.8 F).
Microsoft Surface Pro 6, Core i7, 512 GB análise de áudio
(-) | alto-falantes não muito altos (###valor### dB)
Graves 100 - 315Hz
(±) | graves reduzidos - em média 11.4% menor que a mediana
(±) | a linearidade dos graves é média (10.6% delta para a frequência anterior)
Médios 400 - 2.000 Hz
(+) | médios equilibrados - apenas 4.3% longe da mediana
(±) | a linearidade dos médios é média (10.4% delta para frequência anterior)
Altos 2 - 16 kHz
(±) | máximos mais altos - em média 5.7% maior que a mediana
(±) | a linearidade dos máximos é média (8.1% delta para frequência anterior)
Geral 100 - 16.000 Hz
(±) | a linearidade do som geral é média (21.4% diferença em relação à mediana)
Comparado com a mesma classe
» 57% de todos os dispositivos testados nesta classe foram melhores, 12% semelhantes, 32% piores
» O melhor teve um delta de 6%, a média foi 20%, o pior foi 57%
Comparado com todos os dispositivos testados
» 60% de todos os dispositivos testados foram melhores, 7% semelhantes, 33% piores
» O melhor teve um delta de 4%, a média foi 23%, o pior foi 134%
HP Elite x2 1013 G3-2TT14EA análise de áudio
(±) | o volume do alto-falante é médio, mas bom (###valor### dB)
Graves 100 - 315Hz
(-) | quase nenhum baixo - em média 15.1% menor que a mediana
(±) | a linearidade dos graves é média (10.9% delta para a frequência anterior)
Médios 400 - 2.000 Hz
(±) | médios mais altos - em média 7.9% maior que a mediana
(±) | a linearidade dos médios é média (11.3% delta para frequência anterior)
Altos 2 - 16 kHz
(±) | máximos mais altos - em média 5.2% maior que a mediana
(+) | os máximos são lineares (6.8% delta da frequência anterior)
Geral 100 - 16.000 Hz
(±) | a linearidade do som geral é média (20.8% diferença em relação à mediana)
Comparado com a mesma classe
» 55% de todos os dispositivos testados nesta classe foram melhores, 10% semelhantes, 35% piores
» O melhor teve um delta de 6%, a média foi 20%, o pior foi 57%
Comparado com todos os dispositivos testados
» 56% de todos os dispositivos testados foram melhores, 8% semelhantes, 36% piores
» O melhor teve um delta de 4%, a média foi 23%, o pior foi 134%
| desligado | |
| Ocioso | |
| Carga |
|
Key:
min: | |
| Microsoft Surface Pro 6, Core i7, 512 GB i7-8650U, UHD Graphics 620, Toshiba KBG30ZPZ512G, IPS, 2736x1824, 12.3" | Microsoft Surface Pro (2017) i7 i7-7660U, Iris Plus Graphics 640, Samsung PM971 KUS040202M, IPS, 2736x1824, 12.3" | Microsoft Surface Pro 6, Core i5, 128 GB i5-8250U, UHD Graphics 620, Toshiba KBG30ZPZ128G, IPS, 2736x1834, 12.3" | Microsoft Surface Pro (2017) i5 i5-7300U, HD Graphics 620, Samsung PM971 KUS030202M, IPS, 2736x1824, 12.3" | Dell Latitude 5290 2-in-1 i5-8350U, UHD Graphics 620, Toshiba XG5 KXG50ZNV256G, IPS, 1920x1280, 12.3" | HP Elite x2 1013 G3-2TT14EA i5-8350U, UHD Graphics 620, Samsung PM961 MZVLW256HEHP, IPS, 3000x2000, 13" | Samsung Galaxy Book 12 SM-W728 i5-7200U, HD Graphics 620, Samsung SSD PM871a MZNLN256HMHQ, Super AMOLED, 2160x1440, 12" | Microsoft Surface Book 2 i7-8650U, GeForce GTX 1050 Mobile, Samsung PM961 MZVLW256HEHP, IPS, 3000x2000, 13.5" | Microsoft Surface Go MHN-00003 Pentium 4415Y, UHD Graphics 615, 64 GB eMMC Flash, IPS, 1800x1200, 10" | Huawei Matebook E i5-7Y54, HD Graphics 615, SanDisk SD8SN8U256G1027, IPS, 2160x1440, 12" | Lenovo Miix 520-12IKB 20M3000LGE i5-8550U, UHD Graphics 620, Samsung SSD PM961 1TB M.2 PCIe 3.0 x4 NVMe (MZVLW1T0), IPS, 1920x1200, 12.2" | Média Intel UHD Graphics 620 | Média da turma Convertible | |
|---|---|---|---|---|---|---|---|---|---|---|---|---|---|
| Power Consumption | -19% | 1% | 13% | 1% | -12% | 0% | -82% | 33% | 14% | 5% | -4% | -23% | |
| Idle Minimum * (Watt) | 3.2 | 4.2 -31% | 4.3 -34% | 3.6 -13% | 3 6% | 4.9 -53% | 3.9 -22% | 4.7 -47% | 2.88 10% | 3.9 -22% | 3.9 -22% | 3.81 ? -19% | 4.28 ? -34% |
| Idle Average * (Watt) | 8.7 | 10.1 -16% | 8.7 -0% | 8.1 7% | 7.2 17% | 8.9 -2% | 9 -3% | 10.6 -22% | 4.8 45% | 8.8 -1% | 8.2 6% | 6.94 ? 20% | 6.96 ? 20% |
| Idle Maximum * (Watt) | 10.4 | 14 -35% | 9.4 10% | 8.7 16% | 10 4% | 11 -6% | 11.9 -14% | 12.3 -18% | 7.5 28% | 8.9 14% | 8.4 19% | 8.75 ? 16% | 8.67 ? 17% |
| Load Average * (Watt) | 29.2 | 37.4 -28% | 24.5 16% | 25.5 13% | 37.1 -27% | 32 -10% | 27.3 7% | 81 -177% | 16.9 42% | 20 32% | 25.2 14% | 35 ? -20% | 45.1 ? -54% |
| Load Maximum * (Watt) | 40.8 | 34 17% | 36 12% | 23.5 42% | 38.2 6% | 36 12% | 27.9 32% | 100.3 -146% | 23.8 42% | 21.8 47% | 37 9% | 47.5 ? -16% | 67.7 ? -66% |
| Witcher 3 ultra * (Watt) | 38.1 | 97 |
* ... menor é melhor
| Microsoft Surface Pro 6, Core i7, 512 GB i7-8650U, UHD Graphics 620, 45 Wh | Microsoft Surface Pro (2017) i7 i7-7660U, Iris Plus Graphics 640, 45 Wh | Microsoft Surface Pro 6, Core i5, 128 GB i5-8250U, UHD Graphics 620, 45 Wh | Microsoft Surface Pro (2017) i5 i5-7300U, HD Graphics 620, 45 Wh | Dell Latitude 5290 2-in-1 i5-8350U, UHD Graphics 620, 42 Wh | HP Elite x2 1013 G3-2TT14EA i5-8350U, UHD Graphics 620, 50 Wh | Samsung Galaxy Book 12 SM-W728 i5-7200U, HD Graphics 620, 39 Wh | Microsoft Surface Book 2 i7-8650U, GeForce GTX 1050 Mobile, 75 Wh | Microsoft Surface Go MHN-00003 Pentium 4415Y, UHD Graphics 615, 28 Wh | Huawei Matebook E i5-7Y54, HD Graphics 615, 33.7 Wh | Lenovo Miix 520-12IKB 20M3000LGE i5-8550U, UHD Graphics 620, 38 Wh | Média da turma Convertible | |
|---|---|---|---|---|---|---|---|---|---|---|---|---|
| Duração da bateria | -9% | -1% | 23% | -39% | -11% | -5% | 37% | -2% | -20% | -34% | 22% | |
| Reader / Idle (h) | 18.1 | 17.8 -2% | 17.6 -3% | 13 -28% | 17.2 -5% | 24.5 35% | 12.9 -29% | 26.7 ? 48% | ||||
| WiFi v1.3 (h) | 8.5 | 8.2 -4% | 9.1 7% | 12.4 46% | 5 -41% | 7.7 -9% | 11.1 31% | 7.5 -12% | 6.8 -20% | 5.6 -34% | 12 ? 41% | |
| Load (h) | 2.2 | 1.9 -14% | 2 -9% | 2.8 27% | 1.4 -36% | 2.3 5% | 3.2 45% | 3 36% | 1.713 ? -22% | |||
| H.264 (h) | 10.2 | 6.5 | 6.8 | 15.6 | 6.4 | 15 ? | ||||||
| Witcher 3 ultra (h) | 1.9 | 3.8 |
Pro
Contra
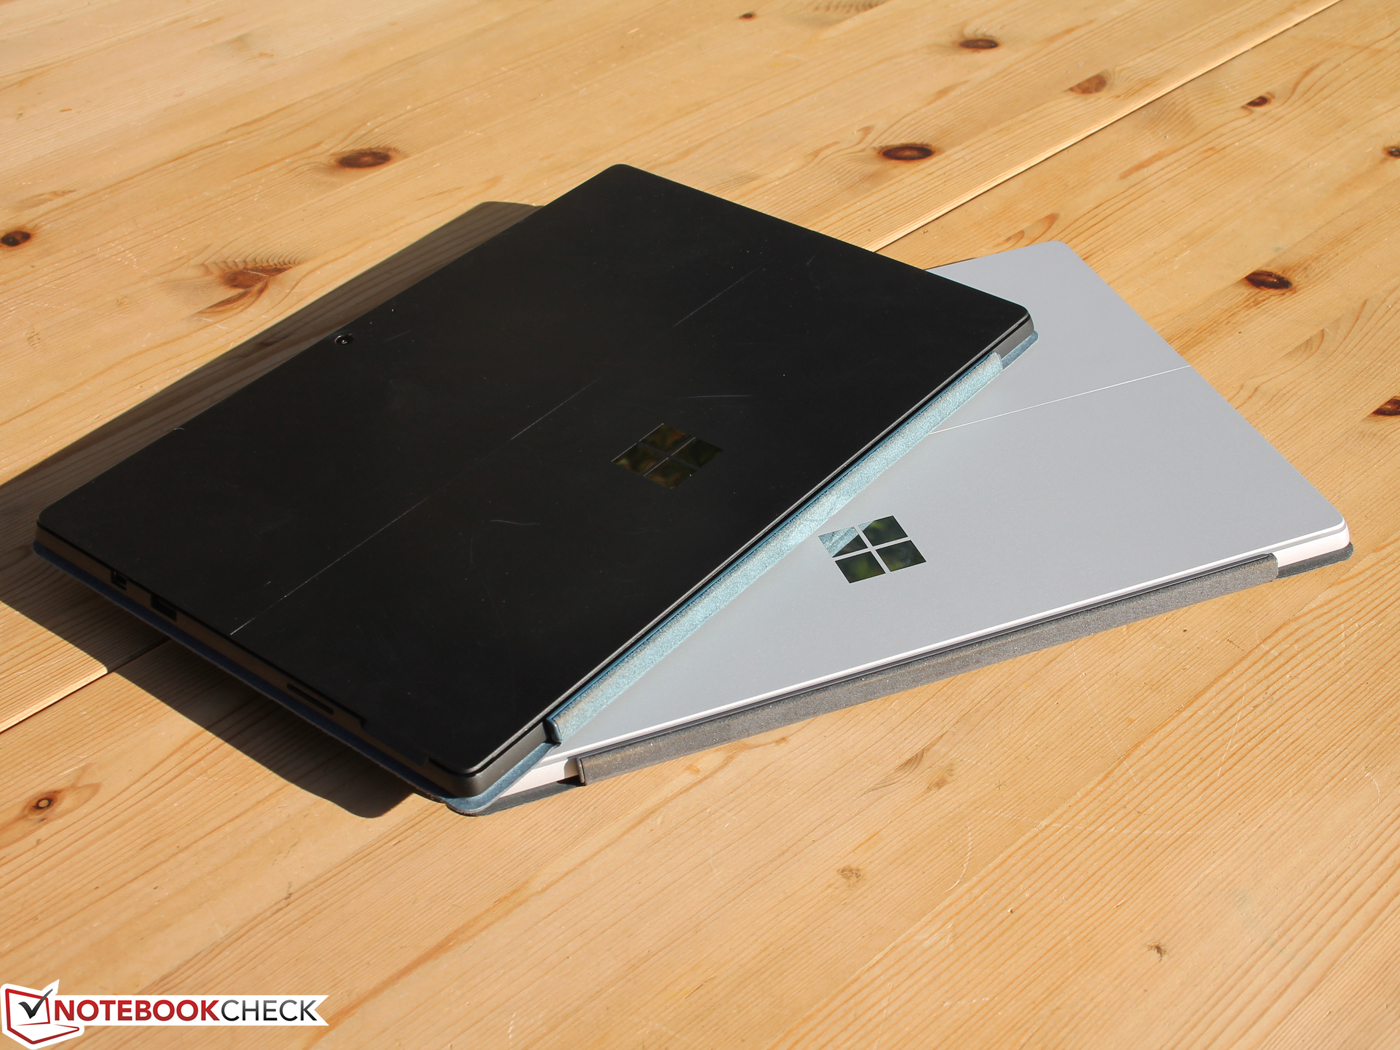
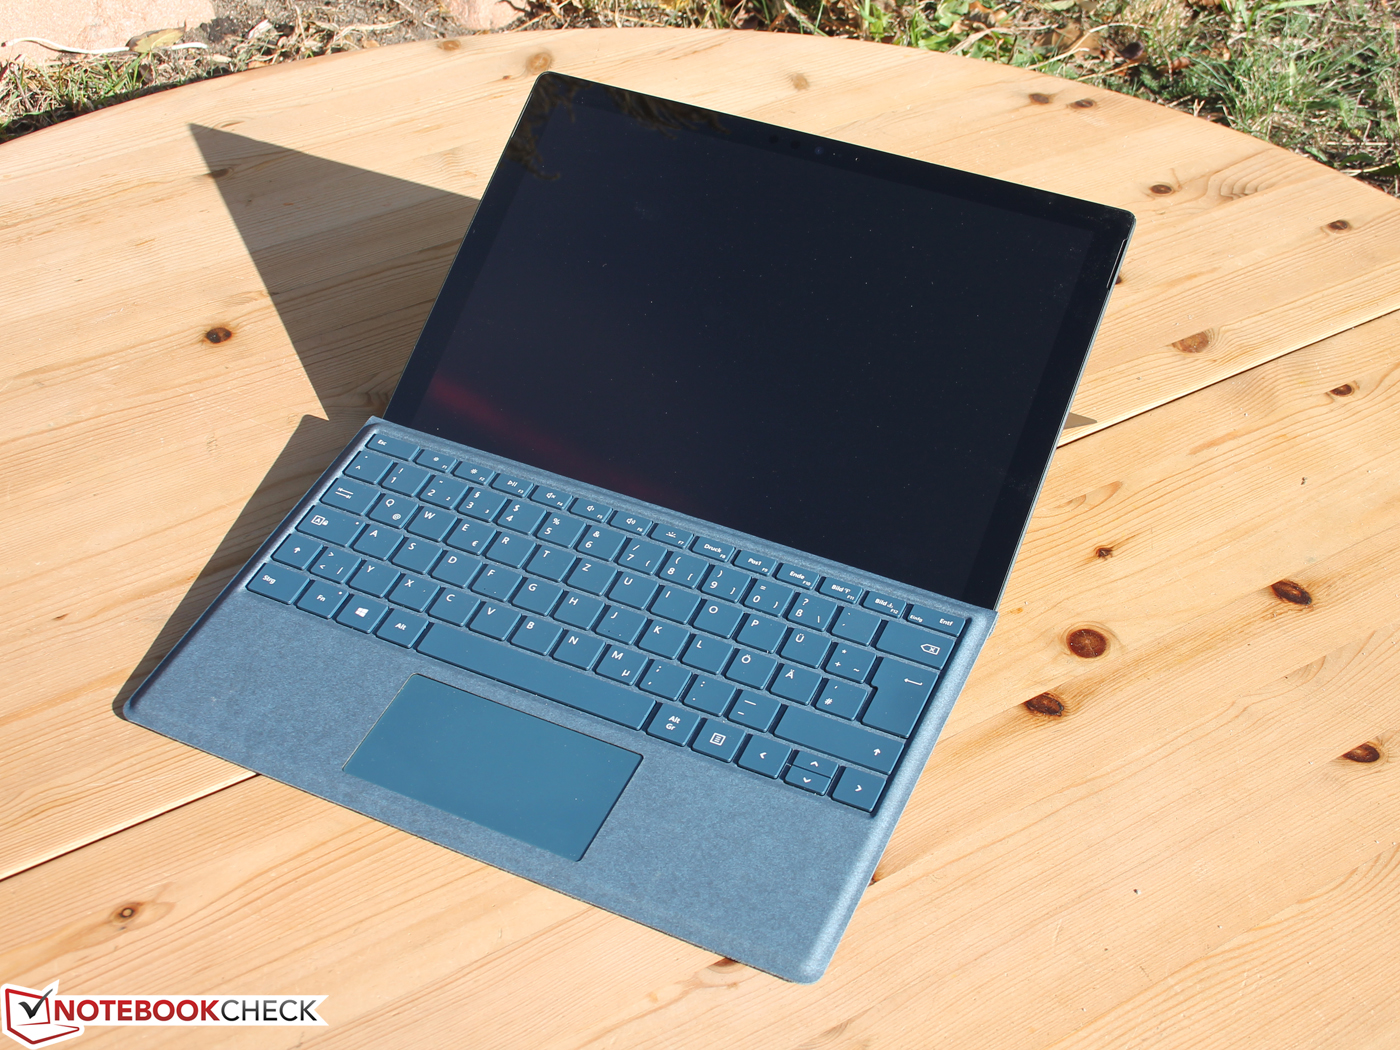
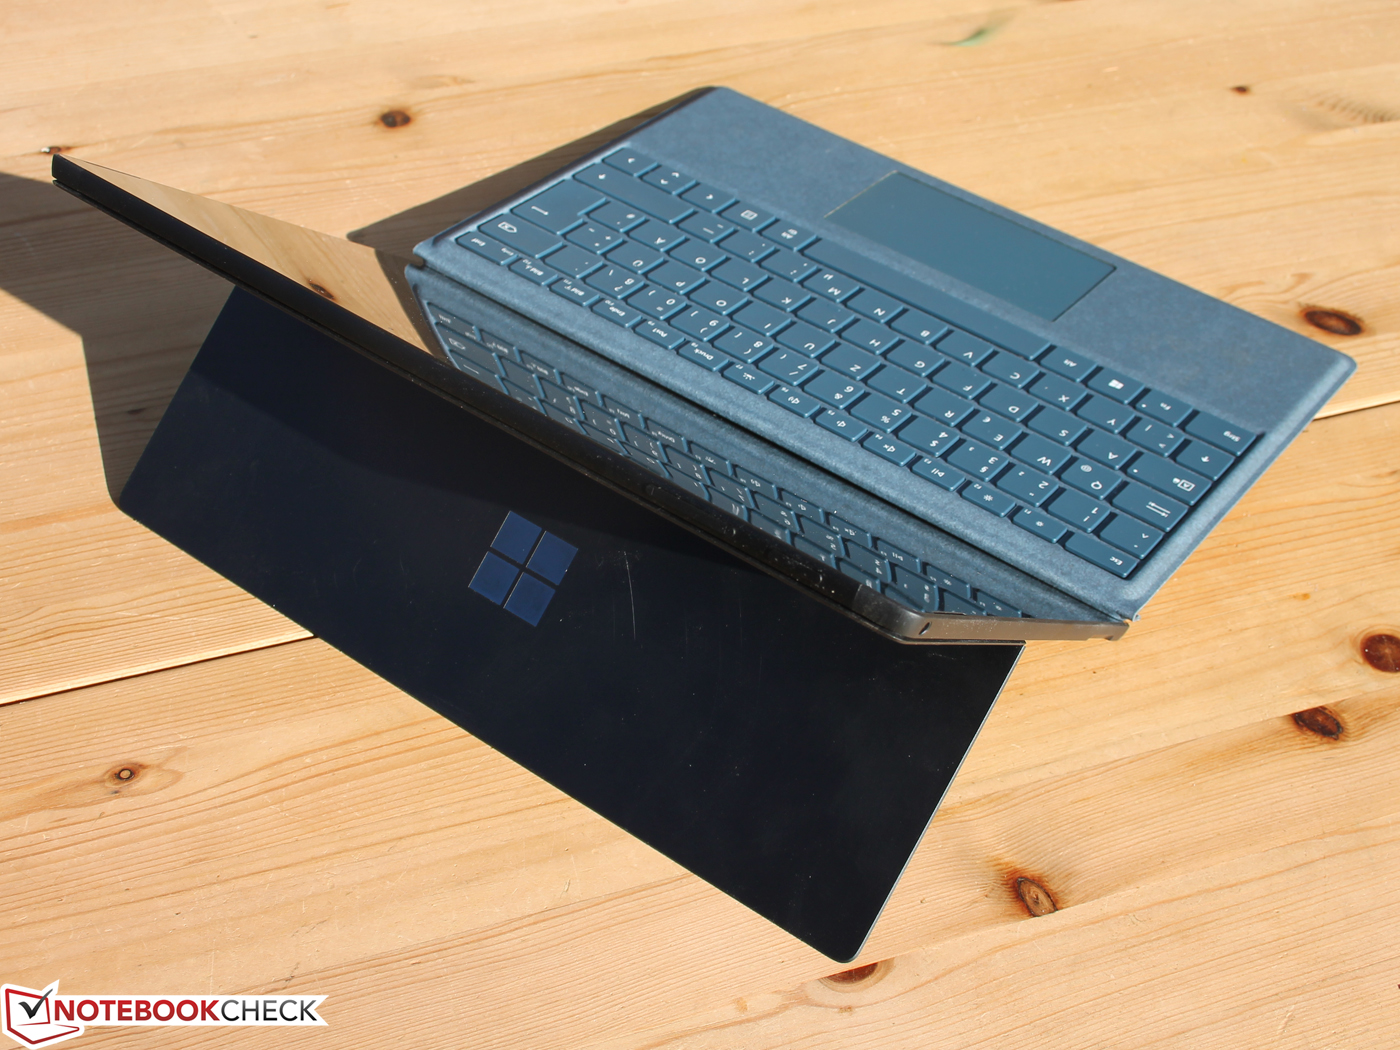
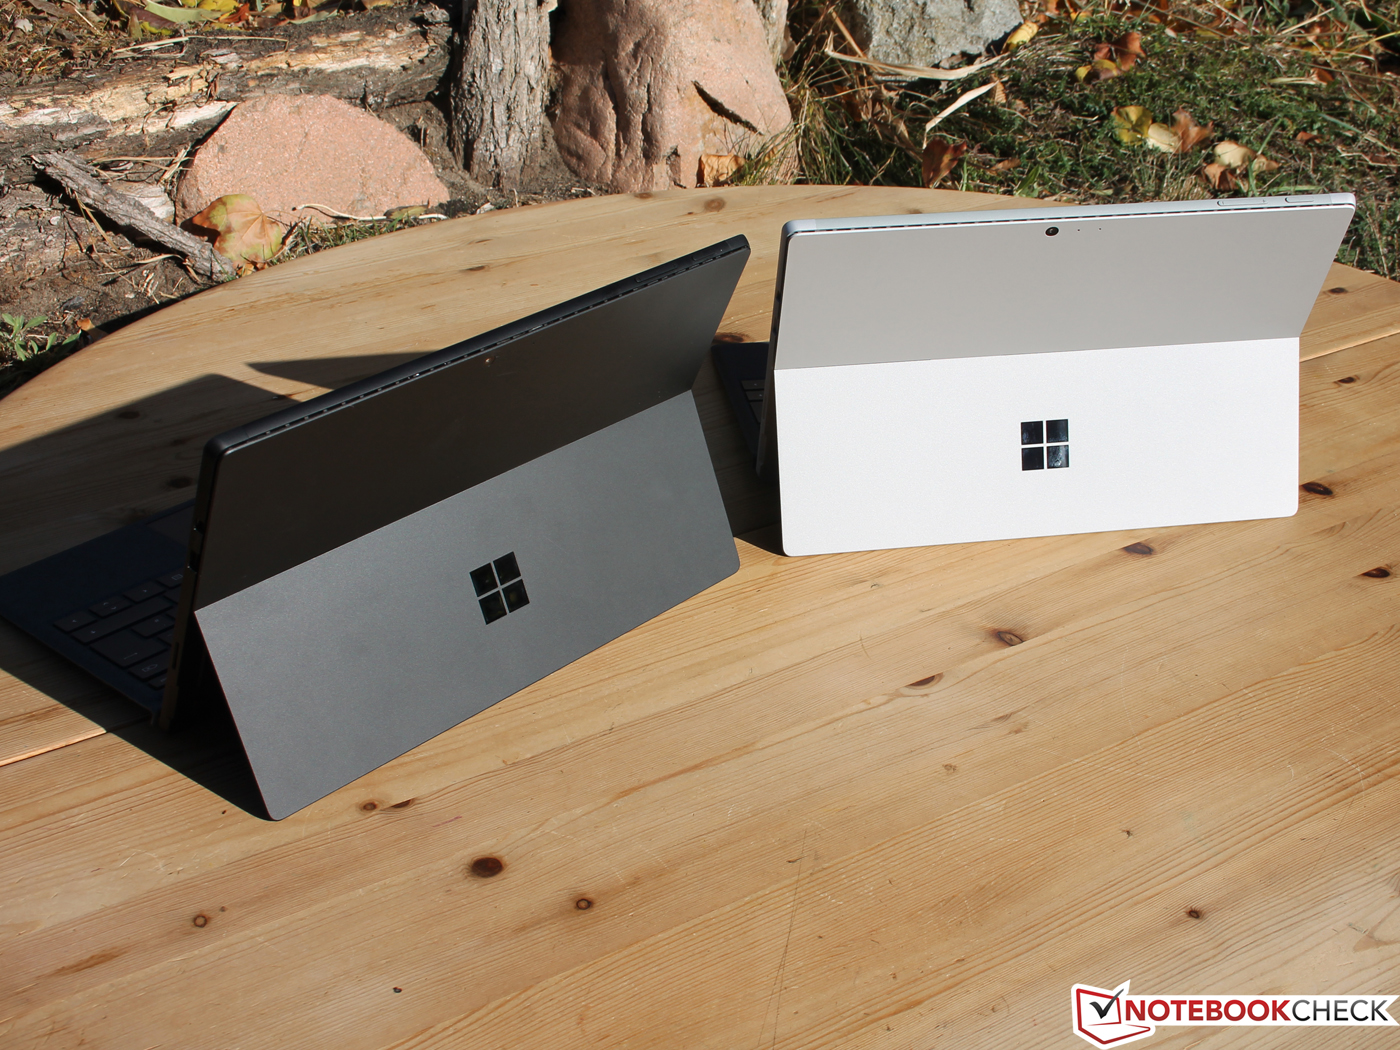
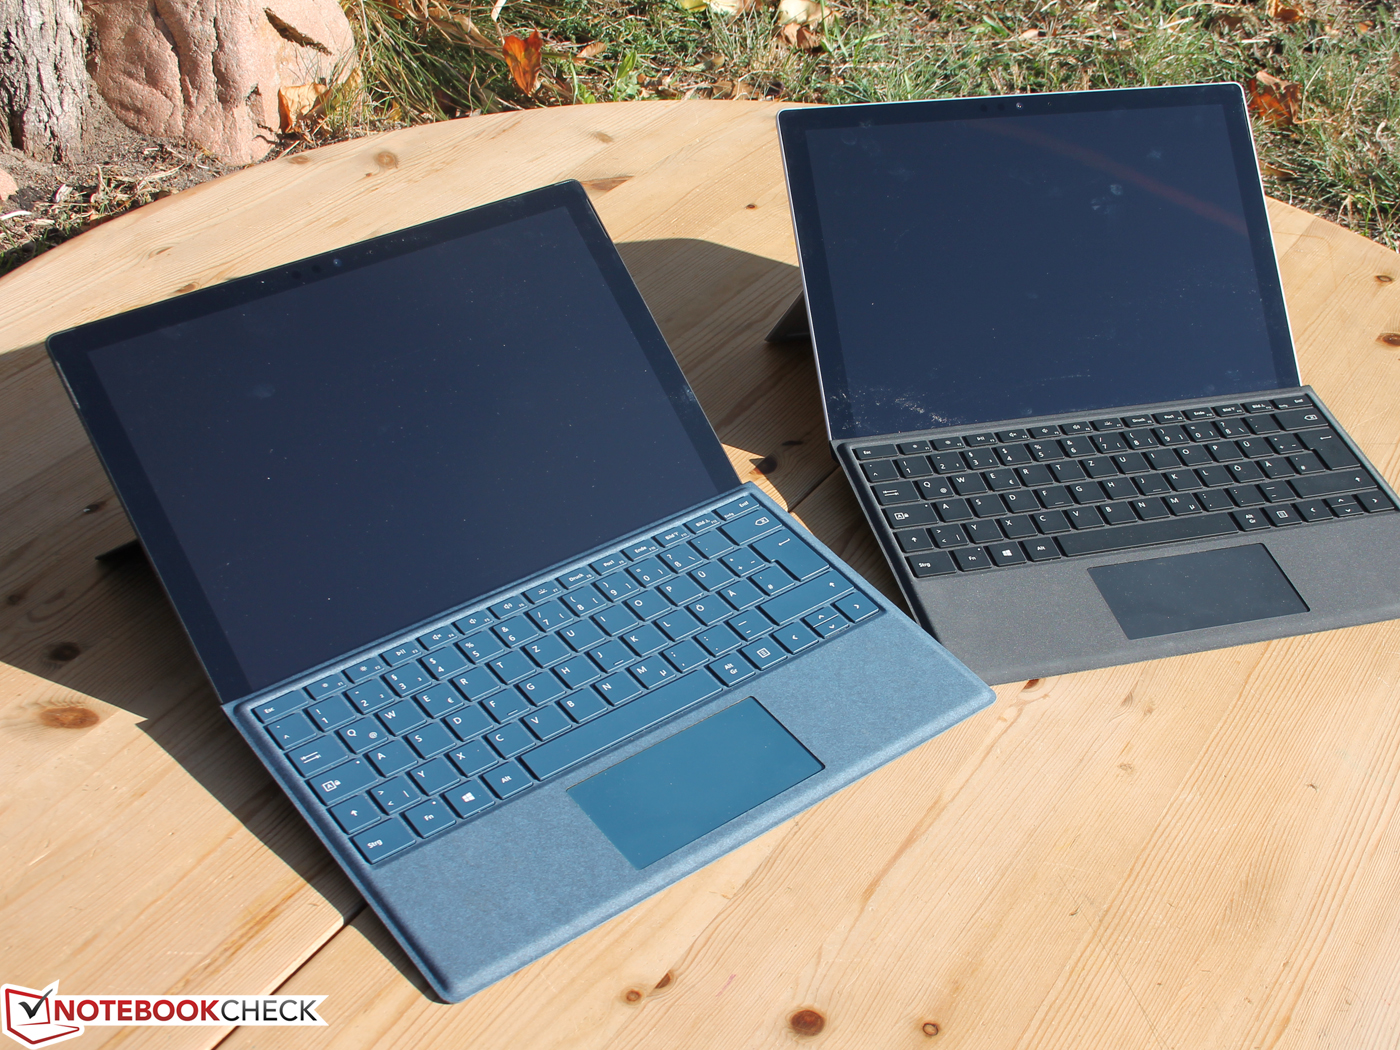
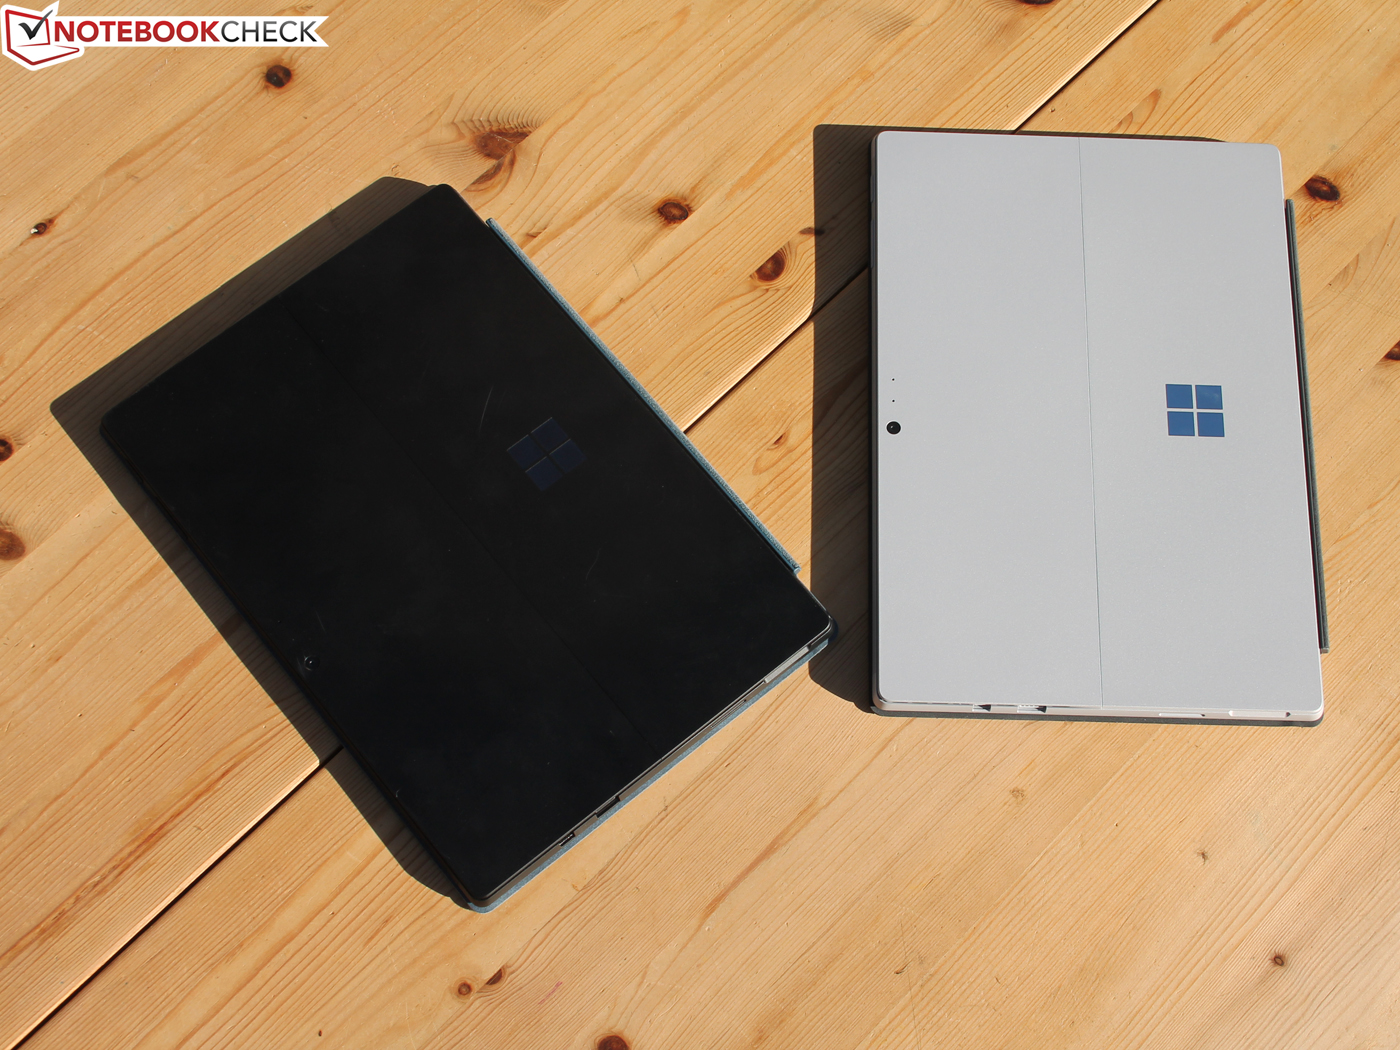
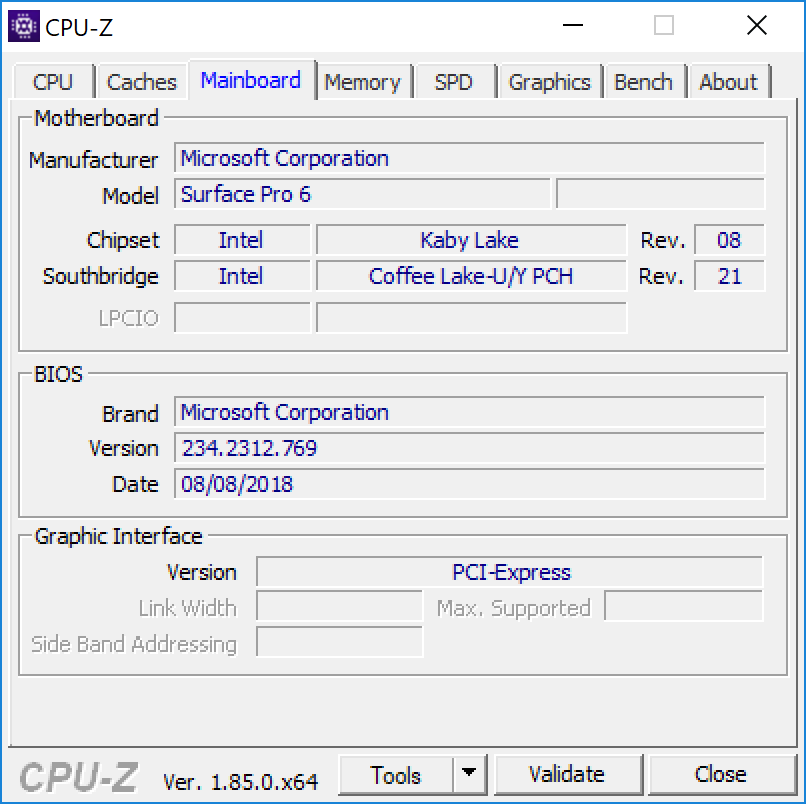
Novos truques em um design antigo? O Surface Pro 6 parece o mesmo que seus antecessores, exceto pela sua nova opção de cor preta. O dispositivo é um tablet fino com carcaça de alta qualidade e robusto que é fácil de segurar, e pesa 786 g comparativamente esbelto.
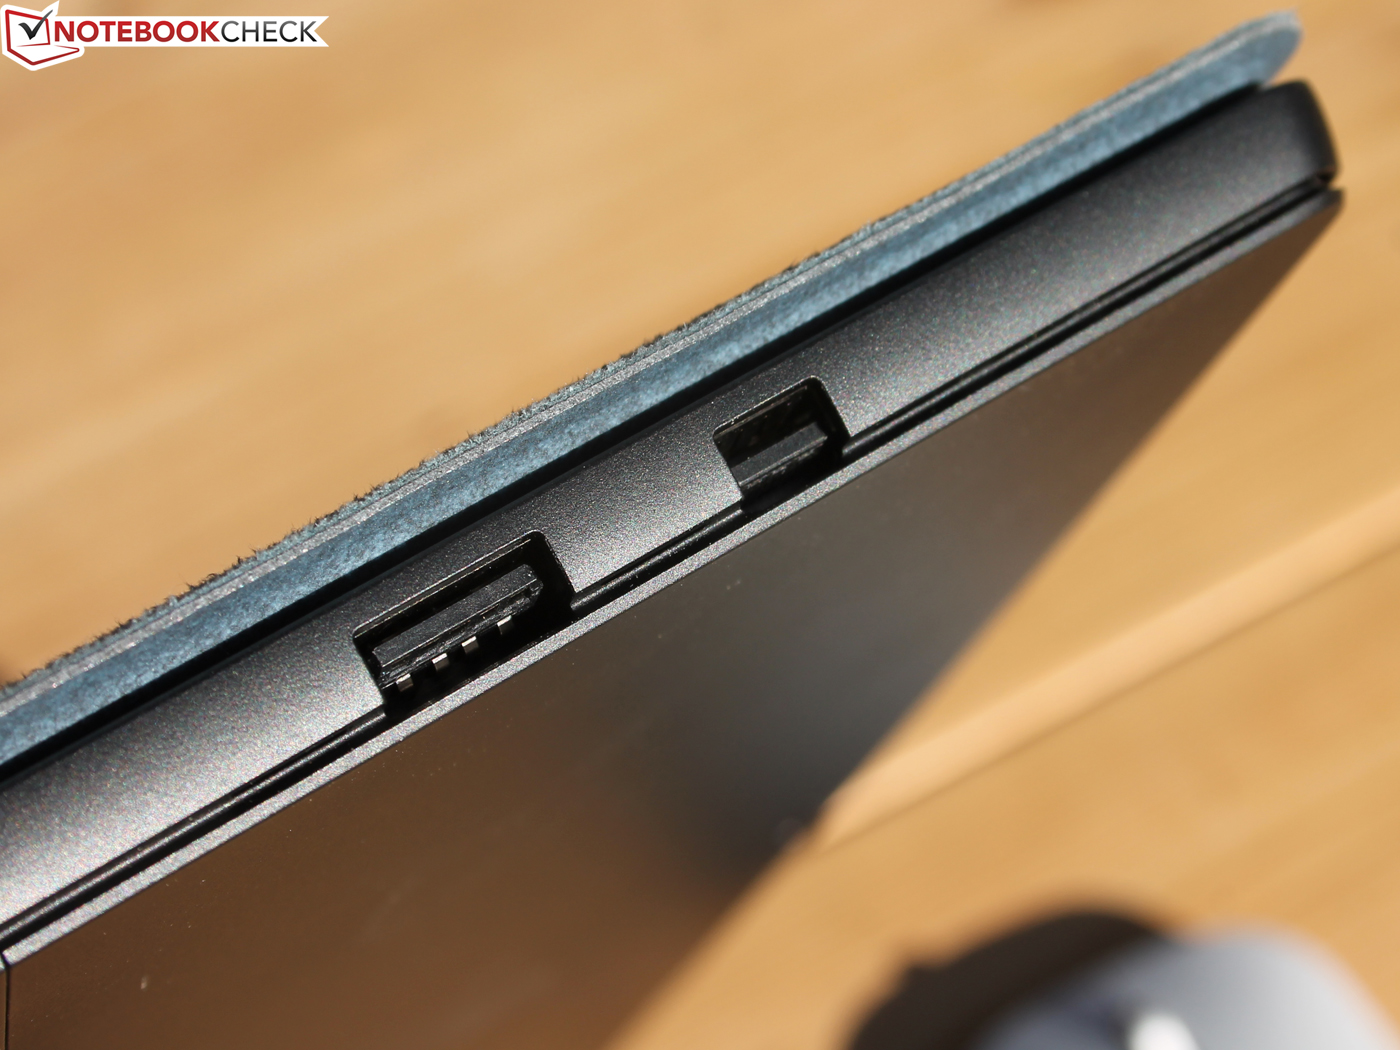
Infelizmente, a Microsoft permaneceu intransigente com as portas. O Surface Pro 6 tem a mesma oferta esparsa de um Mini DisplayPort, uma porta USB tipo A, um leitor de cartões microSD e uma entrada para fones de ouvido. O dispositivo não possui uma porta USB Type-C, que está desatualizada. No entanto, sua omissão se torna mais frustrante pelo fato de a concorrência já oferece portas USB Type-C ou Thunderbolt 3 há, pelo menos, dois anos. Nos confunde que a Microsoft se recuse a adotar esse novo padrão em toda a sua linha de produtos.
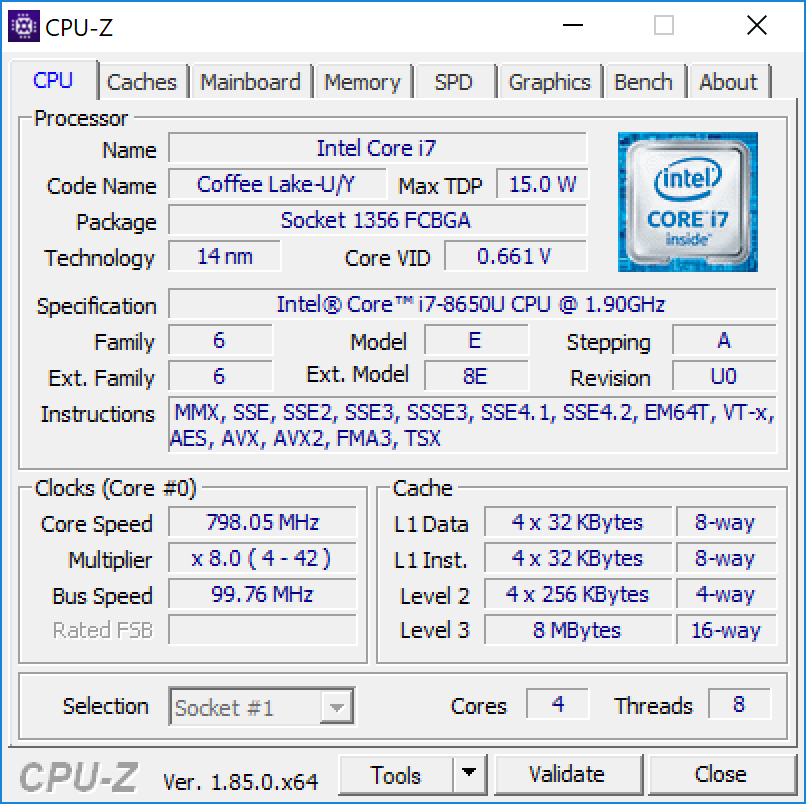
O modelo Core i7 supera portáteis muito maiores, apesar de seu tamanho reduzido. Notavelmente, o Surface Pro 6 terminou mais alto do que o mais caro Surface Book 2 no nosso loop do Cinebench R15; o Surface Book 2 também está perto do topo da nossa tabela de comparação. Além disso, o nosso dispositivo de teste se afoga significativamente menos do que o seu irmão impulsionado pelo Core i5, principalmente porque o último não tem ventoinha.
A duração da bateria é menos impressionante, com o nosso dispositivo de teste atingindo os mesmos tempos de duração do seu antecessor. Você ainda deve poder aproveitar um dia inteiro de trabalho do Surface Pro 6 Core i7, e não há outros tablets Windows finos que duram de oito a nove horas no teste de duração da bateria Wi-Fi.
O Surface Pro 6 finalmente cumpre a promessa da Microsoft de criar um tablet com desempenho de portátil. No entanto, o design permanece igual e a Microsoft continua se recusando a adotar o USB Type-C.
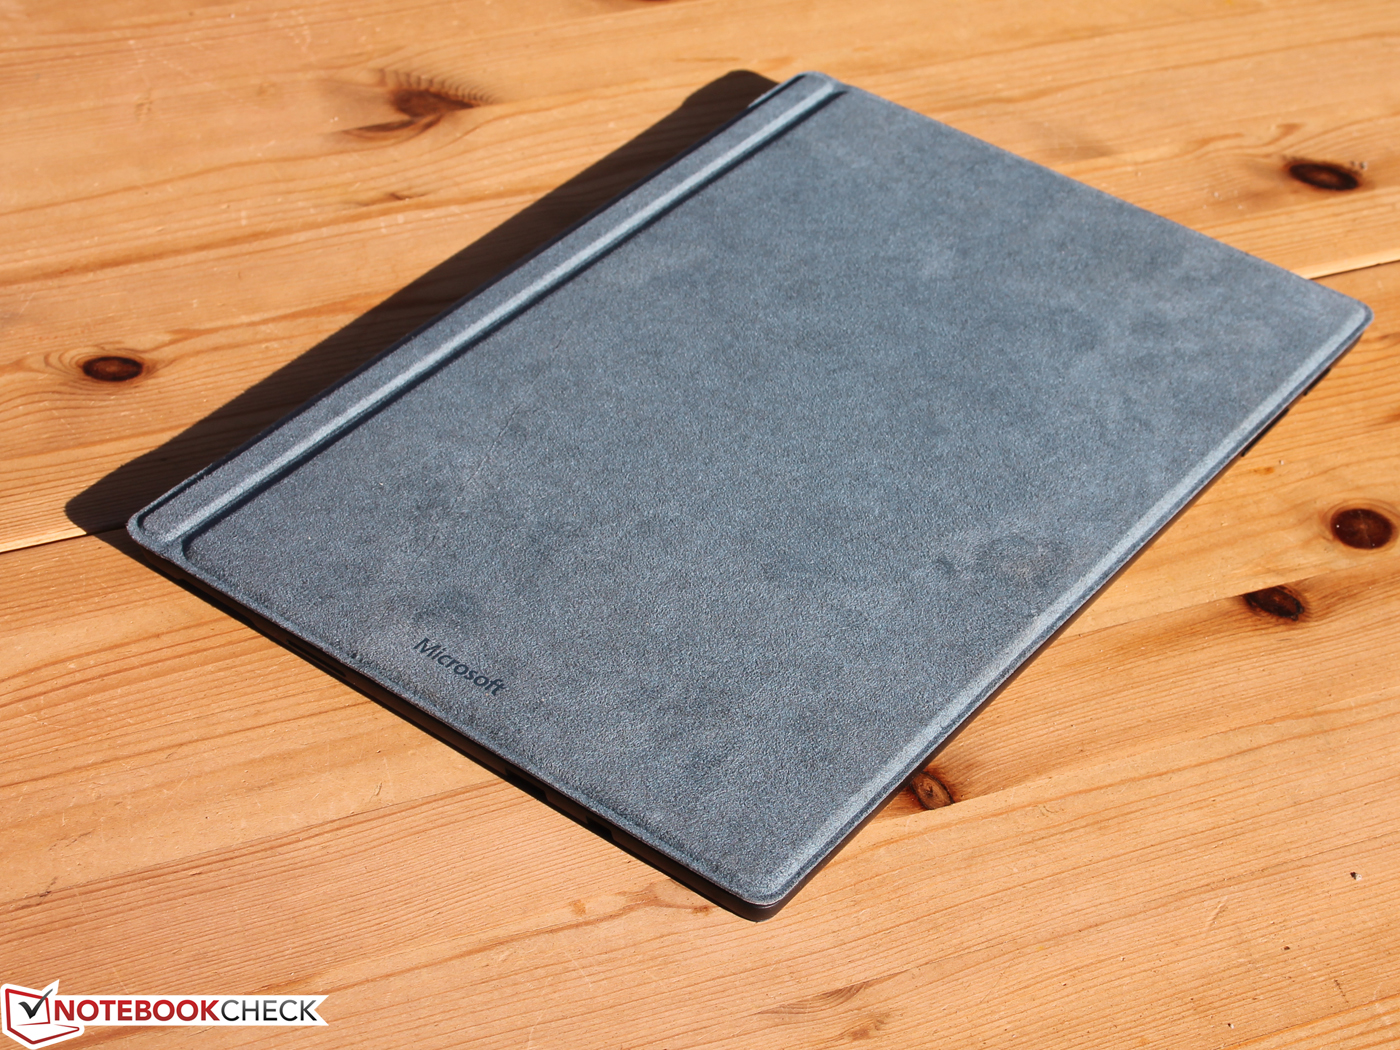
A Microsoft está vendendo as mesmas Type Covers e Canetas que no ano passado, enquanto os acessórios mais antigos ainda funcionam com o Surface Pro 6. No entanto, saudamos as câmeras aparentemente atualizadas. A tela ainda é brilhante o suficiente para usar o dispositivo em exteriores e também tem cobertura sRGB quase completa.
A configuração do nosso dispositivo de teste custa atualmente $1.899 (£1.799) no site da Microsoft sem uma Type Cover, o que é incrivelmente caro para um tablet. No entanto, o preço não é tão alto quando comparado ao custo de nossos 10 principais conversíveis. O Samsung Galaxy Book 12 é consideravelmente mais barato que o Surface Pro 6 e atinge 88% do total, mas é impulsionado pelo processador Intel Core i5-7200U mais antigo e mais fraco.
Microsoft Surface Pro 6, Core i7, 512 GB
- 02/17/2020 v7 (old)
Sebastian Jentsch
Price comparison
