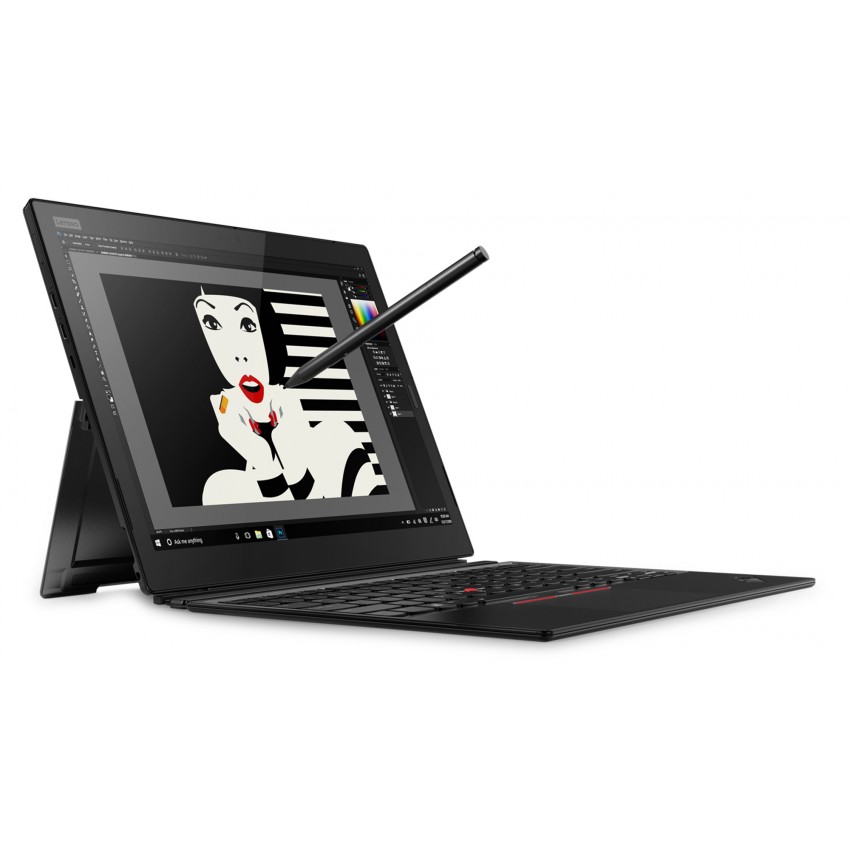
Breve Análise do Conversível Lenovo ThinkPad X1 Tablet 2018 (i5, 3K-IPS)
| SD Card Reader | |
| average JPG Copy Test (av. of 3 runs) | |
| Dell Latitude 5290 2-in-1 (Toshiba Exceria Pro M501 UHS-II) | |
| Lenovo ThinkPad X1 Tablet G3-20KJ001NGE (Toshiba Exceria Pro M501 UHS-II) | |
| Microsoft Surface Pro 6, Core i7, 512 GB (Toshiba Exceria Pro M501 microSDXC 64GB) | |
| Lenovo ThinkPad X1 Tablet Gen 2 (Toshiba Exceria Pro SDXC 64 GB UHS-II) | |
| Média da turma Convertible (29.4 - 186, n=21, últimos 2 anos) | |
| maximum AS SSD Seq Read Test (1GB) | |
| Dell Latitude 5290 2-in-1 (Toshiba Exceria Pro M501 UHS-II) | |
| Média da turma Convertible (67.5 - 254, n=20, últimos 2 anos) | |
| Lenovo ThinkPad X1 Tablet Gen 2 (Toshiba Exceria Pro SDXC 64 GB UHS-II) | |
| Microsoft Surface Pro 6, Core i7, 512 GB (Toshiba Exceria Pro M501 microSDXC 64GB) | |
| Lenovo ThinkPad X1 Tablet G3-20KJ001NGE (Toshiba Exceria Pro M501 UHS-II) | |
| |||||||||||||||||||||||||
iluminação: 76 %
iluminação com acumulador: 470 cd/m²
Contraste: 1436:1 (Preto: 0.33 cd/m²)
ΔE ColorChecker Calman: 3.2 | ∀{0.5-29.43 Ø4.71}
calibrated: 0.9
ΔE Greyscale Calman: 4.5 | ∀{0.09-98 Ø4.96}
99.4% sRGB (Argyll 1.6.3 3D)
64% AdobeRGB 1998 (Argyll 1.6.3 3D)
69.3% AdobeRGB 1998 (Argyll 3D)
99.1% sRGB (Argyll 3D)
68.1% Display P3 (Argyll 3D)
Gamma: 2.07
CCT: 5881 K
| Lenovo ThinkPad X1 Tablet G3-20KJ001NGE LP130QP1-SPA1, , 3000x2000, 13" | HP Elite x2 1013 G3-2TT14EA AU Optronics AUO101A, , 3000x2000, 13" | Microsoft Surface Pro 6, Core i7, 512 GB LGPhilips LP123WQ112604, , 2736x1824, 12.3" | Dell Latitude 5290 2-in-1 SHP1479, , 1920x1280, 12.3" | Toshiba Portege X30T-E-109 Toshiba TOS508F, , 1920x1080, 13.3" | Lenovo ThinkPad X1 Tablet Gen 2 LSN120QL01L01, , 2160x1440, 12" | |
|---|---|---|---|---|---|---|
| Display | -2% | -3% | 2% | -5% | ||
| Display P3 Coverage (%) | 68.1 67.8 | 67.5 -1% | 67.1 -1% | 70.5 4% | 67.2 -1% | |
| sRGB Coverage (%) | 99.4 99.1 | 96.7 -3% | 95.5 -4% | 98.6 -1% | 90.8 -9% | |
| AdobeRGB 1998 Coverage (%) | 69.9 69.3 | 68.2 -2% | 67.9 -3% | 71.5 2% | 66.5 -5% | |
| Response Times | 20% | 25% | -3% | 12% | 43% | |
| Response Time Grey 50% / Grey 80% * (ms) | 47.2 ? | 47 ? -0% | 43 ? 9% | 56.8 ? -20% | 42 ? 11% | 28.4 ? 40% |
| Response Time Black / White * (ms) | 42.4 ? | 26 ? 39% | 25 ? 41% | 36 ? 15% | 37 ? 13% | 22.8 ? 46% |
| PWM Frequency (Hz) | 22000 ? | 1852 ? | 17000 ? | 221.2 ? | ||
| Screen | -18% | -5% | -16% | -39% | -23% | |
| Brightness middle (cd/m²) | 474 | 452 -5% | 484 2% | 548 16% | 350 -26% | 388.1 -18% |
| Brightness (cd/m²) | 418 | 412 -1% | 473 13% | 545 30% | 343 -18% | 344 -18% |
| Brightness Distribution (%) | 76 | 85 12% | 91 20% | 86 13% | 73 -4% | 78 3% |
| Black Level * (cd/m²) | 0.33 | 0.48 -45% | 0.33 -0% | 0.51 -55% | 0.29 12% | 0.39 -18% |
| Contrast (:1) | 1436 | 942 -34% | 1467 2% | 1075 -25% | 1207 -16% | 995 -31% |
| Colorchecker dE 2000 * | 3.2 | 4.05 -27% | 4.29 -34% | 3.65 -14% | 6.36 -99% | 4.6 -44% |
| Colorchecker dE 2000 max. * | 6.1 | 6.64 -9% | 6.46 -6% | 7.15 -17% | 11.63 -91% | 9.1 -49% |
| Colorchecker dE 2000 calibrated * | 0.9 | 1.56 -73% | 1.34 -49% | 1.81 -101% | 1.7 -89% | |
| Greyscale dE 2000 * | 4.5 | 4.87 -8% | 4.3 4% | 5.5 -22% | 8.04 -79% | 6.1 -36% |
| Gamma | 2.07 106% | 2.71 81% | 2.51 88% | 2.154 102% | 2.47 89% | 2.07 106% |
| CCT | 5881 111% | 7160 91% | 7315 89% | 7052 92% | 7716 84% | 7104 91% |
| Color Space (Percent of AdobeRGB 1998) (%) | 64 | 62 -3% | 62 -3% | 65.2 2% | 59 -8% | 59 -8% |
| Color Space (Percent of sRGB) (%) | 99.4 | 97 -2% | 95 -4% | 99.1 0% | 91 -8% | 91 -8% |
| Média Total (Programa/Configurações) | 0% /
-10% | 6% /
-1% | -6% /
-11% | -11% /
-26% | 10% /
-12% |
* ... menor é melhor
Exibir tempos de resposta
| ↔ Tempo de resposta preto para branco | ||
|---|---|---|
| 42.4 ms ... ascensão ↗ e queda ↘ combinadas | ↗ 19.6 ms ascensão | 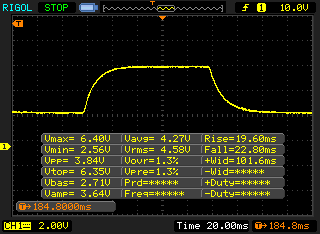 |
| ↘ 22.8 ms queda | ||
| A tela mostra taxas de resposta lentas em nossos testes e será insatisfatória para os jogadores. Em comparação, todos os dispositivos testados variam de 0.1 (mínimo) a 240 (máximo) ms. » 98 % de todos os dispositivos são melhores. Isso significa que o tempo de resposta medido é pior que a média de todos os dispositivos testados (19.8 ms). | ||
| ↔ Tempo de resposta 50% cinza a 80% cinza | ||
| 47.2 ms ... ascensão ↗ e queda ↘ combinadas | ↗ 21.2 ms ascensão | 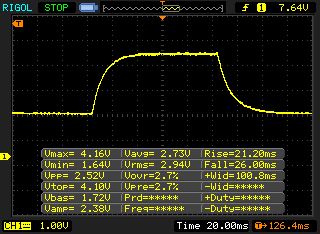 |
| ↘ 26 ms queda | ||
| A tela mostra taxas de resposta lentas em nossos testes e será insatisfatória para os jogadores. Em comparação, todos os dispositivos testados variam de 0.165 (mínimo) a 636 (máximo) ms. » 82 % de todos os dispositivos são melhores. Isso significa que o tempo de resposta medido é pior que a média de todos os dispositivos testados (30.9 ms). | ||
Cintilação da tela / PWM (modulação por largura de pulso)
| Tela tremeluzindo / PWM não detectado | 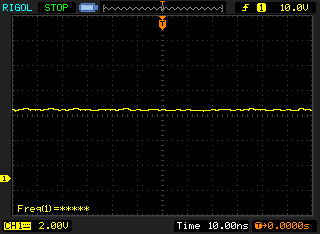 | ||
[pwm_comparison] Em comparação: 52 % de todos os dispositivos testados não usam PWM para escurecer a tela. Se PWM foi detectado, uma média de 7748 (mínimo: 5 - máximo: 343500) Hz foi medida. | |||
| PCMark 8 Home Score Accelerated v2 | 3479 pontos | |
| PCMark 8 Creative Score Accelerated v2 | 4767 pontos | |
| PCMark 8 Work Score Accelerated v2 | 4136 pontos | |
| PCMark 10 Score | 3544 pontos | |
Ajuda | ||

| 3DMark 11 Performance | 2041 pontos | |
| 3DMark Cloud Gate Standard Score | 8625 pontos | |
| 3DMark Fire Strike Score | 1103 pontos | |
Ajuda | ||
| baixo | média | alto | ultra | |
|---|---|---|---|---|
| BioShock Infinite (2013) | 59.2 | 34.8 | 30.2 | 10.1 |
| The Witcher 3 (2015) | 12.1 | |||
| Rocket League (2017) | 59.2 | 35.1 | 23.1 |
| 3DMark 11 | |
| 1280x720 Performance | |
| Lenovo ThinkPad X1 Tablet G3-20KJ001NGE | |
| Lenovo ThinkPad X1 Tablet G3-20KJ001NGE | |
| 1280x720 Performance GPU | |
| Lenovo ThinkPad X1 Tablet G3-20KJ001NGE | |
| Lenovo ThinkPad X1 Tablet G3-20KJ001NGE | |
| 1280x720 Performance Physics | |
| Lenovo ThinkPad X1 Tablet G3-20KJ001NGE | |
| Lenovo ThinkPad X1 Tablet G3-20KJ001NGE | |
| 3DMark | |
| 1920x1080 Fire Strike Score | |
| Lenovo ThinkPad X1 Tablet G3-20KJ001NGE | |
| Lenovo ThinkPad X1 Tablet G3-20KJ001NGE | |
| 1920x1080 Fire Strike Graphics | |
| Lenovo ThinkPad X1 Tablet G3-20KJ001NGE | |
| Lenovo ThinkPad X1 Tablet G3-20KJ001NGE | |
| 1920x1080 Fire Strike Physics | |
| Lenovo ThinkPad X1 Tablet G3-20KJ001NGE | |
| Lenovo ThinkPad X1 Tablet G3-20KJ001NGE | |
| BioShock Infinite | |
| 1920x1080 Ultra Preset, DX11 (DDOF) | |
| Lenovo ThinkPad X1 Tablet G3-20KJ001NGE | |
| Lenovo ThinkPad X1 Tablet G3-20KJ001NGE | |
| 1366x768 High Preset | |
| Lenovo ThinkPad X1 Tablet G3-20KJ001NGE | |
| Lenovo ThinkPad X1 Tablet G3-20KJ001NGE | |
| 1366x768 Medium Preset | |
| Lenovo ThinkPad X1 Tablet G3-20KJ001NGE | |
| Lenovo ThinkPad X1 Tablet G3-20KJ001NGE | |
| 1280x720 Very Low Preset | |
| Lenovo ThinkPad X1 Tablet G3-20KJ001NGE | |
| Lenovo ThinkPad X1 Tablet G3-20KJ001NGE | |
| Rocket League | |
| 1920x1080 High Quality AA:High FX | |
| Lenovo ThinkPad X1 Tablet G3-20KJ001NGE | |
| Lenovo ThinkPad X1 Tablet G3-20KJ001NGE | |
| 1920x1080 Quality AA:Medium FX | |
| Lenovo ThinkPad X1 Tablet G3-20KJ001NGE | |
| Lenovo ThinkPad X1 Tablet G3-20KJ001NGE | |
| 1280x720 Performance | |
| Lenovo ThinkPad X1 Tablet G3-20KJ001NGE | |
| Lenovo ThinkPad X1 Tablet G3-20KJ001NGE | |
| The Witcher 3 | |
| 1920x1080 Ultra Graphics & Postprocessing (HBAO+) | |
| Lenovo ThinkPad X1 Tablet G3-20KJ001NGE | |
| 1920x1080 High Graphics & Postprocessing (Nvidia HairWorks Off) | |
| Lenovo ThinkPad X1 Tablet G3-20KJ001NGE | |
| 1366x768 Medium Graphics & Postprocessing | |
| Lenovo ThinkPad X1 Tablet G3-20KJ001NGE | |
| 1024x768 Low Graphics & Postprocessing | |
| Lenovo ThinkPad X1 Tablet G3-20KJ001NGE | |
| Lenovo ThinkPad X1 Tablet G3-20KJ001NGE | |
Barulho
| Ocioso |
| 29.8 / 29.8 / 31.3 dB |
| Carga |
| 35.9 / 38.6 dB |
 | ||
30 dB silencioso 40 dB(A) audível 50 dB(A) ruidosamente alto |
||
min: | ||
| Lenovo ThinkPad X1 Tablet G3-20KJ001NGE UHD Graphics 620, i5-8250U, Samsung PM961 MZVLW256HEHP | HP Elite x2 1013 G3-2TT14EA UHD Graphics 620, i5-8350U, Samsung PM961 MZVLW256HEHP | Microsoft Surface Pro 6, Core i7, 512 GB UHD Graphics 620, i7-8650U, Toshiba KBG30ZPZ512G | Dell Latitude 5290 2-in-1 UHD Graphics 620, i5-8350U, Toshiba XG5 KXG50ZNV256G | Toshiba Portege X30T-E-109 UHD Graphics 620, i5-8550U, Samsung SSD PM981 MZVLB1T0HALR | |
|---|---|---|---|---|---|
| Noise | 3% | 3% | 6% | 2% | |
| desligado / ambiente * (dB) | 29.8 | 30.3 -2% | 30.3 -2% | 28.5 4% | 30.3 -2% |
| Idle Minimum * (dB) | 29.8 | 30.3 -2% | 30.3 -2% | 28.5 4% | 30.9 -4% |
| Idle Average * (dB) | 29.8 | 30.3 -2% | 30.3 -2% | 28.5 4% | 30.9 -4% |
| Idle Maximum * (dB) | 31.3 | 31.2 -0% | 30.3 3% | 28.5 9% | 32.3 -3% |
| Load Average * (dB) | 35.9 | 32.8 9% | 33.5 7% | 28.5 21% | 32.7 9% |
| Load Maximum * (dB) | 38.6 | 32.9 15% | 33.5 13% | 41.6 -8% | 32.7 15% |
* ... menor é melhor
(±) A temperatura máxima no lado superior é 44.3 °C / 112 F, em comparação com a média de 35.4 °C / 96 F , variando de 19.6 a 60 °C para a classe Convertible.
(-) A parte inferior aquece até um máximo de 48.9 °C / 120 F, em comparação com a média de 36.9 °C / 98 F
(+) Em uso inativo, a temperatura média para o lado superior é 26.7 °C / 80 F, em comparação com a média do dispositivo de 30.3 °C / ### class_avg_f### F.
(±) Os apoios para as mãos e o touchpad podem ficar muito quentes ao toque, com um máximo de 37.6 °C / 99.7 F.
(-) A temperatura média da área do apoio para as mãos de dispositivos semelhantes foi 28 °C / 82.4 F (-9.6 °C / -17.3 F).
Lenovo ThinkPad X1 Tablet G3-20KJ001NGE análise de áudio
(±) | o volume do alto-falante é médio, mas bom (###valor### dB)
Graves 100 - 315Hz
(-) | quase nenhum baixo - em média 21.7% menor que a mediana
(±) | a linearidade dos graves é média (9.5% delta para a frequência anterior)
Médios 400 - 2.000 Hz
(+) | médios equilibrados - apenas 4.7% longe da mediana
(±) | a linearidade dos médios é média (7.8% delta para frequência anterior)
Altos 2 - 16 kHz
(±) | máximos mais altos - em média 7.8% maior que a mediana
(±) | a linearidade dos máximos é média (14.2% delta para frequência anterior)
Geral 100 - 16.000 Hz
(-) | o som geral não é linear (33.2% diferença em relação à mediana)
Comparado com a mesma classe
» 93% de todos os dispositivos testados nesta classe foram melhores, 1% semelhantes, 6% piores
» O melhor teve um delta de 6%, a média foi 20%, o pior foi 57%
Comparado com todos os dispositivos testados
» 92% de todos os dispositivos testados foram melhores, 1% semelhantes, 7% piores
» O melhor teve um delta de 4%, a média foi 23%, o pior foi 134%
HP Elite x2 1013 G3-2TT14EA análise de áudio
(±) | o volume do alto-falante é médio, mas bom (###valor### dB)
Graves 100 - 315Hz
(-) | quase nenhum baixo - em média 15.1% menor que a mediana
(±) | a linearidade dos graves é média (10.9% delta para a frequência anterior)
Médios 400 - 2.000 Hz
(±) | médios mais altos - em média 7.9% maior que a mediana
(±) | a linearidade dos médios é média (11.3% delta para frequência anterior)
Altos 2 - 16 kHz
(±) | máximos mais altos - em média 5.2% maior que a mediana
(+) | os máximos são lineares (6.8% delta da frequência anterior)
Geral 100 - 16.000 Hz
(±) | a linearidade do som geral é média (20.8% diferença em relação à mediana)
Comparado com a mesma classe
» 55% de todos os dispositivos testados nesta classe foram melhores, 10% semelhantes, 35% piores
» O melhor teve um delta de 6%, a média foi 20%, o pior foi 57%
Comparado com todos os dispositivos testados
» 56% de todos os dispositivos testados foram melhores, 8% semelhantes, 36% piores
» O melhor teve um delta de 4%, a média foi 23%, o pior foi 134%
Microsoft Surface Pro 6, Core i7, 512 GB análise de áudio
(-) | alto-falantes não muito altos (###valor### dB)
Graves 100 - 315Hz
(±) | graves reduzidos - em média 11.4% menor que a mediana
(±) | a linearidade dos graves é média (10.6% delta para a frequência anterior)
Médios 400 - 2.000 Hz
(+) | médios equilibrados - apenas 4.3% longe da mediana
(±) | a linearidade dos médios é média (10.4% delta para frequência anterior)
Altos 2 - 16 kHz
(±) | máximos mais altos - em média 5.7% maior que a mediana
(±) | a linearidade dos máximos é média (8.1% delta para frequência anterior)
Geral 100 - 16.000 Hz
(±) | a linearidade do som geral é média (21.4% diferença em relação à mediana)
Comparado com a mesma classe
» 57% de todos os dispositivos testados nesta classe foram melhores, 12% semelhantes, 32% piores
» O melhor teve um delta de 6%, a média foi 20%, o pior foi 57%
Comparado com todos os dispositivos testados
» 60% de todos os dispositivos testados foram melhores, 7% semelhantes, 33% piores
» O melhor teve um delta de 4%, a média foi 23%, o pior foi 134%
| desligado | |
| Ocioso | |
| Carga |
|
Key:
min: | |
| Lenovo ThinkPad X1 Tablet G3-20KJ001NGE i5-8250U, UHD Graphics 620, Samsung PM961 MZVLW256HEHP, IPS, 3000x2000, 13" | HP Elite x2 1013 G3-2TT14EA i5-8350U, UHD Graphics 620, Samsung PM961 MZVLW256HEHP, IPS, 3000x2000, 13" | Microsoft Surface Pro 6, Core i7, 512 GB i7-8650U, UHD Graphics 620, Toshiba KBG30ZPZ512G, IPS, 2736x1824, 12.3" | Dell Latitude 5290 2-in-1 i5-8350U, UHD Graphics 620, Toshiba XG5 KXG50ZNV256G, IPS, 1920x1280, 12.3" | Toshiba Portege X30T-E-109 i5-8550U, UHD Graphics 620, Samsung SSD PM981 MZVLB1T0HALR, IPS, 1920x1080, 13.3" | Lenovo ThinkPad X1 Tablet Gen 2 i5-7Y54, HD Graphics 615, Samsung PM961 MZVLW256HEHP, IPS, 2160x1440, 12" | Média Intel UHD Graphics 620 | Média da turma Convertible | |
|---|---|---|---|---|---|---|---|---|
| Power Consumption | 11% | 20% | 22% | 5% | 34% | 19% | 6% | |
| Idle Minimum * (Watt) | 4.8 | 4.9 -2% | 3.2 33% | 3 37% | 4.7 2% | 5 -4% | 3.81 ? 21% | 4.28 ? 11% |
| Idle Average * (Watt) | 9 | 8.9 1% | 8.7 3% | 7.2 20% | 9.4 -4% | 6.3 30% | 6.94 ? 23% | 6.96 ? 23% |
| Idle Maximum * (Watt) | 10.5 | 11 -5% | 10.4 1% | 10 5% | 16 -52% | 7.8 26% | 8.75 ? 17% | 8.67 ? 17% |
| Load Average * (Watt) | 42.8 | 32 25% | 29.2 32% | 37.1 13% | 26.4 38% | 19.5 54% | 35 ? 18% | 45.1 ? -5% |
| Load Maximum * (Watt) | 57.8 | 36 38% | 40.8 29% | 38.2 34% | 34 41% | 19.6 66% | 47.5 ? 18% | 67.7 ? -17% |
* ... menor é melhor
| Lenovo ThinkPad X1 Tablet G3-20KJ001NGE i5-8250U, UHD Graphics 620, 42 Wh | HP Elite x2 1013 G3-2TT14EA i5-8350U, UHD Graphics 620, 50 Wh | Microsoft Surface Pro 6, Core i7, 512 GB i7-8650U, UHD Graphics 620, 45 Wh | Dell Latitude 5290 2-in-1 i5-8350U, UHD Graphics 620, 42 Wh | Toshiba Portege X30T-E-109 i5-8550U, UHD Graphics 620, Wh | Lenovo ThinkPad X1 Tablet Gen 2 i5-7Y54, HD Graphics 615, 37 Wh | Média da turma Convertible | |
|---|---|---|---|---|---|---|---|
| Duração da bateria | 14% | 41% | -12% | 39% | 17% | 70% | |
| Reader / Idle (h) | 13.2 | 13 -2% | 18.1 37% | 11 -17% | 26.7 ? 102% | ||
| H.264 (h) | 8.7 | 6.5 -25% | 15 ? 72% | ||||
| WiFi v1.3 (h) | 6.6 | 7.7 17% | 8.5 29% | 5 -24% | 9.2 39% | 7.4 12% | 12 ? 82% |
| Load (h) | 1.4 | 2.3 64% | 2.2 57% | 1.4 0% | 2.2 57% | 1.713 ? 22% |
Pro
Contra
Vamos começar com a nossa pergunta introdutória - é o novo Lenovo ThinkPad X1 Tablet o melhor conversível empresarial? Esta questão não pode ser respondida em geral, porque os dispositivos concorrentes são muito diferentes nos detalhes. Depende de como o usuário planeja usar o dispositivo. Se precisar de uma longa duração da bateria e se o dispositivo irá ser usado frequentemente em exteriores, existem alternativas melhores. Outros dispositivos também oferecem mais e diferentes portas. Se for necessária uma tela mate, o usuário também não estará contente com o X1 Tablet.
No entanto, vimos na análise que a terceira geração do X1 Tablet é, em geral, um dispositivo muito bom. Sim, há pontos fracos, mas esses não impactam todos os usuários da mesma maneira. Se o dispositivo for usado principalmente com uma estação docking e se o tablet for usado principalmente para fazer anotações durante uma reunião, a duração média da bateria e a porta USB A ausente não serão um problema.
Vamos falar sobre os aspectos positivos: Um chassi estável, dispositivos de entrada muito bons com um teclado excelente, uma tela muito boa (especialmente quando calibrada) e USB C com Thunderbolt 3. Com a mudança para os modernos processadores quad-core, o conversível oferece um nível de desempenho de CPU semelhante ao dos Ultrabooks normais de negócios, mesmo que isso signifique que o ventilador seja audível e que as temperaturas sejam bem altas sob carga. Dito isto, a opção opcional de CPU i7 para o Tablet X1 não vale o seu dinheiro e é muito mais lenta do que o i5 com carga contínua.
Com o ThinkPad X1 Tablet totalmente reformulado, a Lenovo oferece um conversível comercial muito bom, o que dilui ainda mais a fronteira entre o tablet e o subportátil típico de negócios. No entanto, o Tablet X1 não oferece novos registros em termos de duração da bateria e a CPU i7 opcional não vale o seu custo.
Torna-se óbvio que as fronteiras entre as classes de dispositivos conhecidos são cada vez mais diluídas quando olha nossa avaliação. Como conversível, o Tablet X1 atinge 89%. Se este dispositivo for classificado como portátil ou subportátil, ele alcançaria 90%, já que ambas as categorias enfatizam mais os dispositivos de entrada e conectividade - duas categorias nas quais o ThinkPad X1 Tablet se destaca (no caso da conectividade, graças às modernas portas e amplos recursos de segurança).
Lenovo ThinkPad X1 Tablet G3-20KJ001NGE
- 10/17/2019 v7 (old)
Andreas Osthoff
Price comparison
