Breve Análise do Portátil Acer ConceptD 5 CN515-51: Kaby Lake G leve luta com redução de custos
Avaliação | Data | Modelo | Peso | Altura | Size | Resolução | Preço |
|---|---|---|---|---|---|---|---|
| 82.7 % v7 (old) | 02/2020 | Acer ConceptD 5 CN515-51-73Z7 i7-8705G, Vega M GL / 870 | 1.5 kg | 17 mm | 15.60" | 3840x2160 | |
| 87.8 % v7 (old) | 08/2019 | Dell XPS 15 7590 9980HK GTX 1650 i9-9980HK, GeForce GTX 1650 Mobile | 2 kg | 17 mm | 15.60" | 3840x2160 | |
| 89.7 % v7 (old) | 12/2019 | Apple MacBook Pro 16 2019 i9 5500M i9-9880H, Radeon Pro 5500M | 2 kg | 16.2 mm | 16.00" | 3072x1920 | |
| 87.1 % v7 (old) | 02/2020 | Lenovo ThinkPad X1 Extreme 2019 20QV000WGE i7-9750H, GeForce GTX 1650 Mobile | 1.7 kg | 18.7 mm | 15.60" | 3840x2160 |

| SD Card Reader | |
| average JPG Copy Test (av. of 3 runs) | |
| Dell XPS 15 7590 9980HK GTX 1650 (Toshiba Exceria Pro SDXC 64 GB UHS-II) | |
| Lenovo ThinkPad X1 Extreme 2019 20QV000WGE (Toshiba Exceria Pro SDXC 64 GB UHS-II) | |
| Média da turma Multimedia (23 - 531, n=43, últimos 2 anos) | |
| Acer ConceptD 5 CN515-51-73Z7 (Toshiba Exceria Pro SDXC 64 GB UHS-II) | |
| maximum AS SSD Seq Read Test (1GB) | |
| Lenovo ThinkPad X1 Extreme 2019 20QV000WGE (Toshiba Exceria Pro SDXC 64 GB UHS-II) | |
| Dell XPS 15 7590 9980HK GTX 1650 (Toshiba Exceria Pro SDXC 64 GB UHS-II) | |
| Média da turma Multimedia (27.9 - 1455, n=42, últimos 2 anos) | |
| Acer ConceptD 5 CN515-51-73Z7 (Toshiba Exceria Pro SDXC 64 GB UHS-II) | |
| |||||||||||||||||||||||||
iluminação: 86 %
iluminação com acumulador: 347 cd/m²
Contraste: 1321:1 (Preto: 0.265 cd/m²)
ΔE ColorChecker Calman: 5.08 | ∀{0.5-29.43 Ø4.73}
calibrated: 4.38
ΔE Greyscale Calman: 3.62 | ∀{0.09-98 Ø4.97}
100% sRGB (Argyll 1.6.3 3D)
88% AdobeRGB 1998 (Argyll 1.6.3 3D)
99.2% AdobeRGB 1998 (Argyll 3D)
100% sRGB (Argyll 3D)
86.1% Display P3 (Argyll 3D)
Gamma: 2.27
CCT: 6389 K
| Acer ConceptD 5 CN515-51-73Z7 B156ZAN03.1, LTPS IPS LED, 3840x2160, 15.6" | Dell XPS 15 7590 9980HK GTX 1650 Samsung 156WR04, SDCA029, OLED, 3840x2160, 15.6" | Apple MacBook Pro 16 2019 i9 5500M APPA044, IPS, 3072x1920, 16" | Lenovo ThinkPad X1 Extreme 2019 20QV000WGE NE156QUM-N66, IPS, 3840x2160, 15.6" | |
|---|---|---|---|---|
| Display | -2% | -3% | ||
| Display P3 Coverage (%) | 86.1 | 88.1 2% | 82 -5% | |
| sRGB Coverage (%) | 100 | 99.6 0% | 99.1 -1% | |
| AdobeRGB 1998 Coverage (%) | 99.2 | 91.8 -7% | 96.9 -2% | |
| Response Times | 95% | 15% | 25% | |
| Response Time Grey 50% / Grey 80% * (ms) | 63 ? | 2.3 ? 96% | 52.4 ? 17% | 46.4 ? 26% |
| Response Time Black / White * (ms) | 40 ? | 2.4 ? 94% | 34.9 ? 13% | 30.4 ? 24% |
| PWM Frequency (Hz) | 59.5 ? | 131700 | ||
| Screen | 5% | 28% | 2% | |
| Brightness middle (cd/m²) | 350 | 421.2 20% | 519 48% | 464 33% |
| Brightness (cd/m²) | 329 | 417 27% | 477 45% | 448 36% |
| Brightness Distribution (%) | 86 | 94 9% | 86 0% | 90 5% |
| Black Level * (cd/m²) | 0.265 | 0.39 -47% | 0.36 -36% | |
| Contrast (:1) | 1321 | 1331 1% | 1289 -2% | |
| Colorchecker dE 2000 * | 5.08 | 6.06 -19% | 2.28 55% | 4.2 17% |
| Colorchecker dE 2000 max. * | 10.25 | 11.89 -16% | 6.54 36% | 11.4 -11% |
| Colorchecker dE 2000 calibrated * | 4.38 | 0.86 80% | 0.8 82% | |
| Greyscale dE 2000 * | 3.62 | 2.8 23% | 0.9 75% | 7.2 -99% |
| Gamma | 2.27 97% | 2.15 102% | 2145 0% | 2.17 101% |
| CCT | 6389 102% | 6235 104% | 6572 99% | 6345 102% |
| Color Space (Percent of AdobeRGB 1998) (%) | 88 | 81 -8% | 78 -11% | 85.2 -3% |
| Color Space (Percent of sRGB) (%) | 100 | 99.6 0% | 99 -1% | |
| Média Total (Programa/Configurações) | 33% /
17% | 22% /
26% | 8% /
4% |
* ... menor é melhor
Exibir tempos de resposta
| ↔ Tempo de resposta preto para branco | ||
|---|---|---|
| 40 ms ... ascensão ↗ e queda ↘ combinadas | ↗ 24 ms ascensão | 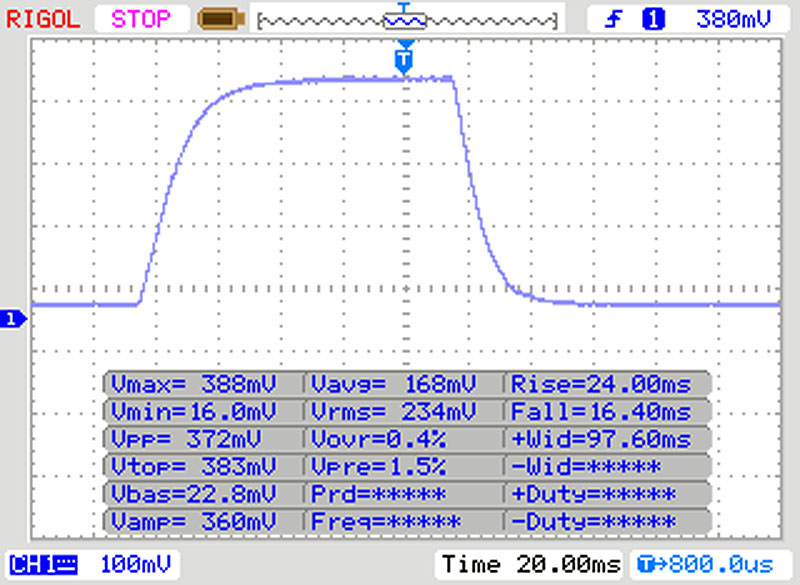 |
| ↘ 16 ms queda | ||
| A tela mostra taxas de resposta lentas em nossos testes e será insatisfatória para os jogadores. Em comparação, todos os dispositivos testados variam de 0.1 (mínimo) a 240 (máximo) ms. » 97 % de todos os dispositivos são melhores. Isso significa que o tempo de resposta medido é pior que a média de todos os dispositivos testados (19.9 ms). | ||
| ↔ Tempo de resposta 50% cinza a 80% cinza | ||
| 63 ms ... ascensão ↗ e queda ↘ combinadas | ↗ 32 ms ascensão | 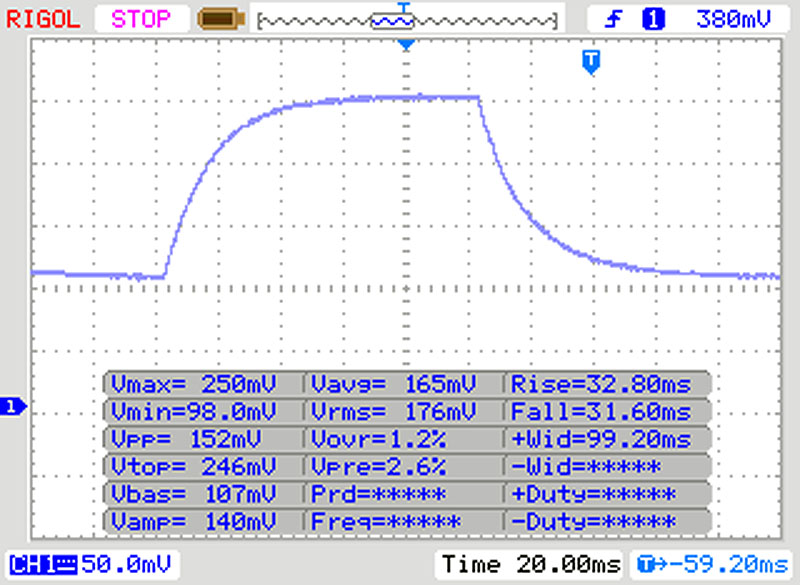 |
| ↘ 31 ms queda | ||
| A tela mostra taxas de resposta lentas em nossos testes e será insatisfatória para os jogadores. Em comparação, todos os dispositivos testados variam de 0.165 (mínimo) a 636 (máximo) ms. » 97 % de todos os dispositivos são melhores. Isso significa que o tempo de resposta medido é pior que a média de todos os dispositivos testados (31.1 ms). | ||
Cintilação da tela / PWM (modulação por largura de pulso)
| Tela tremeluzindo / PWM não detectado | 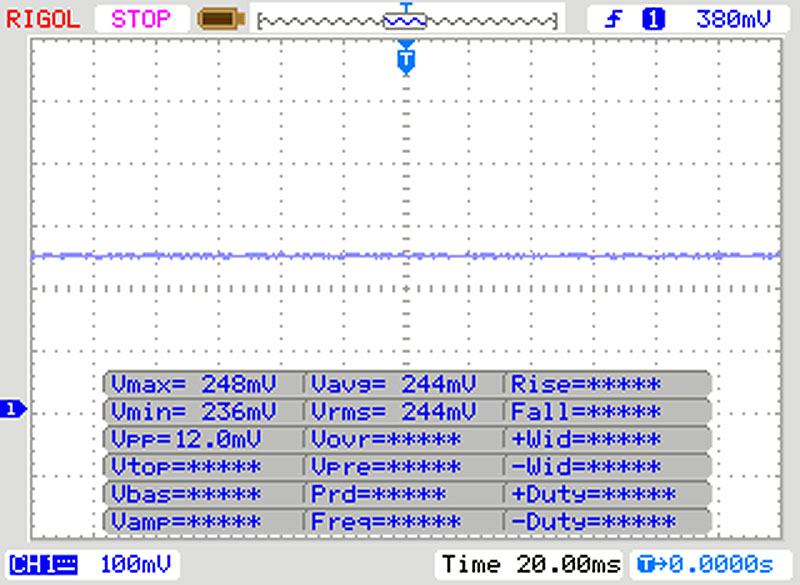 | ||
[pwm_comparison] Em comparação: 52 % de todos os dispositivos testados não usam PWM para escurecer a tela. Se PWM foi detectado, uma média de 7798 (mínimo: 5 - máximo: 343500) Hz foi medida. | |||
| PCMark 8 Home Score Accelerated v2 | 3551 pontos | |
| PCMark 8 Creative Score Accelerated v2 | 4031 pontos | |
| PCMark 8 Work Score Accelerated v2 | 4359 pontos | |
| PCMark 10 Score | 4583 pontos | |
Ajuda | ||
| Acer ConceptD 5 CN515-51-73Z7 WDC PC SN720 SDAPNTW-512G | Dell XPS 15 7590 9980HK GTX 1650 Toshiba XG6 KXG60ZNV1T02 | Apple MacBook Pro 16 2019 i9 5500M Apple SSD AP1024 7171 | Lenovo ThinkPad X1 Extreme 2019 20QV000WGE Samsung SSD PM981 MZVLB512HAJQ | Média WDC PC SN720 SDAPNTW-512G | |
|---|---|---|---|---|---|
| CrystalDiskMark 5.2 / 6 | 1% | -7% | 11% | -8% | |
| Write 4K (MB/s) | 120.6 | 104.3 -14% | 55.5 -54% | 148.1 23% | 110 ? -9% |
| Read 4K (MB/s) | 41.43 | 45.23 9% | 16.21 -61% | 47.31 14% | 36.9 ? -11% |
| Write Seq (MB/s) | 2402 | 1729 -28% | 1959 -18% | 1414 -41% | 1976 ? -18% |
| Read Seq (MB/s) | 1997 | 1861 -7% | 1763 -12% | 1320 -34% | 1710 ? -14% |
| Write 4K Q32T1 (MB/s) | 335.2 | 509 52% | 398.5 19% | 493.6 47% | 339 ? 1% |
| Read 4K Q32T1 (MB/s) | 381.7 | 388.5 2% | 648 70% | 594 56% | 417 ? 9% |
| Write Seq Q32T1 (MB/s) | 2553 | 2813 10% | 2727 7% | 2970 16% | 2218 ? -13% |
| Read Seq Q32T1 (MB/s) | 3356 | 2906 -13% | 3242 -3% | 3472 3% | 2940 ? -12% |

| 3DMark 11 Performance | 9104 pontos | |
| 3DMark Cloud Gate Standard Score | 15911 pontos | |
| 3DMark Fire Strike Score | 5879 pontos | |
| 3DMark Time Spy Score | 2121 pontos | |
Ajuda | ||
| baixo | média | alto | ultra | 4K | |
|---|---|---|---|---|---|
| BioShock Infinite (2013) | 216.3 | 165.3 | 148 | 59.8 | |
| The Witcher 3 (2015) | 116.6 | 75.9 | 41.3 | 24.3 | 14.4 |
| F1 2019 (2019) | 105 | 65 | 56 | 38 | 16 |
Barulho
| Ocioso |
| 30.3 / 30.3 / 30.3 dB |
| Carga |
| 32.6 / 40.2 dB |
 | ||
30 dB silencioso 40 dB(A) audível 50 dB(A) ruidosamente alto |
||
min: | ||
(±) A temperatura máxima no lado superior é 44.6 °C / 112 F, em comparação com a média de 36.8 °C / 98 F , variando de 21 a 71 °C para a classe Multimedia.
(-) A parte inferior aquece até um máximo de 45.4 °C / 114 F, em comparação com a média de 39.1 °C / 102 F
(+) Em uso inativo, a temperatura média para o lado superior é 24.4 °C / 76 F, em comparação com a média do dispositivo de 31.3 °C / ### class_avg_f### F.
(+) Os apoios para as mãos e o touchpad são mais frios que a temperatura da pele, com um máximo de 29.7 °C / 85.5 F e, portanto, são frios ao toque.
(±) A temperatura média da área do apoio para as mãos de dispositivos semelhantes foi 28.7 °C / 83.7 F (-1 °C / -1.8 F).
Acer ConceptD 5 CN515-51-73Z7 análise de áudio
(-) | alto-falantes não muito altos (###valor### dB)
Graves 100 - 315Hz
(-) | quase nenhum baixo - em média 21.2% menor que a mediana
(±) | a linearidade dos graves é média (10.1% delta para a frequência anterior)
Médios 400 - 2.000 Hz
(±) | médios mais altos - em média 5.8% maior que a mediana
(±) | a linearidade dos médios é média (10% delta para frequência anterior)
Altos 2 - 16 kHz
(+) | agudos equilibrados - apenas 4.3% longe da mediana
(±) | a linearidade dos máximos é média (10.1% delta para frequência anterior)
Geral 100 - 16.000 Hz
(±) | a linearidade do som geral é média (26.3% diferença em relação à mediana)
Comparado com a mesma classe
» 92% de todos os dispositivos testados nesta classe foram melhores, 1% semelhantes, 6% piores
» O melhor teve um delta de 5%, a média foi 17%, o pior foi 45%
Comparado com todos os dispositivos testados
» 81% de todos os dispositivos testados foram melhores, 4% semelhantes, 15% piores
» O melhor teve um delta de 4%, a média foi 24%, o pior foi 134%
Dell XPS 15 7590 9980HK GTX 1650 análise de áudio
(+) | os alto-falantes podem tocar relativamente alto (###valor### dB)
Graves 100 - 315Hz
(-) | quase nenhum baixo - em média 24.9% menor que a mediana
(±) | a linearidade dos graves é média (14.4% delta para a frequência anterior)
Médios 400 - 2.000 Hz
(+) | médios equilibrados - apenas 2.8% longe da mediana
(±) | a linearidade dos médios é média (7.8% delta para frequência anterior)
Altos 2 - 16 kHz
(+) | agudos equilibrados - apenas 1.9% longe da mediana
(+) | os máximos são lineares (5.3% delta da frequência anterior)
Geral 100 - 16.000 Hz
(±) | a linearidade do som geral é média (17.8% diferença em relação à mediana)
Comparado com a mesma classe
» 52% de todos os dispositivos testados nesta classe foram melhores, 7% semelhantes, 41% piores
» O melhor teve um delta de 5%, a média foi 17%, o pior foi 45%
Comparado com todos os dispositivos testados
» 36% de todos os dispositivos testados foram melhores, 8% semelhantes, 56% piores
» O melhor teve um delta de 4%, a média foi 24%, o pior foi 134%
| desligado | |
| Ocioso | |
| Carga |
|
Key:
min: | |
| Acer ConceptD 5 CN515-51-73Z7 i7-8705G, Vega M GL / 870, WDC PC SN720 SDAPNTW-512G, LTPS IPS LED, 3840x2160, 15.6" | Dell XPS 15 7590 9980HK GTX 1650 i9-9980HK, GeForce GTX 1650 Mobile, Toshiba XG6 KXG60ZNV1T02, OLED, 3840x2160, 15.6" | Apple MacBook Pro 16 2019 i9 5500M i9-9880H, Radeon Pro 5500M, Apple SSD AP1024 7171, IPS, 3072x1920, 16" | Lenovo ThinkPad X1 Extreme 2019 20QV000WGE i7-9750H, GeForce GTX 1650 Mobile, Samsung SSD PM981 MZVLB512HAJQ, IPS, 3840x2160, 15.6" | Média AMD Radeon RX Vega M GL / 870 | Média da turma Multimedia | |
|---|---|---|---|---|---|---|
| Power Consumption | -9% | 8% | -11% | 2% | 19% | |
| Idle Minimum * (Watt) | 12 | 6.2 48% | 3.7 69% | 8.5 29% | 9.97 ? 17% | 5.71 ? 52% |
| Idle Average * (Watt) | 17.8 | 9.6 46% | 12.1 32% | 14.7 17% | 15.8 ? 11% | 10.1 ? 43% |
| Idle Maximum * (Watt) | 19.7 | 21.2 -8% | 17 14% | 19.4 2% | 17.4 ? 12% | 12.4 ? 37% |
| Load Average * (Watt) | 59 | 104.3 -77% | 91.5 -55% | 89.6 -52% | 72.5 ? -23% | 65 ? -10% |
| Load Maximum * (Watt) | 87 | 135.3 -56% | 102.3 -18% | 129.8 -49% | 93.8 ? -8% | 112.2 ? -29% |
| Witcher 3 ultra * (Watt) | 91.7 | 103 | 96.1 |
* ... menor é melhor
| Acer ConceptD 5 CN515-51-73Z7 i7-8705G, Vega M GL / 870, 48 Wh | Dell XPS 15 7590 9980HK GTX 1650 i9-9980HK, GeForce GTX 1650 Mobile, 97 Wh | Apple MacBook Pro 16 2019 i9 5500M i9-9880H, Radeon Pro 5500M, 99.8 Wh | Lenovo ThinkPad X1 Extreme 2019 20QV000WGE i7-9750H, GeForce GTX 1650 Mobile, 80 Wh | Média da turma Multimedia | |
|---|---|---|---|---|---|
| Duração da bateria | 101% | 58% | -14% | 137% | |
| Reader / Idle (h) | 7.7 | 15.2 97% | 25.2 ? 227% | ||
| H.264 (h) | 6.9 | 9.7 41% | 4.7 -32% | 16.4 ? 138% | |
| WiFi v1.3 (h) | 4.6 | 7.8 70% | 12 161% | 4.8 4% | 12 ? 161% |
| Load (h) | 1.4 | 3.3 136% | 1 -29% | 1.2 -14% | 1.675 ? 20% |
| Witcher 3 ultra (h) | 0.9 |
Pro
Contra
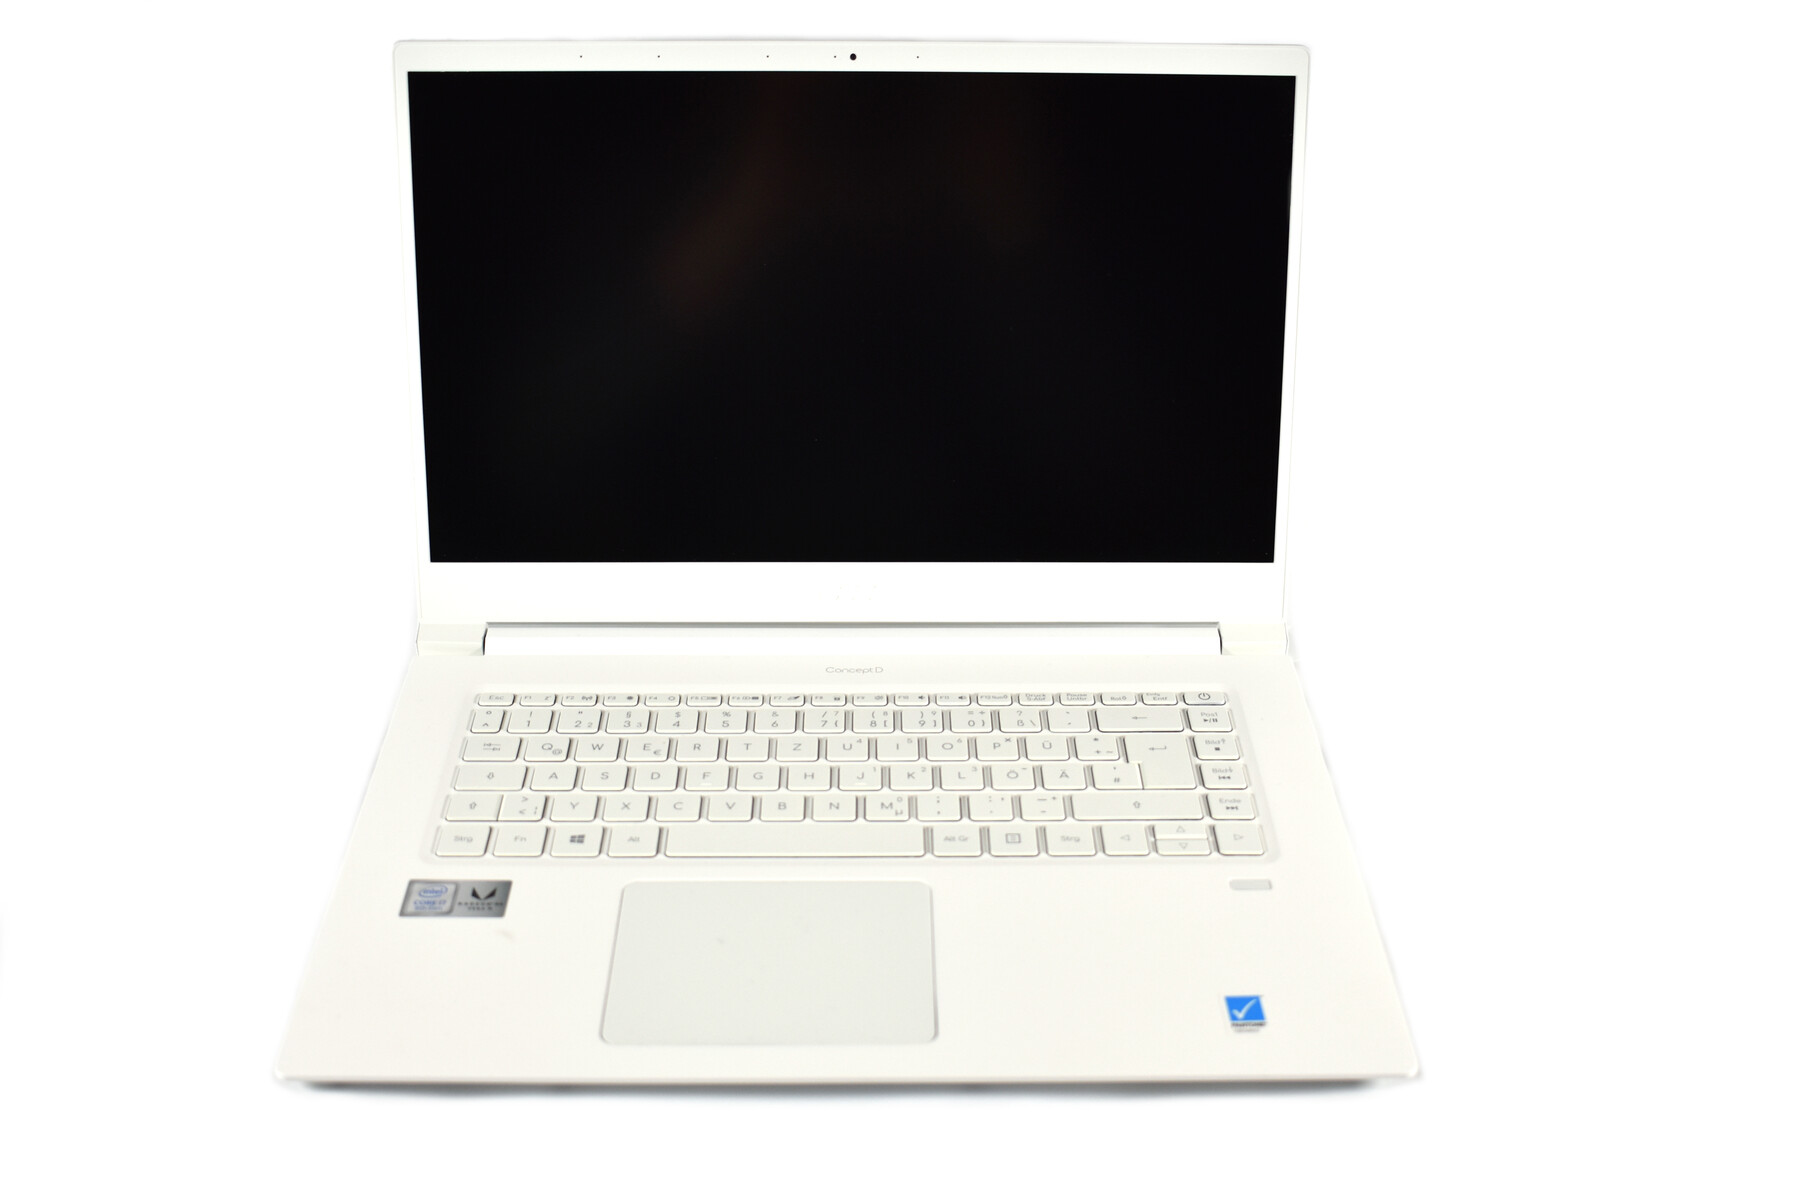
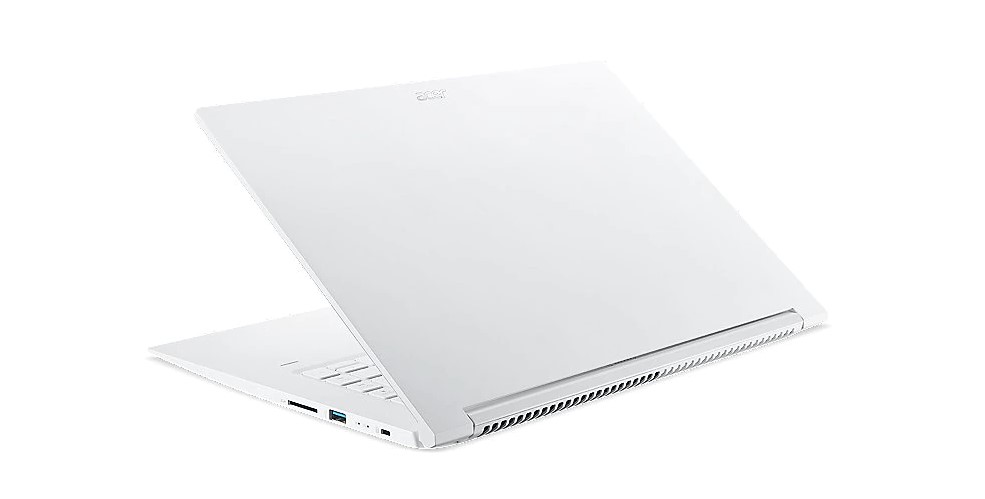
A Acer criou um portátil multimídia fora do comum com o ConceptD 5 CN515-51.
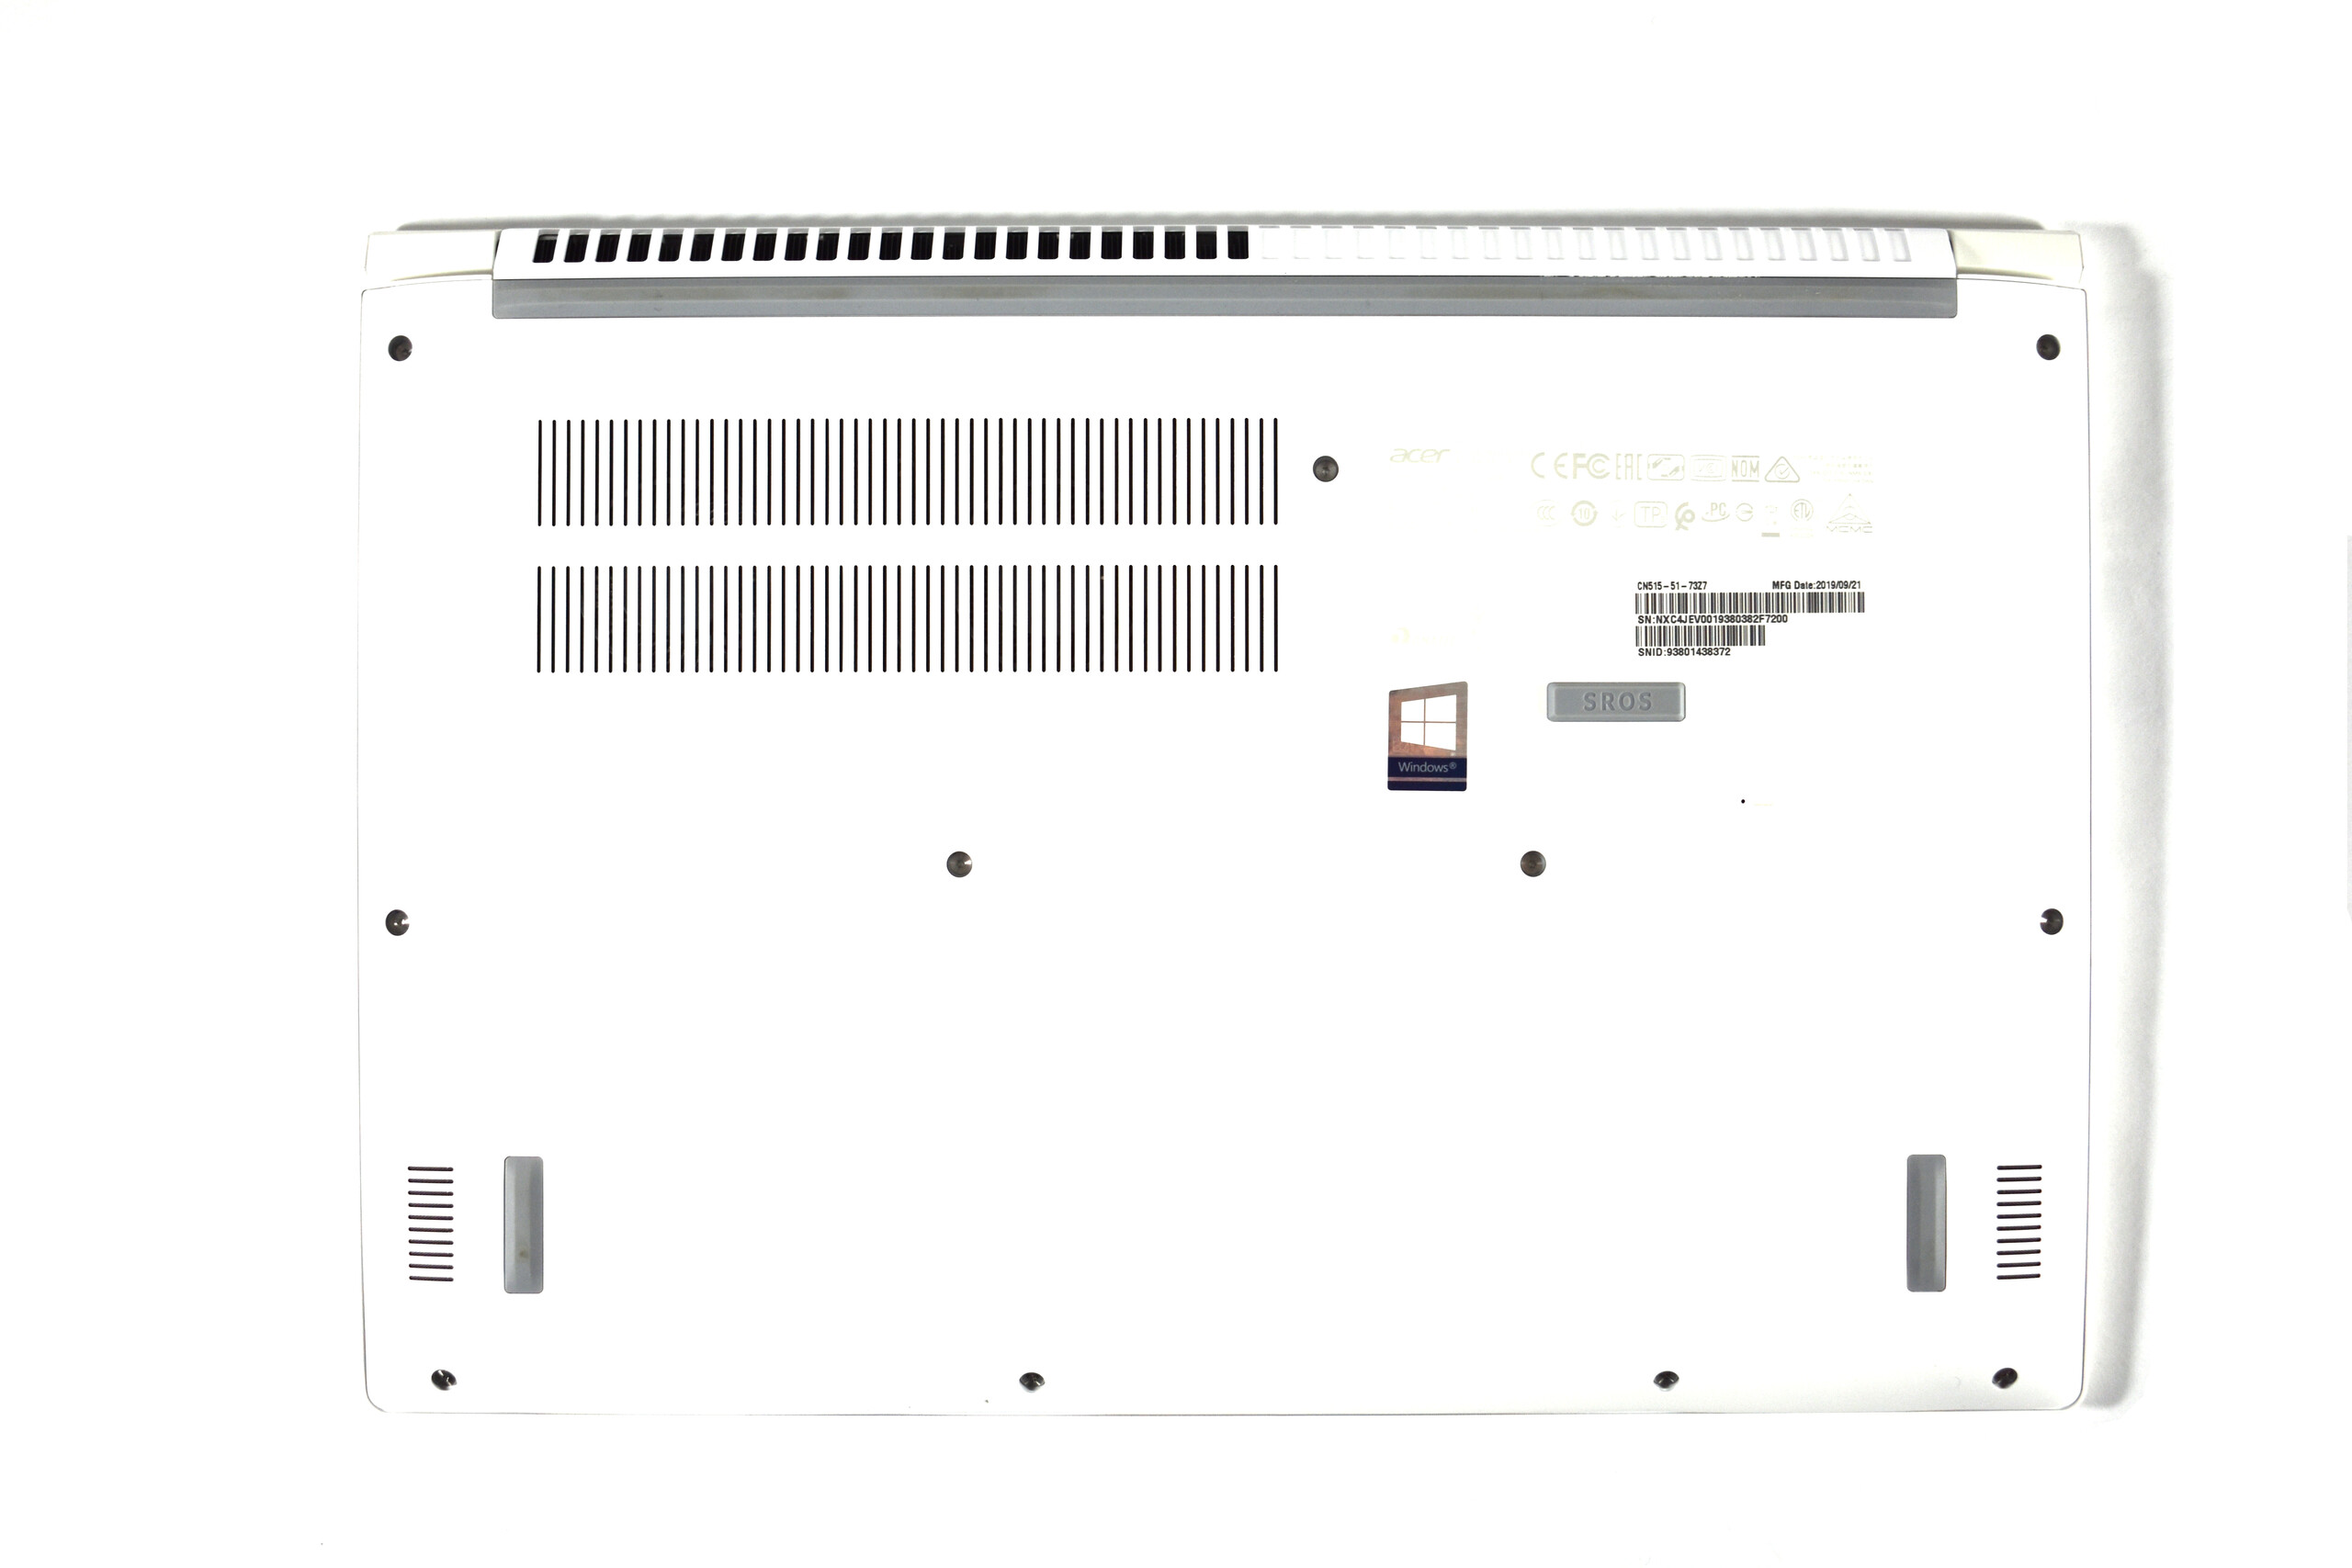
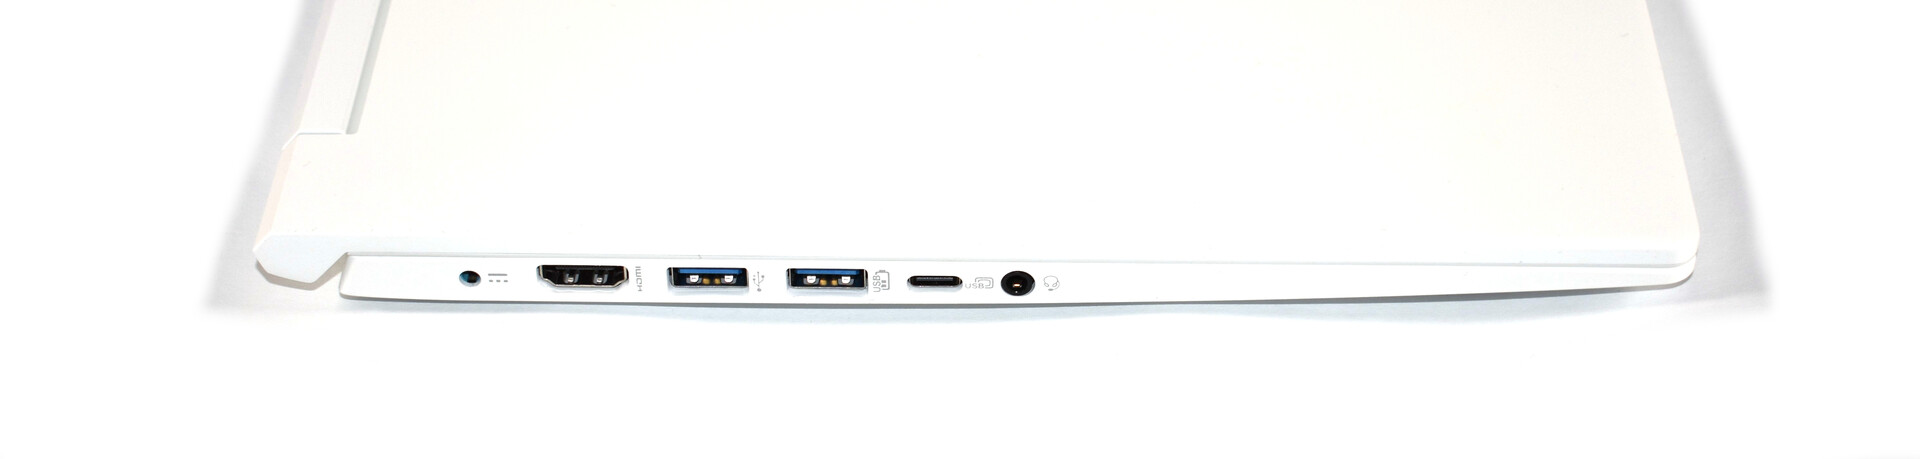
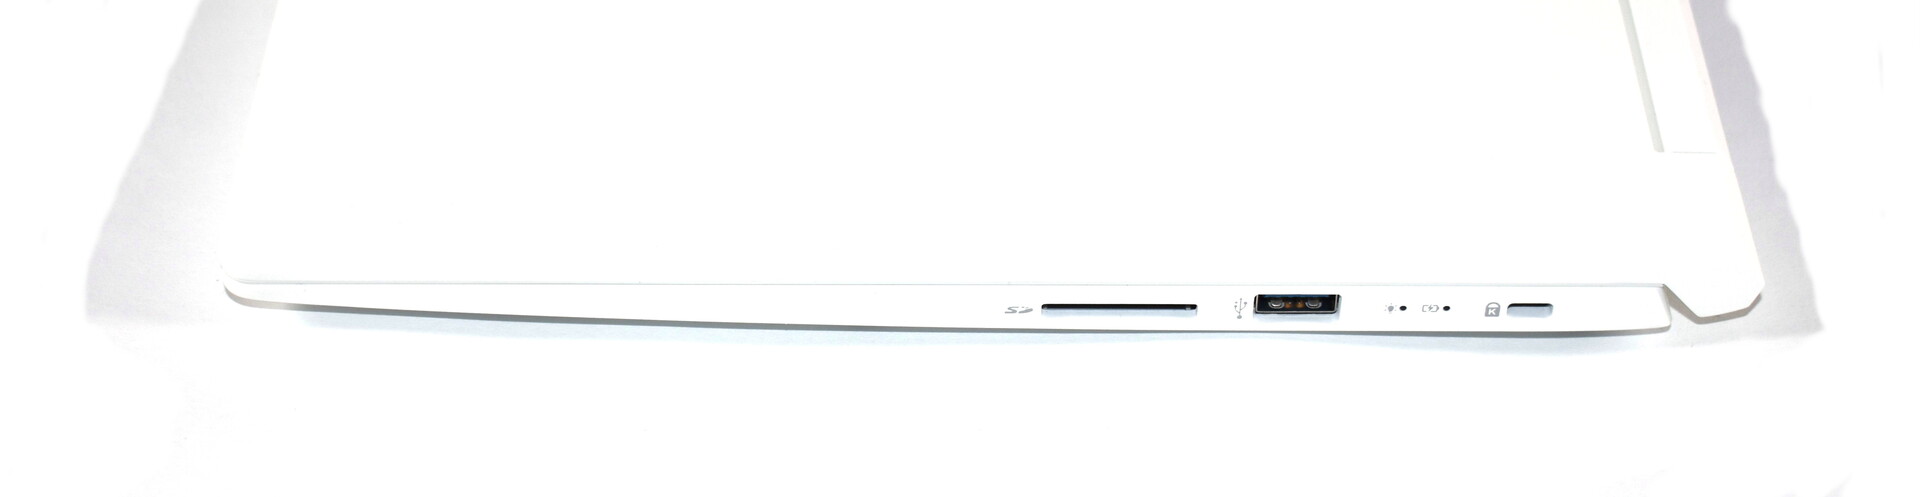
Ele se vê diferente de outros modelos desta classe e tem um foco forte no peso baixo graças aos materiais do chassi. Isso é algo bom, mas a tampa fraca da tela parece ser um efeito secundário negativa deste foco sob uma iluminação baixa. No que se refere às portas, a Acer não incluiu Thunderbolt 3. Também é utilizado um leitor de cartões SD extremamente lento, que está completamente mal posicionado em um portátil multimídia caro. O mesmo é verdade para o módulo Wi-Fi desatualizado, que nem sequer suporta o mais recente padrão Bluetooth. Louvável e censurável é a capacidade de atualização: Enquanto a RAM é completamente soldada, a capacidade de armazenamento em massa pode ser atualizada facilmente, graças ao slot M.2 2280 disponível.
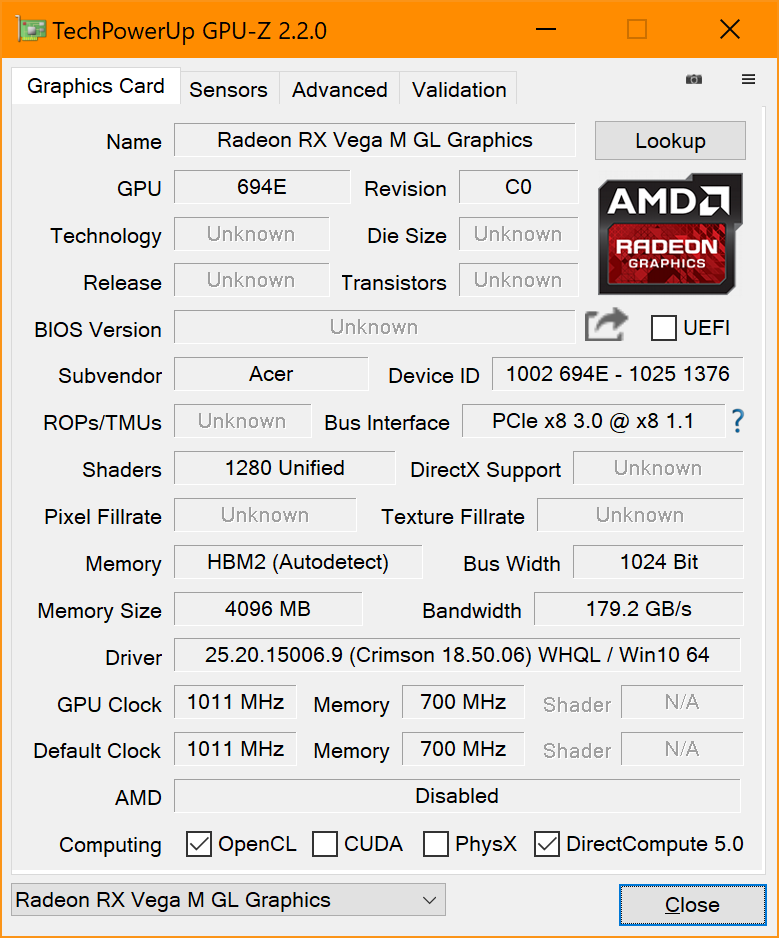
A tela do portátil Acer possui uma excelente cobertura de cores, seu brilho mais baixo do que o prometido e o bleeding da luz de fundo relativamente forte, nos decepcionam. Em termos de desempenho, o ConceptD oferece aproximadamente o que esperávamos do Kaby Lake G. Um bom desempenho para um portátil multimídia, mas muitos outros portáteis com CPUs Intel mais recentes e GPUs Nvidia dedicadas oferecem melhor desempenho. Infelizmente, isto não resulta em uma melhor duração da bateria, em troca. Em vez disso, a bateria arruina a equação, pois é muito pequena. Além disso, temos que pesar negativamente o ruído da bobina, a limitação de desempenho quando o dispositivo funciona com energia da bateria e os falantes abaixo da média (para um portátil multimídia).
Não sem compromissos: Infelizmente, a Acer decidiu cortar custos em componentes cruciais. Não pode competir com os concorrentes mais caros.
Para nós, não está claro para quem a Acer deseja comercializar o ConceptD 5 CN515-51. A característica positiva mais destacada é o baixo peso e a tela colorida. Com esses dois pontos fortes, parece destinado a ser um sonho dos fotógrafos. Este grupo, no entanto, provavelmente ficará extremamente irritado com o lento leitor de cartões SD Além disso, a baixa duração da bateria é um problema. O ConceptD pode ser usado para jogar, mas também não foi feito para isso.
Acer ConceptD 5 CN515-51-73Z7
- 02/17/2020 v7 (old)
Benjamin Herzig
Price comparison
