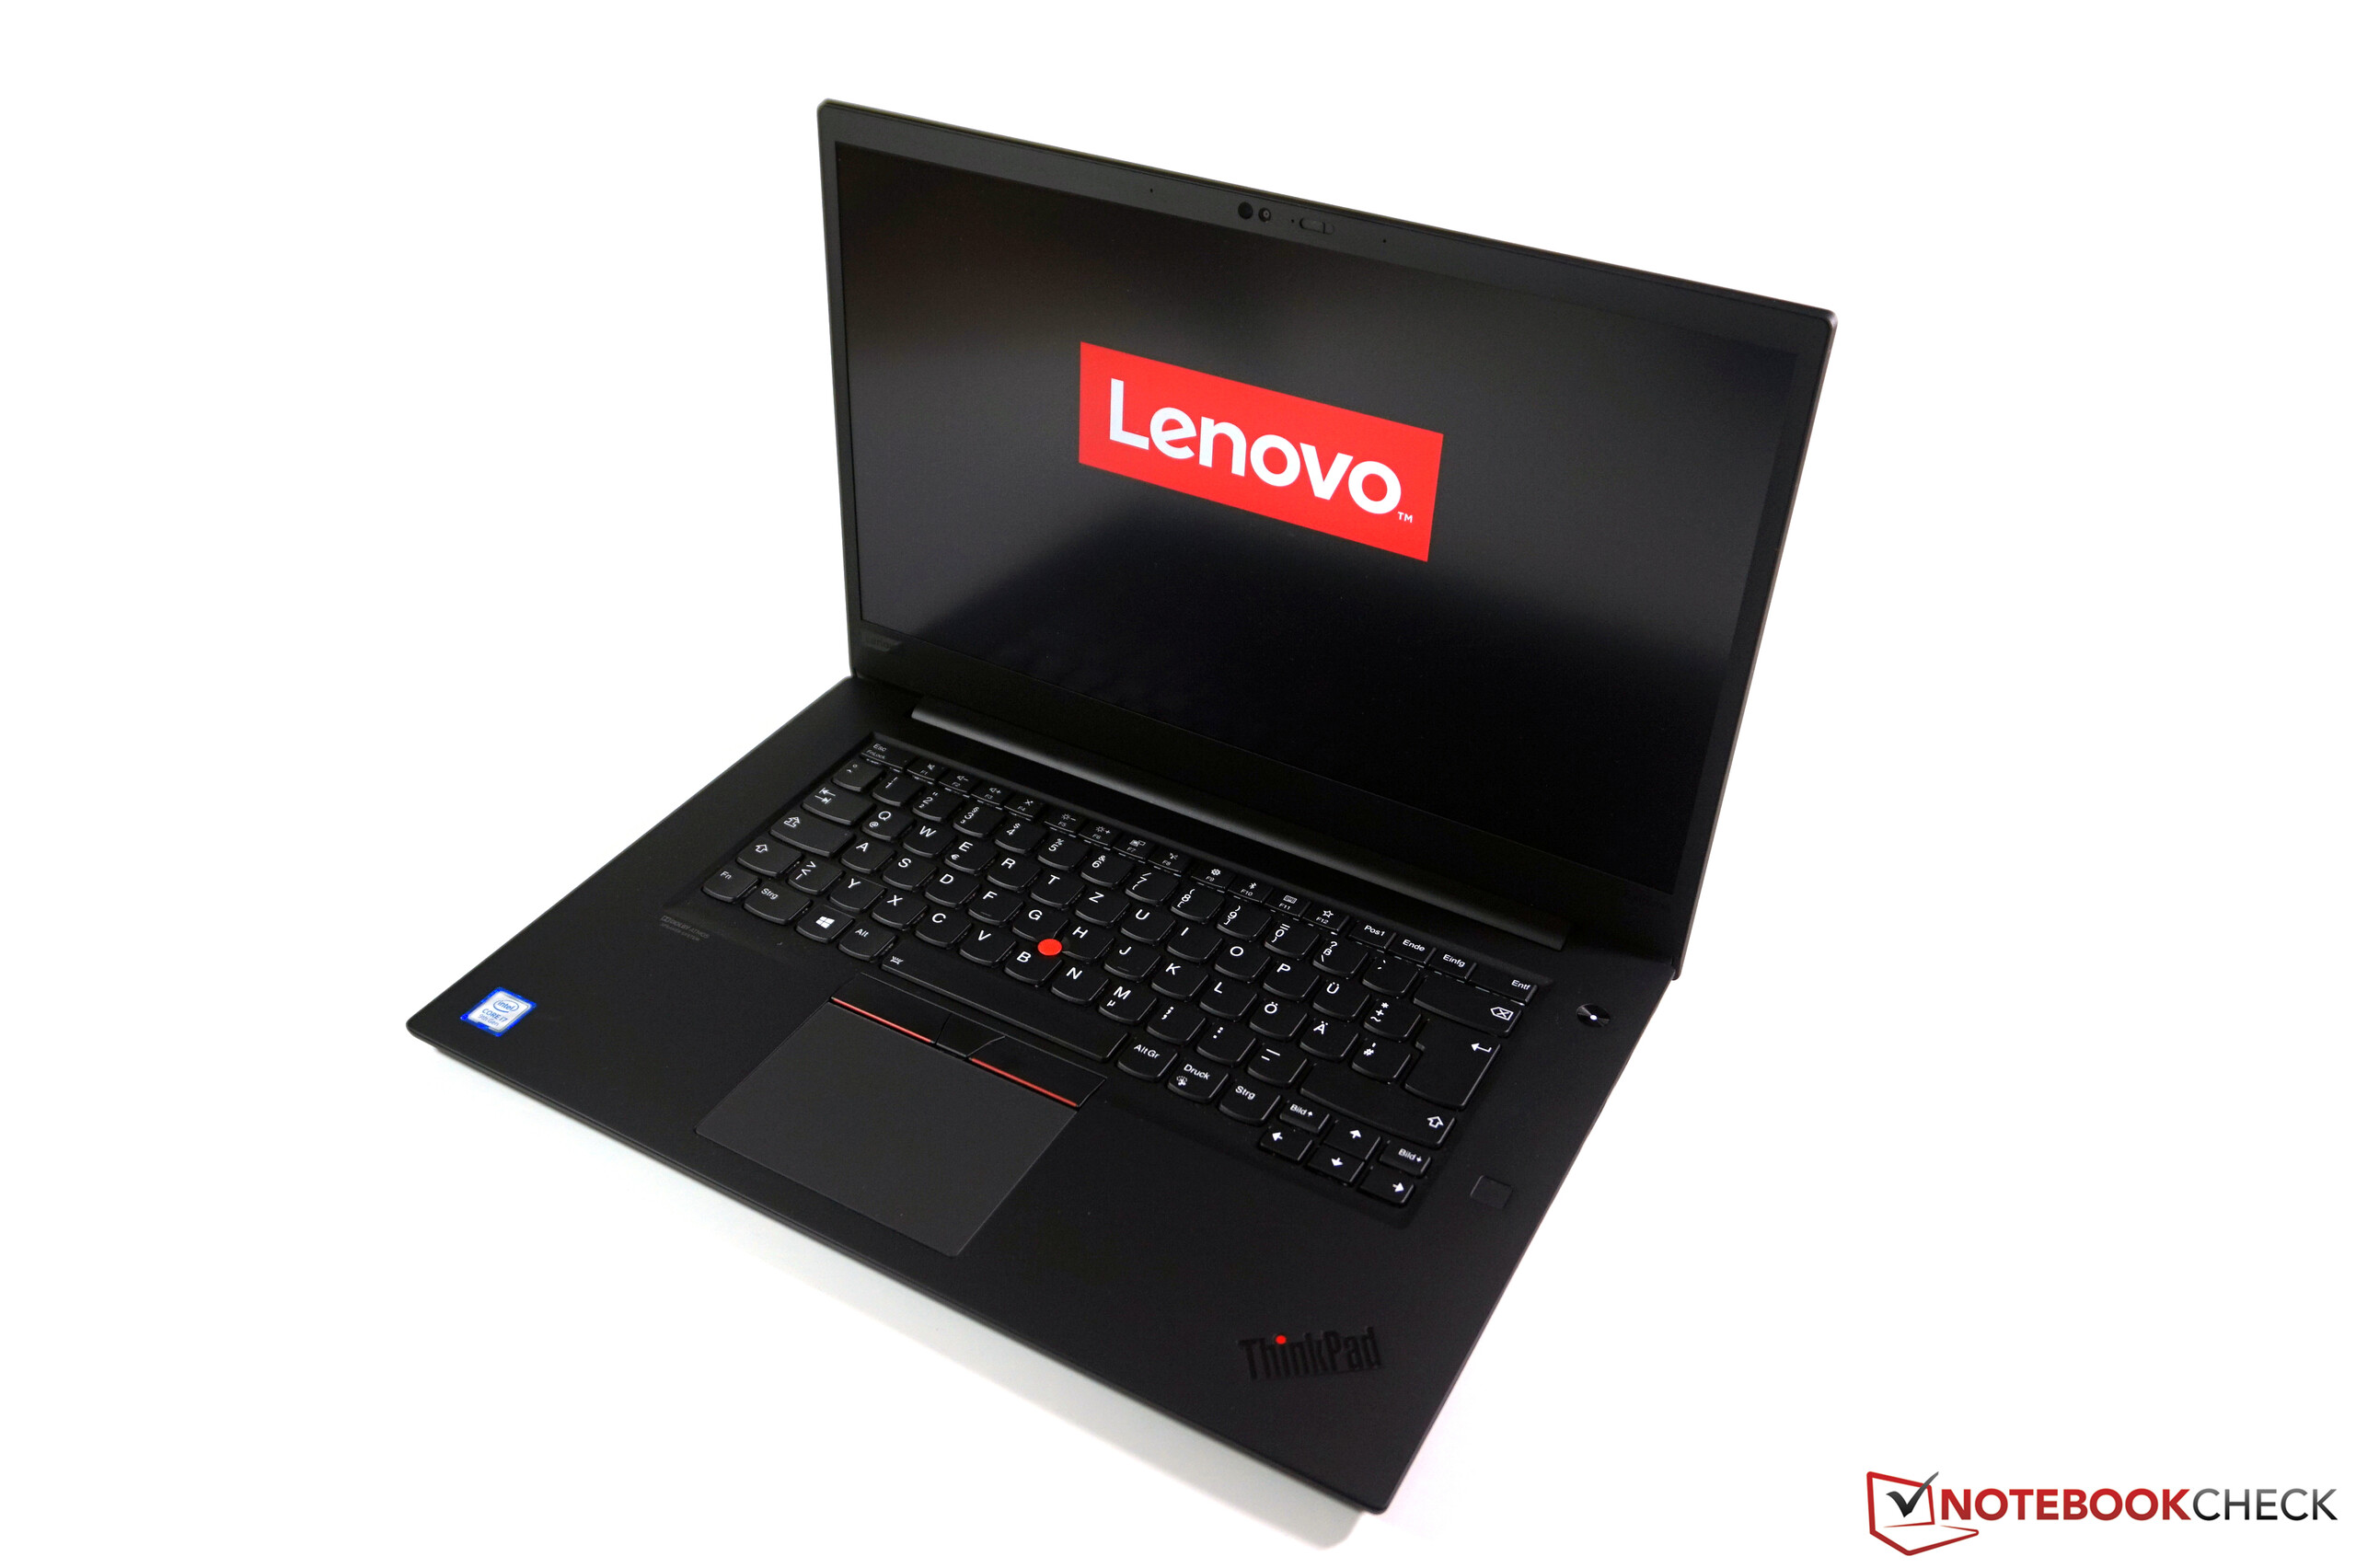
Breve Análise do Portátil Lenovo ThinkPad X1 Extreme 2019: A segunda geração do principal portátil multimídia da Lenovo piorou
Avaliação | Data | Modelo | Peso | Altura | Size | Resolução | Preço |
|---|---|---|---|---|---|---|---|
| 87.1 % v7 (old) | 02/2020 | Lenovo ThinkPad X1 Extreme 2019 20QV000WGE i7-9750H, GeForce GTX 1650 Mobile | 1.7 kg | 18.7 mm | 15.60" | 3840x2160 | |
| 87.8 % v7 (old) | 08/2019 | Dell XPS 15 7590 9980HK GTX 1650 i9-9980HK, GeForce GTX 1650 Mobile | 2 kg | 17 mm | 15.60" | 3840x2160 | |
| 89.7 % v7 (old) | 12/2019 | Apple MacBook Pro 16 2019 i9 5500M i9-9880H, Radeon Pro 5500M | 2 kg | 16.2 mm | 16.00" | 3072x1920 | |
| 87.3 % v7 (old) | 11/2019 | Acer ConceptD 7 CN715-71-743N i7-9750H, GeForce RTX 2060 Mobile | 2.2 kg | 17.9 mm | 15.60" | 3840x2160 | |
| 86 % v7 (old) | 12/2019 | Lenovo Yoga C940-15IRH i7-9750H, GeForce GTX 1650 Max-Q | 2 kg | 19.7 mm | 15.60" | 1920x1080 | |
| 85.2 % v7 (old) | 11/2019 | MSI Prestige 15 A10SC i7-10710U, GeForce GTX 1650 Max-Q | 1.7 kg | 16 mm | 15.60" | 3840x2160 |


| SD Card Reader | |
| average JPG Copy Test (av. of 3 runs) | |
| Dell XPS 15 7590 9980HK GTX 1650 (Toshiba Exceria Pro SDXC 64 GB UHS-II) | |
| Lenovo ThinkPad X1 Extreme 2019 20QV000WGE (Toshiba Exceria Pro SDXC 64 GB UHS-II) | |
| MSI Prestige 15 A10SC (Toshiba Exceria Pro M501 UHS-II) | |
| Média da turma Multimedia (23 - 531, n=43, últimos 2 anos) | |
| maximum AS SSD Seq Read Test (1GB) | |
| Lenovo ThinkPad X1 Extreme 2019 20QV000WGE (Toshiba Exceria Pro SDXC 64 GB UHS-II) | |
| MSI Prestige 15 A10SC (Toshiba Exceria Pro M501 UHS-II) | |
| Dell XPS 15 7590 9980HK GTX 1650 (Toshiba Exceria Pro SDXC 64 GB UHS-II) | |
| Média da turma Multimedia (27.9 - 1455, n=42, últimos 2 anos) | |
| |||||||||||||||||||||||||
iluminação: 90 %
iluminação com acumulador: 465 cd/m²
Contraste: 1289:1 (Preto: 0.36 cd/m²)
ΔE ColorChecker Calman: 4.2 | ∀{0.5-29.43 Ø4.73}
calibrated: 0.8
ΔE Greyscale Calman: 7.2 | ∀{0.09-98 Ø4.97}
99% sRGB (Argyll 1.6.3 3D)
85.2% AdobeRGB 1998 (Argyll 1.6.3 3D)
96.9% AdobeRGB 1998 (Argyll 3D)
99.1% sRGB (Argyll 3D)
82% Display P3 (Argyll 3D)
Gamma: 2.17
CCT: 6345 K
| Lenovo ThinkPad X1 Extreme 2019 20QV000WGE NE156QUM-N66, IPS, 3840x2160, 15.6" | Dell XPS 15 7590 9980HK GTX 1650 Samsung 156WR04, SDCA029, OLED, 3840x2160, 15.6" | Apple MacBook Pro 16 2019 i9 5500M APPA044, IPS, 3072x1920, 16" | Acer ConceptD 7 CN715-71-743N AU Optronics AUO31EB, IPS, 3840x2160, 15.6" | Lenovo Yoga C940-15IRH LG Philips LP156WFC-SPU1, IPS, 1920x1080, 15.6" | MSI Prestige 15 A10SC Sharp LQ156D1JW42, IPS, 3840x2160, 15.6" | Lenovo ThinkPad X1 Extreme-20MF000XGE B156ZAN03.2, IPS, 3840x2160, 15.6" | |
|---|---|---|---|---|---|---|---|
| Display | 1% | 3% | -22% | -1% | 3% | ||
| Display P3 Coverage (%) | 82 | 88.1 7% | 85.7 5% | 61.5 -25% | 82 0% | 86.3 5% | |
| sRGB Coverage (%) | 99.1 | 99.6 1% | 100 1% | 92.7 -6% | 98.3 -1% | 100 1% | |
| AdobeRGB 1998 Coverage (%) | 96.9 | 91.8 -5% | 99 2% | 63.6 -34% | 96.2 -1% | 99.4 3% | |
| Response Times | 94% | -14% | -3% | -12% | -33% | -19% | |
| Response Time Grey 50% / Grey 80% * (ms) | 46.4 ? | 2.3 ? 95% | 52.4 ? -13% | 49 ? -6% | 48.4 ? -4% | 60 ? -29% | 61.6 ? -33% |
| Response Time Black / White * (ms) | 30.4 ? | 2.4 ? 92% | 34.9 ? -15% | 30 ? 1% | 36.4 ? -20% | 41.2 ? -36% | 32 ? -5% |
| PWM Frequency (Hz) | 59.5 ? | 131700 | 26040 ? | ||||
| Screen | -0% | 17% | 18% | 3% | -23% | 4% | |
| Brightness middle (cd/m²) | 464 | 421.2 -9% | 519 12% | 365 -21% | 484.8 4% | 464.5 0% | 396 -15% |
| Brightness (cd/m²) | 448 | 417 -7% | 477 6% | 357 -20% | 463 3% | 451 1% | 380 -15% |
| Brightness Distribution (%) | 90 | 94 4% | 86 -4% | 84 -7% | 82 -9% | 92 2% | 90 0% |
| Black Level * (cd/m²) | 0.36 | 0.39 -8% | 0.275 24% | 0.26 28% | 0.5 -39% | 0.28 22% | |
| Contrast (:1) | 1289 | 1331 3% | 1327 3% | 1865 45% | 929 -28% | 1414 10% | |
| Colorchecker dE 2000 * | 4.2 | 6.06 -44% | 2.28 46% | 0.99 76% | 4.5 -7% | 3.36 20% | 4 5% |
| Colorchecker dE 2000 max. * | 11.4 | 11.89 -4% | 6.54 43% | 1.89 83% | 7.55 34% | 7.06 38% | 7.6 33% |
| Colorchecker dE 2000 calibrated * | 0.8 | 0.86 -8% | 1.01 -26% | 1.19 -49% | 3.42 -327% | 0.9 -13% | |
| Greyscale dE 2000 * | 7.2 | 2.8 61% | 0.9 87% | 1.29 82% | 5.7 21% | 1.3 82% | 6.1 15% |
| Gamma | 2.17 101% | 2.15 102% | 2145 0% | 2.2 100% | 2.45 90% | 2.14 103% | 2.25 98% |
| CCT | 6345 102% | 6235 104% | 6572 99% | 6548 99% | 6101 107% | 6596 99% | 7786 83% |
| Color Space (Percent of AdobeRGB 1998) (%) | 85.2 | 81 -5% | 78 -8% | 88 3% | 58.7 -31% | 84.8 0% | 88.5 4% |
| Color Space (Percent of sRGB) (%) | 99 | 99.6 1% | 100 1% | 92.8 -6% | 98.3 -1% | 100 1% | |
| Média Total (Programa/Configurações) | 32% /
14% | 2% /
12% | 6% /
13% | -10% /
-4% | -19% /
-20% | -4% /
1% |
* ... menor é melhor
Exibir tempos de resposta
| ↔ Tempo de resposta preto para branco | ||
|---|---|---|
| 30.4 ms ... ascensão ↗ e queda ↘ combinadas | ↗ 17.2 ms ascensão | 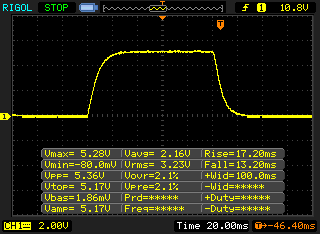 |
| ↘ 13.2 ms queda | ||
| A tela mostra taxas de resposta lentas em nossos testes e será insatisfatória para os jogadores. Em comparação, todos os dispositivos testados variam de 0.1 (mínimo) a 240 (máximo) ms. » 82 % de todos os dispositivos são melhores. Isso significa que o tempo de resposta medido é pior que a média de todos os dispositivos testados (19.9 ms). | ||
| ↔ Tempo de resposta 50% cinza a 80% cinza | ||
| 46.4 ms ... ascensão ↗ e queda ↘ combinadas | ↗ 22 ms ascensão | 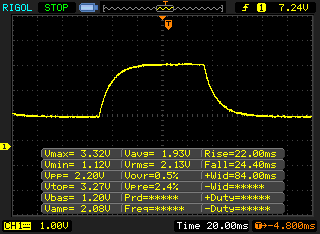 |
| ↘ 24.4 ms queda | ||
| A tela mostra taxas de resposta lentas em nossos testes e será insatisfatória para os jogadores. Em comparação, todos os dispositivos testados variam de 0.165 (mínimo) a 636 (máximo) ms. » 80 % de todos os dispositivos são melhores. Isso significa que o tempo de resposta medido é pior que a média de todos os dispositivos testados (31.1 ms). | ||
Cintilação da tela / PWM (modulação por largura de pulso)
| Tela tremeluzindo / PWM não detectado | 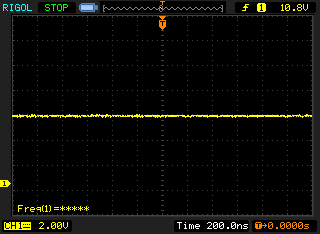 | ||
[pwm_comparison] Em comparação: 52 % de todos os dispositivos testados não usam PWM para escurecer a tela. Se PWM foi detectado, uma média de 7798 (mínimo: 5 - máximo: 343500) Hz foi medida. | |||
| PCMark 8 Home Score Accelerated v2 | 3417 pontos | |
| PCMark 8 Creative Score Accelerated v2 | 4836 pontos | |
| PCMark 8 Work Score Accelerated v2 | 4241 pontos | |
| PCMark 10 Score | 4535 pontos | |
Ajuda | ||

| 3DMark 11 Performance | 10546 pontos | |
| 3DMark Fire Strike Score | 6909 pontos | |
| 3DMark Fire Strike Extreme Score | 3425 pontos | |
| 3DMark Time Spy Score | 3080 pontos | |
Ajuda | ||
| baixo | média | alto | ultra | 4K | |
|---|---|---|---|---|---|
| The Witcher 3 (2015) | 160.2 | 102.6 | 55.4 | 29.9 | 19.6 |
| Dota 2 Reborn (2015) | 121 | 109 | 94 | 89 | 43.6 |
| Rise of the Tomb Raider (2016) | 154.9 | 102.8 | 57.8 | 47.3 | 20.2 |
| X-Plane 11.11 (2018) | 90 | 68 | 59.2 | ||
| GRID 2019 (2019) | 98.2 | 67.3 | 51.7 | 34.3 | 13.5 |
Barulho
| Ocioso |
| 28.5 / 28.5 / 28.5 dB |
| Carga |
| 36.3 / 36.3 dB |
 | ||
30 dB silencioso 40 dB(A) audível 50 dB(A) ruidosamente alto |
||
min: | ||
| Lenovo ThinkPad X1 Extreme 2019 20QV000WGE GeForce GTX 1650 Mobile, i7-9750H, Samsung SSD PM981 MZVLB512HAJQ | Dell XPS 15 7590 9980HK GTX 1650 GeForce GTX 1650 Mobile, i9-9980HK, Toshiba XG6 KXG60ZNV1T02 | Apple MacBook Pro 16 2019 i9 5500M Radeon Pro 5500M, i9-9880H, Apple SSD AP1024 7171 | Acer ConceptD 7 CN715-71-743N GeForce RTX 2060 Mobile, i7-9750H, WDC PC SN720 SDAPNTW-512G | Lenovo Yoga C940-15IRH GeForce GTX 1650 Max-Q, i7-9750H, Intel Optane Memory H10 with Solid State Storage 32GB + 512GB HBRPEKNX0202A(L/H) | MSI Prestige 15 A10SC GeForce GTX 1650 Max-Q, i7-10710U, Samsung SSD PM981 MZVLB1T0HALR | Lenovo ThinkPad X1 Extreme-20MF000XGE GeForce GTX 1050 Ti Max-Q, i7-8750H, Samsung SSD PM981 MZVLB1T0HALR | |
|---|---|---|---|---|---|---|---|
| Noise | -12% | -13% | -13% | -11% | -6% | -3% | |
| desligado / ambiente * (dB) | 28.5 | 28.2 1% | 29.8 -5% | 30.4 -7% | 28.7 -1% | 29.3 -3% | 28.8 -1% |
| Idle Minimum * (dB) | 28.5 | 28.2 1% | 29.9 -5% | 30.6 -7% | 28.7 -1% | 30.1 -6% | 28.8 -1% |
| Idle Average * (dB) | 28.5 | 28.2 1% | 29.9 -5% | 30.6 -7% | 28.8 -1% | 30.2 -6% | 28.8 -1% |
| Idle Maximum * (dB) | 28.5 | 30.4 -7% | 29.9 -5% | 30.6 -7% | 28.8 -1% | 30.2 -6% | 31.3 -10% |
| Load Average * (dB) | 36.3 | 43.8 -21% | 43 -18% | 44 -21% | 45 -24% | 31.5 13% | 36.4 -0% |
| Witcher 3 ultra * (dB) | 36.3 | 47.2 -30% | 45.4 -25% | 43.9 -21% | 44.7 -23% | 37 -2% | 36.4 -0% |
| Load Maximum * (dB) | 36.3 | 47.2 -30% | 46.1 -27% | 44.2 -22% | 44.7 -23% | 47 -29% | 39.2 -8% |
* ... menor é melhor
(-) A temperatura máxima no lado superior é 46.8 °C / 116 F, em comparação com a média de 36.8 °C / 98 F , variando de 21 a 71 °C para a classe Multimedia.
(-) A parte inferior aquece até um máximo de 52.4 °C / 126 F, em comparação com a média de 39.1 °C / 102 F
(+) Em uso inativo, a temperatura média para o lado superior é 24 °C / 75 F, em comparação com a média do dispositivo de 31.3 °C / ### class_avg_f### F.
(±) Jogando The Witcher 3, a temperatura média para o lado superior é 37.3 °C / 99 F, em comparação com a média do dispositivo de 31.3 °C / ## #class_avg_f### F.
(+) Os apoios para as mãos e o touchpad são mais frios que a temperatura da pele, com um máximo de 31.9 °C / 89.4 F e, portanto, são frios ao toque.
(-) A temperatura média da área do apoio para as mãos de dispositivos semelhantes foi 28.7 °C / 83.7 F (-3.2 °C / -5.7 F).
Lenovo ThinkPad X1 Extreme 2019 20QV000WGE análise de áudio
(±) | o volume do alto-falante é médio, mas bom (###valor### dB)
Graves 100 - 315Hz
(±) | graves reduzidos - em média 8.6% menor que a mediana
(±) | a linearidade dos graves é média (11.9% delta para a frequência anterior)
Médios 400 - 2.000 Hz
(±) | médios mais altos - em média 7.7% maior que a mediana
(±) | a linearidade dos médios é média (7.5% delta para frequência anterior)
Altos 2 - 16 kHz
(±) | máximos reduzidos - em média 6.1% menor que a mediana
(±) | a linearidade dos máximos é média (7.5% delta para frequência anterior)
Geral 100 - 16.000 Hz
(±) | a linearidade do som geral é média (24.2% diferença em relação à mediana)
Comparado com a mesma classe
» 85% de todos os dispositivos testados nesta classe foram melhores, 5% semelhantes, 9% piores
» O melhor teve um delta de 5%, a média foi 17%, o pior foi 45%
Comparado com todos os dispositivos testados
» 73% de todos os dispositivos testados foram melhores, 6% semelhantes, 21% piores
» O melhor teve um delta de 4%, a média foi 24%, o pior foi 134%
Dell XPS 15 7590 9980HK GTX 1650 análise de áudio
(+) | os alto-falantes podem tocar relativamente alto (###valor### dB)
Graves 100 - 315Hz
(-) | quase nenhum baixo - em média 24.9% menor que a mediana
(±) | a linearidade dos graves é média (14.4% delta para a frequência anterior)
Médios 400 - 2.000 Hz
(+) | médios equilibrados - apenas 2.8% longe da mediana
(±) | a linearidade dos médios é média (7.8% delta para frequência anterior)
Altos 2 - 16 kHz
(+) | agudos equilibrados - apenas 1.9% longe da mediana
(+) | os máximos são lineares (5.3% delta da frequência anterior)
Geral 100 - 16.000 Hz
(±) | a linearidade do som geral é média (17.8% diferença em relação à mediana)
Comparado com a mesma classe
» 52% de todos os dispositivos testados nesta classe foram melhores, 7% semelhantes, 41% piores
» O melhor teve um delta de 5%, a média foi 17%, o pior foi 45%
Comparado com todos os dispositivos testados
» 36% de todos os dispositivos testados foram melhores, 8% semelhantes, 56% piores
» O melhor teve um delta de 4%, a média foi 24%, o pior foi 134%
Apple MacBook Pro 16 2019 i9 5500M análise de áudio
(+) | os alto-falantes podem tocar relativamente alto (###valor### dB)
Graves 100 - 315Hz
(+) | bons graves - apenas 2.3% longe da mediana
(+) | o baixo é linear (5% delta para a frequência anterior)
Médios 400 - 2.000 Hz
(+) | médios equilibrados - apenas 2.7% longe da mediana
(+) | médios são lineares (3.4% delta para frequência anterior)
Altos 2 - 16 kHz
(+) | agudos equilibrados - apenas 2.1% longe da mediana
(+) | os máximos são lineares (2.6% delta da frequência anterior)
Geral 100 - 16.000 Hz
(+) | o som geral é linear (6.9% diferença em relação à mediana)
Comparado com a mesma classe
» 5% de todos os dispositivos testados nesta classe foram melhores, 1% semelhantes, 94% piores
» O melhor teve um delta de 5%, a média foi 17%, o pior foi 45%
Comparado com todos os dispositivos testados
» 1% de todos os dispositivos testados foram melhores, 0% semelhantes, 99% piores
» O melhor teve um delta de 4%, a média foi 24%, o pior foi 134%
| desligado | |
| Ocioso | |
| Carga |
|
Key:
min: | |
| Lenovo ThinkPad X1 Extreme 2019 20QV000WGE i7-9750H, GeForce GTX 1650 Mobile, Samsung SSD PM981 MZVLB512HAJQ, IPS, 3840x2160, 15.6" | Lenovo ThinkPad P1 2019-20QT000RGE i7-9850H, Quadro T1000 (Laptop), WDC PC SN720 SDAQNTW-512G, IPS LED, 1920x1080, 15.6" | Dell XPS 15 7590 9980HK GTX 1650 i9-9980HK, GeForce GTX 1650 Mobile, Toshiba XG6 KXG60ZNV1T02, OLED, 3840x2160, 15.6" | Apple MacBook Pro 16 2019 i9 5500M i9-9880H, Radeon Pro 5500M, Apple SSD AP1024 7171, IPS, 3072x1920, 16" | Acer ConceptD 7 CN715-71-743N i7-9750H, GeForce RTX 2060 Mobile, WDC PC SN720 SDAPNTW-512G, IPS, 3840x2160, 15.6" | Lenovo Yoga C940-15IRH i7-9750H, GeForce GTX 1650 Max-Q, Intel Optane Memory H10 with Solid State Storage 32GB + 512GB HBRPEKNX0202A(L/H), IPS, 1920x1080, 15.6" | MSI Prestige 15 A10SC i7-10710U, GeForce GTX 1650 Max-Q, Samsung SSD PM981 MZVLB1T0HALR, IPS, 3840x2160, 15.6" | Lenovo ThinkPad X1 Extreme-20MF000XGE i7-8750H, GeForce GTX 1050 Ti Max-Q, Samsung SSD PM981 MZVLB1T0HALR, IPS, 3840x2160, 15.6" | Média NVIDIA GeForce GTX 1650 Mobile | Média da turma Multimedia | |
|---|---|---|---|---|---|---|---|---|---|---|
| Power Consumption | -14% | 6% | 16% | -14% | 8% | 18% | 7% | 23% | 28% | |
| Idle Minimum * (Watt) | 8.5 | 13.7 -61% | 6.2 27% | 3.7 56% | 7.6 11% | 5.2 39% | 6.1 28% | 7.6 11% | 4.96 ? 42% | 5.71 ? 33% |
| Idle Average * (Watt) | 14.7 | 17.5 -19% | 9.6 35% | 12.1 18% | 13.6 7% | 10.7 27% | 13.2 10% | 14.8 -1% | 8.61 ? 41% | 10.1 ? 31% |
| Idle Maximum * (Watt) | 19.4 | 20.9 -8% | 21.2 -9% | 17 12% | 18.2 6% | 24.3 -25% | 19.2 1% | 17.6 9% | 14.8 ? 24% | 12.4 ? 36% |
| Load Average * (Watt) | 89.6 | 77.2 14% | 104.3 -16% | 91.5 -2% | 102 -14% | 84.4 6% | 75 16% | 86 4% | 81.7 ? 9% | 65 ? 27% |
| Witcher 3 ultra * (Watt) | 96.1 | 91.7 5% | 103 -7% | 144 -50% | 83.9 13% | 74 23% | 85 12% | |||
| Load Maximum * (Watt) | 129.8 | 123.7 5% | 135.3 -4% | 102.3 21% | 183 -41% | 142.8 -10% | 89.7 31% | 118.9 8% | 131.9 ? -2% | 112.2 ? 14% |
* ... menor é melhor
| Lenovo ThinkPad X1 Extreme 2019 20QV000WGE i7-9750H, GeForce GTX 1650 Mobile, 80 Wh | Dell XPS 15 7590 9980HK GTX 1650 i9-9980HK, GeForce GTX 1650 Mobile, 97 Wh | Apple MacBook Pro 16 2019 i9 5500M i9-9880H, Radeon Pro 5500M, 99.8 Wh | Acer ConceptD 7 CN715-71-743N i7-9750H, GeForce RTX 2060 Mobile, 84 Wh | Lenovo Yoga C940-15IRH i7-9750H, GeForce GTX 1650 Max-Q, 69 Wh | MSI Prestige 15 A10SC i7-10710U, GeForce GTX 1650 Max-Q, 82 Wh | Lenovo ThinkPad X1 Extreme-20MF000XGE i7-8750H, GeForce GTX 1050 Ti Max-Q, 80 Wh | Lenovo ThinkPad P1 2019-20QT000RGE i7-9850H, Quadro T1000 (Laptop), 80 Wh | Média da turma Multimedia | |
|---|---|---|---|---|---|---|---|---|---|
| Duração da bateria | 119% | 80% | 50% | 43% | 67% | 44% | 64% | 146% | |
| H.264 (h) | 4.7 | 9.7 106% | 6.5 38% | 6.2 32% | 9.3 98% | 16.4 ? 249% | |||
| WiFi v1.3 (h) | 4.8 | 7.8 63% | 12 150% | 8.6 79% | 9.7 102% | 7.6 58% | 6.4 33% | 8.9 85% | 12 ? 150% |
| Load (h) | 1.2 | 3.3 175% | 1 -17% | 1.6 33% | 1 -17% | 2.1 75% | 2 67% | 1.3 8% | 1.675 ? 40% |
| Reader / Idle (h) | 15.2 | 13.7 | 18.2 | 19.1 | 11.5 | 25.2 ? | |||
| Witcher 3 ultra (h) | 0.9 | 1.1 |
Pro
Contra
Veredicto - A Lenovo tornou o X1 Extreme pior
Em primeiro lugar, o ThinkPad X1 Extreme Gen 2 parece ser um excelente portátil multimídia. Combinar o chassi de seu antecessor com mais opções de telas e componentes mais rápidos deveria ser uma receita para o sucesso. No entanto, na prática, as mudanças nem sempre se mostraram positivas.
Começando com as coisas boas, o painel 4K mate oferece uma qualidade de imagem decente, embora seja somente após a calibração adicional. O X1 Extreme Gen 2 também possui alguns dos melhores dispositivos de entrada do mercado, embora haja alguns problemas dos quais nossa unidade de teste também sofre. O X1 Extreme Gen 2 também funciona mais silenciosamente sob carga.
No entanto, a partir de agora só temos más notícias. Temos a sensação de que a Lenovo simplesmente instalou novos componentes enquanto manteve a mesma solução de refrigeração. O processador mais recente sofre aqui por causa da placa gráfica mais rápida, embora o último também fique aquém das expectativas. O resultado é que o X1 Extreme Gen 2 tem uma CPU mais lenta que seu antecessor e apenas uma GPU minimamente mais rápida. Outro problema é o enorme consumo de energia do dispositivo, devido ao seu painel mate 4K, que gera durações de menos de 5 horas.
A segunda geração do ThinkPad X1 Extreme piorou em algumas áreas. Por exemplo, o desempenho da CPU está abaixo do seu antecessor, e sua GPU não pode alcançar seu potencial. Embora o painel 4K mate seja uma boa opção no que diz respeito à qualidade da imagem, ele precisa de calibração adicional e tem um impacto significativo na duração da bateria.
O desempenho da nossa unidade de teste certamente não é ruim por si só. Você não deveria ter problemas no uso diário, por exemplo. A competição simplesmente oferece mais, no entanto. Também recomendaríamos considerar a tela opcional de 500 nits de 1080p sobre a IPS 4K aqui, que oferece qualidade de imagem muito boa e consome significativamente menos energia.
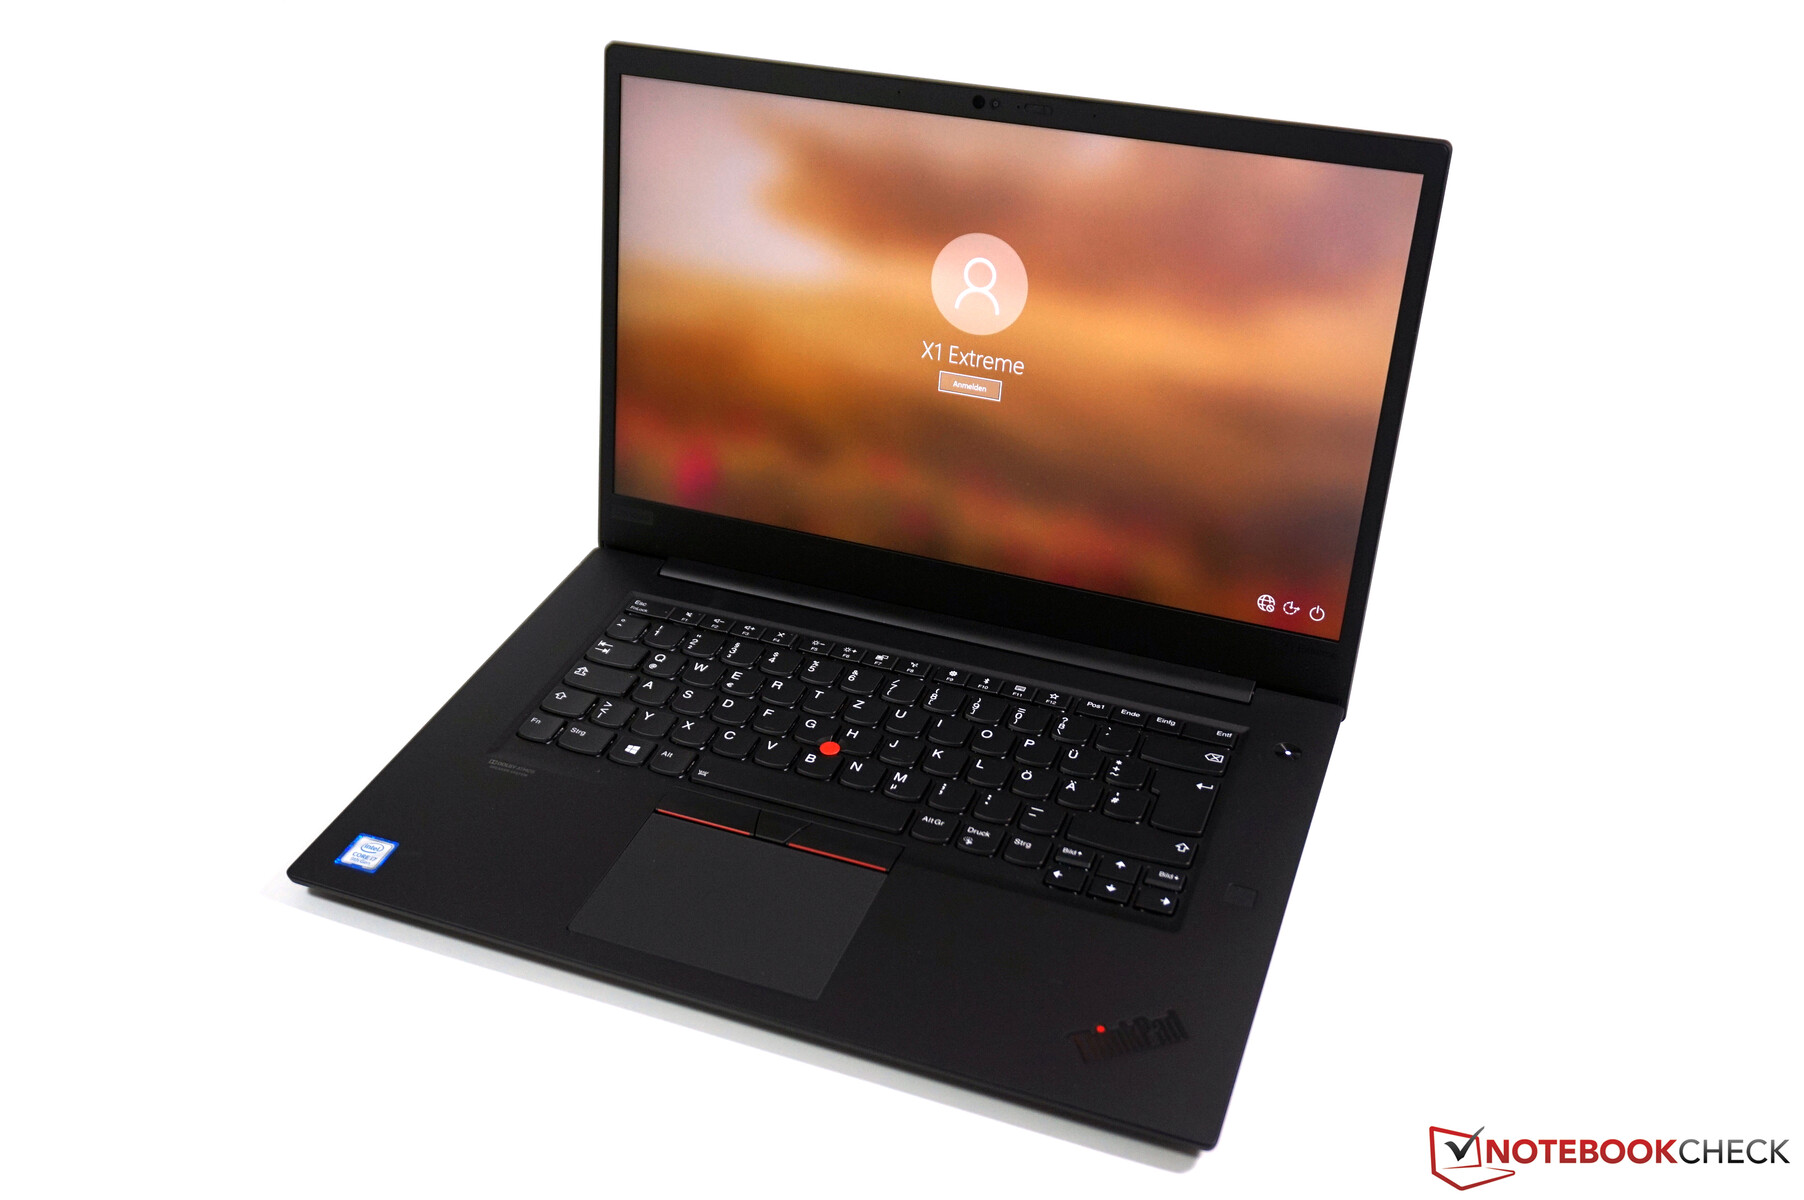
Lenovo ThinkPad X1 Extreme 2019 20QV000WGE
- 02/13/2020 v7 (old)
Andreas Osthoff
Price comparison
