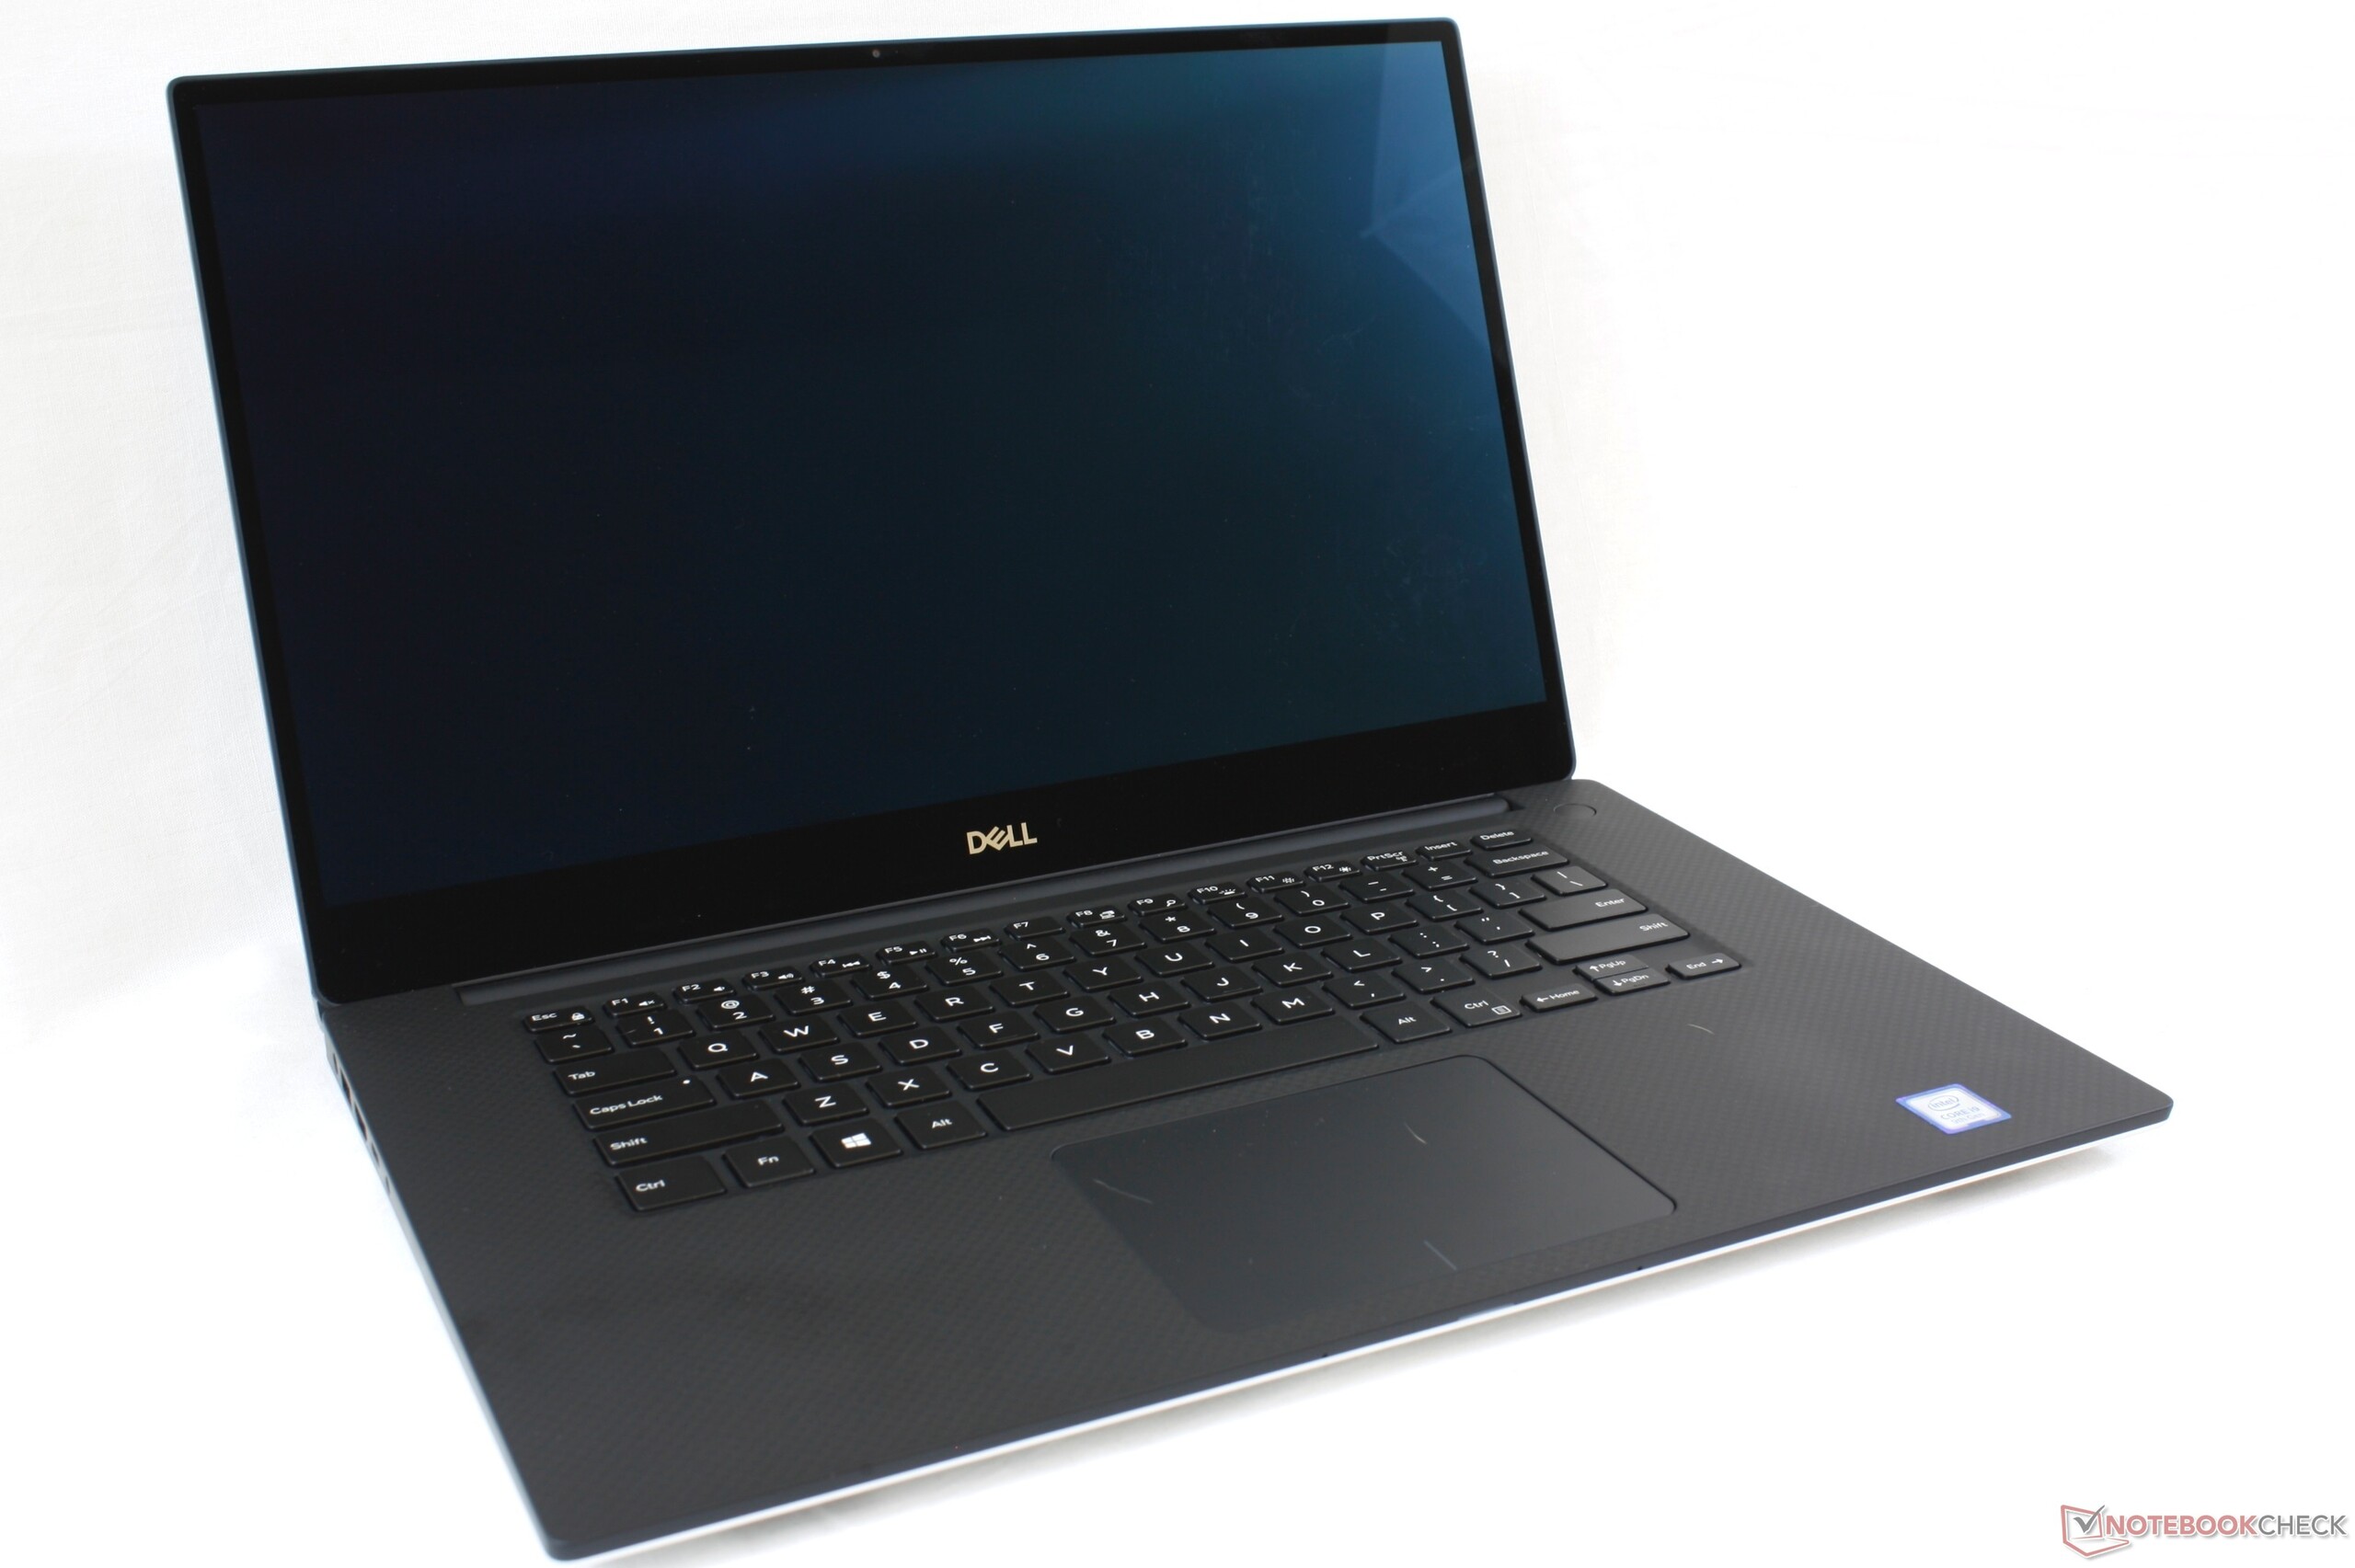
Poder Esmagador: Breve Análise do Portátil Dell XPS 15 7590 Core i9 e GeForce GTX 1650 OLED
| SD Card Reader | |
| average JPG Copy Test (av. of 3 runs) | |
| Gigabyte Aero 15 OLED XA (Toshiba Exceria Pro SDXC 64 GB UHS-II) | |
| Dell XPS 15 9570 Core i9 UHD (Toshiba Exceria Pro SDXC 64 GB UHS-II) | |
| Dell XPS 15 7590 9980HK GTX 1650 (Toshiba Exceria Pro SDXC 64 GB UHS-II) | |
| HP Spectre x360 15-df0126ng (Toshiba Exceria Pro M501 microSDXC 64GB) | |
| Asus ZenBook 15 UX533FD (Toshiba Exceria Pro SDXC 64 GB UHS-II) | |
| maximum AS SSD Seq Read Test (1GB) | |
| Gigabyte Aero 15 OLED XA (Toshiba Exceria Pro SDXC 64 GB UHS-II) | |
| Dell XPS 15 9570 Core i9 UHD (Toshiba Exceria Pro SDXC 64 GB UHS-II) | |
| HP Spectre x360 15-df0126ng (Toshiba Exceria Pro M501 microSDXC 64GB) | |
| Dell XPS 15 7590 9980HK GTX 1650 (Toshiba Exceria Pro SDXC 64 GB UHS-II) | |
| Asus ZenBook 15 UX533FD (Toshiba Exceria Pro SDXC 64 GB UHS-II) | |
| |||||||||||||||||||||||||
iluminação: 94 %
iluminação com acumulador: 418.4 cd/m²
Contraste: ∞:1 (Preto: 0 cd/m²)
ΔE ColorChecker Calman: 6.06 | ∀{0.5-29.43 Ø4.72}
ΔE Greyscale Calman: 2.8 | ∀{0.09-98 Ø4.97}
99.6% sRGB (Argyll 1.6.3 3D)
81% AdobeRGB 1998 (Argyll 1.6.3 3D)
91.8% AdobeRGB 1998 (Argyll 3D)
99.6% sRGB (Argyll 3D)
88.1% Display P3 (Argyll 3D)
Gamma: 2.15
CCT: 6235 K
| Dell XPS 15 7590 9980HK GTX 1650 Samsung 156WR04, SDCA029, OLED, 15.6", 3840x2160 | Dell XPS 15 9570 Core i9 UHD LQ156D1, IPS, 15.6", 3840x2160 | Asus ZenBook 15 UX533FD BOE07D8, IPS, 15.6", 1920x1080 | HP Spectre x360 15-df0126ng AU Optronics AUO30EB, IPS, 15.6", 3840x2160 | Gigabyte Aero 15 OLED XA Samsung SDCA029, OLED, 15.6", 3840x2160 | Razer Blade 15 RTX 2080 Max-Q Sharp LQ156M1JW03 (SHP14C5), IPS, 15.6", 1920x1080 | |
|---|---|---|---|---|---|---|
| Display | -8% | -22% | -18% | -17% | ||
| Display P3 Coverage (%) | 88.1 | 79.6 -10% | 67.2 -24% | 68.1 -23% | 66.9 -24% | |
| sRGB Coverage (%) | 99.6 | 98.4 -1% | 88.4 -11% | 94.2 -5% | 98.1 -2% | |
| AdobeRGB 1998 Coverage (%) | 91.8 | 79.7 -13% | 64.6 -30% | 68.4 -25% | 68.5 -25% | |
| Response Times | -1698% | -1650% | -1785% | 2% | -395% | |
| Response Time Grey 50% / Grey 80% * (ms) | 2.3 ? | 52.4 ? -2178% | 45 ? -1857% | 57 ? -2378% | 2.4 ? -4% | 12.8 ? -457% |
| Response Time Black / White * (ms) | 2.4 ? | 31.6 ? -1217% | 37 ? -1442% | 31 ? -1192% | 2.2 ? 8% | 10.4 ? -333% |
| PWM Frequency (Hz) | 59.5 ? | 1000 ? | 60 ? | 23810 ? | ||
| Screen | -28% | -18% | -9% | 7% | 8% | |
| Brightness middle (cd/m²) | 421.2 | 451.9 7% | 311 -26% | 330 -22% | 373 -11% | 293 -30% |
| Brightness (cd/m²) | 417 | 414 -1% | 303 -27% | 310 -26% | 375 -10% | 270 -35% |
| Brightness Distribution (%) | 94 | 81 -14% | 81 -14% | 87 -7% | 93 -1% | 87 -7% |
| Black Level * (cd/m²) | 0.36 | 0.24 | 0.37 | 0.29 | ||
| Colorchecker dE 2000 * | 6.06 | 5.62 7% | 5.1 16% | 4.03 33% | 3.98 34% | 1.69 72% |
| Colorchecker dE 2000 max. * | 11.89 | 19.1 -61% | 8.91 25% | 6.74 43% | 6.28 47% | 3.37 72% |
| Greyscale dE 2000 * | 2.8 | 6.9 -146% | 4.93 -76% | 4.49 -60% | 2.81 -0% | 2.3 18% |
| Gamma | 2.15 102% | 2.2 100% | 2.44 90% | 2.57 86% | 2.62 84% | 2.3 96% |
| CCT | 6235 104% | 6254 104% | 7641 85% | 6744 96% | 6434 101% | 6758 96% |
| Color Space (Percent of AdobeRGB 1998) (%) | 81 | 71.8 -11% | 58 -28% | 61 -25% | 78 -4% | 63 -22% |
| Color Space (Percent of sRGB) (%) | 99.6 | 98.5 -1% | 88 -12% | 94 -6% | 97 -3% | 98.5 -1% |
| Contrast (:1) | 1255 | 1296 | 892 | 1010 | ||
| Colorchecker dE 2000 calibrated * | 2.69 | 2.48 | 1.96 | 1.24 | ||
| Média Total (Programa/Configurações) | -578% /
-280% | -563% /
-270% | -604% /
-284% | 5% /
6% | -135% /
-60% |
* ... menor é melhor
Exibir tempos de resposta
| ↔ Tempo de resposta preto para branco | ||
|---|---|---|
| 2.4 ms ... ascensão ↗ e queda ↘ combinadas | ↗ 1.1 ms ascensão | 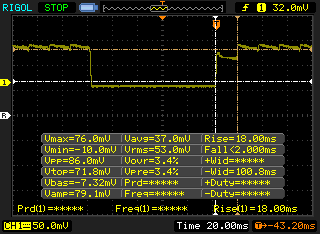 |
| ↘ 1.3 ms queda | ||
| A tela mostra taxas de resposta muito rápidas em nossos testes e deve ser muito adequada para jogos em ritmo acelerado. Em comparação, todos os dispositivos testados variam de 0.1 (mínimo) a 240 (máximo) ms. » 13 % de todos os dispositivos são melhores. Isso significa que o tempo de resposta medido é melhor que a média de todos os dispositivos testados (19.8 ms). | ||
| ↔ Tempo de resposta 50% cinza a 80% cinza | ||
| 2.3 ms ... ascensão ↗ e queda ↘ combinadas | ↗ 1.1 ms ascensão | 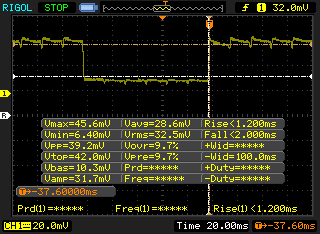 |
| ↘ 1.2 ms queda | ||
| A tela mostra taxas de resposta muito rápidas em nossos testes e deve ser muito adequada para jogos em ritmo acelerado. Em comparação, todos os dispositivos testados variam de 0.165 (mínimo) a 636 (máximo) ms. » 11 % de todos os dispositivos são melhores. Isso significa que o tempo de resposta medido é melhor que a média de todos os dispositivos testados (31 ms). | ||
Cintilação da tela / PWM (modulação por largura de pulso)
| Tela tremeluzindo/PWM detectado | 59.5 Hz | ≤ 100 % configuração de brilho | 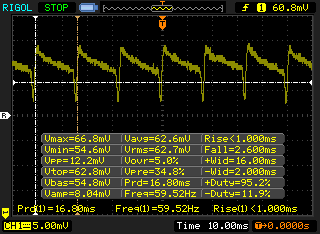 |
A luz de fundo da tela pisca em 59.5 Hz (pior caso, por exemplo, utilizando PWM) Cintilação detectada em uma configuração de brilho de 100 % e abaixo. Não deve haver cintilação ou PWM acima desta configuração de brilho. A frequência de 59.5 Hz é muito baixa, portanto a oscilação pode causar fadiga ocular e dores de cabeça após uso prolongado. [pwm_comparison] Em comparação: 52 % de todos os dispositivos testados não usam PWM para escurecer a tela. Se PWM foi detectado, uma média de 7747 (mínimo: 5 - máximo: 343500) Hz foi medida. | |||
| wPrime 2.10 - 1024m | |
| Asus ROG Zephyrus G15 GA502DU | |
| Eurocom Sky X4C | |
| Média Intel Core i9-9980HK (110.4 - 120.2, n=2) | |
* ... menor é melhor
| PCMark 8 Home Score Accelerated v2 | 3799 pontos | |
| PCMark 8 Work Score Accelerated v2 | 4762 pontos | |
| PCMark 10 Score | 5469 pontos | |
Ajuda | ||
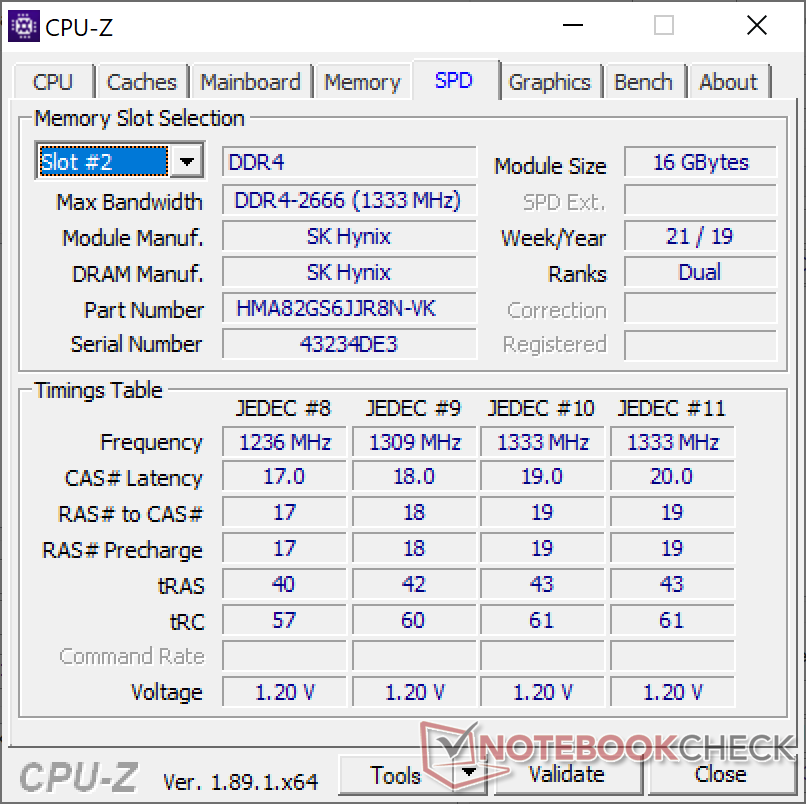
| Dell XPS 15 7590 9980HK GTX 1650 Toshiba XG6 KXG60ZNV1T02 | Dell XPS 15 9570 Core i9 UHD Samsung SSD PM981 MZVLB1T0HALR | Asus ZenBook 15 UX533FD WDC PC SN520 SDAPNUW-512G | HP Spectre x360 15-df0126ng Toshiba XG5-P KXG50PNV2T04 | Gigabyte Aero 15 OLED XA Intel SSD 600p SSDPEKKW512G8L | |
|---|---|---|---|---|---|
| AS SSD | -4% | -22% | -45% | -4% | |
| Seq Read (MB/s) | 1723 | 1320 -23% | 579 -66% | 2018 17% | 2095 22% |
| Seq Write (MB/s) | 1386 | 1500 8% | 411.8 -70% | 773 -44% | 1464 6% |
| 4K Read (MB/s) | 43.25 | 30.73 -29% | 41.81 -3% | 24.62 -43% | 56.8 31% |
| 4K Write (MB/s) | 98.3 | 94.4 -4% | 131.6 34% | 92.8 -6% | 109.8 12% |
| 4K-64 Read (MB/s) | 1078 | 1453 35% | 975 -10% | 845 -22% | 871 -19% |
| 4K-64 Write (MB/s) | 1456 | 1815 25% | 1047 -28% | 957 -34% | 773 -47% |
| Access Time Read * (ms) | 0.05 | 0.061 -22% | 0.08 -60% | 0.147 -194% | 0.045 10% |
| Access Time Write * (ms) | 0.039 | 0.044 -13% | 0.027 31% | 0.057 -46% | 0.033 15% |
| Score Read (Points) | 1294 | 1616 25% | 1075 -17% | 1071 -17% | 1137 -12% |
| Score Write (Points) | 1693 | 2059 22% | 1220 -28% | 1127 -33% | 1029 -39% |
| Score Total (Points) | 3638 | 4507 24% | 2845 -22% | 2684 -26% | 2732 -25% |
| Copy ISO MB/s (MB/s) | 3182 | 2577 -19% | 1652 -48% | ||
| Copy Program MB/s (MB/s) | 984 | 515 -48% | 328.5 -67% | ||
| Copy Game MB/s (MB/s) | 1824 | 1120 -39% | 700 -62% |
* ... menor é melhor

| 3DMark 11 Performance | 12340 pontos | |
| 3DMark Cloud Gate Standard Score | 30573 pontos | |
| 3DMark Fire Strike Score | 7356 pontos | |
| 3DMark Time Spy Score | 3676 pontos | |
Ajuda | ||
| Shadow of the Tomb Raider - 1920x1080 Highest Preset AA:T | |
| Alienware Area-51m i9-9900K RTX 2080 | |
| MSI GE75 9SG | |
| Razer Blade Pro 17 RTX 2060 | |
| Gigabyte Aero 15 OLED XA | |
| HP Pavilion Gaming 17-cd0085cl | |
| MSI GF75 Thin 9SC | |
| Média NVIDIA GeForce GTX 1650 Mobile (34 - 47, n=15) | |
| Asus Zephyrus S GX531GM | |
| Asus G752VY | |
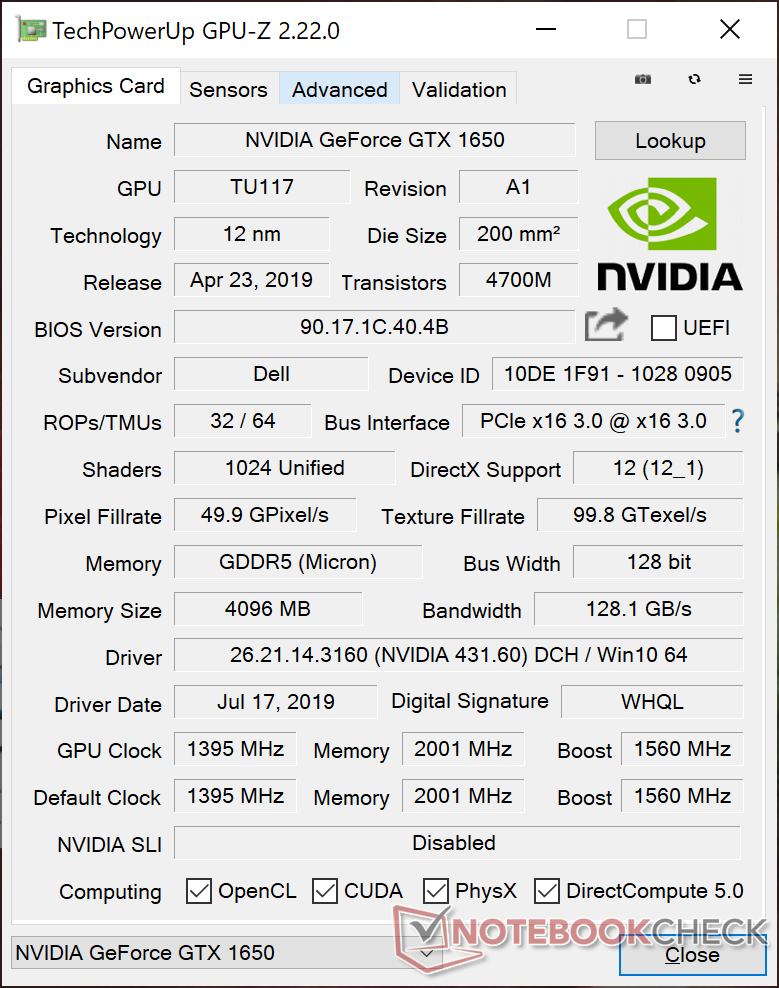
| Dell XPS 15 7590 9980HK GTX 1650 | |
| Asus TUF FX705GE-EW096T | |
| Rocket League - 1920x1080 High Quality AA:High FX | |
| Média NVIDIA GeForce GTX 1650 Mobile (96.4 - 162.2, n=6) | |
| HP Spectre x360 15-df0126ng | |
| Asus GL703GE-ES73 | |
| Dell XPS 15 7590 9980HK GTX 1650 | |
| baixo | média | alto | ultra | 4K | |
|---|---|---|---|---|---|
| BioShock Infinite (2013) | 342.5 | 223.4 | 171.8 | 68.5 | |
| The Witcher 3 (2015) | 183.5 | 111.5 | 64.8 | 36 | |
| Rocket League (2017) | 248 | 152.5 | 96.4 | 41.1 | |
| Shadow of the Tomb Raider (2018) | 111 | 42 | 38 | 34 | 14 |
| Dell XPS 15 7590 9980HK GTX 1650 GeForce GTX 1650 Mobile, i9-9980HK, Toshiba XG6 KXG60ZNV1T02 | Dell XPS 15 9570 Core i9 UHD GeForce GTX 1050 Ti Max-Q, i9-8950HK, Samsung SSD PM981 MZVLB1T0HALR | Asus ZenBook 15 UX533FD GeForce GTX 1050 Max-Q, i7-8565U, WDC PC SN520 SDAPNUW-512G | HP Spectre x360 15-df0126ng GeForce GTX 1050 Ti Max-Q, i7-8750H, Toshiba XG5-P KXG50PNV2T04 | Gigabyte Aero 15 OLED XA GeForce RTX 2070 Max-Q, i7-9750H, Intel SSD 600p SSDPEKKW512G8L | Razer Blade 15 RTX 2080 Max-Q GeForce RTX 2080 Max-Q, i7-9750H, Samsung SSD PM981 MZVLB512HAJQ | |
|---|---|---|---|---|---|---|
| Noise | 3% | -1% | -1% | -17% | 5% | |
| desligado / ambiente * (dB) | 28.2 | 28.2 -0% | 30.5 -8% | 30.4 -8% | 30 -6% | 28.3 -0% |
| Idle Minimum * (dB) | 28.2 | 28.5 -1% | 30.5 -8% | 30.4 -8% | 34 -21% | 28.8 -2% |
| Idle Average * (dB) | 28.2 | 28.6 -1% | 30.5 -8% | 30.4 -8% | 35 -24% | 28.8 -2% |
| Idle Maximum * (dB) | 30.4 | 28.8 5% | 30.5 -0% | 31.6 -4% | 45 -48% | 29 5% |
| Load Average * (dB) | 43.8 | 36.2 17% | 40.8 7% | 43.2 1% | 43 2% | 33.5 24% |
| Witcher 3 ultra * (dB) | 47.2 | 47.6 -1% | 52 -10% | 45 5% | ||
| Load Maximum * (dB) | 47.2 | 47.6 -1% | 41.8 11% | 38.3 19% | 54 -14% | 45.2 4% |
* ... menor é melhor
Barulho
| Ocioso |
| 28.2 / 28.2 / 30.4 dB |
| Carga |
| 43.8 / 47.2 dB |
 | ||
30 dB silencioso 40 dB(A) audível 50 dB(A) ruidosamente alto |
||
min: | ||
(-) A temperatura máxima no lado superior é 50.4 °C / 123 F, em comparação com a média de 36.8 °C / 98 F , variando de 21 a 71 °C para a classe Multimedia.
(-) A parte inferior aquece até um máximo de 49.2 °C / 121 F, em comparação com a média de 39.1 °C / 102 F
(+) Em uso inativo, a temperatura média para o lado superior é 30.9 °C / 88 F, em comparação com a média do dispositivo de 31.3 °C / ### class_avg_f### F.
(-) Jogando The Witcher 3, a temperatura média para o lado superior é 39.4 °C / 103 F, em comparação com a média do dispositivo de 31.3 °C / ## #class_avg_f### F.
(+) Os apoios para as mãos e o touchpad são mais frios que a temperatura da pele, com um máximo de 31.8 °C / 89.2 F e, portanto, são frios ao toque.
(-) A temperatura média da área do apoio para as mãos de dispositivos semelhantes foi 28.7 °C / 83.7 F (-3.1 °C / -5.5 F).
Dell XPS 15 7590 9980HK GTX 1650 análise de áudio
(+) | os alto-falantes podem tocar relativamente alto (###valor### dB)
Graves 100 - 315Hz
(-) | quase nenhum baixo - em média 24.9% menor que a mediana
(±) | a linearidade dos graves é média (14.4% delta para a frequência anterior)
Médios 400 - 2.000 Hz
(+) | médios equilibrados - apenas 2.8% longe da mediana
(±) | a linearidade dos médios é média (7.8% delta para frequência anterior)
Altos 2 - 16 kHz
(+) | agudos equilibrados - apenas 1.9% longe da mediana
(+) | os máximos são lineares (5.3% delta da frequência anterior)
Geral 100 - 16.000 Hz
(±) | a linearidade do som geral é média (17.8% diferença em relação à mediana)
Comparado com a mesma classe
» 52% de todos os dispositivos testados nesta classe foram melhores, 7% semelhantes, 41% piores
» O melhor teve um delta de 5%, a média foi 17%, o pior foi 45%
Comparado com todos os dispositivos testados
» 36% de todos os dispositivos testados foram melhores, 8% semelhantes, 56% piores
» O melhor teve um delta de 4%, a média foi 23%, o pior foi 134%
Apple MacBook 12 (Early 2016) 1.1 GHz análise de áudio
(+) | os alto-falantes podem tocar relativamente alto (###valor### dB)
Graves 100 - 315Hz
(±) | graves reduzidos - em média 11.3% menor que a mediana
(±) | a linearidade dos graves é média (14.2% delta para a frequência anterior)
Médios 400 - 2.000 Hz
(+) | médios equilibrados - apenas 2.4% longe da mediana
(+) | médios são lineares (5.5% delta para frequência anterior)
Altos 2 - 16 kHz
(+) | agudos equilibrados - apenas 2% longe da mediana
(+) | os máximos são lineares (4.5% delta da frequência anterior)
Geral 100 - 16.000 Hz
(+) | o som geral é linear (10.2% diferença em relação à mediana)
Comparado com a mesma classe
» 7% de todos os dispositivos testados nesta classe foram melhores, 2% semelhantes, 90% piores
» O melhor teve um delta de 5%, a média foi 18%, o pior foi 53%
Comparado com todos os dispositivos testados
» 5% de todos os dispositivos testados foram melhores, 1% semelhantes, 94% piores
» O melhor teve um delta de 4%, a média foi 23%, o pior foi 134%
| desligado | |
| Ocioso | |
| Carga |
|
Key:
min: | |
| Dell XPS 15 7590 9980HK GTX 1650 i9-9980HK, GeForce GTX 1650 Mobile, Toshiba XG6 KXG60ZNV1T02, OLED, 3840x2160, 15.6" | Dell XPS 15 9570 Core i9 UHD i9-8950HK, GeForce GTX 1050 Ti Max-Q, Samsung SSD PM981 MZVLB1T0HALR, IPS, 3840x2160, 15.6" | Asus ZenBook 15 UX533FD i7-8565U, GeForce GTX 1050 Max-Q, WDC PC SN520 SDAPNUW-512G, IPS, 1920x1080, 15.6" | HP Spectre x360 15-df0126ng i7-8750H, GeForce GTX 1050 Ti Max-Q, Toshiba XG5-P KXG50PNV2T04, IPS, 3840x2160, 15.6" | Gigabyte Aero 15 OLED XA i7-9750H, GeForce RTX 2070 Max-Q, Intel SSD 600p SSDPEKKW512G8L, OLED, 3840x2160, 15.6" | Razer Blade 15 RTX 2080 Max-Q i7-9750H, GeForce RTX 2080 Max-Q, Samsung SSD PM981 MZVLB512HAJQ, IPS, 1920x1080, 15.6" | MSI GF75 Thin 9SC i7-9750H, GeForce GTX 1650 Mobile, Crucial P1 SSD CT1000P1SSD8, IPS, 1920x1080, 17.3" | |
|---|---|---|---|---|---|---|---|
| Power Consumption | -6% | 37% | 34% | -101% | -46% | -13% | |
| Idle Minimum * (Watt) | 6.2 | 7.1 -15% | 2.7 56% | 2.1 66% | 23 -271% | 12.5 -102% | 6.1 2% |
| Idle Average * (Watt) | 9.6 | 13.6 -42% | 8 17% | 6.7 30% | 25 -160% | 15.3 -59% | 11.2 -17% |
| Idle Maximum * (Watt) | 21.2 | 14.1 33% | 10.6 50% | 11.4 46% | 33 -56% | 20.7 2% | 24.5 -16% |
| Load Average * (Watt) | 104.3 | 103.9 -0% | 74 29% | 77.7 26% | 96 8% | 90.2 14% | 94.7 9% |
| Witcher 3 ultra * (Watt) | 91.7 | 103 -12% | 168 -83% | 162 -77% | 105.8 -15% | ||
| Load Maximum * (Watt) | 135.3 | 130.9 3% | 89 34% | 131.5 3% | 197 -46% | 209.3 -55% | 192.2 -42% |
* ... menor é melhor
| Dell XPS 15 7590 9980HK GTX 1650 i9-9980HK, GeForce GTX 1650 Mobile, 97 Wh | Dell XPS 15 9570 Core i9 UHD i9-8950HK, GeForce GTX 1050 Ti Max-Q, 97 Wh | Asus ZenBook 15 UX533FD i7-8565U, GeForce GTX 1050 Max-Q, 73 Wh | HP Spectre x360 15-df0126ng i7-8750H, GeForce GTX 1050 Ti Max-Q, 84 Wh | Gigabyte Aero 15 OLED XA i7-9750H, GeForce RTX 2070 Max-Q, 94.24 Wh | Razer Blade 15 RTX 2080 Max-Q i7-9750H, GeForce RTX 2080 Max-Q, 80 Wh | MSI GF75 Thin 9SC i7-9750H, GeForce GTX 1650 Mobile, 51 Wh | |
|---|---|---|---|---|---|---|---|
| Duração da bateria | -20% | 25% | 2% | -29% | -19% | -40% | |
| Reader / Idle (h) | 15.2 | 15 -1% | 26.5 74% | 18.8 24% | 9.9 -35% | 15.9 5% | |
| WiFi v1.3 (h) | 7.8 | 8.6 10% | 8.7 12% | 8.8 13% | 5.7 -27% | 6.6 -15% | 4.7 -40% |
| Load (h) | 3.3 | 1 -70% | 2.9 -12% | 2.3 -30% | 2.5 -24% | 1.7 -48% |
Pro
Contra
O XPS 15 7590 com Core i9-9980HK e GTX 1650 é a iteração mais rápida do XPS 15 até agora - como deveria ser. Por outro lado, é também a iteração mais lenta do i9-9980HK e GTX 1650 que testamos em um portátil até agora. Há uma razão pela qual você não vê muitos Ultrabooks com CPUs Core i9 e GPUs GeForce GTX desbloqueados. Injetar tanto desempenho em um chassi desse tamanho limitará todo o potencial dos processadores, pois eles ficarão à mercê da solução de resfriamento. Sabemos que tanto o Core i9 quanto a GTX 1650 no XPS 15 são capazes de se desempenhar muito mais rápido com base no que registramos de outros portáteis maiores com as mesmas opções de CPU e GPU.
Os dados fazem sentido quando você analisa o histórico do atual design do XPS 15. Seu chassi foi desenvolvido há quase cinco anos durante os dias do Intel Skylake antes do Core i9 existir. Os processadores Core i9 são notáveis por suas altas velocidades de Turbo Boost, que só podem ser aproveitadas com uma solução de resfriamento adequada. Se você não conseguir manter as altas velocidades do Turbo Boost, o desempenho geral não será muito melhor do que um Core i7 comum. Esses novos processadores estão extrapolando os limites do que o antigo chassi XPS 15 é capaz de fazer.
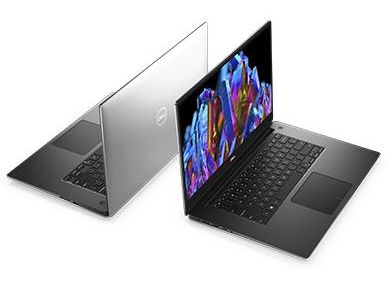
Apesar dos fracos resultados de desempenho da CPU e da GeForce GTX, o XPS 15 continua sendo um dos Ultrabooks mais reconhecidos no mercado. É surpreendente que o design visual tenha envelhecido tão bem em termos de qualidade de construção e estética, mesmo diante dos mais novos Ultrabooks de 15,6 polegadas. Para um melhor desempenho por dólar e uma máquina mais balanceada, no entanto, recomendamos os SKUs Core i7 ou Core i5 do XPS 15 7590.
A configuração do Core i9-9980HK e GTX 1650 é mais rápida do que a configuração do Core i9-8950H e GTX 1050 Ti Max-Q do ano passado, mas os deltas são menores e não tão amplos quanto poderiam ter sido. Essas opções de Core i9 desbloqueadas não funcionam tão bem para a iteração atual do chassi do XPS 15. A característica mais atraente da série 7590 não é a atualização da CPU ou GPU, mas a introdução de uma opção OLED.
Dell XPS 15 7590 9980HK GTX 1650
- 08/31/2022 v7 (old)
Allen Ngo
Price comparison
