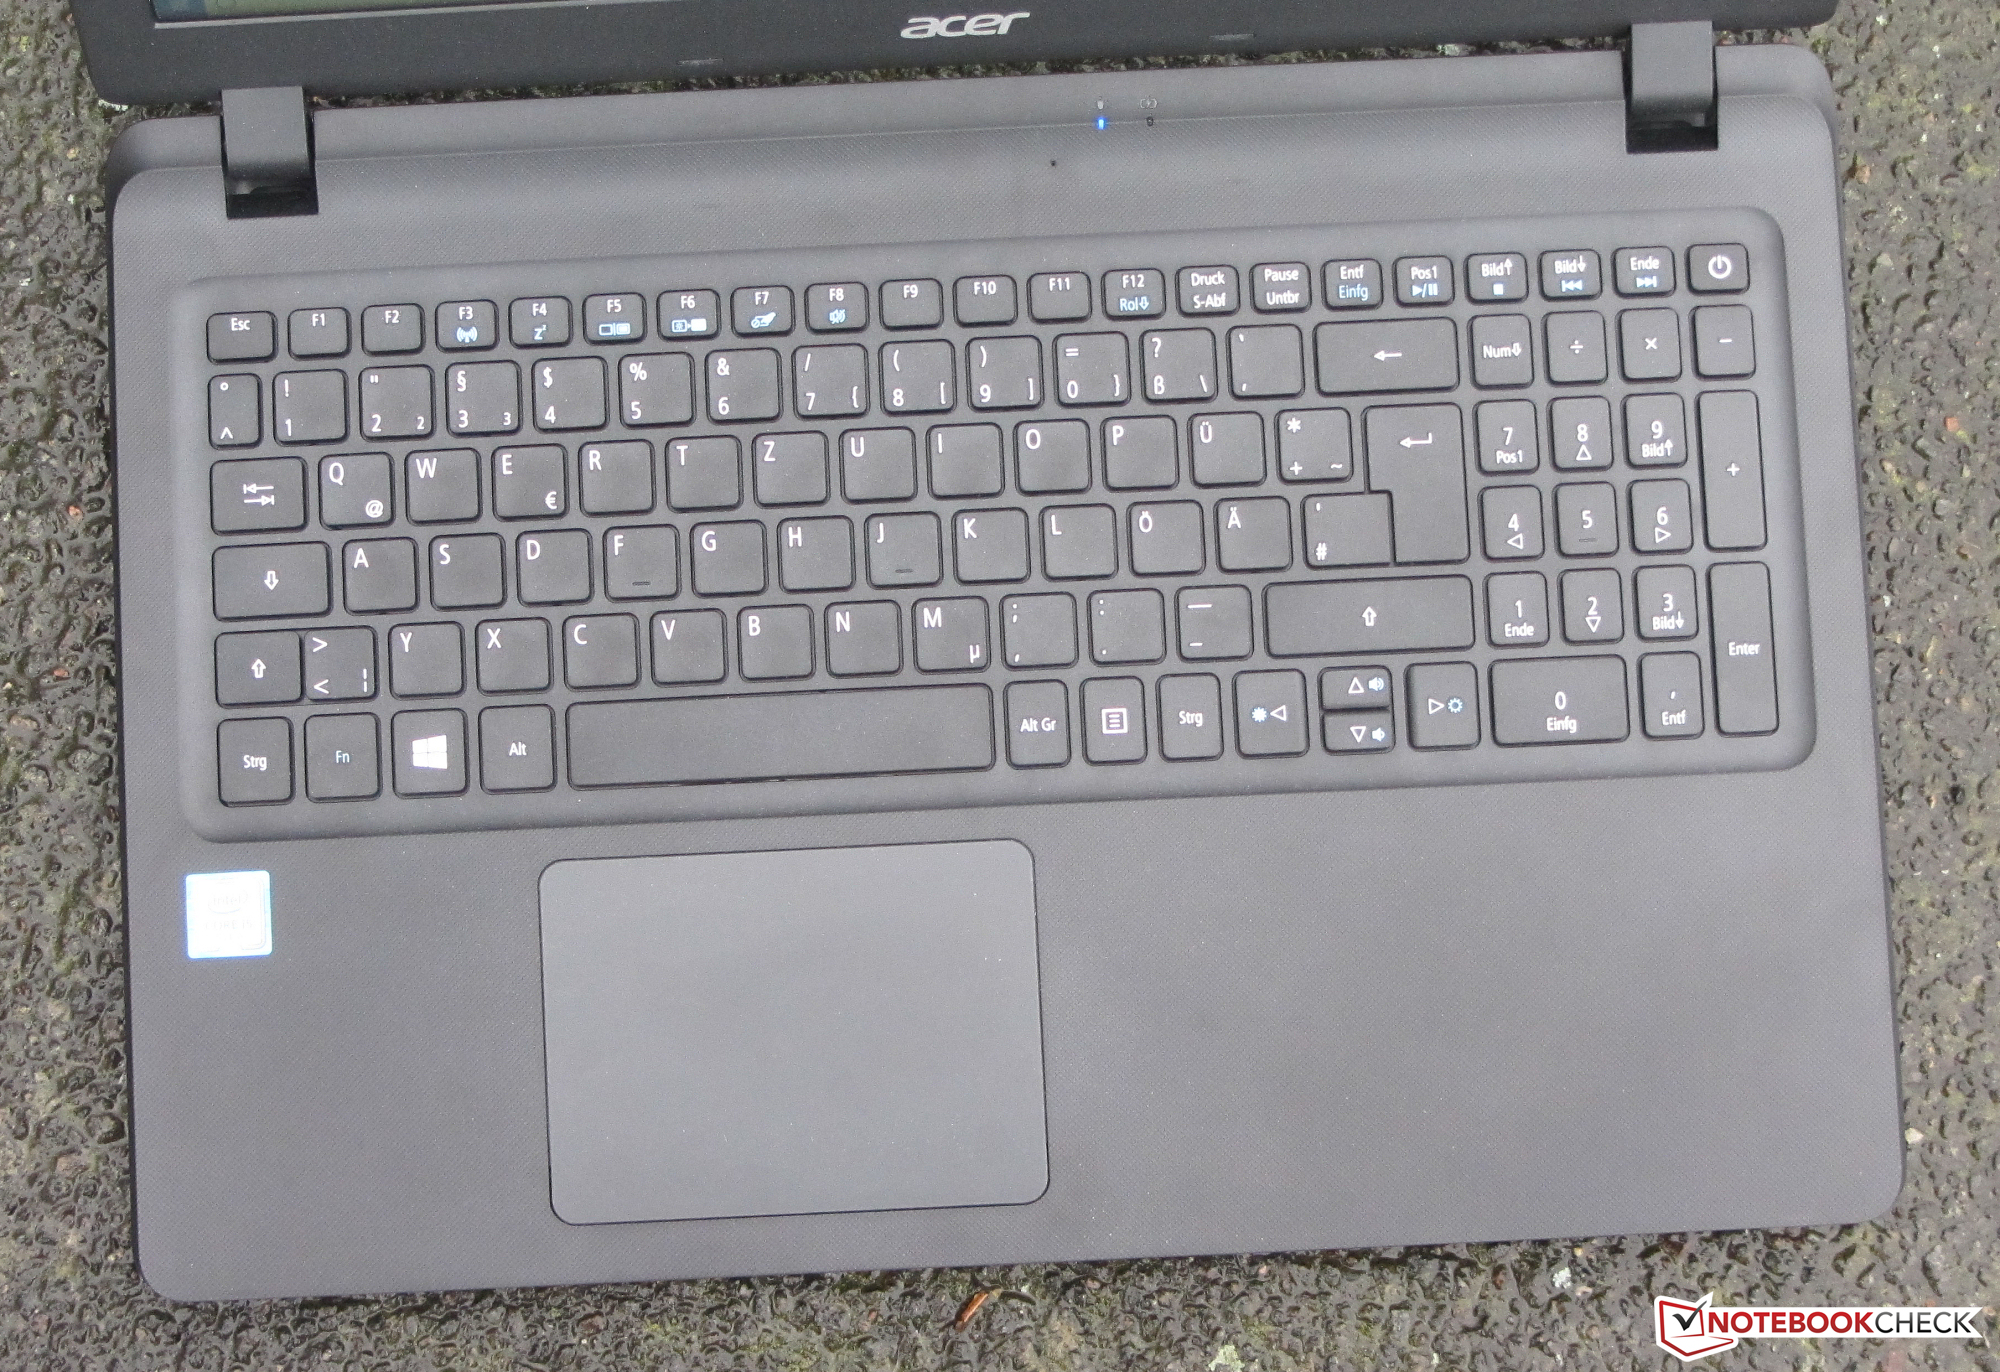
Breve Análise do Portátil Acer Extensa 2540 (i5-7200U, FHD)
| SD Card Reader | |
| average JPG Copy Test (av. of 3 runs) | |
| Asus ASUSPRO P541UA-GQ1532 (Toshiba Exceria Pro SDXC 64 GB UHS-II) | |
| Acer Aspire 3 A315-21-651Y (Toshiba Exceria Pro SDXC 64 GB UHS-II) | |
| Asus VivoBook S15 S510UA (Toshiba Exceria Pro SDXC 64 GB UHS-II) | |
| HP 15-ba077ng (Toshiba Exceria Pro SDXC 64 GB UHS-II) | |
| Lenovo Ideapad 110-15ACL 80TJ00H0GE (Toshiba Exceria Pro SDXC 64 GB UHS-II) | |
| Lenovo IdeaPad V110-15IKB 80TH001SGE (Toshiba Exceria Pro SDXC 64 GB UHS-II) | |
| Acer Extensa 2540-580K (Toshiba Exceria Pro SDXC 64 GB UHS-II) | |
| HP 15-ay116ng (Toshiba Exceria Pro SDXC 64 GB UHS-II) | |
| maximum AS SSD Seq Read Test (1GB) | |
| Acer Aspire 3 A315-21-651Y (Toshiba Exceria Pro SDXC 64 GB UHS-II) | |
| Lenovo Ideapad 110-15ACL 80TJ00H0GE (Toshiba Exceria Pro SDXC 64 GB UHS-II) | |
| HP 15-ba077ng (Toshiba Exceria Pro SDXC 64 GB UHS-II) | |
| Asus VivoBook S15 S510UA (Toshiba Exceria Pro SDXC 64 GB UHS-II) | |
| Lenovo IdeaPad V110-15IKB 80TH001SGE (Toshiba Exceria Pro SDXC 64 GB UHS-II) | |
| Acer Extensa 2540-580K (Toshiba Exceria Pro SDXC 64 GB UHS-II) | |
| HP 15-ay116ng (Toshiba Exceria Pro SDXC 64 GB UHS-II) | |
| Networking | |
| iperf3 transmit AX12 | |
| Lenovo ThinkPad E570-20H6S02M00 | |
| Acer Extensa 2540-580K | |
| Lenovo IdeaPad V110-15IKB 80TH001SGE | |
| Lenovo Ideapad 110-15ACL 80TJ00H0GE | |
| Acer Aspire 3 A315-21-651Y | |
| HP 15-ba077ng | |
| iperf3 receive AX12 | |
| Lenovo ThinkPad E570-20H6S02M00 | |
| Lenovo Ideapad 110-15ACL 80TJ00H0GE | |
| Acer Aspire 3 A315-21-651Y | |
| Acer Extensa 2540-580K | |
| Lenovo IdeaPad V110-15IKB 80TH001SGE | |
| HP 15-ba077ng | |
| |||||||||||||||||||||||||
iluminação: 92 %
iluminação com acumulador: 215 cd/m²
Contraste: 316:1 (Preto: 0.68 cd/m²)
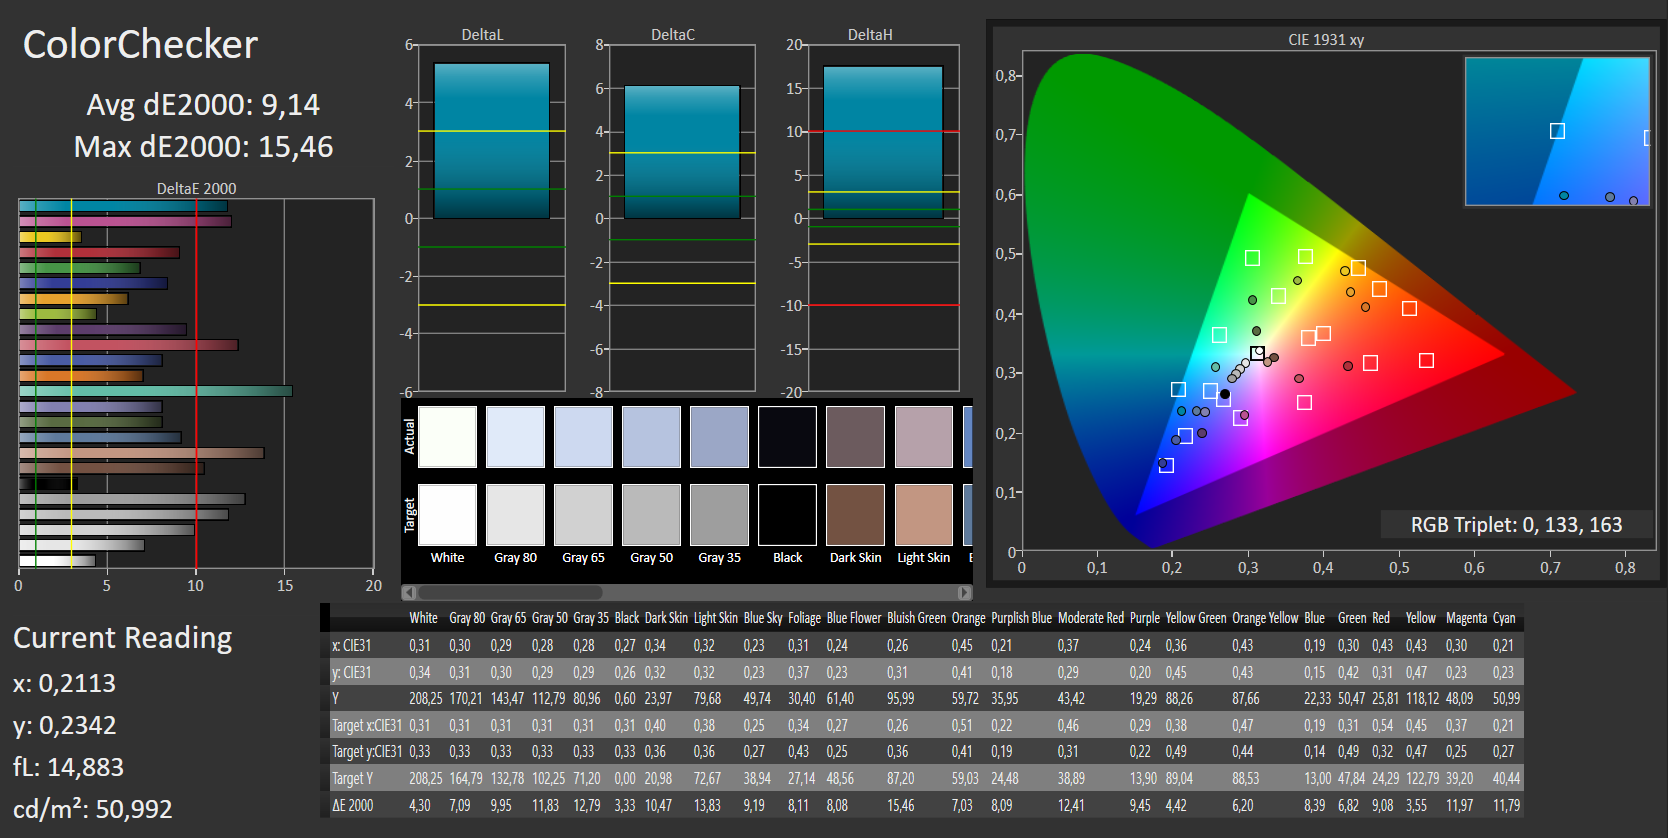
ΔE ColorChecker Calman: 9.14 | ∀{0.5-29.43 Ø4.71}
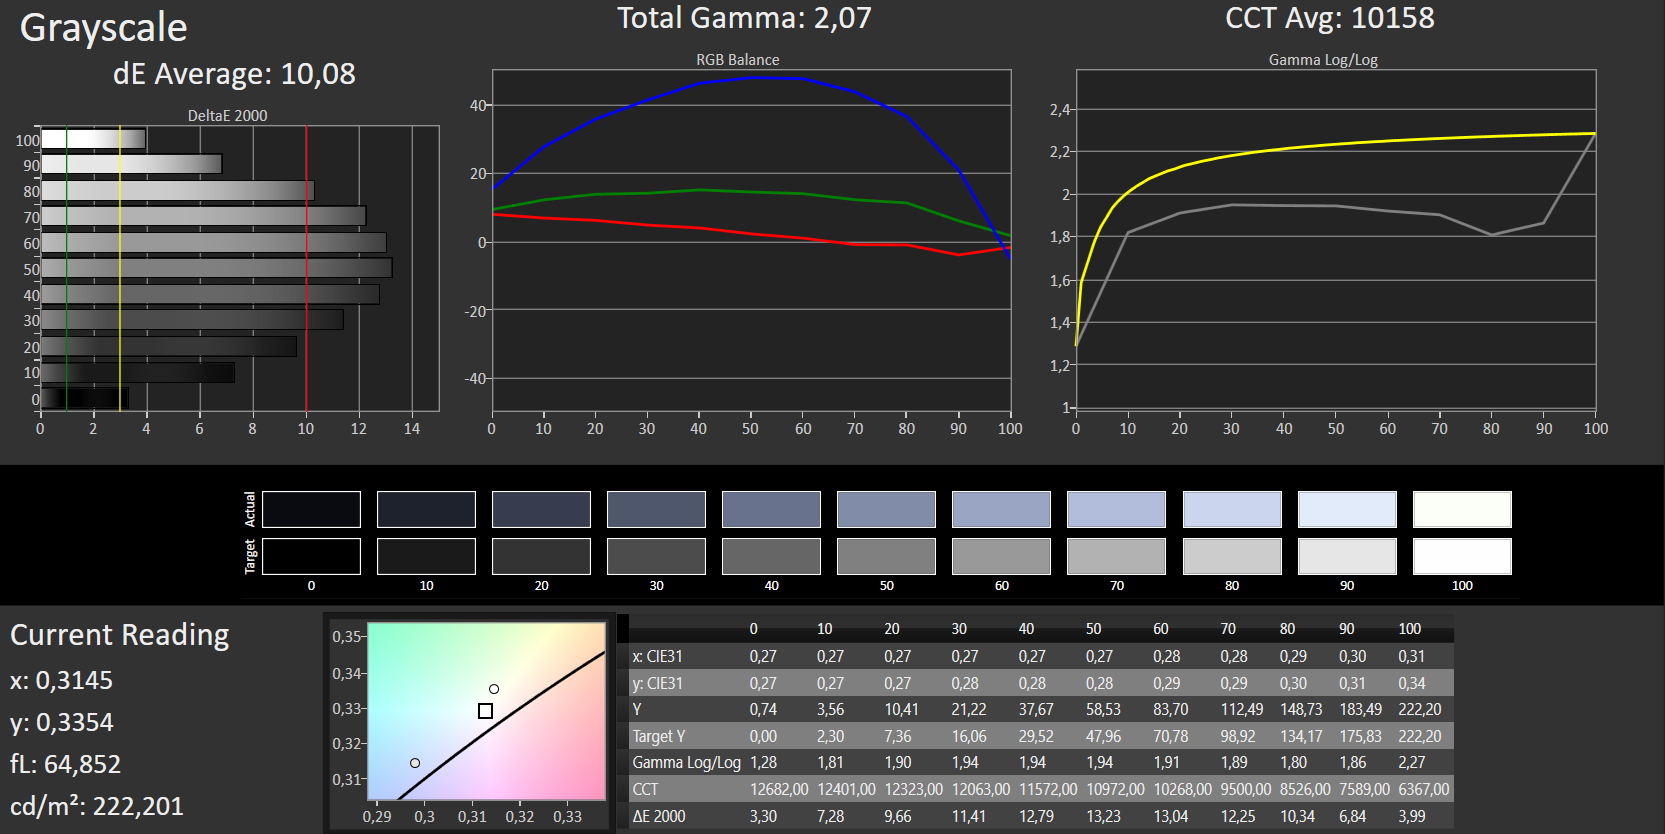
ΔE Greyscale Calman: 10.08 | ∀{0.09-98 Ø4.96}
56% sRGB (Argyll 1.6.3 3D)
36% AdobeRGB 1998 (Argyll 1.6.3 3D)
38.84% AdobeRGB 1998 (Argyll 3D)
56.5% sRGB (Argyll 3D)
37.59% Display P3 (Argyll 3D)
Gamma: 2.07
CCT: 10158 K
| Acer Extensa 2540-580K TN LED, 1920x1080, 15.6" | Lenovo IdeaPad V110-15IKB 80TH001SGE TN LED, 1366x768, 15.6" | HP 15-ba077ng TN LED, 1920x1080, 15.6" | HP 15-ay116ng TN LED, 1920x1080, 15.6" | Asus ASUSPRO P541UA-GQ1532 TN LED, 1366x768, 15.6" | Acer Aspire 3 A315-21-651Y TN LED, 1366x768, 15.6" | Lenovo Ideapad 110-15ACL 80TJ00H0GE TN LED, 1366x768, 15.6" | |
|---|---|---|---|---|---|---|---|
| Display | 4% | 6% | -1% | 5% | -1% | ||
| Display P3 Coverage (%) | 37.59 | 38.91 4% | 39.98 6% | 37.34 -1% | 39.48 5% | 37.39 -1% | |
| sRGB Coverage (%) | 56.5 | 58.6 4% | 60.2 7% | 56.2 -1% | 59.2 5% | 56.2 -1% | |
| AdobeRGB 1998 Coverage (%) | 38.84 | 40.2 4% | 41.31 6% | 38.58 -1% | 40.81 5% | 38.63 -1% | |
| Response Times | 10% | -1% | -2% | 18% | -9% | -23% | |
| Response Time Grey 50% / Grey 80% * (ms) | 41 ? | 39 ? 5% | 42 ? -2% | 40 ? 2% | 47 ? -15% | 48 ? -17% | 58 -41% |
| Response Time Black / White * (ms) | 22 ? | 19 ? 14% | 22 ? -0% | 23 ? -5% | 11 ? 50% | 22 ? -0% | 23 -5% |
| PWM Frequency (Hz) | 27000 ? | 10000 ? | 50 ? | 200 ? | 25000 ? | 200 ? | |
| Screen | 3% | -7% | 5% | 7% | 5% | 12% | |
| Brightness middle (cd/m²) | 215 | 243 13% | 209 -3% | 249 16% | 262 22% | 223 4% | 253 18% |
| Brightness (cd/m²) | 217 | 233 7% | 200 -8% | 234 8% | 250 15% | 220 1% | 246 13% |
| Brightness Distribution (%) | 92 | 75 -18% | 88 -4% | 89 -3% | 83 -10% | 88 -4% | 86 -7% |
| Black Level * (cd/m²) | 0.68 | 0.45 34% | 0.56 18% | 0.44 35% | 0.47 31% | 0.44 35% | |
| Contrast (:1) | 316 | 540 71% | 373 18% | 566 79% | 474 50% | 575 82% | |
| Colorchecker dE 2000 * | 9.14 | 11.69 -28% | 12.21 -34% | 11.71 -28% | 10.72 -17% | 9.2 -1% | |
| Colorchecker dE 2000 max. * | 15.46 | 20.08 -30% | 20.66 -34% | 19.51 -26% | 17.7 -14% | 17.68 -14% | |
| Greyscale dE 2000 * | 10.08 | 13.12 -30% | 13.48 -34% | 13.13 -30% | 10.07 -0% | 11.81 -17% | 11.05 -10% |
| Gamma | 2.07 106% | 2.24 98% | 2.34 94% | 2.57 86% | 2.36 93% | 2.32 95% | 2.55 86% |
| CCT | 10158 64% | 16905 38% | 15364 42% | 15273 43% | 10532 62% | 13530 48% | 11451 57% |
| Color Space (Percent of AdobeRGB 1998) (%) | 36 | 37 3% | 38 6% | 36 0% | 38 6% | 36 0% | |
| Color Space (Percent of sRGB) (%) | 56 | 59 5% | 60 7% | 56 0% | 59 5% | 56 0% | |
| Média Total (Programa/Configurações) | 6% /
4% | -1% /
-3% | 1% /
3% | 13% /
10% | 0% /
3% | -4% /
4% |
* ... menor é melhor
Cintilação da tela / PWM (modulação por largura de pulso)
| Tela tremeluzindo/PWM detectado | 27000 Hz | ≤ 90 % configuração de brilho | 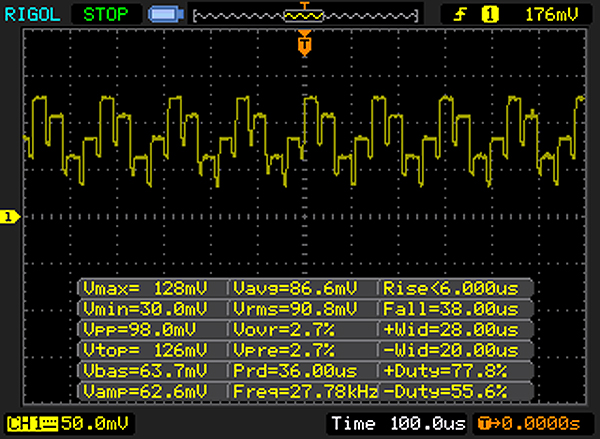 |
A luz de fundo da tela pisca em 27000 Hz (pior caso, por exemplo, utilizando PWM) Cintilação detectada em uma configuração de brilho de 90 % e abaixo. Não deve haver cintilação ou PWM acima desta configuração de brilho. A frequência de 27000 Hz é bastante alta, então a maioria dos usuários sensíveis ao PWM não deve notar nenhuma oscilação. [pwm_comparison] Em comparação: 52 % de todos os dispositivos testados não usam PWM para escurecer a tela. Se PWM foi detectado, uma média de 7744 (mínimo: 5 - máximo: 343500) Hz foi medida. | |||
Exibir tempos de resposta
| ↔ Tempo de resposta preto para branco | ||
|---|---|---|
| 22 ms ... ascensão ↗ e queda ↘ combinadas | ↗ 18 ms ascensão | 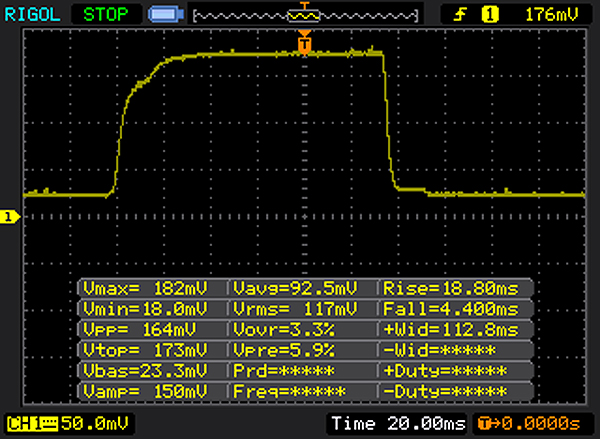 |
| ↘ 4 ms queda | ||
| A tela mostra boas taxas de resposta em nossos testes, mas pode ser muito lenta para jogadores competitivos. Em comparação, todos os dispositivos testados variam de 0.1 (mínimo) a 240 (máximo) ms. » 49 % de todos os dispositivos são melhores. Isso significa que o tempo de resposta medido é pior que a média de todos os dispositivos testados (19.8 ms). | ||
| ↔ Tempo de resposta 50% cinza a 80% cinza | ||
| 41 ms ... ascensão ↗ e queda ↘ combinadas | ↗ 21 ms ascensão | 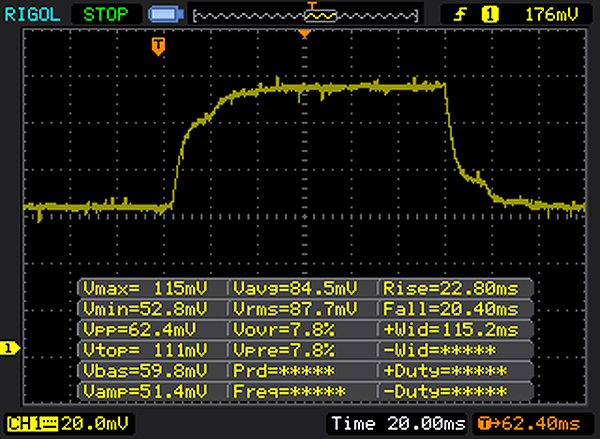 |
| ↘ 20 ms queda | ||
| A tela mostra taxas de resposta lentas em nossos testes e será insatisfatória para os jogadores. Em comparação, todos os dispositivos testados variam de 0.165 (mínimo) a 636 (máximo) ms. » 65 % de todos os dispositivos são melhores. Isso significa que o tempo de resposta medido é pior que a média de todos os dispositivos testados (30.9 ms). | ||


| Cinebench R15 | |
| CPU Single 64Bit | |
| Acer Spin 5 SP513-52N-54SF | |
| HP 15-bs103ng | |
| Acer Extensa 2540-580K | |
| HP 15-ay116ng | |
| Lenovo IdeaPad V110-15IKB 80TH001SGE | |
| Asus ASUSPRO P541UA-GQ1532 | |
| HP 15-ba077ng | |
| Acer Aspire 3 A315-21-651Y | |
| Lenovo Ideapad 110-15ACL 80TJ00H0GE | |
| CPU Multi 64Bit | |
| Acer Spin 5 SP513-52N-54SF | |
| HP 15-bs103ng | |
| Acer Extensa 2540-580K | |
| HP 15-ay116ng | |
| Lenovo IdeaPad V110-15IKB 80TH001SGE | |
| HP 15-ba077ng | |
| Asus ASUSPRO P541UA-GQ1532 | |
| Lenovo Ideapad 110-15ACL 80TJ00H0GE | |
| Acer Aspire 3 A315-21-651Y | |
| Cinebench R11.5 | |
| CPU Multi 64Bit | |
| HP 15-bs103ng | |
| Acer Extensa 2540-580K | |
| HP 15-ay116ng | |
| Lenovo IdeaPad V110-15IKB 80TH001SGE | |
| HP 15-ba077ng | |
| Acer Aspire 3 A315-21-651Y | |
| CPU Single 64Bit | |
| HP 15-bs103ng | |
| Acer Extensa 2540-580K | |
| HP 15-ay116ng | |
| Lenovo IdeaPad V110-15IKB 80TH001SGE | |
| HP 15-ba077ng | |
| Acer Aspire 3 A315-21-651Y | |
| Cinebench R10 | |
| Rendering Multiple CPUs 32Bit | |
| HP 15-bs103ng | |
| Acer Spin 5 SP513-52N-54SF | |
| HP 15-ay116ng | |
| Acer Extensa 2540-580K | |
| Lenovo IdeaPad V110-15IKB 80TH001SGE | |
| Asus ASUSPRO P541UA-GQ1532 | |
| HP 15-ba077ng | |
| Lenovo Ideapad 110-15ACL 80TJ00H0GE | |
| Acer Aspire 3 A315-21-651Y | |
| Rendering Single 32Bit | |
| Acer Spin 5 SP513-52N-54SF | |
| HP 15-bs103ng | |
| Acer Extensa 2540-580K | |
| HP 15-ay116ng | |
| Lenovo IdeaPad V110-15IKB 80TH001SGE | |
| Asus ASUSPRO P541UA-GQ1532 | |
| HP 15-ba077ng | |
| Acer Aspire 3 A315-21-651Y | |
| Lenovo Ideapad 110-15ACL 80TJ00H0GE | |
| Geekbench 3 | |
| 32 Bit Multi-Core Score | |
| HP 15-bs103ng | |
| Acer Spin 5 SP513-52N-54SF | |
| Acer Extensa 2540-580K | |
| HP 15-ay116ng | |
| HP 15-ba077ng | |
| Lenovo IdeaPad V110-15IKB 80TH001SGE | |
| Asus ASUSPRO P541UA-GQ1532 | |
| Lenovo Ideapad 110-15ACL 80TJ00H0GE | |
| Acer Aspire 3 A315-21-651Y | |
| 32 Bit Single-Core Score | |
| Acer Spin 5 SP513-52N-54SF | |
| Acer Extensa 2540-580K | |
| HP 15-bs103ng | |
| HP 15-ay116ng | |
| Lenovo IdeaPad V110-15IKB 80TH001SGE | |
| HP 15-ba077ng | |
| Asus ASUSPRO P541UA-GQ1532 | |
| Acer Aspire 3 A315-21-651Y | |
| Lenovo Ideapad 110-15ACL 80TJ00H0GE | |
| Geekbench 4.0 | |
| 64 Bit Multi-Core Score | |
| Acer Spin 5 SP513-52N-54SF | |
| HP 15-bs103ng | |
| Acer Extensa 2540-580K | |
| HP 15-ay116ng | |
| Lenovo IdeaPad V110-15IKB 80TH001SGE | |
| Asus ASUSPRO P541UA-GQ1532 | |
| HP 15-ba077ng | |
| Lenovo Ideapad 110-15ACL 80TJ00H0GE | |
| Acer Aspire 3 A315-21-651Y | |
| 64 Bit Single-Core Score | |
| Acer Spin 5 SP513-52N-54SF | |
| HP 15-bs103ng | |
| Acer Extensa 2540-580K | |
| HP 15-ay116ng | |
| Lenovo IdeaPad V110-15IKB 80TH001SGE | |
| Asus ASUSPRO P541UA-GQ1532 | |
| HP 15-ba077ng | |
| Acer Aspire 3 A315-21-651Y | |
| Lenovo Ideapad 110-15ACL 80TJ00H0GE | |
| Geekbench 4.4 | |
| 64 Bit Multi-Core Score | |
| Acer Spin 5 SP513-52N-54SF | |
| HP 15-bs103ng | |
| Acer Extensa 2540-580K | |
| Lenovo IdeaPad V110-15IKB 80TH001SGE | |
| Asus ASUSPRO P541UA-GQ1532 | |
| Acer Aspire 3 A315-21-651Y | |
| 64 Bit Single-Core Score | |
| Acer Spin 5 SP513-52N-54SF | |
| HP 15-bs103ng | |
| Acer Extensa 2540-580K | |
| Lenovo IdeaPad V110-15IKB 80TH001SGE | |
| Asus ASUSPRO P541UA-GQ1532 | |
| Acer Aspire 3 A315-21-651Y | |
| JetStream 1.1 - 1.1 Total | |
| Acer Spin 5 SP513-52N-54SF (Edge 41) | |
| HP 15-bs103ng (Edge 41) | |
| Acer Extensa 2540-580K (Edge 41) | |
| HP 15-ay116ng (Edge 38) | |
| Lenovo IdeaPad V110-15IKB 80TH001SGE (Edge 40) | |
| Asus ASUSPRO P541UA-GQ1532 (Edge 40) | |
| HP 15-ba077ng (Edge 38) | |
| Acer Aspire 3 A315-21-651Y (Edge 41) | |
| Asus ASUSPRO P541UA-GQ1532 (Chromium 59.0.3071.86 (Linux)) | |
| Lenovo Ideapad 110-15ACL 80TJ00H0GE (Edge 38) | |
| PCMark 7 Score | 5549 pontos | |
| PCMark 8 Home Score Accelerated v2 | 3752 pontos | |
| PCMark 8 Creative Score Accelerated v2 | 4518 pontos | |
| PCMark 8 Work Score Accelerated v2 | 4642 pontos | |
| PCMark 10 Score | 3228 pontos | |
Ajuda | ||
| PCMark 8 | |
| Home Score Accelerated v2 | |
| Acer Extensa 2540-580K | |
| HP 15-ay116ng | |
| Asus ASUSPRO P541UA-GQ1532 | |
| Lenovo IdeaPad V110-15IKB 80TH001SGE | |
| HP 15-ba077ng | |
| Acer Aspire 3 A315-21-651Y | |
| Lenovo Ideapad 110-15ACL 80TJ00H0GE | |
| Work Score Accelerated v2 | |
| Acer Extensa 2540-580K | |
| HP 15-ay116ng | |
| Lenovo IdeaPad V110-15IKB 80TH001SGE | |
| Acer Aspire 3 A315-21-651Y | |
| HP 15-ba077ng | |

| Acer Extensa 2540-580K Kingston RBUSC180DS37256GH | Lenovo IdeaPad V110-15IKB 80TH001SGE Ramxel S121 RTNRB256RFM4KWDL | HP 15-ba077ng SanDisk Z400s SD8SNAT-256G | HP 15-ay116ng Samsung CM871a MZNTY256HDHP | Lenovo Ideapad 110-15ACL 80TJ00H0GE Seagate Mobile HDD 1TB ST1000LM035 | Asus ASUSPRO P541UA-GQ1532 SK Hynix HFS128G32TND | |
|---|---|---|---|---|---|---|
| CrystalDiskMark 3.0 | -16% | -31% | 4% | -93% | -26% | |
| Read Seq (MB/s) | 473.9 | 477.4 1% | 447.4 -6% | 501 6% | 92.1 -81% | 514 8% |
| Write Seq (MB/s) | 467.1 | 284.2 -39% | 243.3 -48% | 483.9 4% | 88.5 -81% | 133.5 -71% |
| Read 512 (MB/s) | 318.3 | 356.3 12% | 333.4 5% | 413.8 30% | 32.94 -90% | 333.7 5% |
| Write 512 (MB/s) | 441.3 | 282.3 -36% | 283.1 -36% | 294.9 -33% | 26.71 -94% | 133.7 -70% |
| Read 4k (MB/s) | 33.06 | 24.15 -27% | 20.99 -37% | 34.91 6% | 0.372 -99% | 30.67 -7% |
| Write 4k (MB/s) | 77.7 | 71.9 -7% | 62.7 -19% | 95.7 23% | 0.283 -100% | 74.7 -4% |
| Read 4k QD32 (MB/s) | 310.1 | 283.7 -9% | 143.1 -54% | 370.9 20% | 0.921 -100% | 287.2 -7% |
| Write 4k QD32 (MB/s) | 317.1 | 257.3 -19% | 138 -56% | 243.6 -23% | 0.473 -100% | 134.1 -58% |
| 3DMark 06 Standard Score | 9984 pontos | |
| 3DMark 11 Performance | 1769 pontos | |
| 3DMark Ice Storm Standard Score | 65670 pontos | |
| 3DMark Cloud Gate Standard Score | 6693 pontos | |
| 3DMark Fire Strike Score | 994 pontos | |
| 3DMark Fire Strike Extreme Score | 473 pontos | |
| 3DMark Time Spy Score | 384 pontos | |
Ajuda | ||
| 3DMark 11 - 1280x720 Performance GPU | |
| HP 15-ba077ng | |
| Acer Extensa 2540-580K | |
| Asus VivoBook S15 S510UA | |
| HP 15-ay116ng | |
| Asus ASUSPRO P541UA-GQ1532 | |
| Acer Aspire 3 A315-21-651Y | |
| Lenovo Ideapad 110-15ACL 80TJ00H0GE | |
| Lenovo IdeaPad V110-15IKB 80TH001SGE | |
| 3DMark | |
| 1280x720 Cloud Gate Standard Graphics | |
| Asus VivoBook S15 S510UA | |
| Acer Extensa 2540-580K | |
| HP 15-ba077ng | |
| HP 15-ay116ng | |
| Lenovo IdeaPad V110-15IKB 80TH001SGE | |
| Acer Aspire 3 A315-21-651Y | |
| 1920x1080 Fire Strike Graphics | |
| HP 15-ba077ng | |
| Acer Extensa 2540-580K | |
| Asus VivoBook S15 S510UA | |
| HP 15-ay116ng | |
| Lenovo IdeaPad V110-15IKB 80TH001SGE | |
| Acer Aspire 3 A315-21-651Y | |
| baixo | média | alto | ultra | |
|---|---|---|---|---|
| StarCraft 2 (2010) | 181.4 | 54.6 | 30.6 | 17.7 |
| Tomb Raider (2013) | 88.5 | 43.7 | 27.3 | 12.5 |
| BioShock Infinite (2013) | 53.8 | 30.3 | 25.9 | 9.2 |
| Rise of the Tomb Raider (2016) | 18.9 | 12.2 | 6.4 | 4.2 |
| FIFA 18 (2017) | 70.6 | 36.5 | 28.3 | 25.8 |
| Need for Speed Payback (2017) | 14.7 | 8.7 | ||
| Star Wars Battlefront 2 (2017) | 23.4 | 6.7 |
Barulho
| Ocioso |
| 30.3 / 30.3 / 30.3 dB |
| DVD |
| 35.3 / dB |
| Carga |
| 34.7 / 37.4 dB |
 | ||
30 dB silencioso 40 dB(A) audível 50 dB(A) ruidosamente alto |
||
min: | ||
| Acer Extensa 2540-580K i5-7200U, HD Graphics 620 | Lenovo IdeaPad V110-15IKB 80TH001SGE Pentium 4415U, HD Graphics 610 | HP 15-ba077ng A12-9700P, Radeon R7 (Bristol Ridge) | HP 15-ay116ng i5-7200U, HD Graphics 620 | Asus ASUSPRO P541UA-GQ1532 6006U, HD Graphics 520 | Acer Aspire 3 A315-21-651Y A6-9220, Radeon R4 (Stoney Ridge) | Lenovo Ideapad 110-15ACL 80TJ00H0GE A8-7410, Radeon R5 (Beema/Carrizo-L) | |
|---|---|---|---|---|---|---|---|
| Noise | 0% | 1% | -2% | -5% | 3% | 3% | |
| desligado / ambiente * (dB) | 30.3 | 30.5 -1% | 30.6 -1% | 30.5 -1% | 30 1% | 30.4 -0% | 30.4 -0% |
| Idle Minimum * (dB) | 30.3 | 30.5 -1% | 31.5 -4% | 31.3 -3% | 32.1 -6% | 30.4 -0% | 30.9 -2% |
| Idle Average * (dB) | 30.3 | 30.5 -1% | 31.8 -5% | 31.3 -3% | 32.6 -8% | 31.6 -4% | 30.9 -2% |
| Idle Maximum * (dB) | 30.3 | 31.6 -4% | 31.8 -5% | 31.3 -3% | 32.6 -8% | 31.6 -4% | 31 -2% |
| Load Average * (dB) | 34.7 | 34.3 1% | 31.4 10% | 35.6 -3% | 35.7 -3% | 31.9 8% | 31.8 8% |
| Load Maximum * (dB) | 37.4 | 34.8 7% | 33.4 11% | 36.15 3% | 40 -7% | 31.9 15% | 31.9 15% |
* ... menor é melhor
(+) A temperatura máxima no lado superior é 34 °C / 93 F, em comparação com a média de 34.3 °C / 94 F , variando de 21.2 a 62.5 °C para a classe Office.
(+) A parte inferior aquece até um máximo de 33.2 °C / 92 F, em comparação com a média de 36.8 °C / 98 F
(+) Em uso inativo, a temperatura média para o lado superior é 24 °C / 75 F, em comparação com a média do dispositivo de 29.5 °C / ### class_avg_f### F.
(+) Os apoios para as mãos e o touchpad são mais frios que a temperatura da pele, com um máximo de 23.9 °C / 75 F e, portanto, são frios ao toque.
(+) A temperatura média da área do apoio para as mãos de dispositivos semelhantes foi 27.6 °C / 81.7 F (+3.7 °C / 6.7 F).
| Acer Extensa 2540-580K i5-7200U, HD Graphics 620 | Lenovo IdeaPad V110-15IKB 80TH001SGE Pentium 4415U, HD Graphics 610 | HP 15-ba077ng A12-9700P, Radeon R7 (Bristol Ridge) | HP 15-ay116ng i5-7200U, HD Graphics 620 | Asus ASUSPRO P541UA-GQ1532 6006U, HD Graphics 520 | Acer Aspire 3 A315-21-651Y A6-9220, Radeon R4 (Stoney Ridge) | Lenovo Ideapad 110-15ACL 80TJ00H0GE A8-7410, Radeon R5 (Beema/Carrizo-L) | |
|---|---|---|---|---|---|---|---|
| Heat | 5% | 1% | 2% | -4% | -6% | -8% | |
| Maximum Upper Side * (°C) | 34 | 32.5 4% | 34.8 -2% | 33.8 1% | 32.6 4% | 30.5 10% | 32.9 3% |
| Maximum Bottom * (°C) | 33.2 | 31.7 5% | 38.3 -15% | 36.6 -10% | 30.7 8% | 33 1% | 34.5 -4% |
| Idle Upper Side * (°C) | 26.1 | 24.7 5% | 23.2 11% | 23.6 10% | 28.9 -11% | 30.2 -16% | 31.4 -20% |
| Idle Bottom * (°C) | 25.7 | 24 7% | 23.3 9% | 23.8 7% | 30 -17% | 30.4 -18% | 28 -9% |
* ... menor é melhor
Acer Extensa 2540-580K análise de áudio
(-) | alto-falantes não muito altos (###valor### dB)
Graves 100 - 315Hz
(-) | quase nenhum baixo - em média 25% menor que a mediana
(±) | a linearidade dos graves é média (12% delta para a frequência anterior)
Médios 400 - 2.000 Hz
(+) | médios equilibrados - apenas 3.1% longe da mediana
(+) | médios são lineares (6.9% delta para frequência anterior)
Altos 2 - 16 kHz
(+) | agudos equilibrados - apenas 4.4% longe da mediana
(±) | a linearidade dos máximos é média (7.9% delta para frequência anterior)
Geral 100 - 16.000 Hz
(±) | a linearidade do som geral é média (24.2% diferença em relação à mediana)
Comparado com a mesma classe
» 71% de todos os dispositivos testados nesta classe foram melhores, 8% semelhantes, 22% piores
» O melhor teve um delta de 7%, a média foi 21%, o pior foi 53%
Comparado com todos os dispositivos testados
» 73% de todos os dispositivos testados foram melhores, 6% semelhantes, 21% piores
» O melhor teve um delta de 4%, a média foi 23%, o pior foi 134%
Apple MacBook 12 (Early 2016) 1.1 GHz análise de áudio
(+) | os alto-falantes podem tocar relativamente alto (###valor### dB)
Graves 100 - 315Hz
(±) | graves reduzidos - em média 11.3% menor que a mediana
(±) | a linearidade dos graves é média (14.2% delta para a frequência anterior)
Médios 400 - 2.000 Hz
(+) | médios equilibrados - apenas 2.4% longe da mediana
(+) | médios são lineares (5.5% delta para frequência anterior)
Altos 2 - 16 kHz
(+) | agudos equilibrados - apenas 2% longe da mediana
(+) | os máximos são lineares (4.5% delta da frequência anterior)
Geral 100 - 16.000 Hz
(+) | o som geral é linear (10.2% diferença em relação à mediana)
Comparado com a mesma classe
» 7% de todos os dispositivos testados nesta classe foram melhores, 2% semelhantes, 90% piores
» O melhor teve um delta de 5%, a média foi 18%, o pior foi 53%
Comparado com todos os dispositivos testados
» 5% de todos os dispositivos testados foram melhores, 1% semelhantes, 94% piores
» O melhor teve um delta de 4%, a média foi 23%, o pior foi 134%
| desligado | |
| Ocioso | |
| Carga |
|
Key:
min: | |
| Acer Extensa 2540-580K i5-7200U, HD Graphics 620 | Lenovo IdeaPad V110-15IKB 80TH001SGE Pentium 4415U, HD Graphics 610 | HP 15-ba077ng A12-9700P, Radeon R7 (Bristol Ridge) | HP 15-ay116ng i5-7200U, HD Graphics 620 | Asus ASUSPRO P541UA-GQ1532 6006U, HD Graphics 520 | Acer Aspire 3 A315-21-651Y A6-9220, Radeon R4 (Stoney Ridge) | Lenovo Ideapad 110-15ACL 80TJ00H0GE A8-7410, Radeon R5 (Beema/Carrizo-L) | |
|---|---|---|---|---|---|---|---|
| Power Consumption | 10% | -7% | 10% | -15% | 6% | 4% | |
| Idle Minimum * (Watt) | 4.5 | 2.8 38% | 4.4 2% | 3.2 29% | 6.9 -53% | 4.6 -2% | 5.4 -20% |
| Idle Average * (Watt) | 6.7 | 6.8 -1% | 6.8 -1% | 6.3 6% | 8.9 -33% | 7.3 -9% | 6.8 -1% |
| Idle Maximum * (Watt) | 7.4 | 8.2 -11% | 8.9 -20% | 7.4 -0% | 9.6 -30% | 8.7 -18% | 7.3 1% |
| Load Average * (Watt) | 29 | 24 17% | 30.9 -7% | 24 17% | 19 34% | 20 31% | 21.1 27% |
| Load Maximum * (Watt) | 29 | 26.3 9% | 31 -7% | 29 -0% | 27 7% | 21.6 26% | 25.5 12% |
* ... menor é melhor
| Acer Extensa 2540-580K i5-7200U, HD Graphics 620, 48 Wh | Lenovo IdeaPad V110-15IKB 80TH001SGE Pentium 4415U, HD Graphics 610, 32 Wh | HP 15-ba077ng A12-9700P, Radeon R7 (Bristol Ridge), 41 Wh | HP 15-ay116ng i5-7200U, HD Graphics 620, 41 Wh | Asus ASUSPRO P541UA-GQ1532 6006U, HD Graphics 520, 34.5 Wh | Acer Aspire 3 A315-21-651Y A6-9220, Radeon R4 (Stoney Ridge), 37 Wh | Lenovo Ideapad 110-15ACL 80TJ00H0GE A8-7410, Radeon R5 (Beema/Carrizo-L), 24 Wh | Asus ASUSPRO P541UA-GQ1532 6006U, HD Graphics 520, 34.5 Wh | |
|---|---|---|---|---|---|---|---|---|
| Duração da bateria | -52% | -30% | -15% | -52% | -49% | -58% | -17% | |
| Reader / Idle (h) | 18.9 | 12.4 -34% | 14.5 -23% | |||||
| H.264 (h) | 7.7 | 4.6 -40% | 7.2 -6% | |||||
| WiFi v1.3 (h) | 8.1 | 3.9 -52% | 4.9 -40% | 6.9 -15% | 3.9 -52% | 4.1 -49% | 3.4 -58% | 6.7 -17% |
| Load (h) | 1.8 | 1.7 -6% | 1.5 -17% |
Pro
Contra
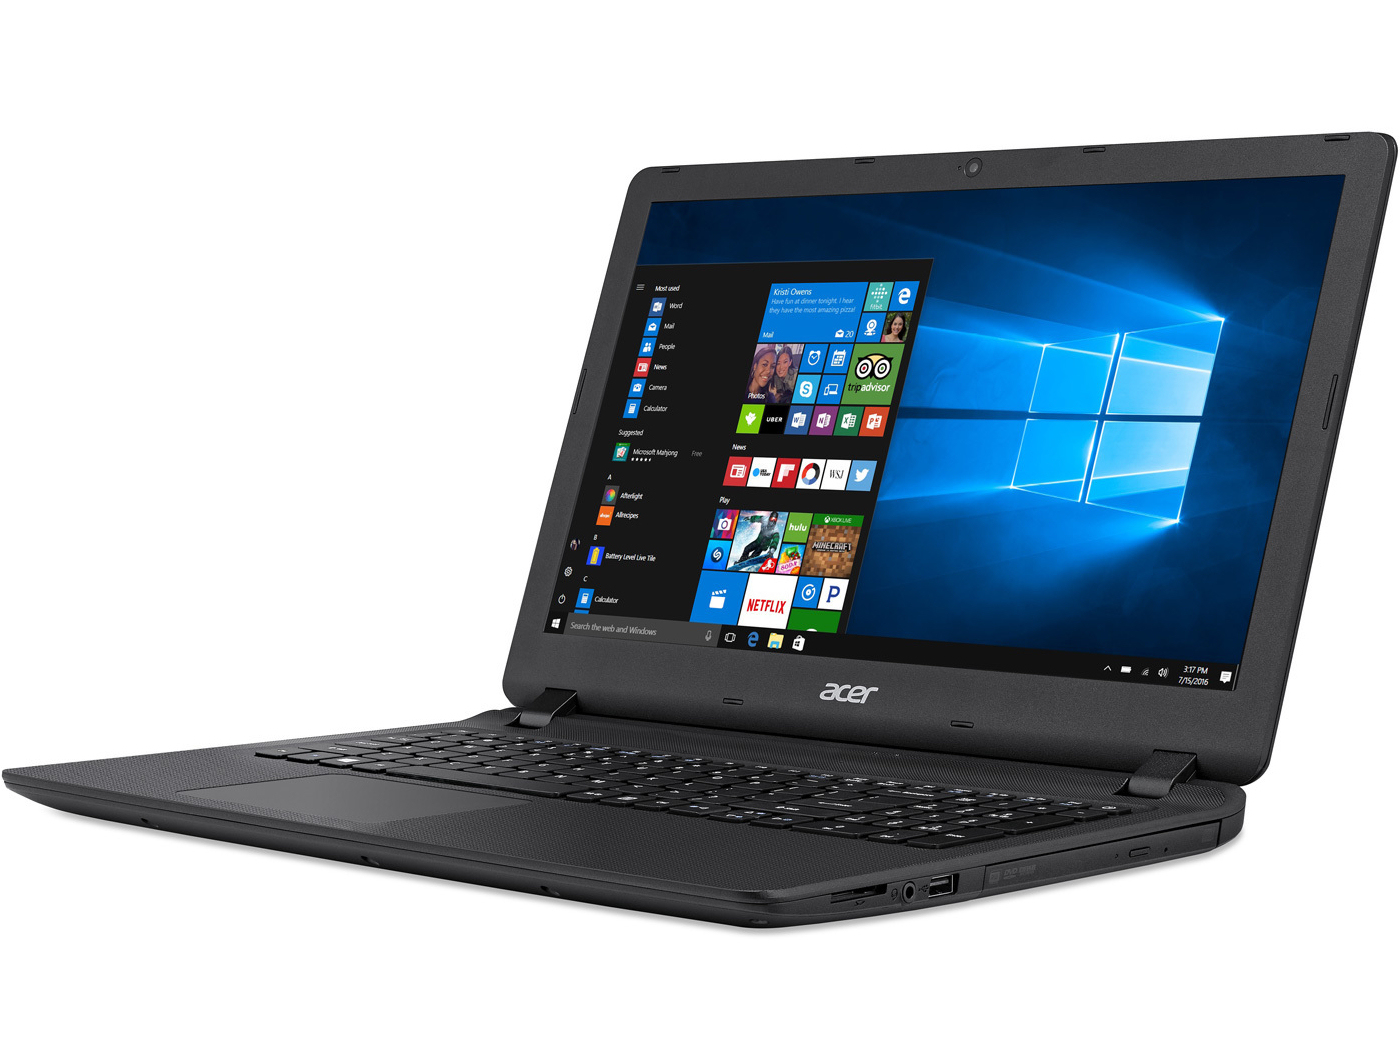
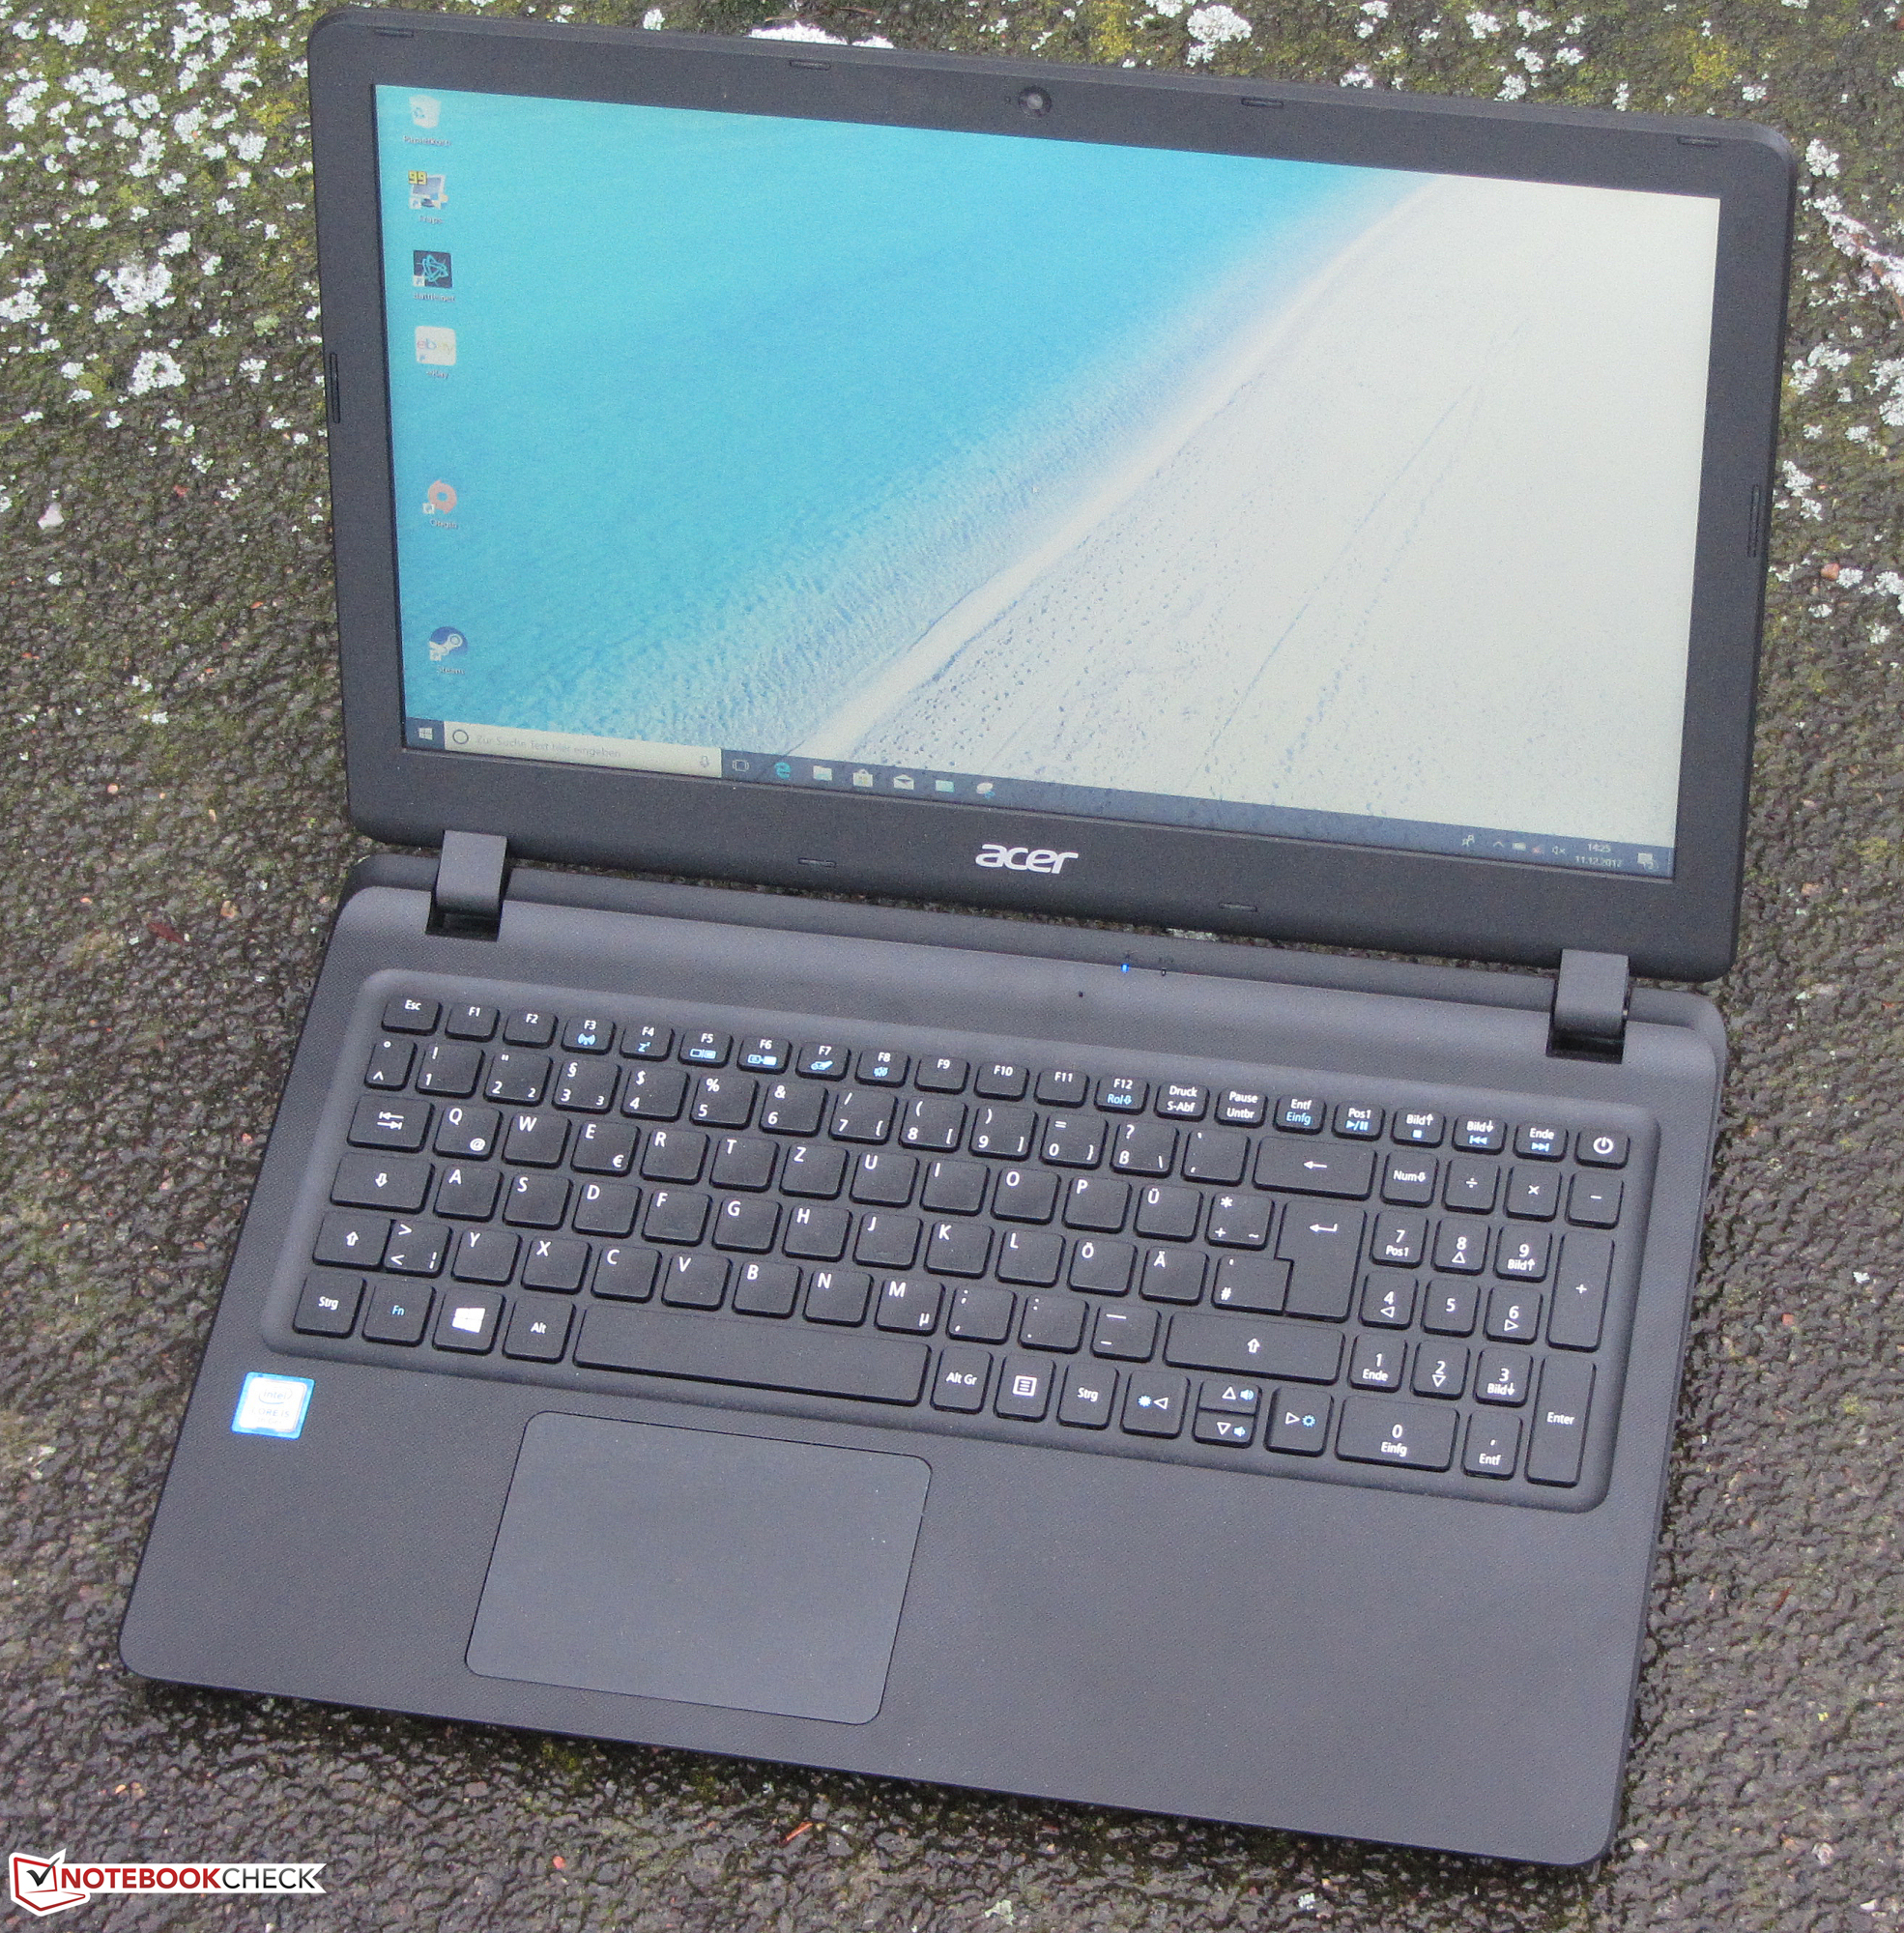
O Acer Extensa 2540-580K possui uma CPU poderosa, um SSD rápido e uma RAM habilitada para canal duplo. O aparelho não esquenta sob qualquer tipo de carga e opera quase silenciosamente. Portanto, o Extensa oferece recursos e atributos associados à maioria dos portáteis de escritório.
Com o Extensa 2540, a Acer oferece um aparelho de escritório muito durável que terá que encontrar seu público. A tela será um grande impedimento para muitos compradores potenciais.
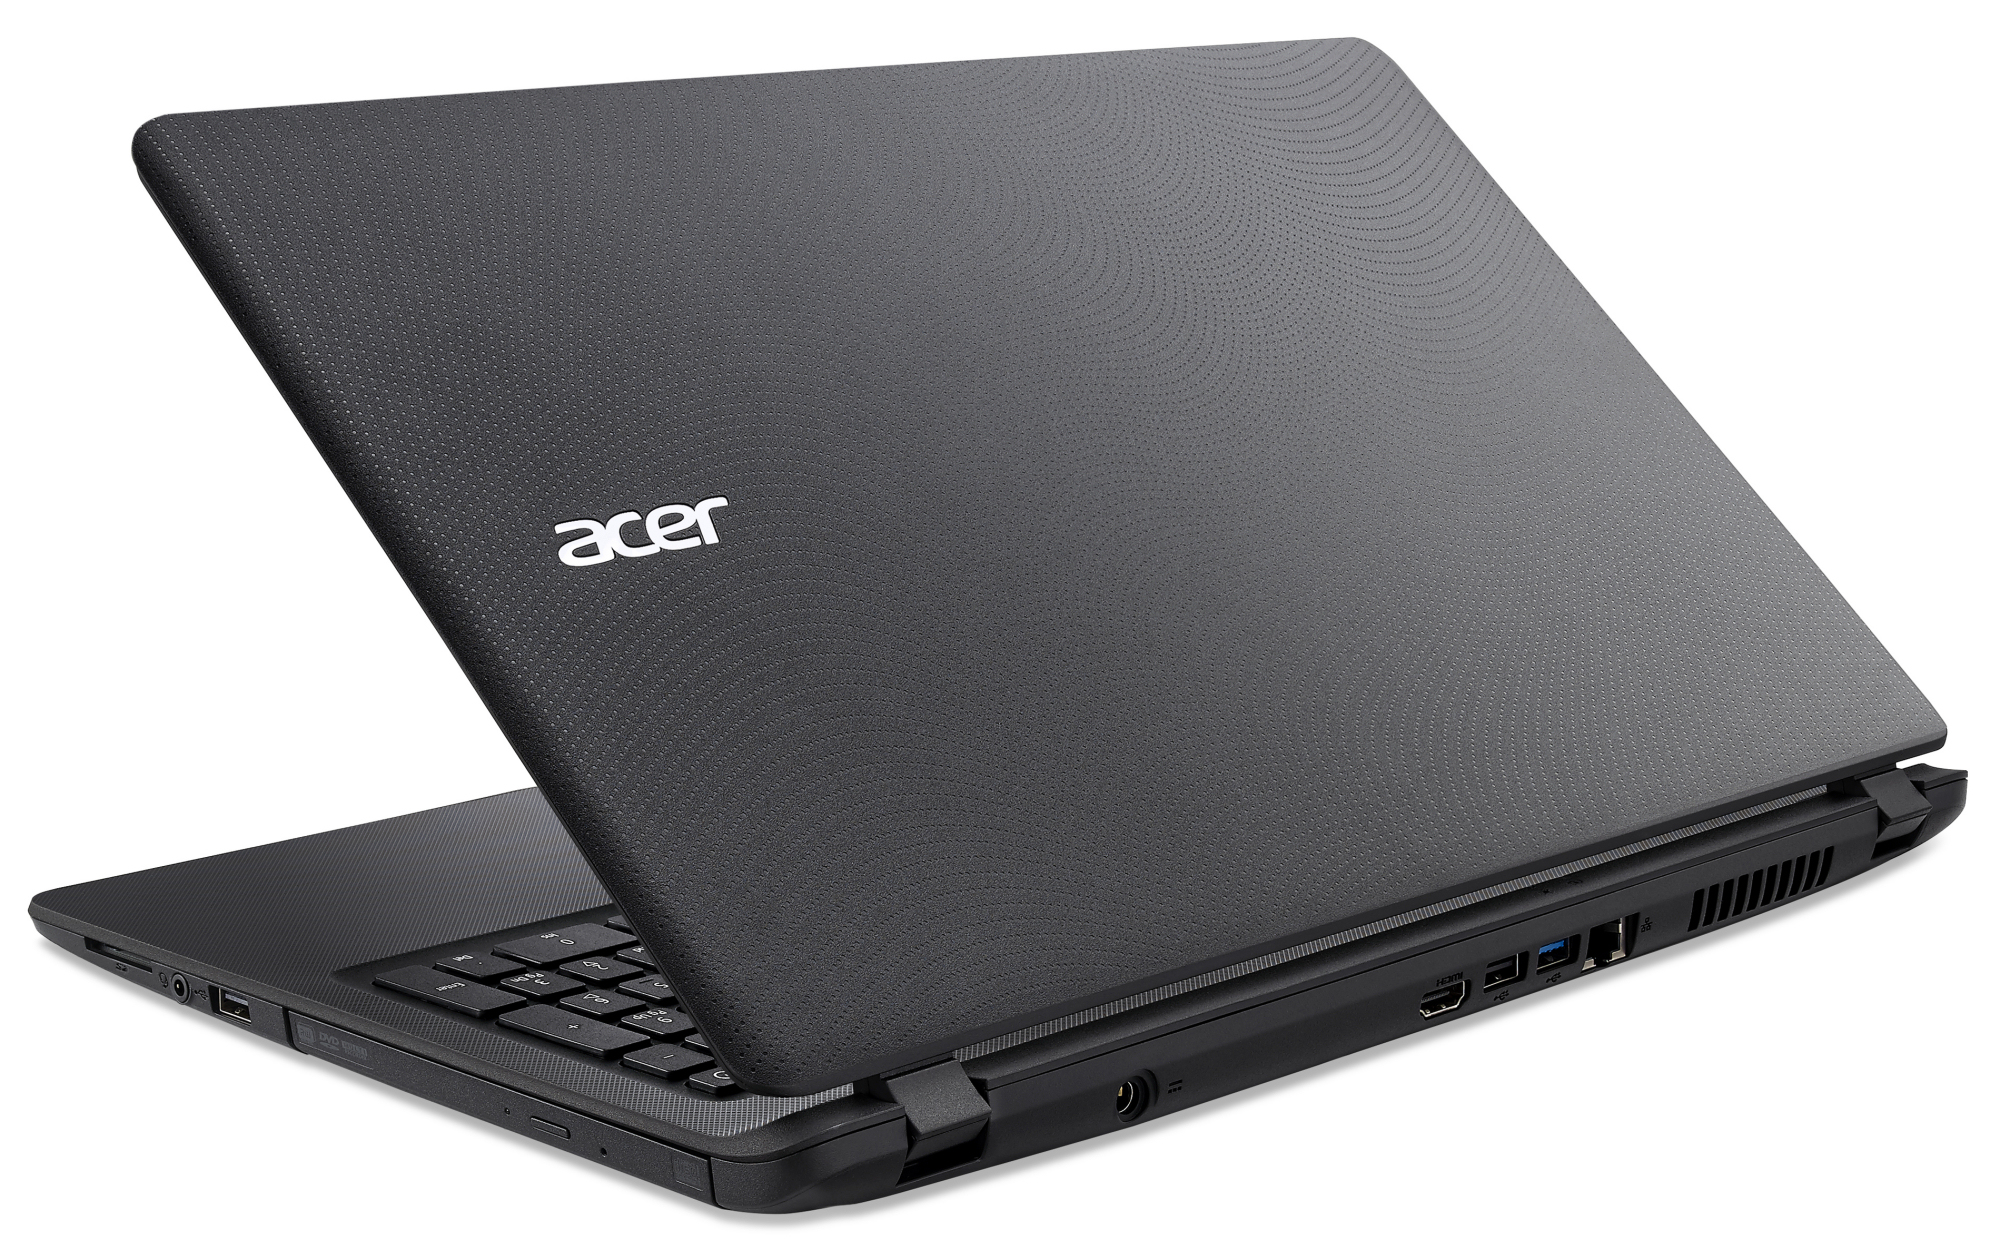
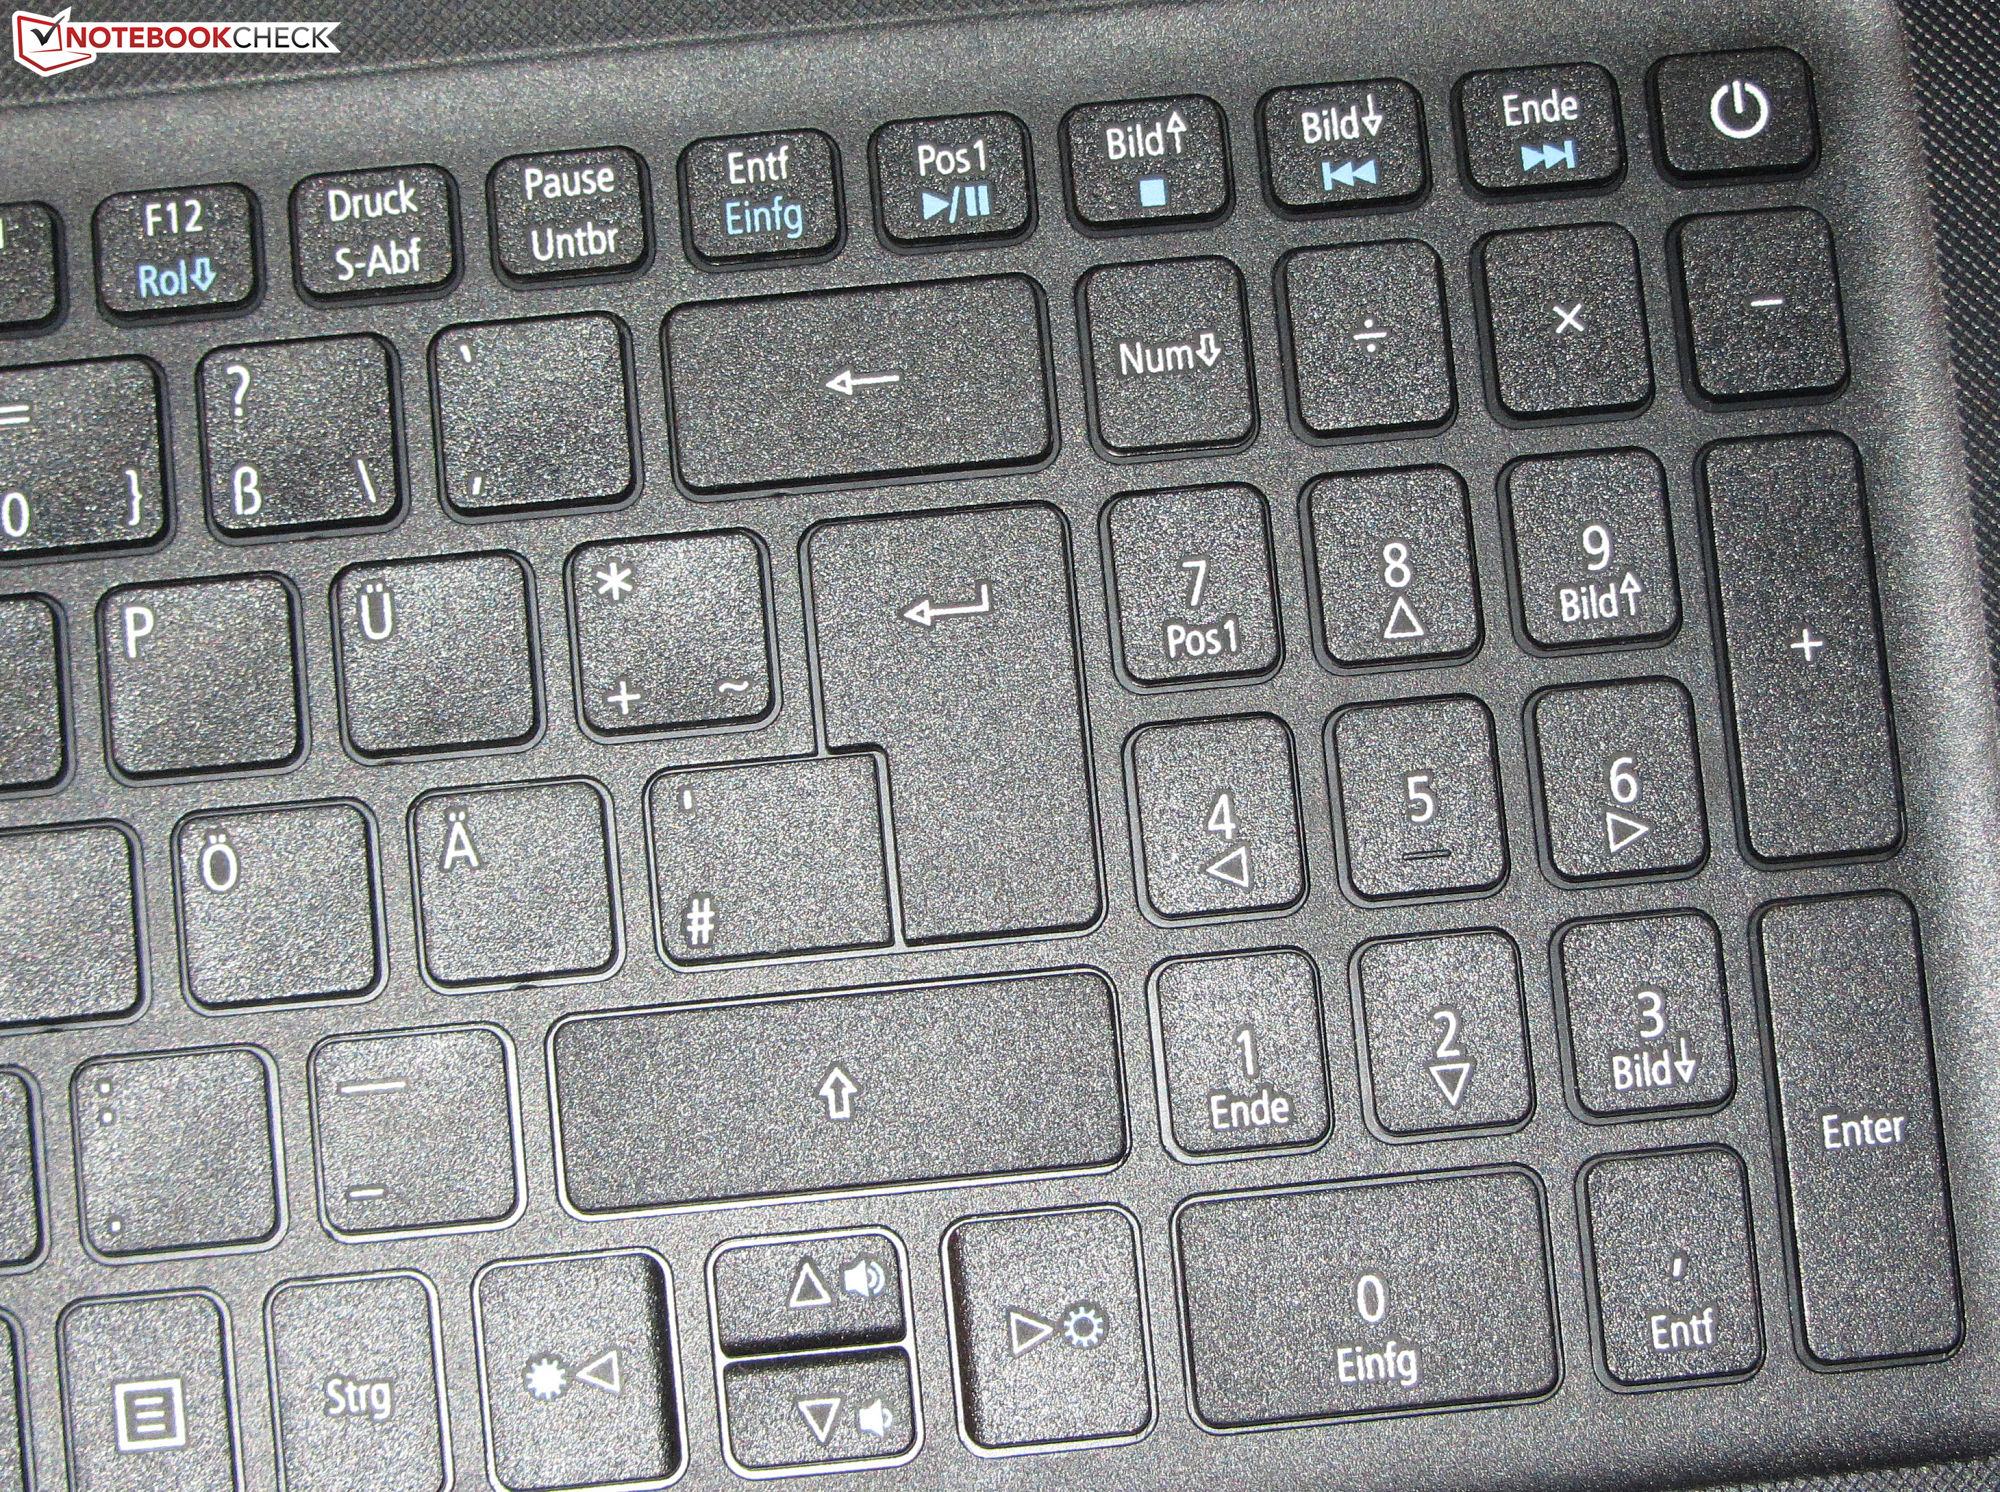
Felizmente, a Acer equipou o portátil com uma pequena escotilha de manutenção, atrás da qual o SSD e a RAM estão localizados. Portanto, substituir ou atualizar esses componentes não deve apresentar nenhum problema. O teclado, em geral, deixou uma impressão "boa". No entanto, gostaríamos muito de ter visto uma luz de fundo aqui. Com isso, a Acer poderia ter completado o aparelho de escritório, que é o que o Extensa deveria ser. A excelente duração da bateria adiciona mais valor ao portátil.
O ponto mais fraco do aparelho - como é frequente - é a tela. A Acer usa um painel escuro com contraste e ângulos de visão fracos aqui, o que não teria sido apropriado mesmo em um portátil de 400 euros (~$470).
Com este modelo, a Acer vai atrás de, principalmente, usuários profissionais, por isso a cópia pré-instalada do Windows 10 Pro. A versão profissional aumenta um pouco o preço do aparelho, o que torna o portátil bastante pouco atrativo aos usuários ocasionais. A Acer não oferece uma versão alternativa equipada de forma similar com o Windows 10 Home. O Extensa 2540-56GC é o mais próximo do nosso aparelho de teste. No entanto, somente vem com uma tela HD (1366x768).
Atualização 13/12/2017: A Acer nos informou que o modelo que testamos na nossa análise não está mais disponível e que foi substituído pelo modelo Extensa 2540-54C0, construído de forma idêntica.
Acer Extensa 2540-580K
- 12/12/2017 v6 (old)
Sascha Mölck