Breve Análise do Portátil Asus VivoBook S15 S510UA (i5-7200U, FHD)


| SD Card Reader | |
| average JPG Copy Test (av. of 3 runs) | |
| HP Pavilion 15t-au100 CTO (W0P31AV) | |
| Asus VivoBook S15 S510UA | |
| Dell Inspiron 15 7000 7567 | |
| maximum AS SSD Seq Read Test (1GB) | |
| HP Pavilion 15t-au100 CTO (W0P31AV) | |
| Asus VivoBook S15 S510UA | |
| Dell Inspiron 15 7000 7567 | |
| Networking | |
| iperf3 transmit AX12 | |
| Asus VivoBook S15 S510UA | |
| Lenovo V510-15IKB 80WQ0002GE | |
| Dell Inspiron 15 7000 7567 (jseb) | |
| iperf3 receive AX12 | |
| Asus VivoBook S15 S510UA | |
| Lenovo V510-15IKB 80WQ0002GE | |
| Dell Inspiron 15 7000 7567 (jseb) | |
| |||||||||||||||||||||||||
iluminação: 89 %
iluminação com acumulador: 277.5 cd/m²
Contraste: 793:1 (Preto: 0.35 cd/m²)
ΔE ColorChecker Calman: 4.8 | ∀{0.5-29.43 Ø4.71}
ΔE Greyscale Calman: 3 | ∀{0.09-98 Ø4.96}
69.3% sRGB (Argyll 1.6.3 3D)
37.7% AdobeRGB 1998 (Argyll 1.6.3 3D)
41.11% AdobeRGB 1998 (Argyll 3D)
59.5% sRGB (Argyll 3D)
39.9% Display P3 (Argyll 3D)
Gamma: 2.39
CCT: 6854 K
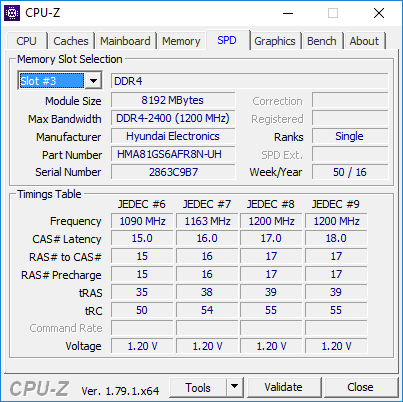
| Asus VivoBook S15 S510UA ID: LGD0573, Name: LG Display LP156WF9-SPK2, IPS, 15.6", 1920x1080 | Lenovo V510-15IKB 80WQ0002GE LG Philips LP156WF6-SPK3, IPS, 15.6", 1920x1080 | HP Pavilion 15t-au100 CTO (W0P31AV) BOE0693, IPS, 15.6", 1920x1080 | Apple MacBook Pro 15 2016 (2.9 GHz, 460) Apple APPA030, IPS, 15.4", 2880x1800 | HP Envy 15-as133cl Chi Mei CMN15D8, IPS, 15.6", 1920x1080 | Dell Inspiron 15 7000 7567 AU Optronics AUO38ED B156HTN 28H80, TN, 15.6", 1920x1080 | |
|---|---|---|---|---|---|---|
| Display | -2% | 9% | 109% | 8% | -8% | |
| Display P3 Coverage (%) | 39.9 | 38.8 -3% | 43.27 8% | 99 148% | 42.95 8% | 36.42 -9% |
| sRGB Coverage (%) | 59.5 | 58.1 -2% | 64.9 9% | 100 68% | 64.3 8% | 54.9 -8% |
| AdobeRGB 1998 Coverage (%) | 41.11 | 40.12 -2% | 44.71 9% | 87.3 112% | 44.41 8% | 37.62 -8% |
| Response Times | -8% | -18% | -66% | -15% | -15% | |
| Response Time Grey 50% / Grey 80% * (ms) | 38.4 ? | 39 ? -2% | 42 ? -9% | 46 ? -20% | 44.4 ? -16% | 36 ? 6% |
| Response Time Black / White * (ms) | 26.4 ? | 30 ? -14% | 33.6 ? -27% | 56 ? -112% | 30 ? -14% | 36 ? -36% |
| PWM Frequency (Hz) | 20000 ? | 198.4 | 119000 ? | 1000 ? | ||
| Screen | -6% | -9% | 46% | 2% | -75% | |
| Brightness middle (cd/m²) | 277.5 | 256 -8% | 186.5 -33% | 420 51% | 262.3 -5% | 246 -11% |
| Brightness (cd/m²) | 265 | 252 -5% | 174 -34% | 401 51% | 240 -9% | 235 -11% |
| Brightness Distribution (%) | 89 | 87 -2% | 69 -22% | 90 1% | 83 -7% | 75 -16% |
| Black Level * (cd/m²) | 0.35 | 0.3 14% | 0.18 49% | 0.3 14% | 0.24 31% | 0.55 -57% |
| Contrast (:1) | 793 | 853 8% | 1036 31% | 1400 77% | 1093 38% | 447 -44% |
| Colorchecker dE 2000 * | 4.8 | 5.4 -13% | 5.7 -19% | 3.33 31% | 5 -4% | 10.97 -129% |
| Colorchecker dE 2000 max. * | 17.8 | 9.36 47% | 22.5 -26% | 5.11 71% | 20.6 -16% | |
| Greyscale dE 2000 * | 3 | 5.37 -79% | 4.4 -47% | 2.73 9% | 3.2 -7% | 14.25 -375% |
| Gamma | 2.39 92% | 2.58 85% | 2.35 94% | 2.48 89% | 2.45 90% | 1.83 120% |
| CCT | 6854 95% | 6795 96% | 6963 93% | 6457 101% | 6817 95% | 11200 58% |
| Color Space (Percent of AdobeRGB 1998) (%) | 37.7 | 37 -2% | 44.71 19% | 78.09 107% | 40.5 7% | 35 -7% |
| Color Space (Percent of sRGB) (%) | 69.3 | 58 -16% | 64.95 -6% | 99.97 44% | 63.5 -8% | 55 -21% |
| Média Total (Programa/Configurações) | -5% /
-5% | -6% /
-7% | 30% /
43% | -2% /
1% | -33% /
-52% |
* ... menor é melhor
Exibir tempos de resposta
| ↔ Tempo de resposta preto para branco | ||
|---|---|---|
| 26.4 ms ... ascensão ↗ e queda ↘ combinadas | ↗ 15.6 ms ascensão | 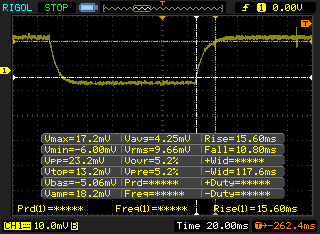 |
| ↘ 10.8 ms queda | ||
| A tela mostra taxas de resposta relativamente lentas em nossos testes e pode ser muito lenta para os jogadores. Em comparação, todos os dispositivos testados variam de 0.1 (mínimo) a 240 (máximo) ms. » 66 % de todos os dispositivos são melhores. Isso significa que o tempo de resposta medido é pior que a média de todos os dispositivos testados (19.8 ms). | ||
| ↔ Tempo de resposta 50% cinza a 80% cinza | ||
| 38.4 ms ... ascensão ↗ e queda ↘ combinadas | ↗ 19.2 ms ascensão | 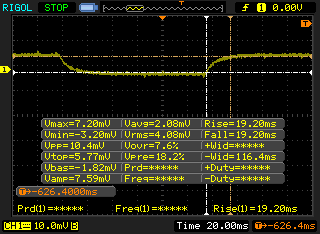 |
| ↘ 19.2 ms queda | ||
| A tela mostra taxas de resposta lentas em nossos testes e será insatisfatória para os jogadores. Em comparação, todos os dispositivos testados variam de 0.165 (mínimo) a 636 (máximo) ms. » 58 % de todos os dispositivos são melhores. Isso significa que o tempo de resposta medido é pior que a média de todos os dispositivos testados (31 ms). | ||
Cintilação da tela / PWM (modulação por largura de pulso)
| Tela tremeluzindo / PWM não detectado | 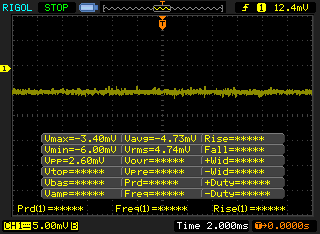 | ||
[pwm_comparison] Em comparação: 52 % de todos os dispositivos testados não usam PWM para escurecer a tela. Se PWM foi detectado, uma média de 7757 (mínimo: 5 - máximo: 343500) Hz foi medida. | |||
| Cinebench R10 | |
| Rendering Multiple CPUs 32Bit | |
| Asus VivoBook S15 S510UA | |
| Dell Latitude 5280 | |
| Lenovo ThinkPad 13-20J2S00G00 | |
| HP ProBook 640 G2-T9X60ET | |
| Lenovo Thinkpad 13-20J1001BUS | |
| HP 250 G4 T6P08ES | |
| Lenovo IdeaPad Z40-59422614 | |
| HP EliteBook 725 G4 | |
| Rendering Single 32Bit | |
| Asus VivoBook S15 S510UA | |
| Dell Latitude 5280 | |
| Lenovo ThinkPad 13-20J2S00G00 | |
| HP ProBook 640 G2-T9X60ET | |
| HP 250 G4 T6P08ES | |
| Lenovo Thinkpad 13-20J1001BUS | |
| Lenovo IdeaPad Z40-59422614 | |
| HP EliteBook 725 G4 | |
| wPrime 2.10 - 1024m | |
| Lenovo IdeaPad Z40-59422614 | |
| Lenovo Thinkpad 13-20J1001BUS | |
| HP EliteBook 725 G4 | |
| Dell Latitude 5280 | |
| Asus VivoBook S15 S510UA | |
| Lenovo ThinkPad T470s-20HF0012US | |
* ... menor é melhor
| PCMark 8 | |
| Home Score Accelerated v2 | |
| Apple MacBook Pro 15 2016 (2.9 GHz, 460) | |
| Asus VivoBook S15 S510UA | |
| HP Pavilion 15t-au100 CTO (W0P31AV) | |
| Work Score Accelerated v2 | |
| Apple MacBook Pro 15 2016 (2.9 GHz, 460) | |
| Asus VivoBook S15 S510UA | |
| HP Pavilion 15t-au100 CTO (W0P31AV) | |
| Creative Score Accelerated v2 | |
| Apple MacBook Pro 15 2016 (2.9 GHz, 460) | |
| Asus VivoBook S15 S510UA | |
| HP Pavilion 15t-au100 CTO (W0P31AV) | |
| PCMark 8 Home Score Accelerated v2 | 3831 pontos | |
| PCMark 8 Creative Score Accelerated v2 | 4627 pontos | |
| PCMark 8 Work Score Accelerated v2 | 4746 pontos | |
Ajuda | ||
| Asus VivoBook S15 S510UA Toshiba HG6 THNSNJ128G8NY | Lenovo V510-15IKB 80WQ0002GE Samsung CM871a MZNTY256HDHP | HP Pavilion 15t-au100 CTO (W0P31AV) Toshiba MQ01ABD100 | Apple MacBook Pro 15 2016 (2.9 GHz, 460) Apple SSD SM1024L | Dell Inspiron 15 7000 7567 Intel SSDSCKKF256H6 | |
|---|---|---|---|---|---|
| CrystalDiskMark 3.0 | 51% | -91% | 165% | 29% | |
| Read Seq (MB/s) | 503 | 532 6% | 109.5 -78% | 1458 190% | 485.8 -3% |
| Write Seq (MB/s) | 396 | 511 29% | 105.2 -73% | 1440 264% | 422.8 7% |
| Read 512 (MB/s) | 417.7 | 414.8 -1% | 34.08 -92% | 914 119% | 338.9 -19% |
| Write 512 (MB/s) | 342 | 307.7 -10% | 40.02 -88% | 1058 209% | 304 -11% |
| Read 4k (MB/s) | 19.48 | 39.51 103% | 0.429 -98% | 9.786 -50% | 27.11 39% |
| Write 4k (MB/s) | 64.6 | 108.1 67% | 1.008 -98% | 10.9 -83% | 85.4 32% |
| Read 4k QD32 (MB/s) | 250.3 | 361.6 44% | 0.81 -100% | 679 171% | 279.6 12% |
| Write 4k QD32 (MB/s) | 94.3 | 253 168% | 0.893 -99% | 562 496% | 255.1 171% |

| 3DMark | |
| 1280x720 Cloud Gate Standard Graphics | |
| Apple MacBook Pro 13 2016 (2.9 GHz) | |
| HP Spectre x360 15-bl002xx | |
| Asus VivoBook S15 S510UA | |
| Acer TravelMate P249-M-5452 | |
| Dell Latitude 5280 | |
| HP 250 G4 T6P08ES | |
| HP EliteBook 725 G4 | |
| 1920x1080 Fire Strike Graphics | |
| HP Spectre x360 15-bl002xx | |
| Apple MacBook Pro 13 2016 (2.9 GHz) | |
| HP EliteBook 725 G4 | |
| HP EliteBook 725 G4 | |
| Asus VivoBook S15 S510UA | |
| HP 250 G4 T6P08ES | |
| Acer TravelMate P249-M-5452 | |
| Dell Latitude 5280 | |
| 1920x1080 Ice Storm Extreme Graphics | |
| Asus VivoBook S15 S510UA | |
| Acer TravelMate P249-M-5452 | |
| Dell Latitude 5280 | |
| HP Spectre x360 15-bl002xx | |
| HP EliteBook 725 G4 | |
| 3DMark 11 Performance | 1768 pontos | |
| 3DMark Ice Storm Standard Score | 69286 pontos | |
| 3DMark Cloud Gate Standard Score | 6704 pontos | |
| 3DMark Fire Strike Score | 965 pontos | |
| 3DMark Fire Strike Extreme Score | 449 pontos | |
Ajuda | ||
| baixo | média | alto | ultra | |
|---|---|---|---|---|
| BioShock Infinite (2013) | 62.7 | 33.9 | 28.6 | 8.8 |
| Dota 2 Reborn (2015) | 82 | 56 | 20 |
Barulho
| Ocioso |
| 30.2 / 30.2 / 30.2 dB |
| HDD |
| 30.2 dB |
| Carga |
| 36.9 / 37 dB |
 | ||
30 dB silencioso 40 dB(A) audível 50 dB(A) ruidosamente alto |
||
min: | ||
| Asus VivoBook S15 S510UA HD Graphics 620, i5-7200U, Toshiba HG6 THNSNJ128G8NY | Lenovo V510-15IKB 80WQ0002GE HD Graphics 620, i5-7200U, Samsung CM871a MZNTY256HDHP | HP Pavilion 15t-au100 CTO (W0P31AV) GeForce 940MX, i7-7500U, Toshiba MQ01ABD100 | Apple MacBook Pro 15 2016 (2.9 GHz, 460) Radeon Pro 460, 6920HQ, Apple SSD SM1024L | Dell Inspiron 15 7000 7567 GeForce GTX 1050 Ti Mobile, i7-7700HQ, Intel SSDSCKKF256H6 | |
|---|---|---|---|---|---|
| Noise | 0% | -9% | -4% | -11% | |
| desligado / ambiente * (dB) | 28.2 | 30.2 -7% | 29 -3% | 30.3 -7% | |
| Idle Minimum * (dB) | 30.2 | 30.2 -0% | 32.2 -7% | 30.3 -0% | 30.9 -2% |
| Idle Average * (dB) | 30.2 | 30.2 -0% | 32.2 -7% | 30.3 -0% | 30.9 -2% |
| Idle Maximum * (dB) | 30.2 | 32 -6% | 33.7 -12% | 30.3 -0% | 31 -3% |
| Load Average * (dB) | 36.9 | 34.7 6% | 39.4 -7% | 35.1 5% | 46.5 -26% |
| Load Maximum * (dB) | 37 | 33.9 8% | 42.2 -14% | 46 -24% | 46.8 -26% |
* ... menor é melhor
(-) A temperatura máxima no lado superior é 46 °C / 115 F, em comparação com a média de 36.8 °C / 98 F , variando de 21 a 71 °C para a classe Multimedia.
(±) A parte inferior aquece até um máximo de 45 °C / 113 F, em comparação com a média de 39.1 °C / 102 F
(+) Em uso inativo, a temperatura média para o lado superior é 23.5 °C / 74 F, em comparação com a média do dispositivo de 31.3 °C / ### class_avg_f### F.
(+) Os apoios para as mãos e o touchpad estão atingindo a temperatura máxima da pele (32.4 °C / 90.3 F) e, portanto, não estão quentes.
(-) A temperatura média da área do apoio para as mãos de dispositivos semelhantes foi 28.7 °C / 83.7 F (-3.7 °C / -6.6 F).
Asus VivoBook S15 S510UA análise de áudio
(-) | alto-falantes não muito altos (###valor### dB)
Graves 100 - 315Hz
(-) | quase nenhum baixo - em média 15.3% menor que a mediana
(±) | a linearidade dos graves é média (12.2% delta para a frequência anterior)
Médios 400 - 2.000 Hz
(+) | médios equilibrados - apenas 1.6% longe da mediana
(+) | médios são lineares (6.8% delta para frequência anterior)
Altos 2 - 16 kHz
(+) | agudos equilibrados - apenas 3.8% longe da mediana
(±) | a linearidade dos máximos é média (10.6% delta para frequência anterior)
Geral 100 - 16.000 Hz
(±) | a linearidade do som geral é média (19.8% diferença em relação à mediana)
Comparado com a mesma classe
» 65% de todos os dispositivos testados nesta classe foram melhores, 6% semelhantes, 28% piores
» O melhor teve um delta de 5%, a média foi 17%, o pior foi 45%
Comparado com todos os dispositivos testados
» 51% de todos os dispositivos testados foram melhores, 7% semelhantes, 42% piores
» O melhor teve um delta de 4%, a média foi 23%, o pior foi 134%
Apple MacBook 12 (Early 2016) 1.1 GHz análise de áudio
(+) | os alto-falantes podem tocar relativamente alto (###valor### dB)
Graves 100 - 315Hz
(±) | graves reduzidos - em média 11.3% menor que a mediana
(±) | a linearidade dos graves é média (14.2% delta para a frequência anterior)
Médios 400 - 2.000 Hz
(+) | médios equilibrados - apenas 2.4% longe da mediana
(+) | médios são lineares (5.5% delta para frequência anterior)
Altos 2 - 16 kHz
(+) | agudos equilibrados - apenas 2% longe da mediana
(+) | os máximos são lineares (4.5% delta da frequência anterior)
Geral 100 - 16.000 Hz
(+) | o som geral é linear (10.2% diferença em relação à mediana)
Comparado com a mesma classe
» 7% de todos os dispositivos testados nesta classe foram melhores, 2% semelhantes, 90% piores
» O melhor teve um delta de 5%, a média foi 18%, o pior foi 53%
Comparado com todos os dispositivos testados
» 5% de todos os dispositivos testados foram melhores, 1% semelhantes, 94% piores
» O melhor teve um delta de 4%, a média foi 23%, o pior foi 134%
| desligado | |
| Ocioso | |
| Carga |
|
Key:
min: | |
| Asus VivoBook S15 S510UA i5-7200U, HD Graphics 620, Toshiba HG6 THNSNJ128G8NY, IPS, 1920x1080, 15.6" | Lenovo V510-15IKB 80WQ0002GE i5-7200U, HD Graphics 620, Samsung CM871a MZNTY256HDHP, IPS, 1920x1080, 15.6" | HP Pavilion 15t-au100 CTO (W0P31AV) i7-7500U, GeForce 940MX, Toshiba MQ01ABD100, IPS, 1920x1080, 15.6" | Apple MacBook Pro 15 2016 (2.9 GHz, 460) 6920HQ, Radeon Pro 460, Apple SSD SM1024L, IPS, 2880x1800, 15.4" | HP Envy 15-as133cl i7-7500U, HD Graphics 620, HGST Travelstar 5K1000 HTS541010A7E630, IPS, 1920x1080, 15.6" | |
|---|---|---|---|---|---|
| Power Consumption | -5% | -33% | -62% | 10% | |
| Idle Minimum * (Watt) | 4.6 | 4 13% | 6.16 -34% | 3 35% | 4.6 -0% |
| Idle Average * (Watt) | 7.6 | 9.6 -26% | 8.48 -12% | 9.9 -30% | 7.7 -1% |
| Idle Maximum * (Watt) | 7.7 | 9.7 -26% | 9.62 -25% | 12.5 -62% | 7.8 -1% |
| Load Average * (Watt) | 35.1 | 27.7 21% | 41.63 -19% | 70.6 -101% | 30.5 13% |
| Load Maximum * (Watt) | 36.2 | 38.4 -6% | 63.22 -75% | 90.8 -151% | 22.7 37% |
* ... menor é melhor
| Asus VivoBook S15 S510UA i5-7200U, HD Graphics 620, 42 Wh | Lenovo V510-15IKB 80WQ0002GE i5-7200U, HD Graphics 620, 32 Wh | HP Pavilion 15t-au100 CTO (W0P31AV) i7-7500U, GeForce 940MX, 41 Wh | Apple MacBook Pro 15 2016 (2.9 GHz, 460) 6920HQ, Radeon Pro 460, 76 Wh | HP Envy 15-as133cl i7-7500U, HD Graphics 620, 52 Wh | |
|---|---|---|---|---|---|
| Duração da bateria | -12% | 3% | 58% | 17% | |
| Reader / Idle (h) | 10.2 | 7.3 -28% | 9.6 -6% | ||
| WiFi v1.3 (h) | 4.3 | 3.8 -12% | 3.7 -14% | 10.3 140% | 6.8 58% |
| Load (h) | 1.2 | 1.8 50% | 0.9 -25% | 1.2 0% |
Pro
Contra
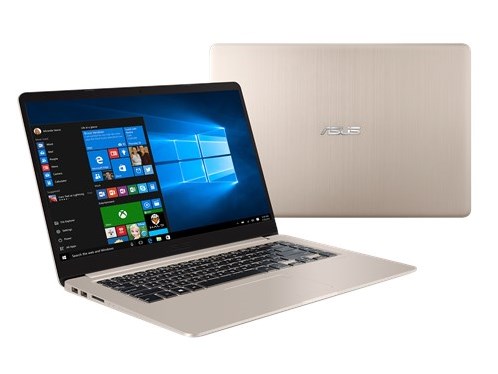

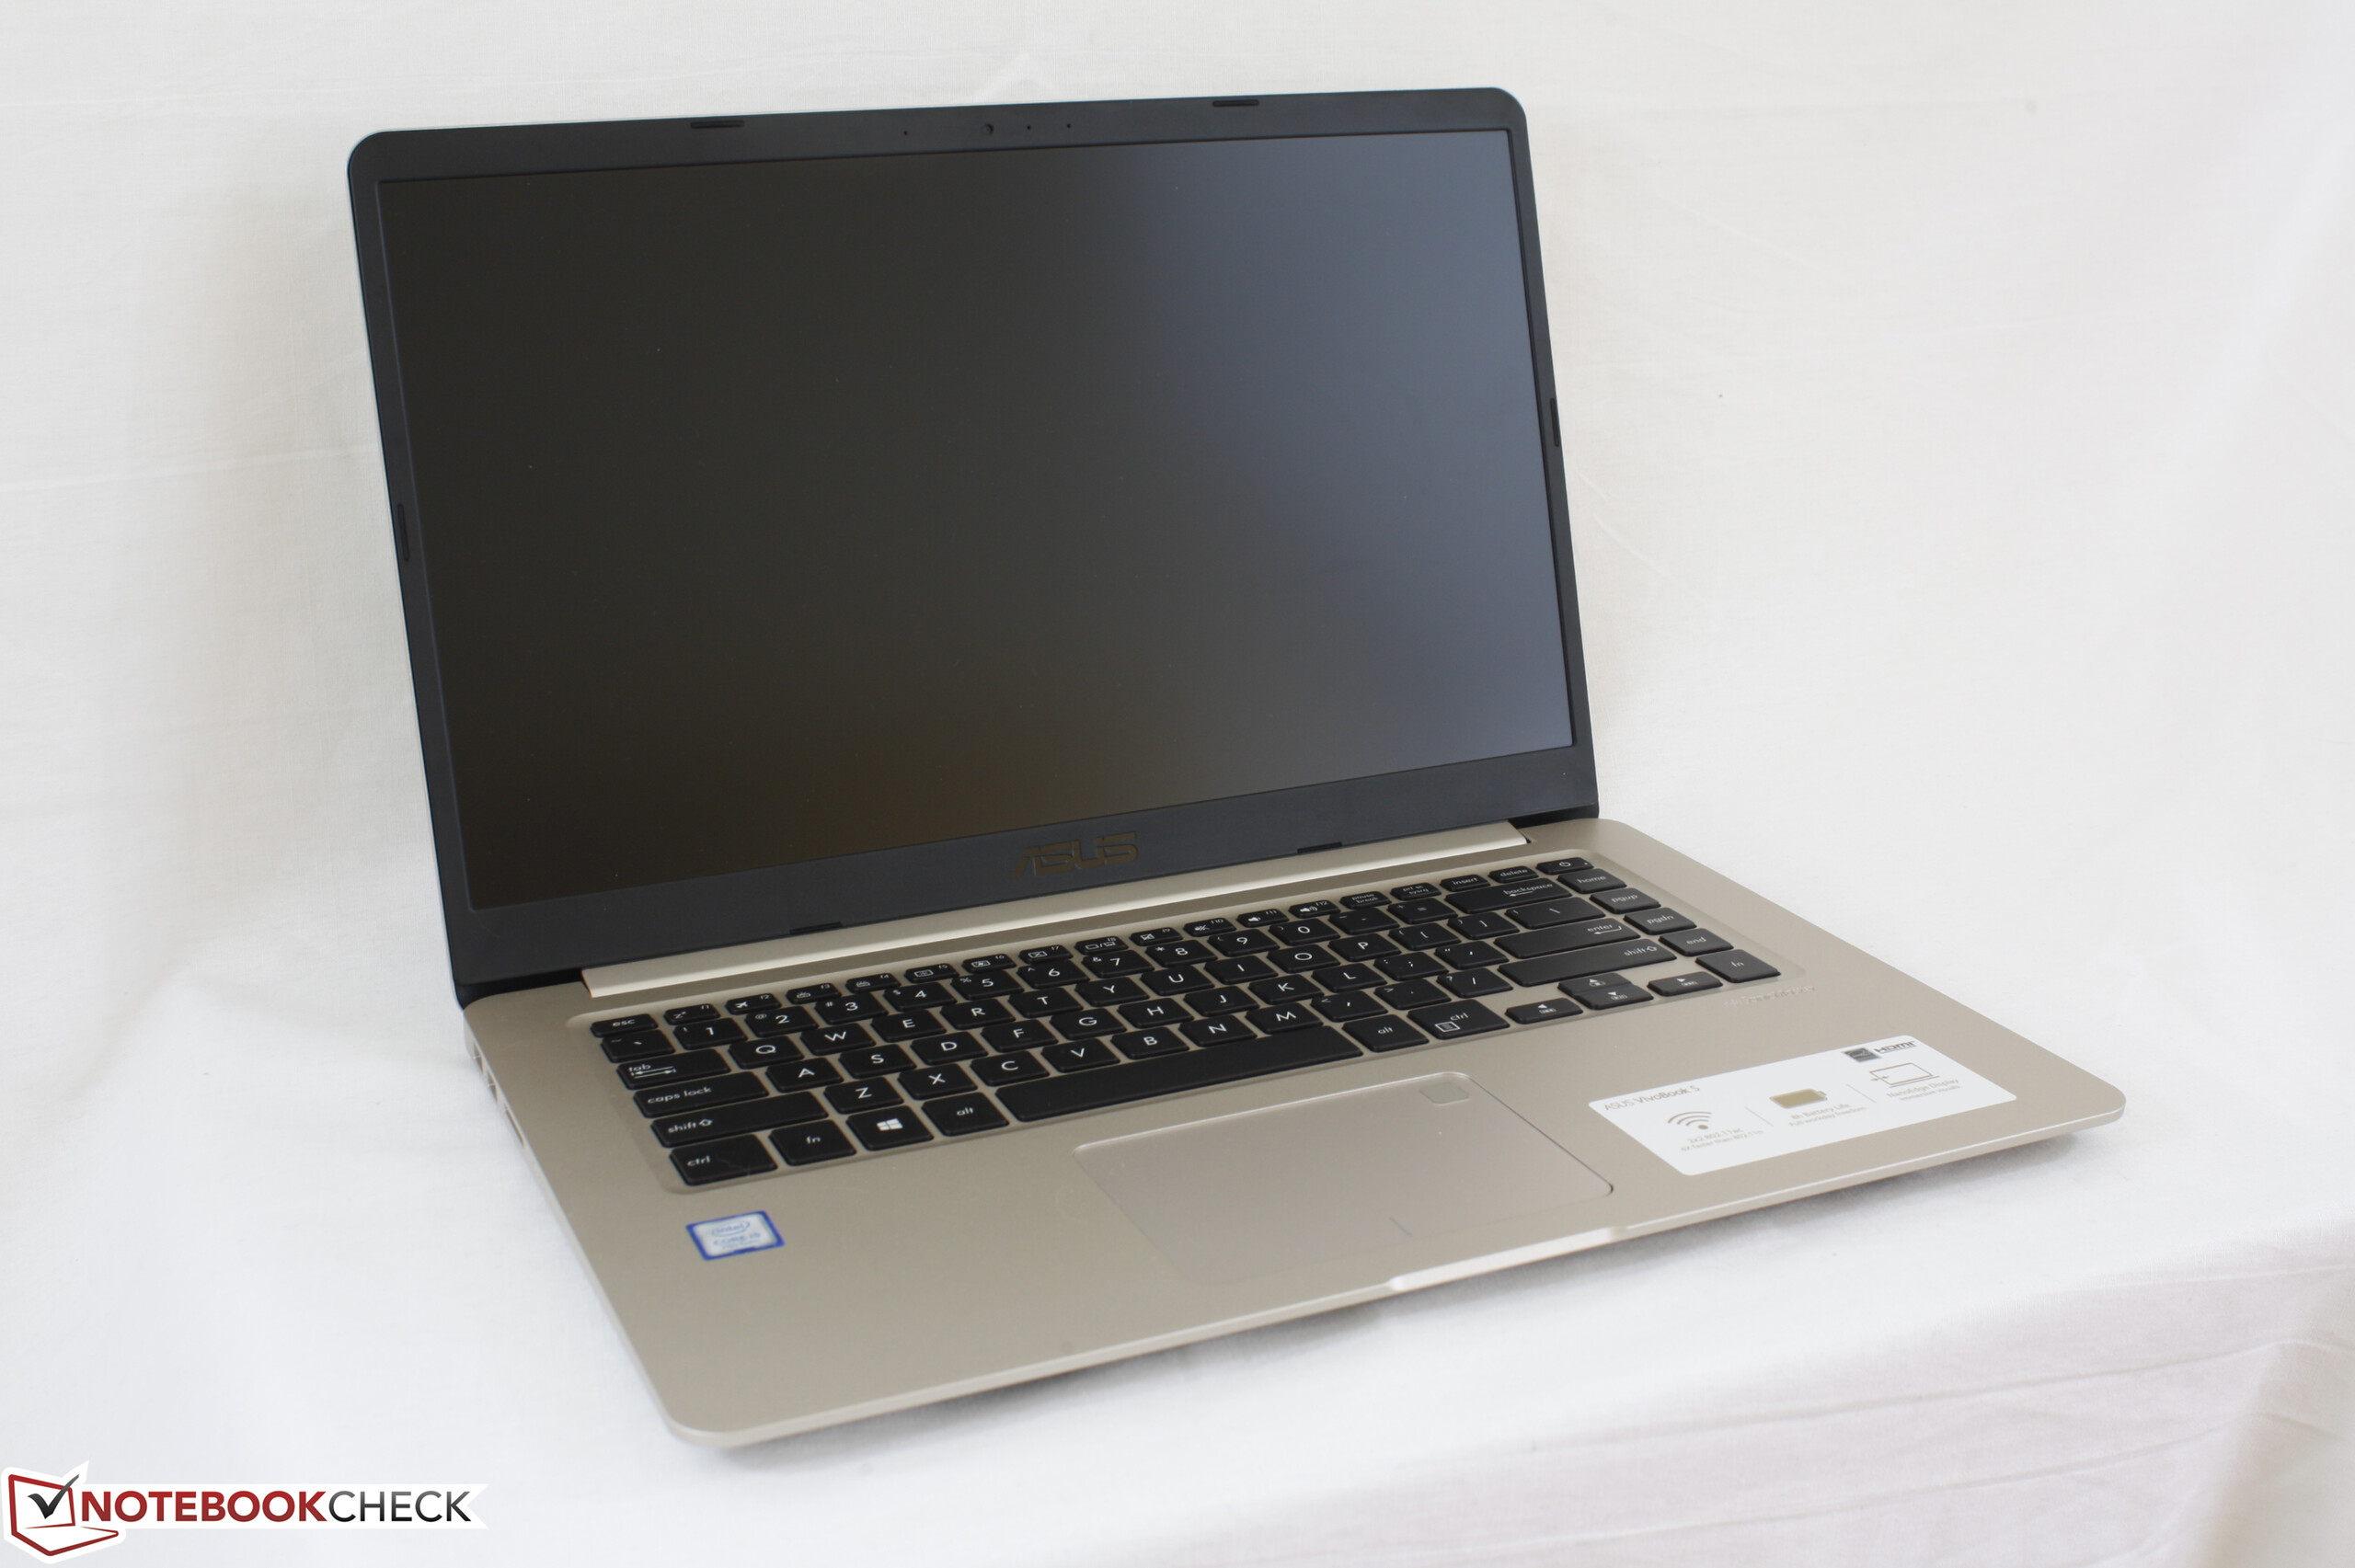
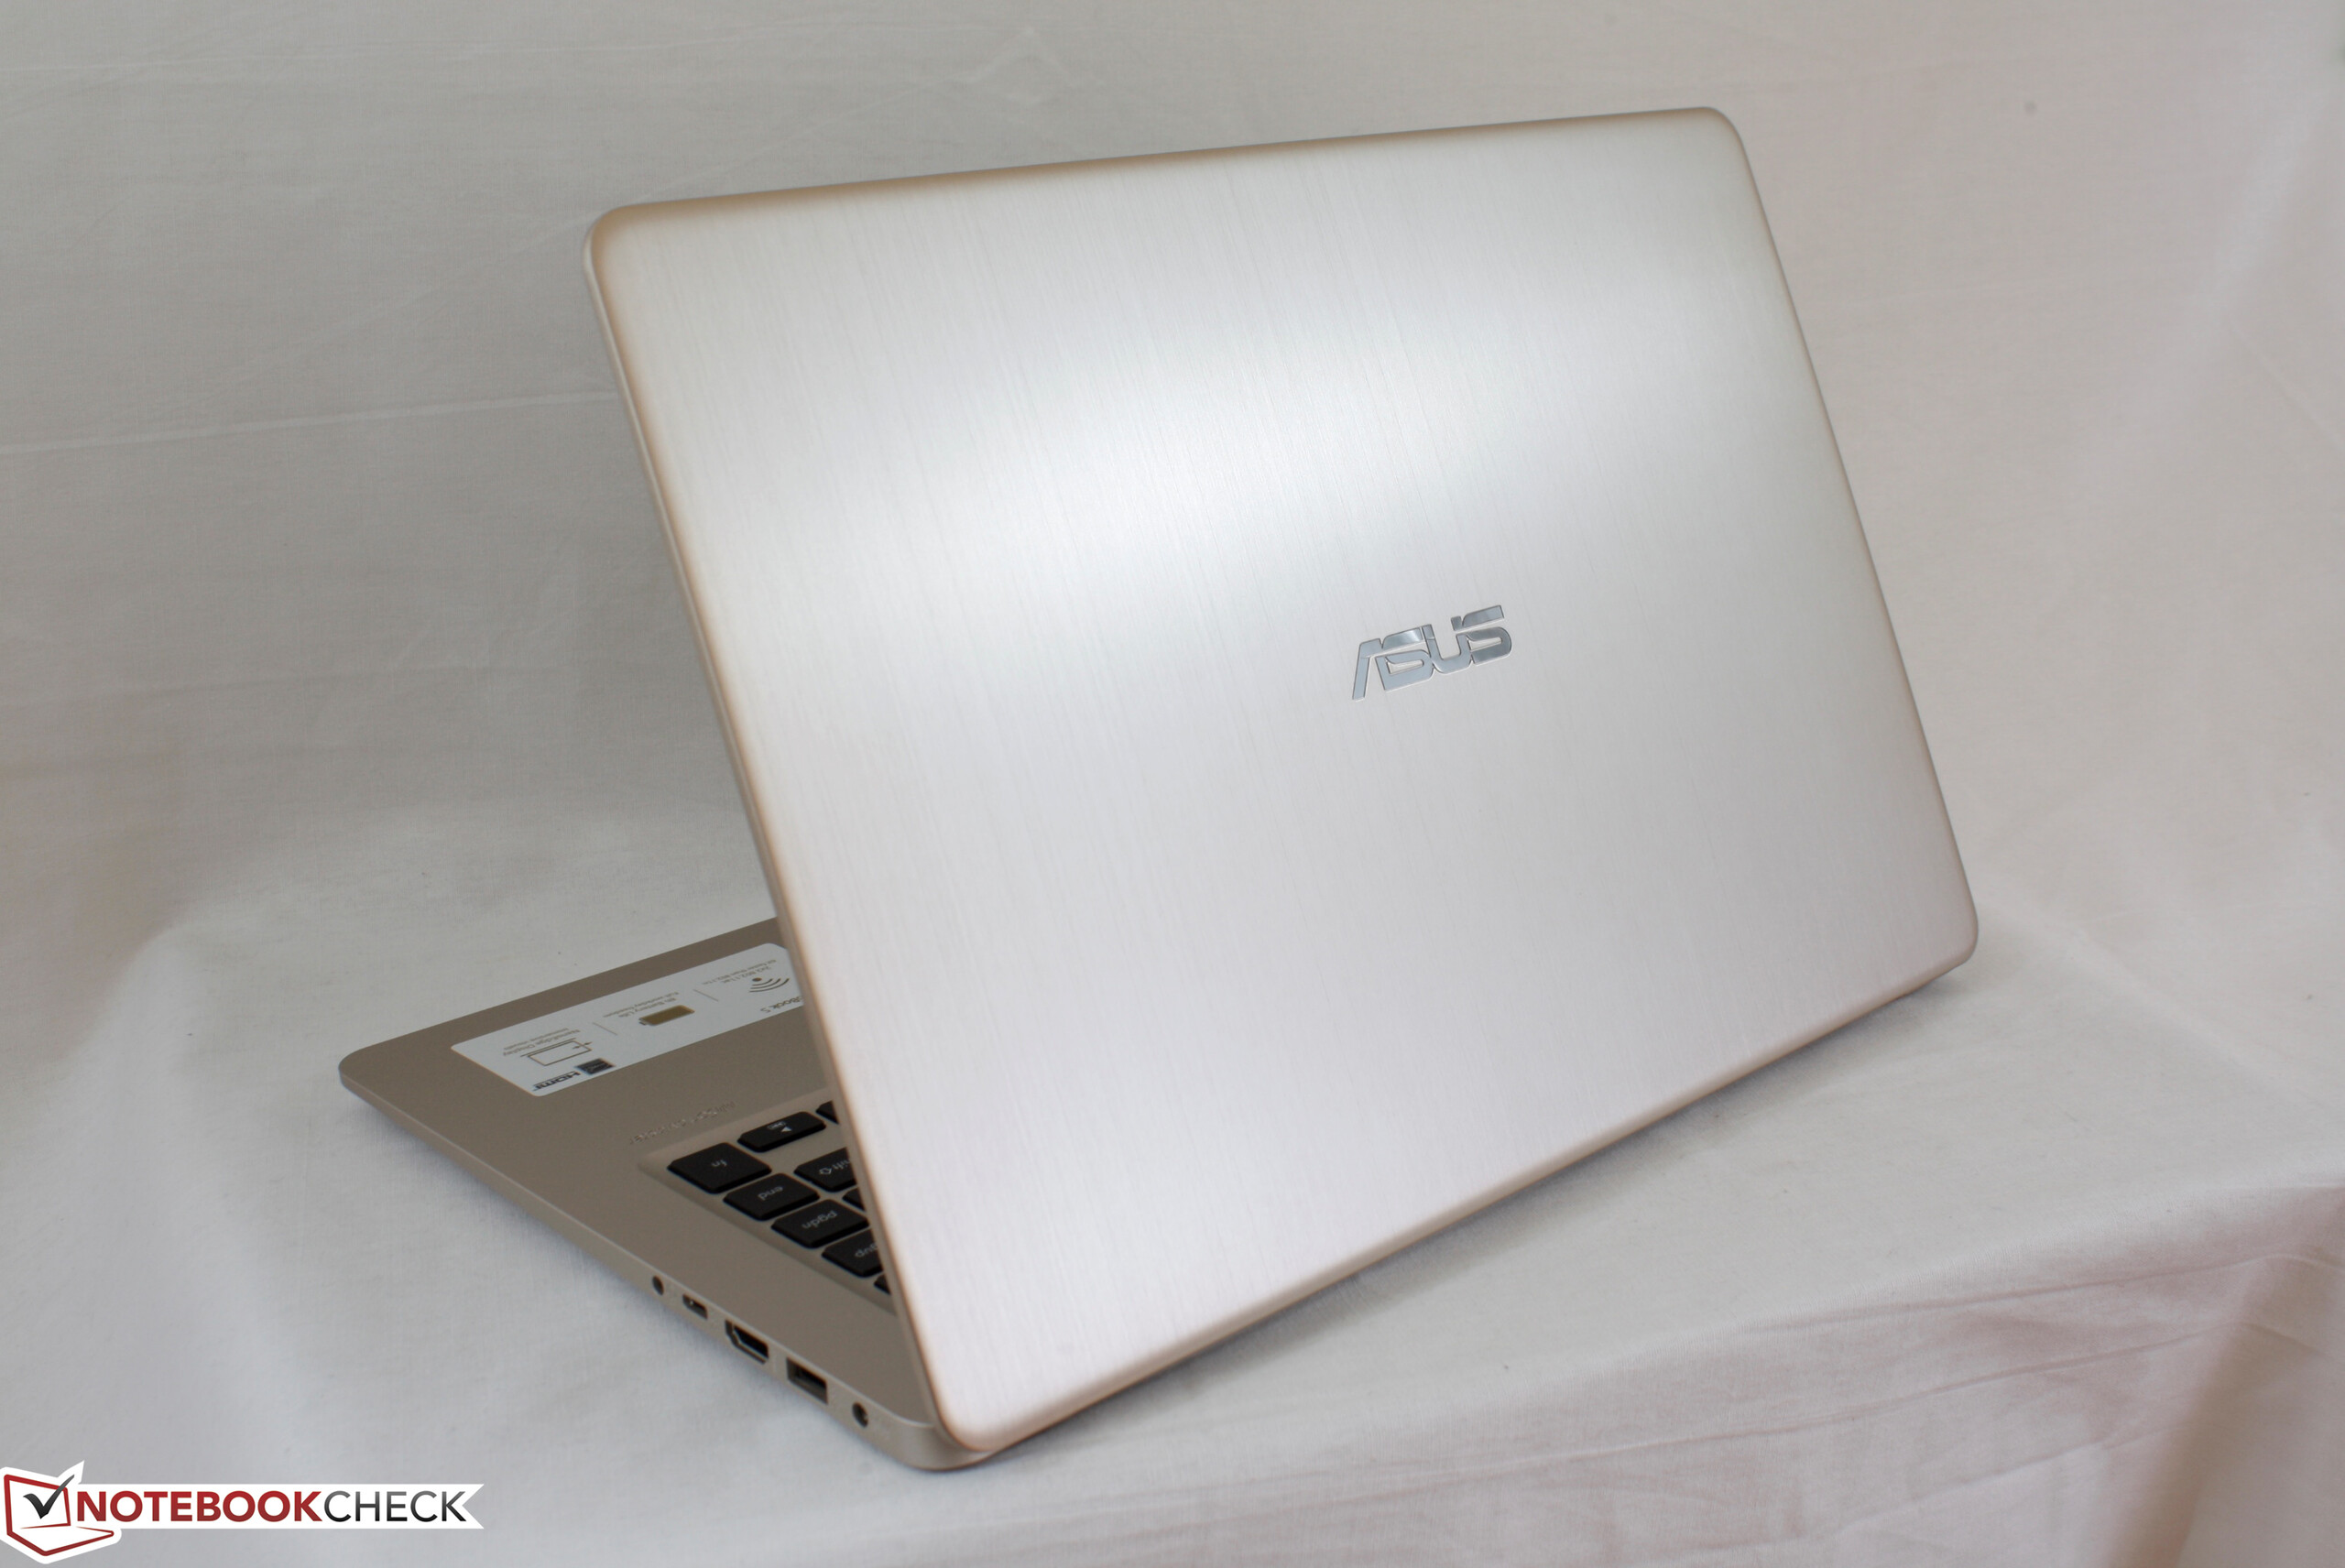
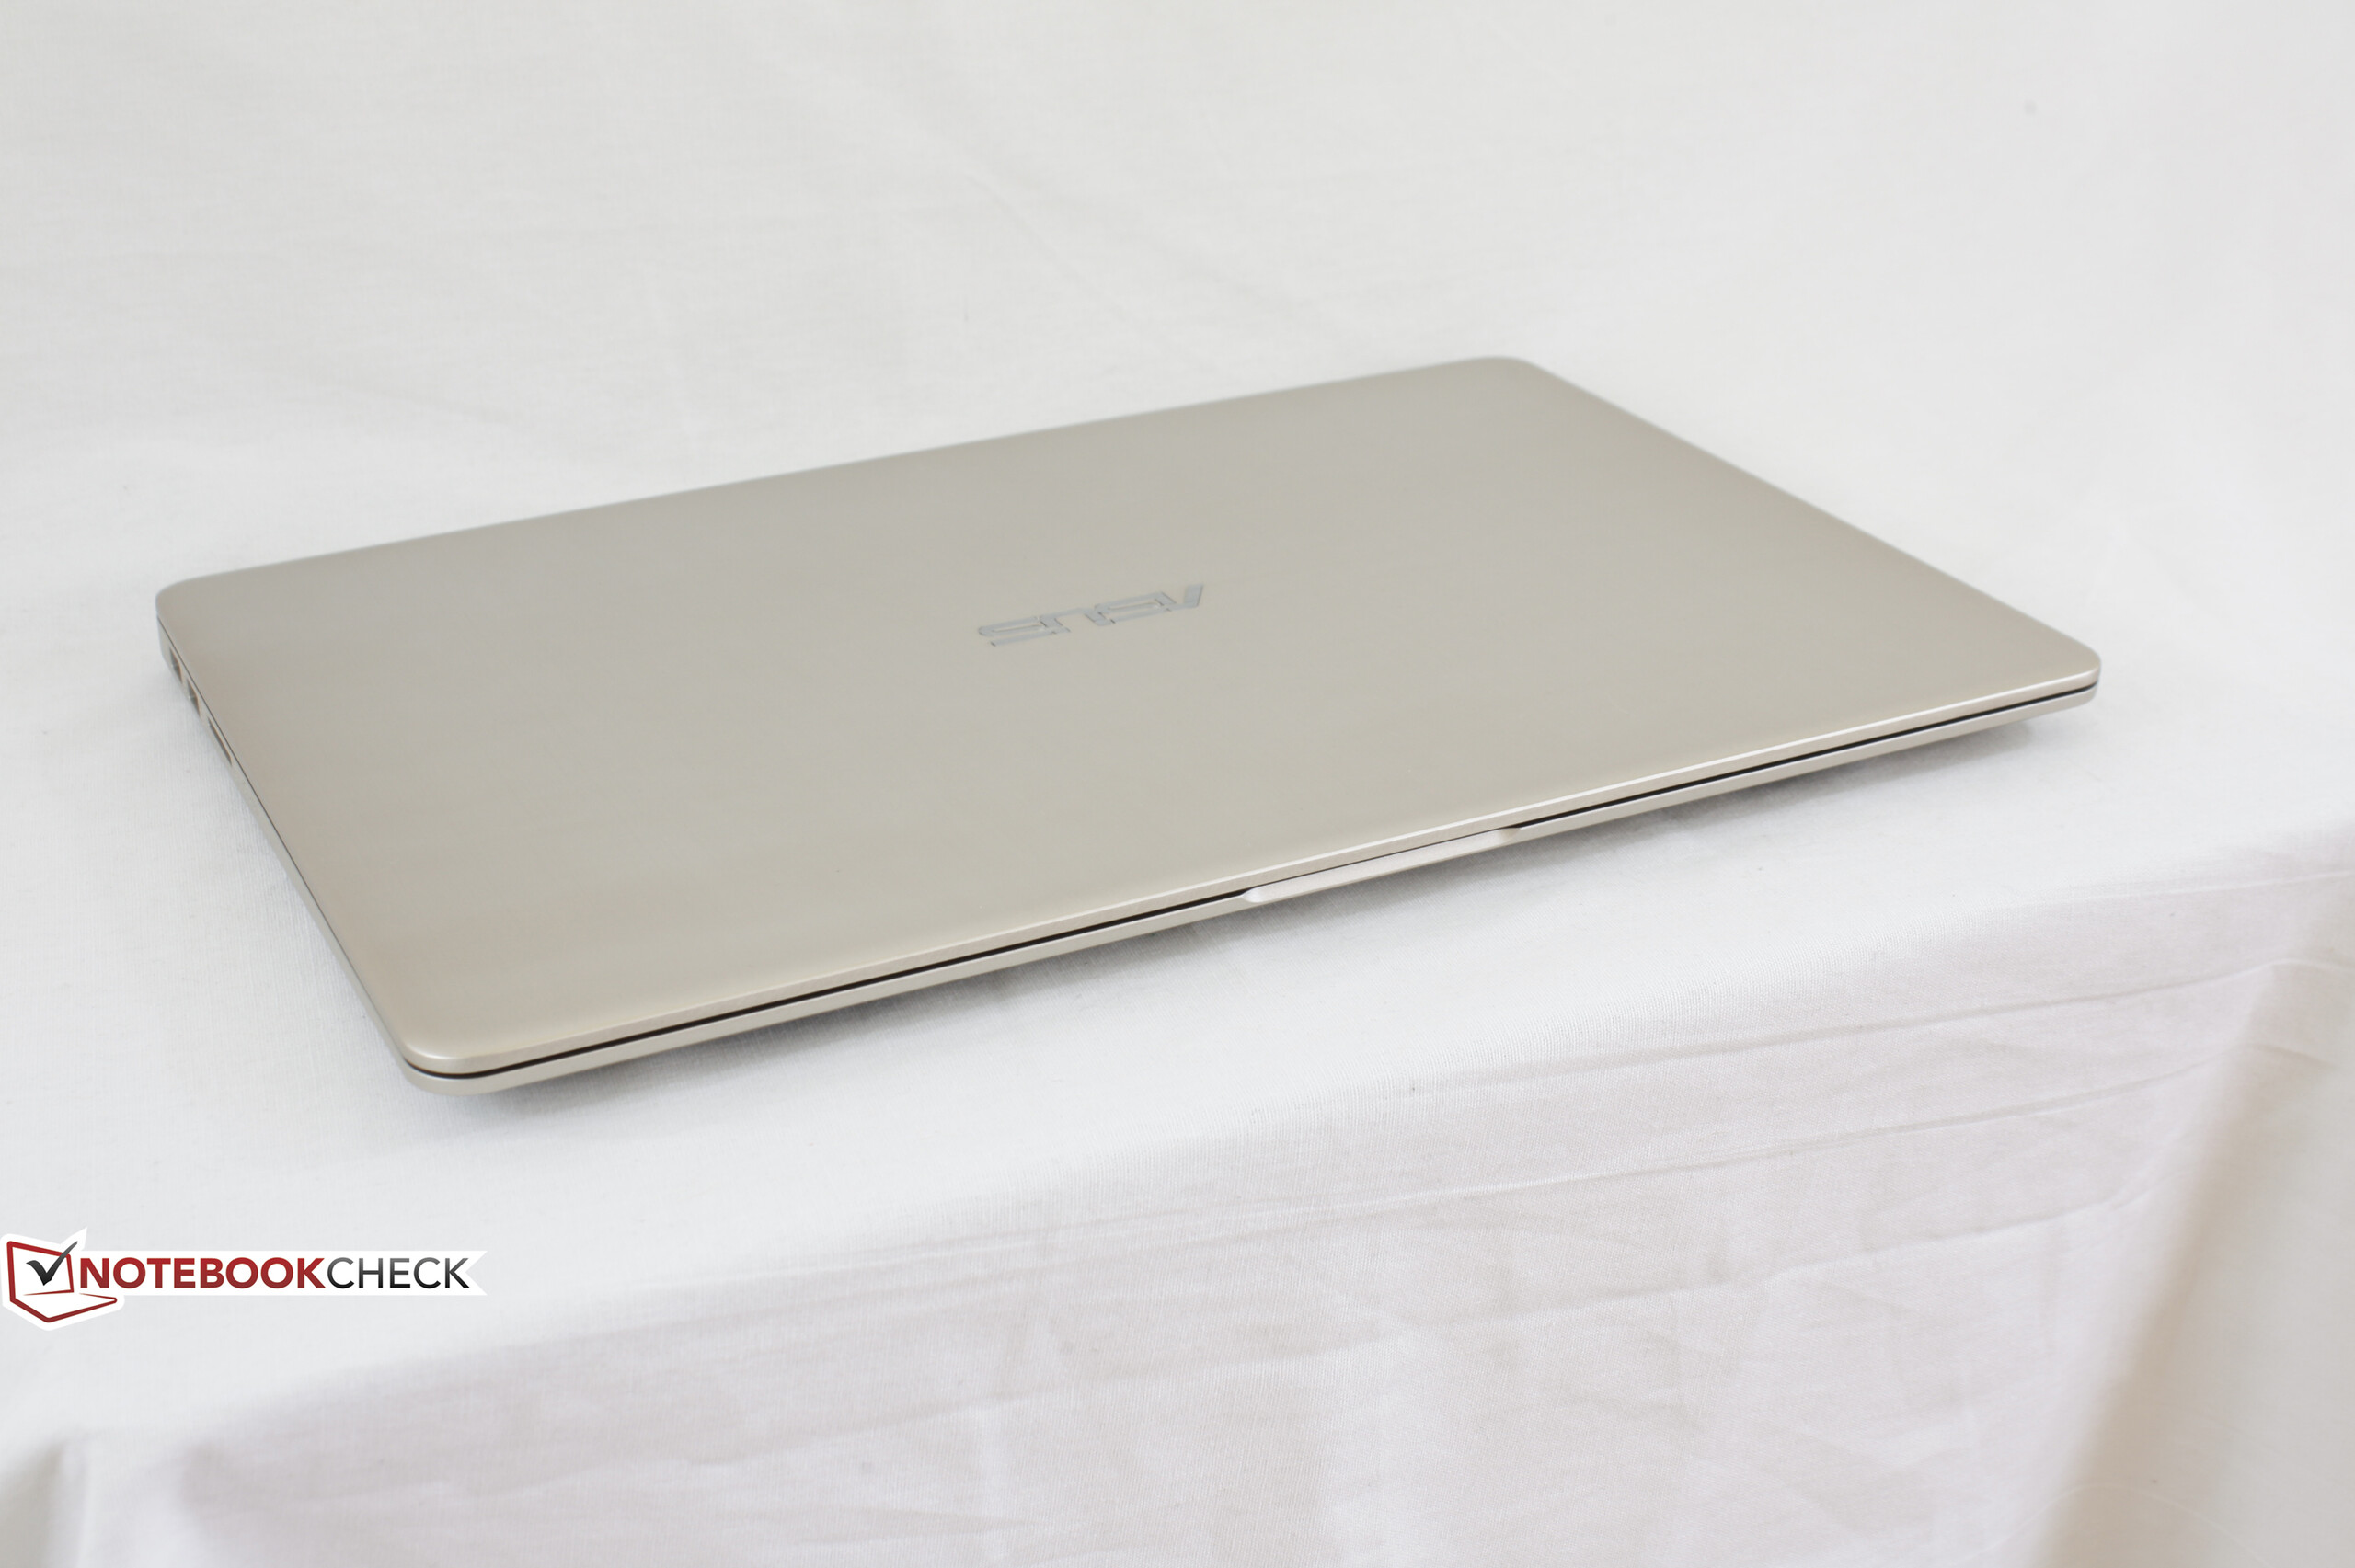
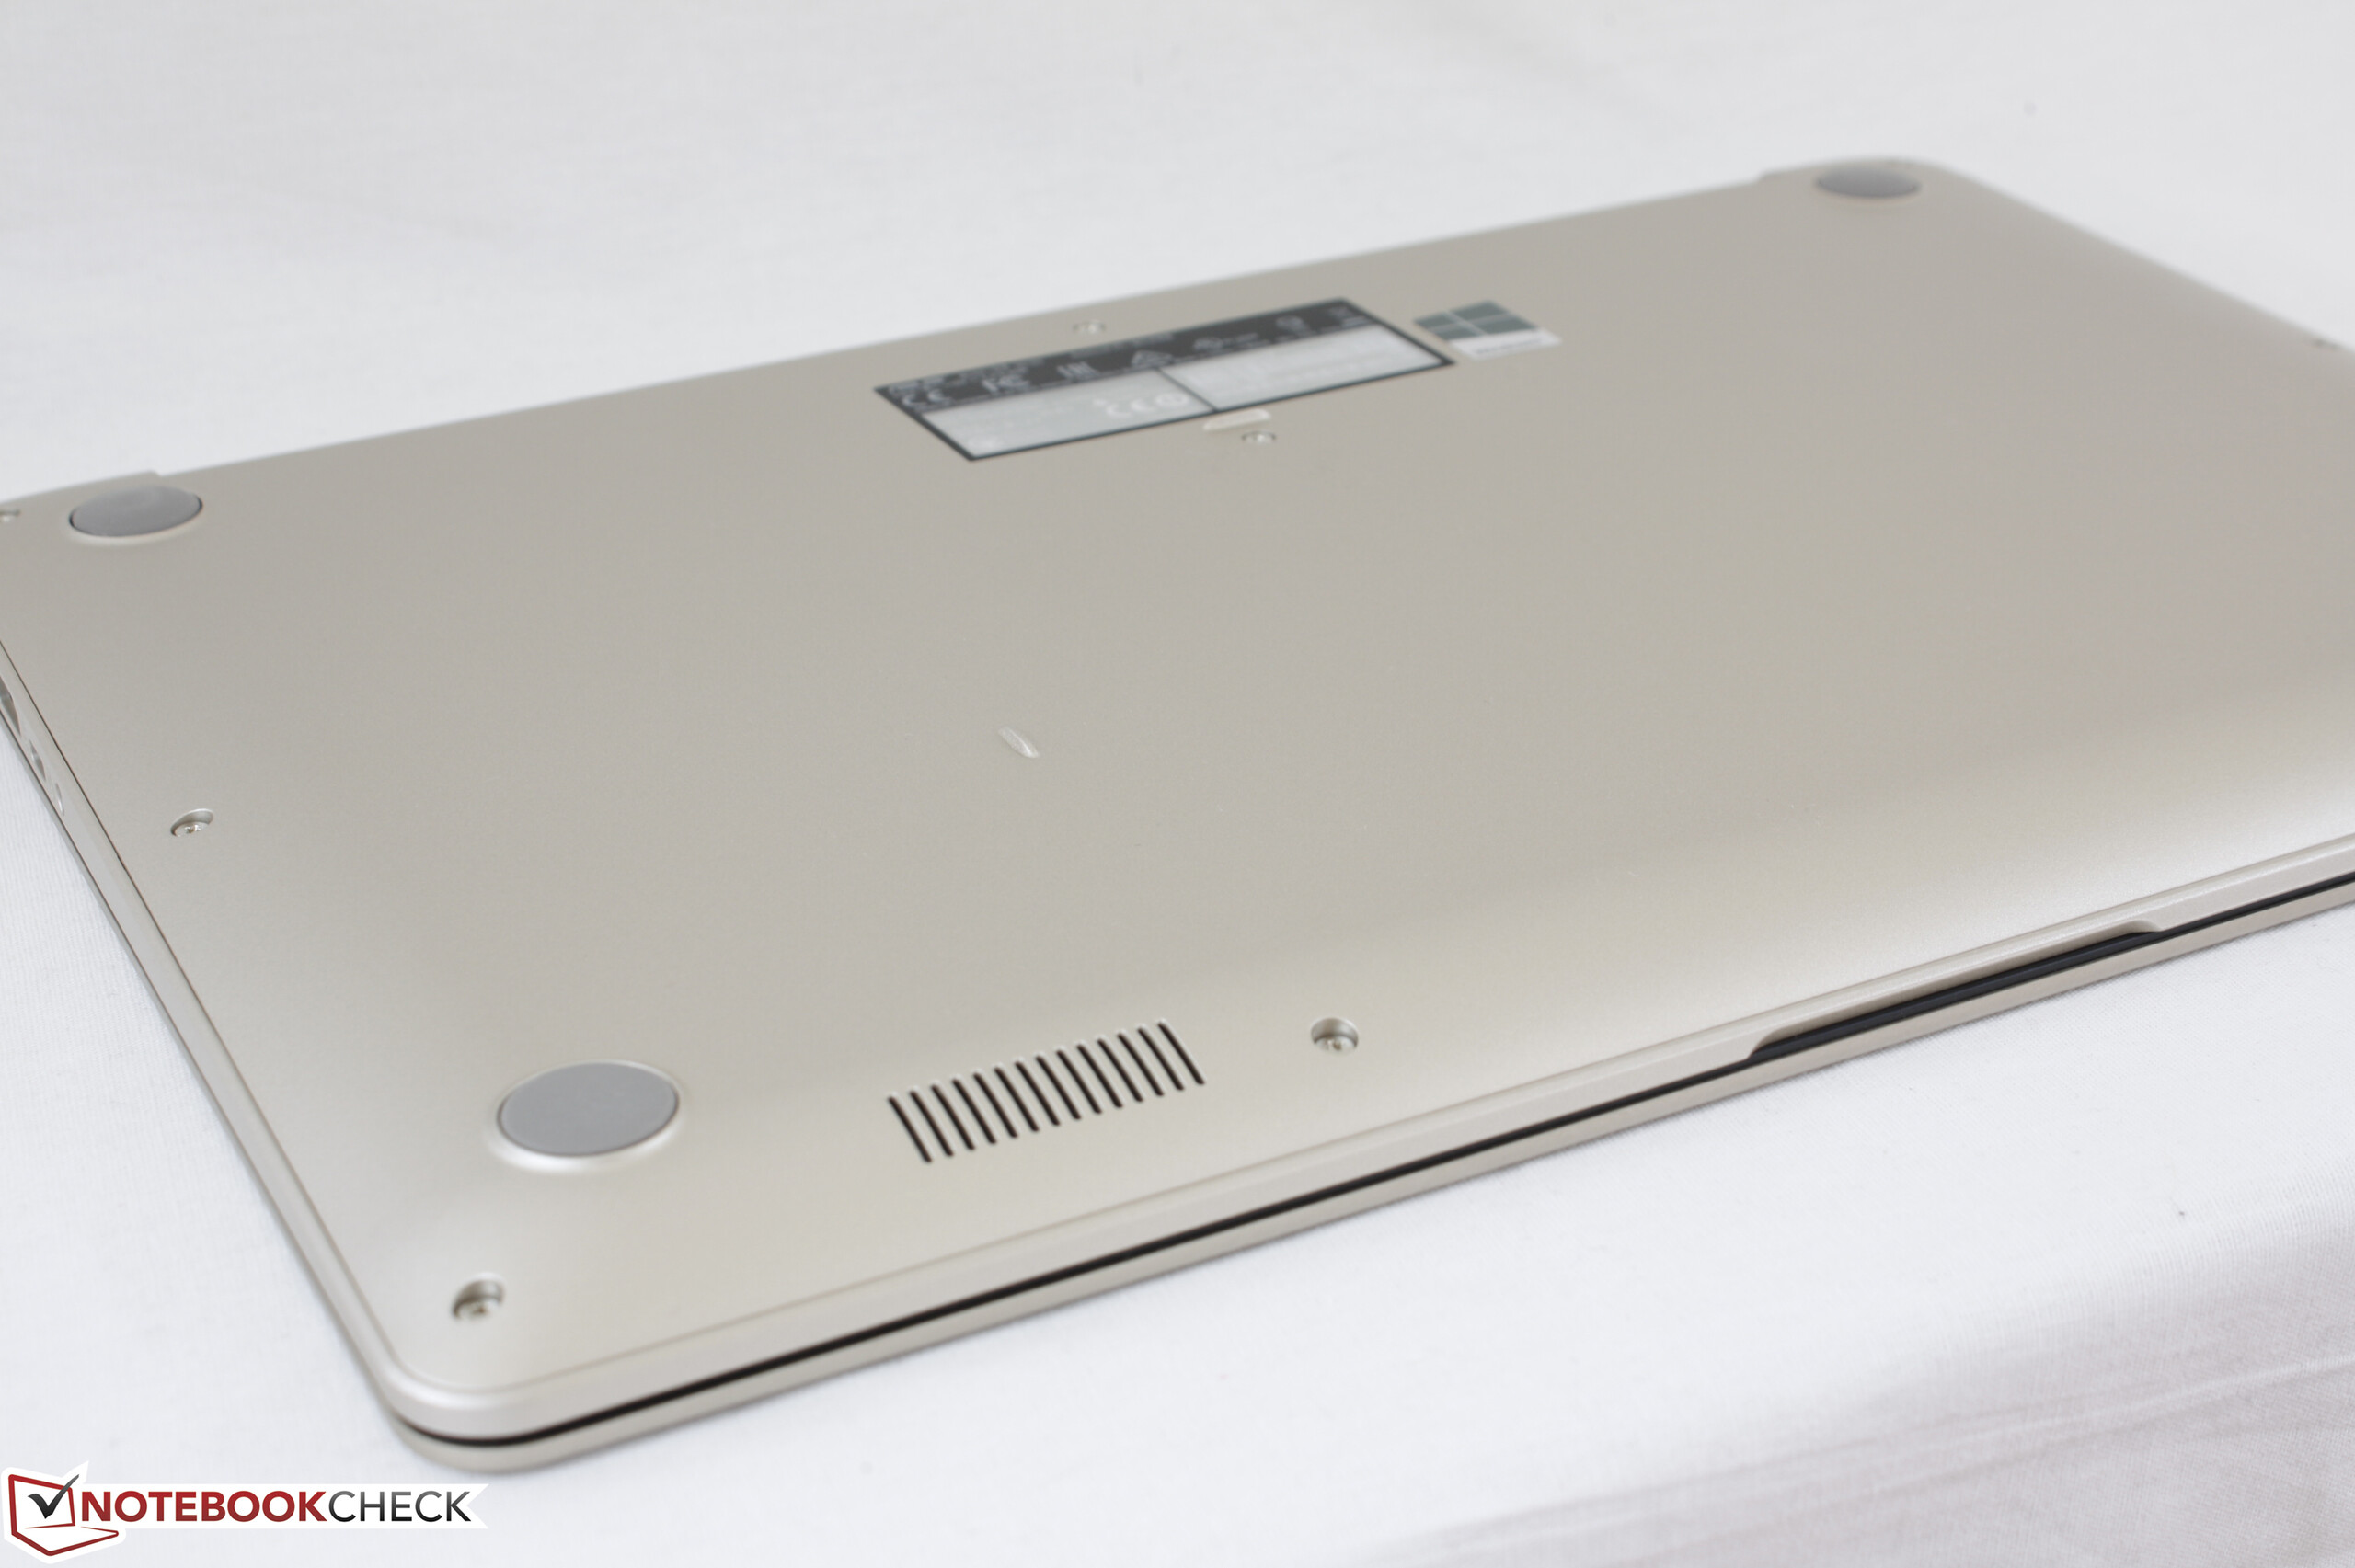
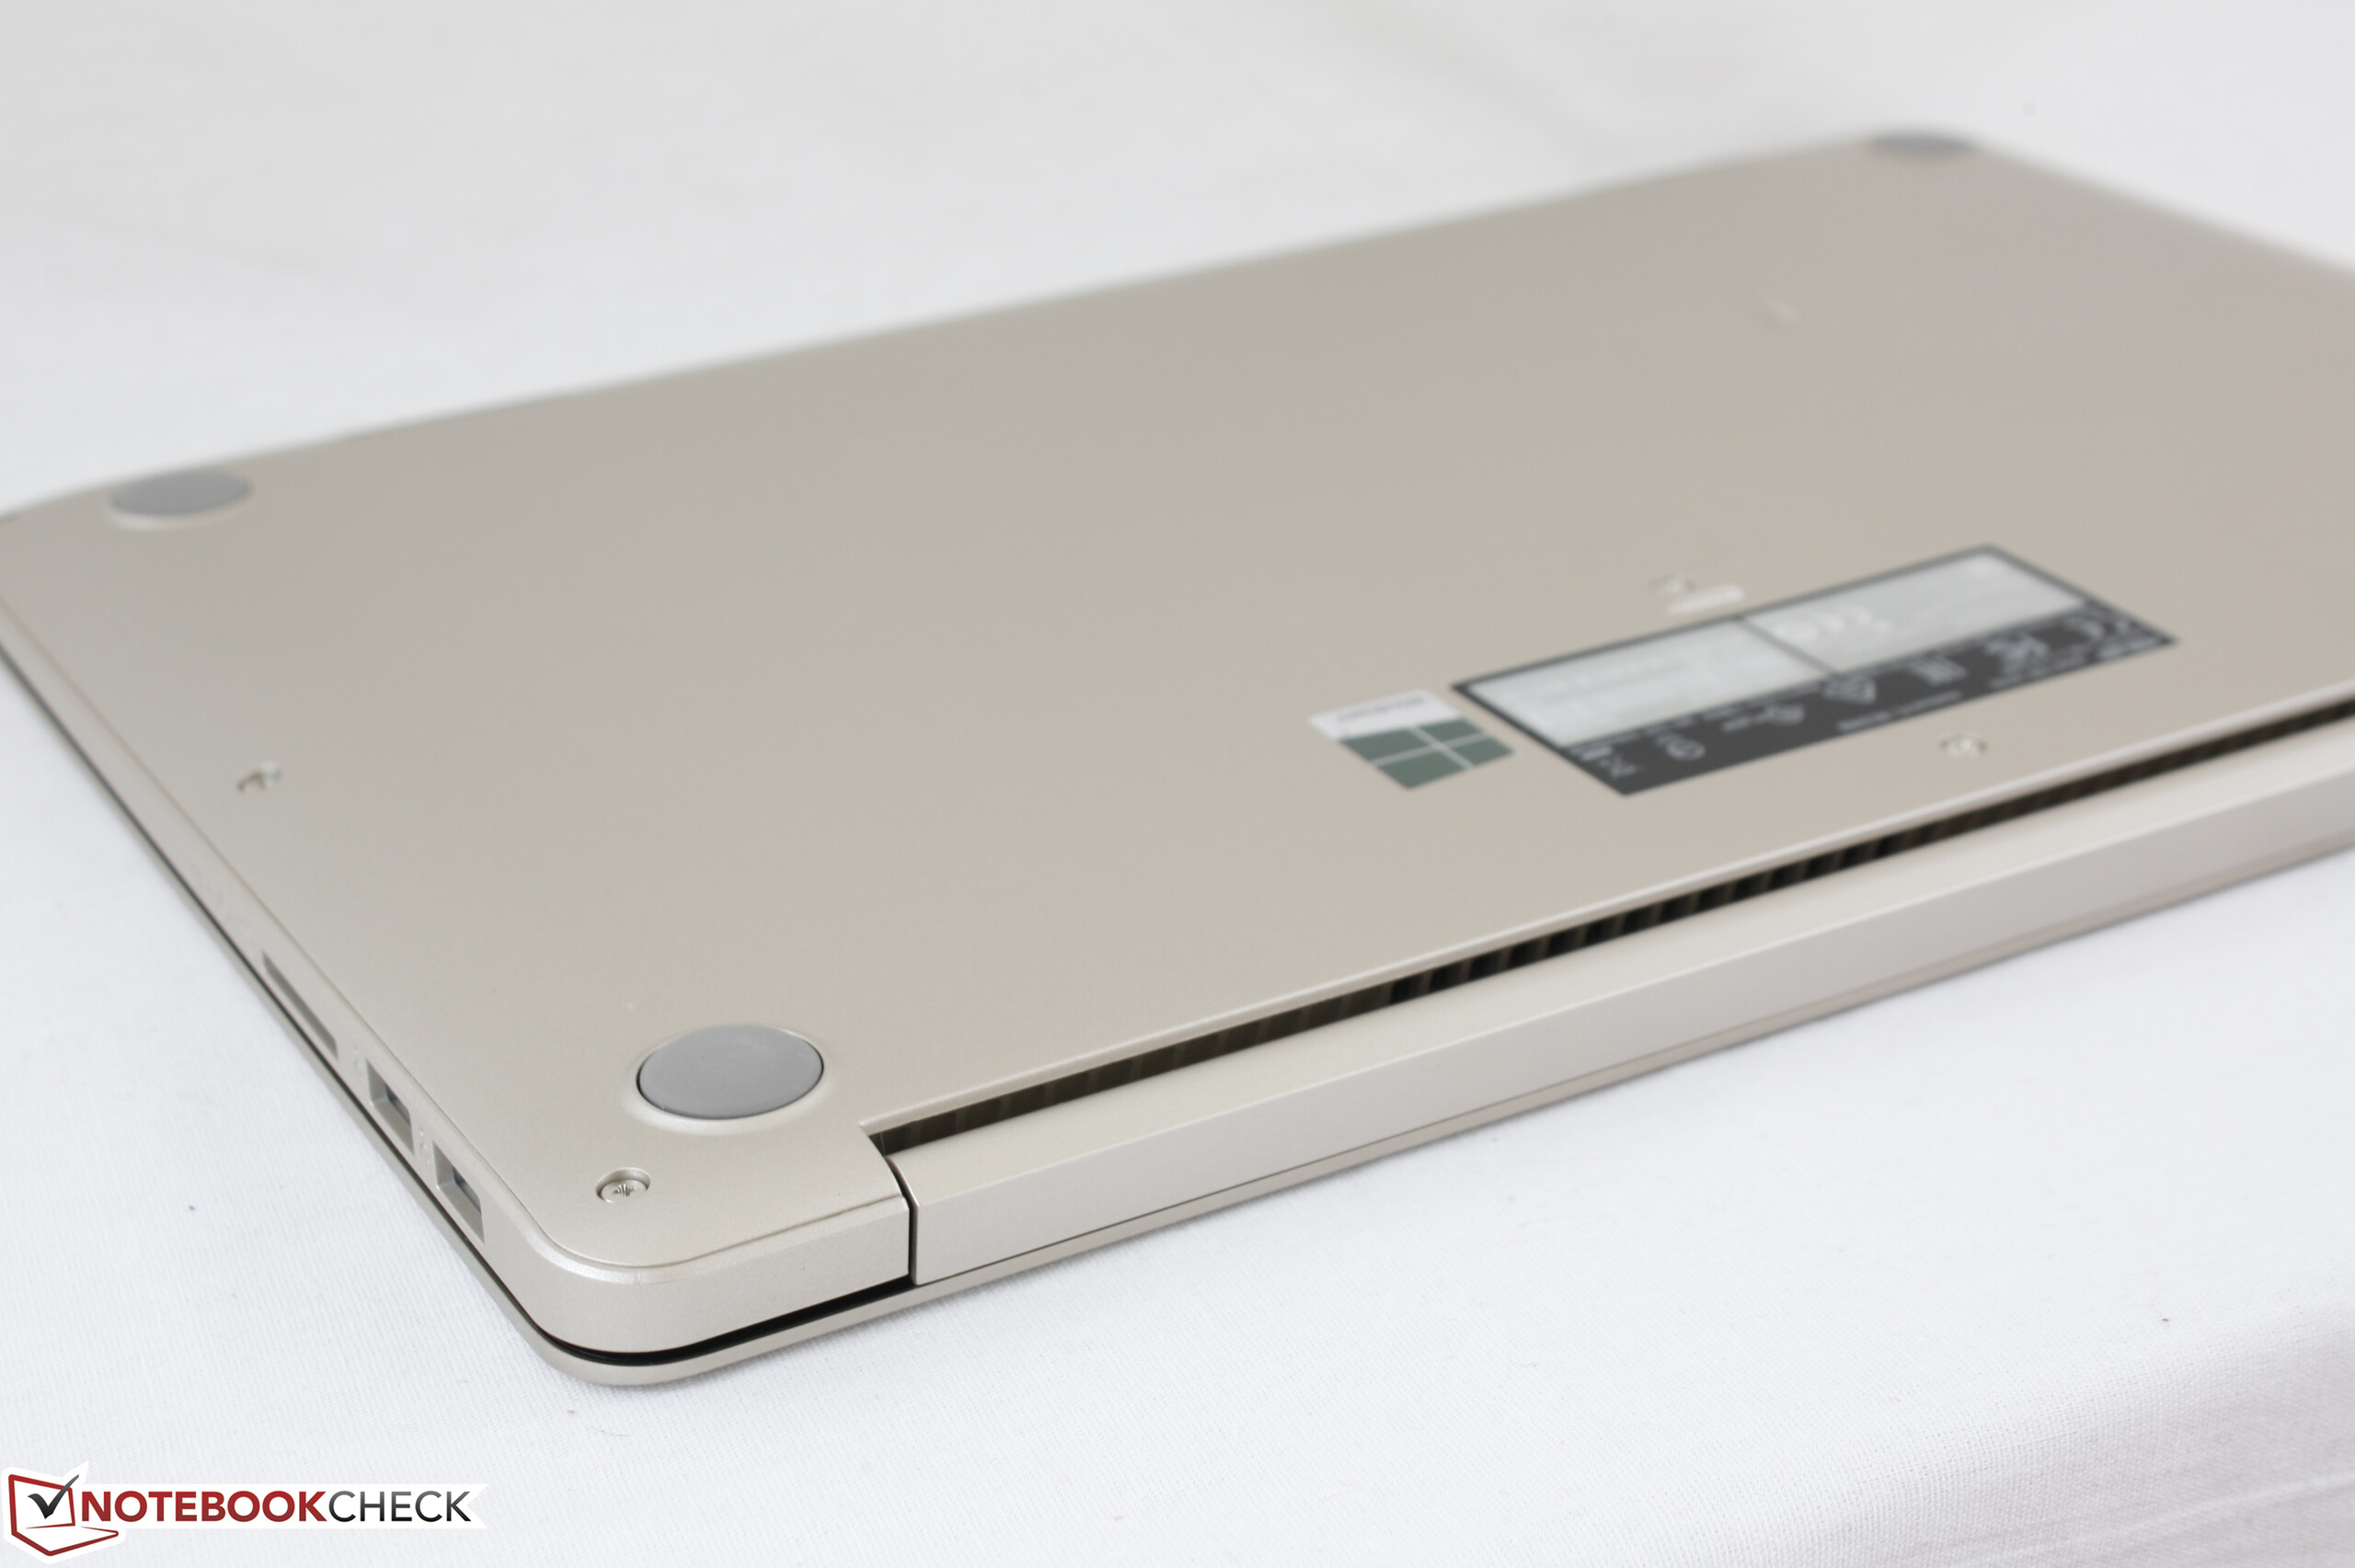
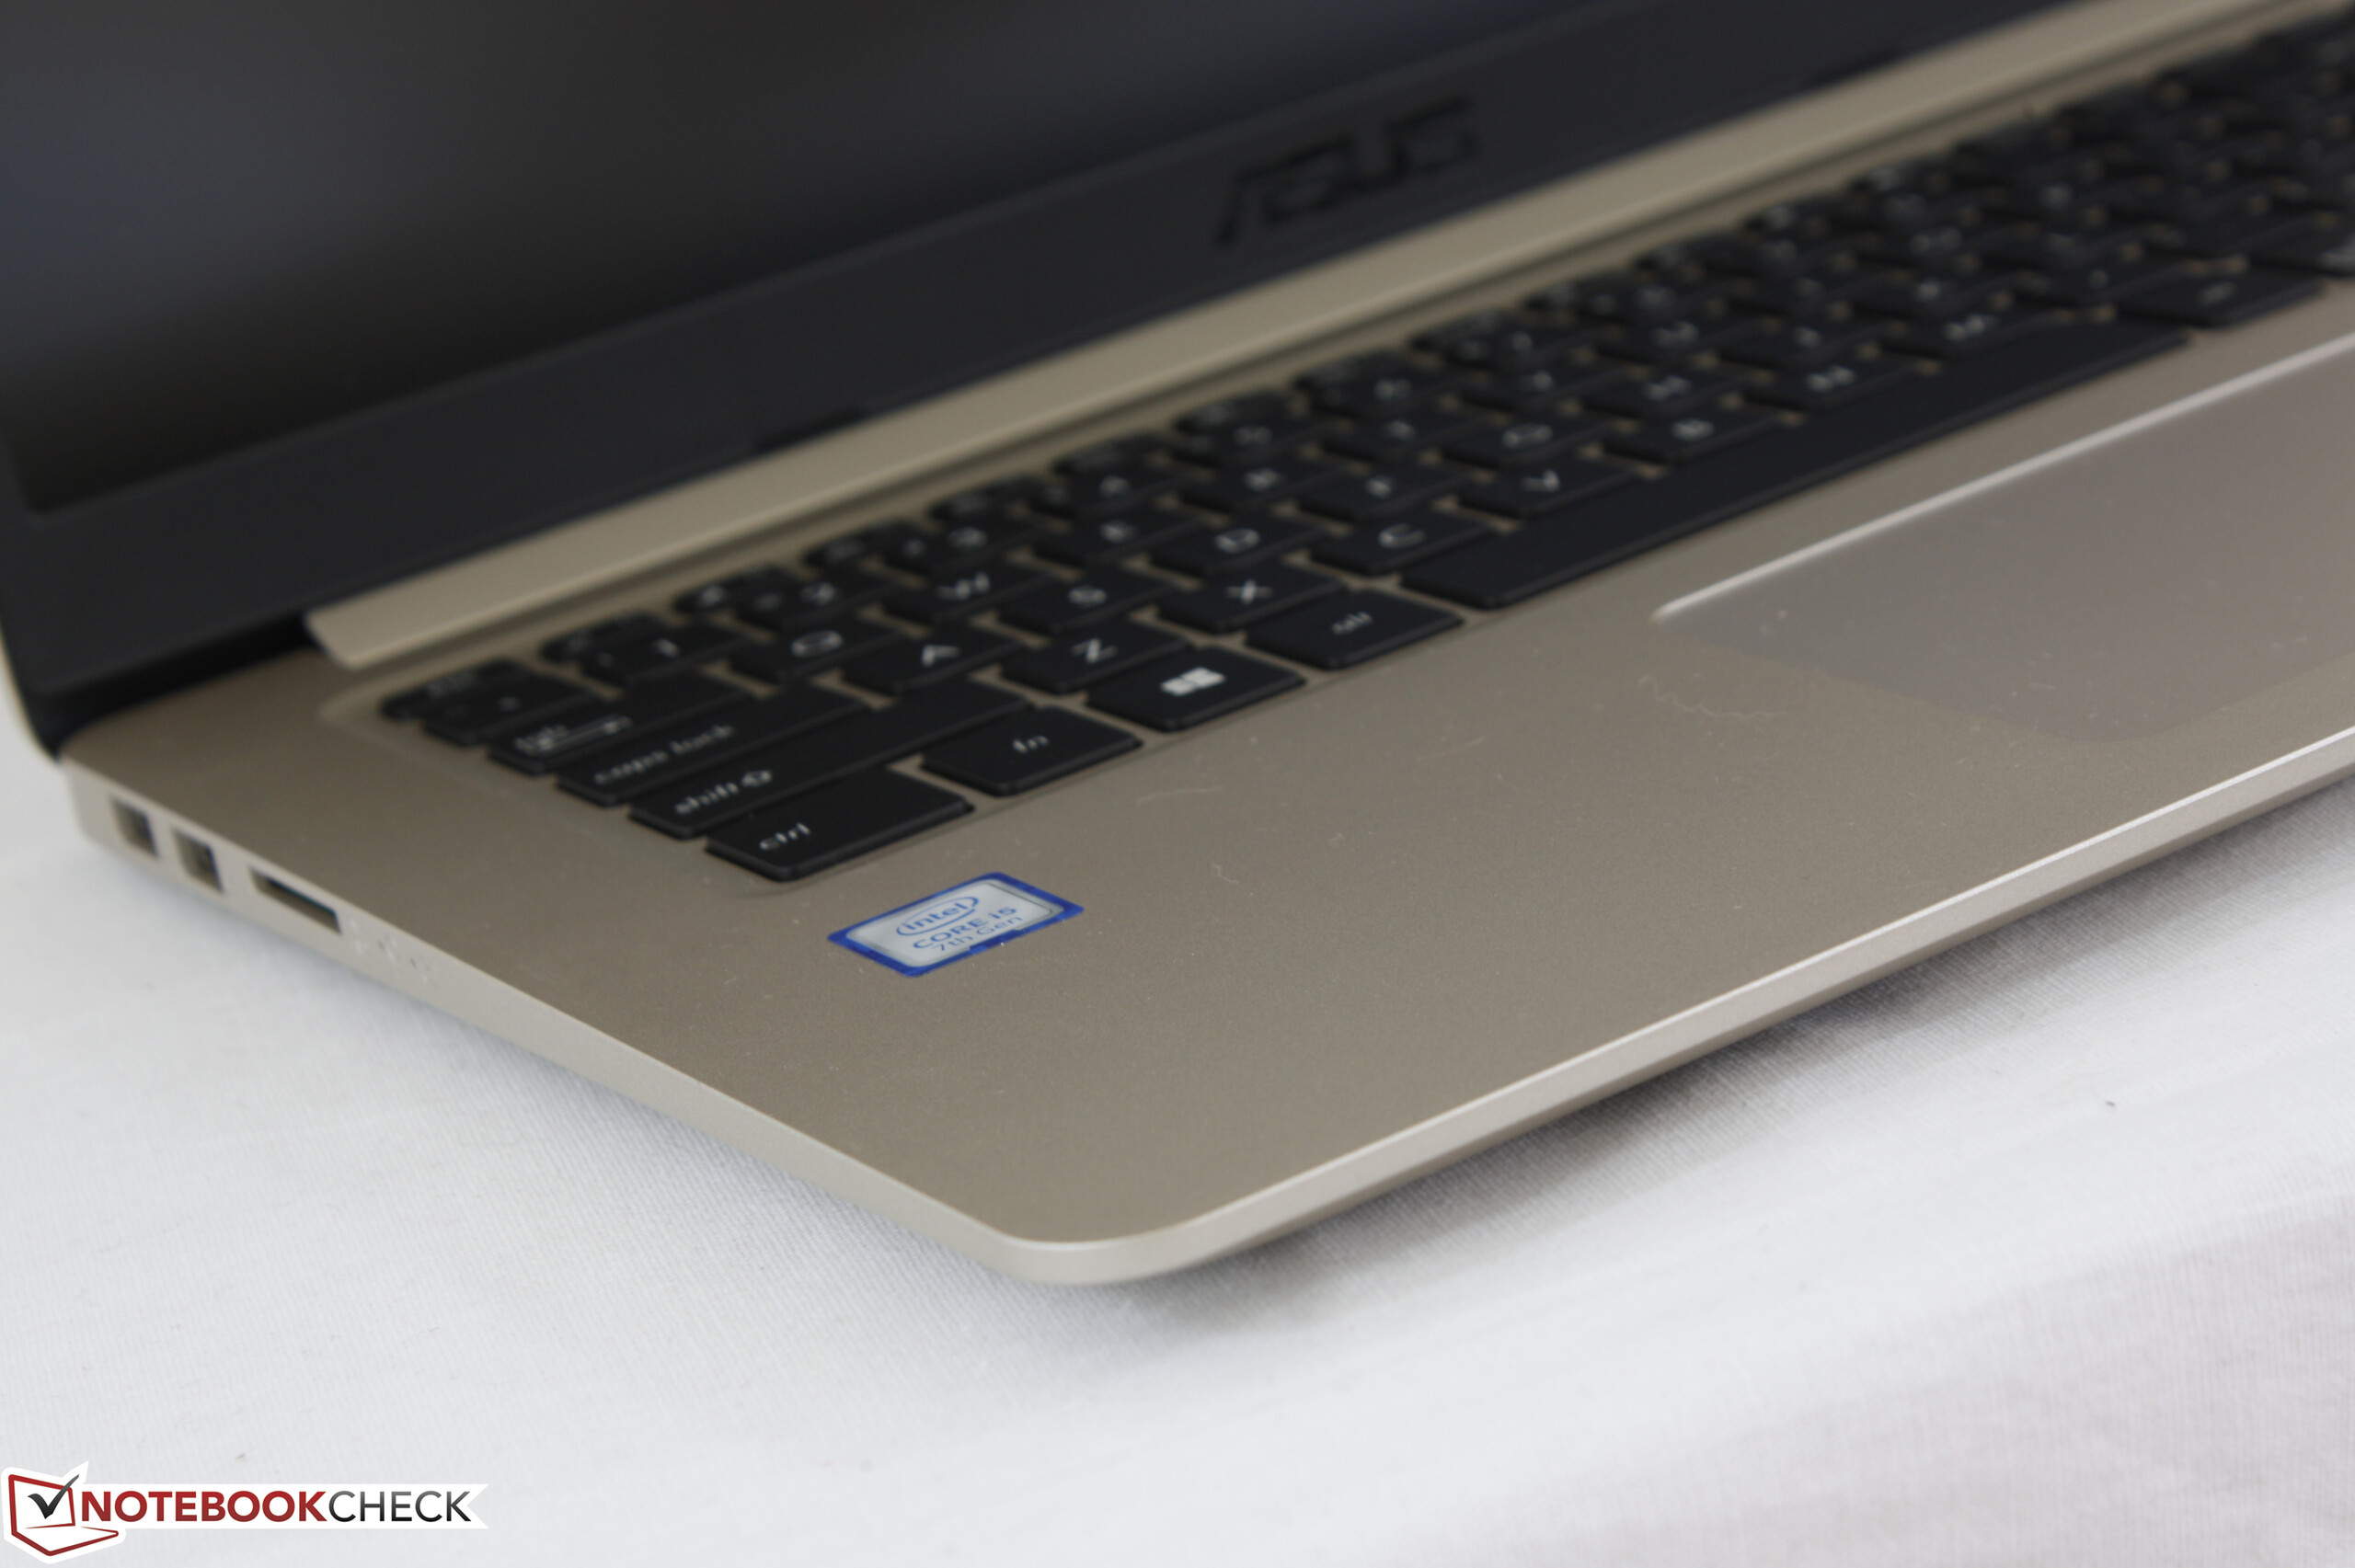
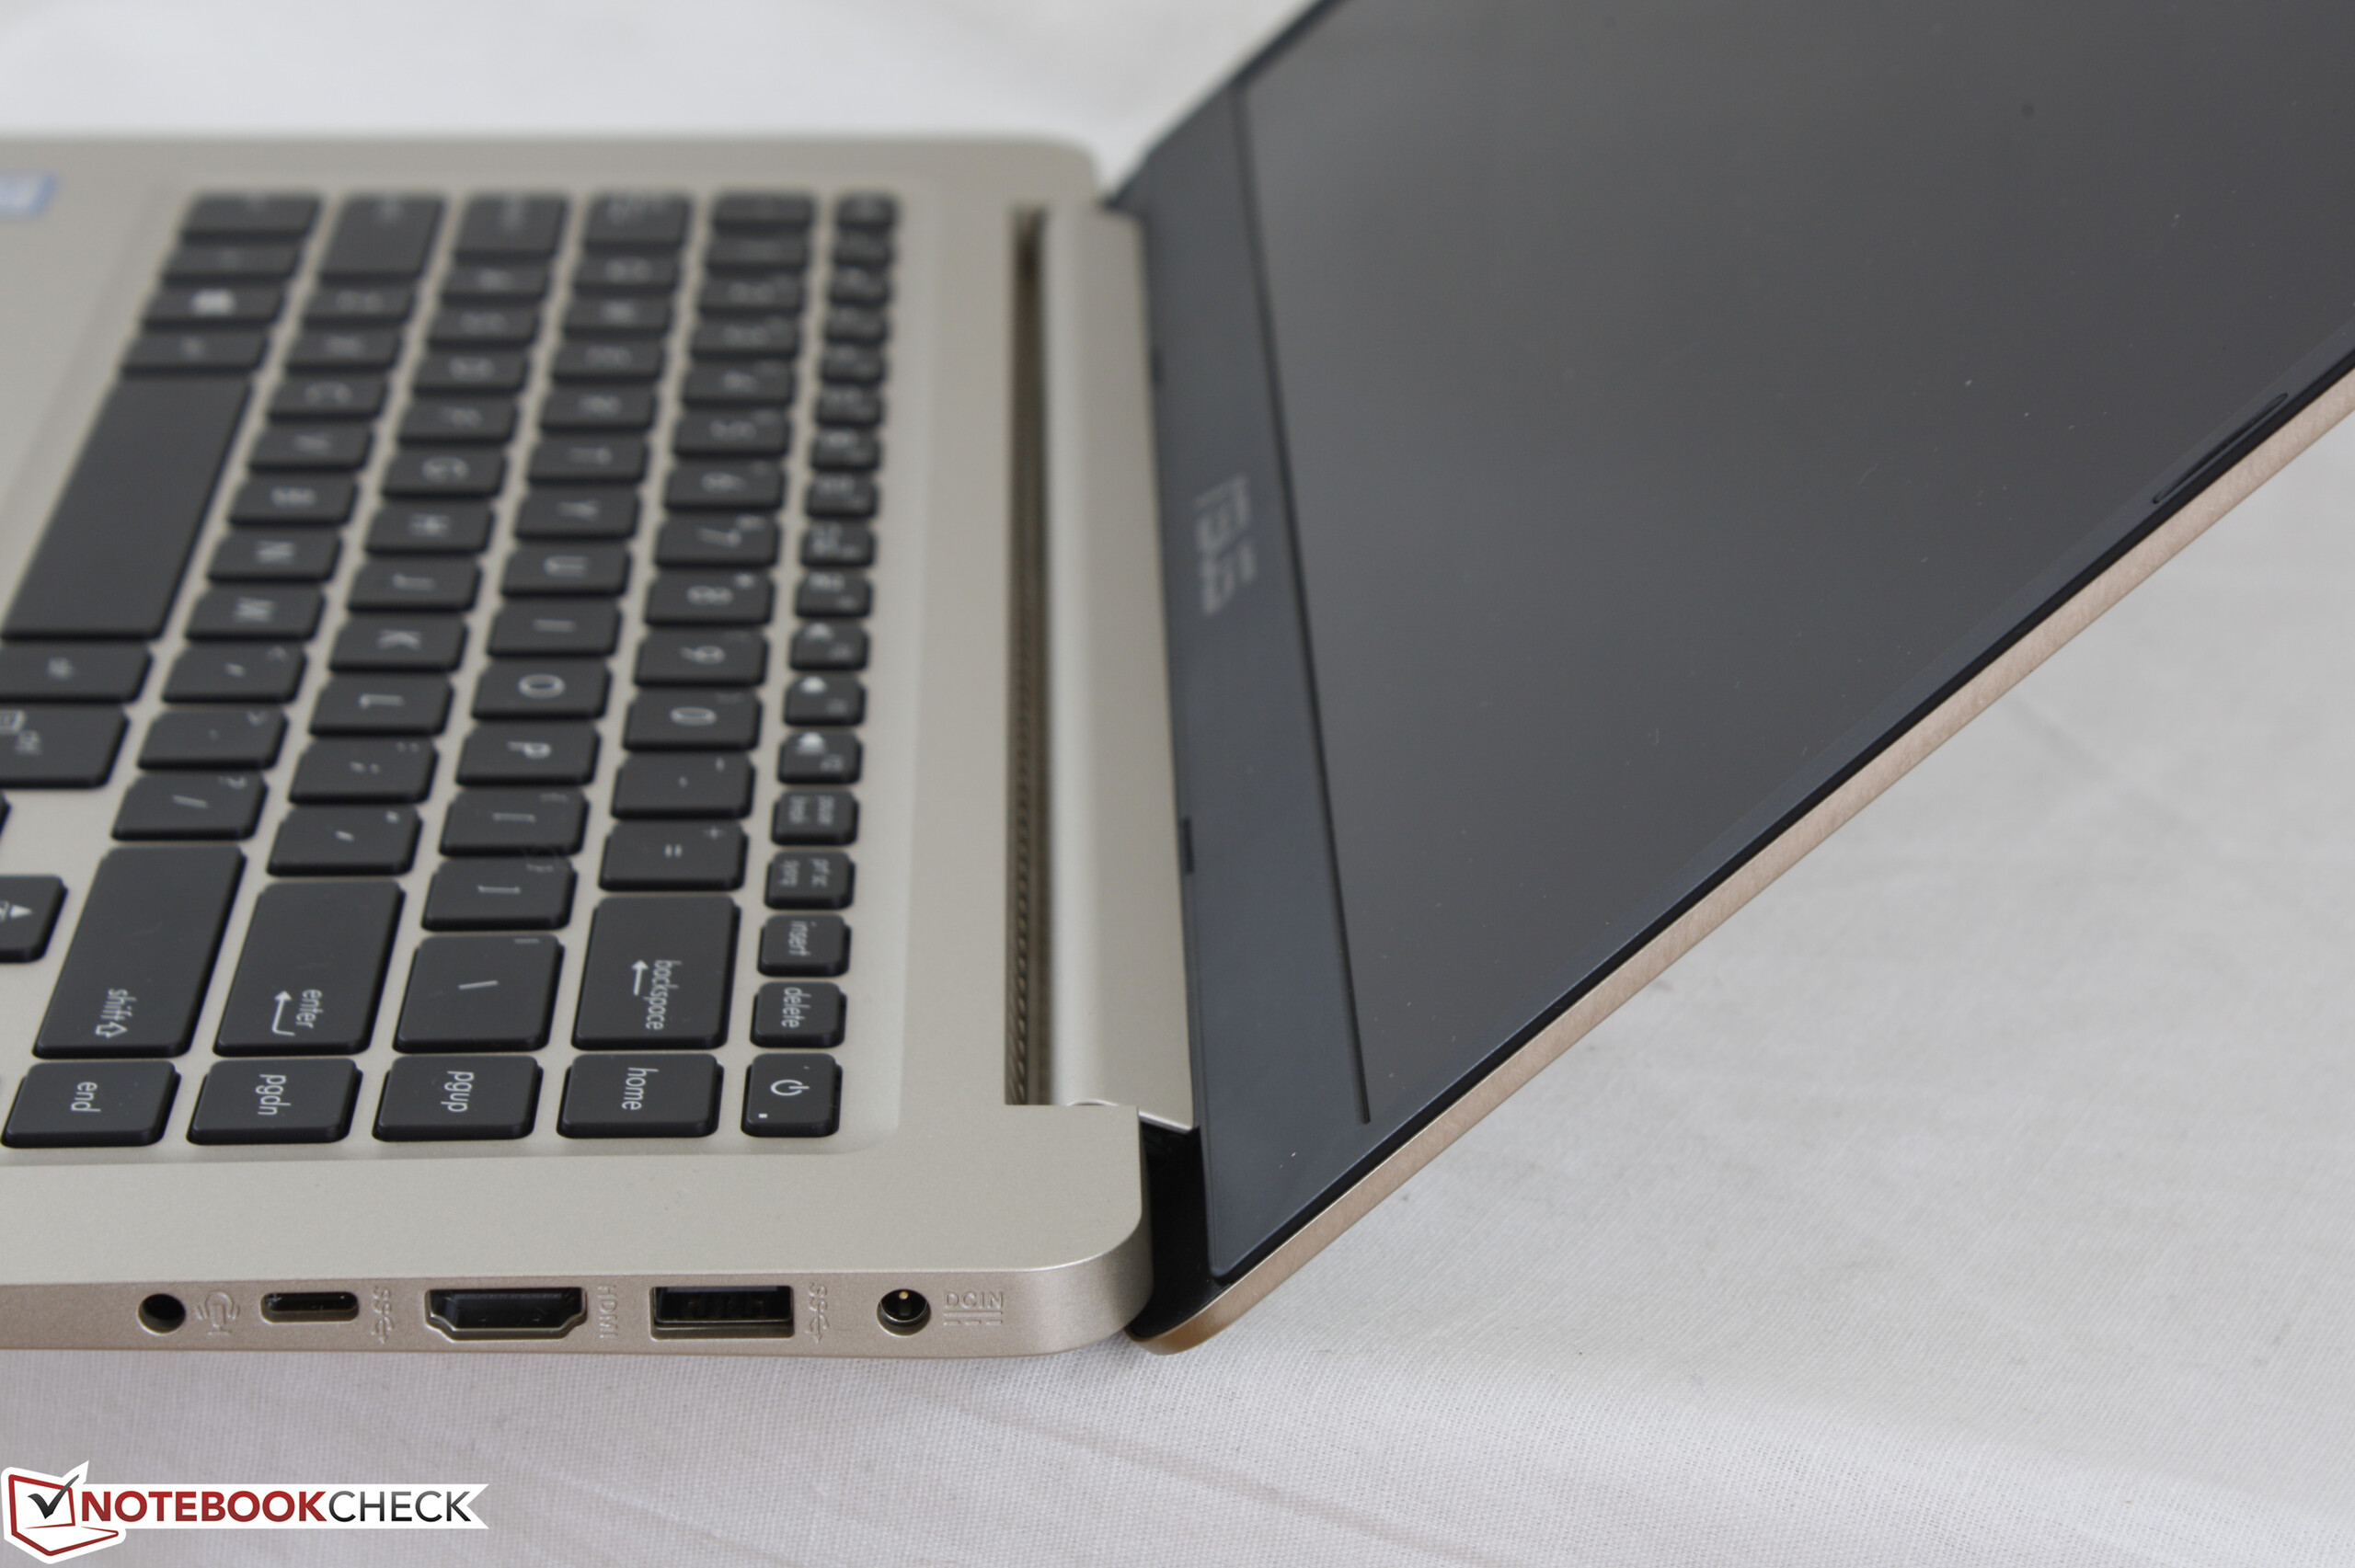
A série VivoBook S510 foi feito para ser mais acessível que a série ZenBook, XPS, ou Spectre sem ser mais pesado o menos atraente. É, em essência, um portátil convencional econômico, colocado em um design emblemático superfino. A Asus teve sucesso neste aspecto, dado que o S510UA está a partir de menos de $1000 e seus marcos finos naturalmente resultam em um formato menor quando comparado com portáteis econômicos mais típicos das famílias Pavilion, Inspiron, ou IdeaPad . Estamos especialmente aliviados ao não ver recortes na qualidade da tela ou no desempenho, pois o processador pode suportar as velocidades do Turbo Boost sem muito problema. O ruído da ventoinha relativamente baixo é outra nota alta, especialmente quando comparado as mais enérgicas ventoinhas do XPS 15.
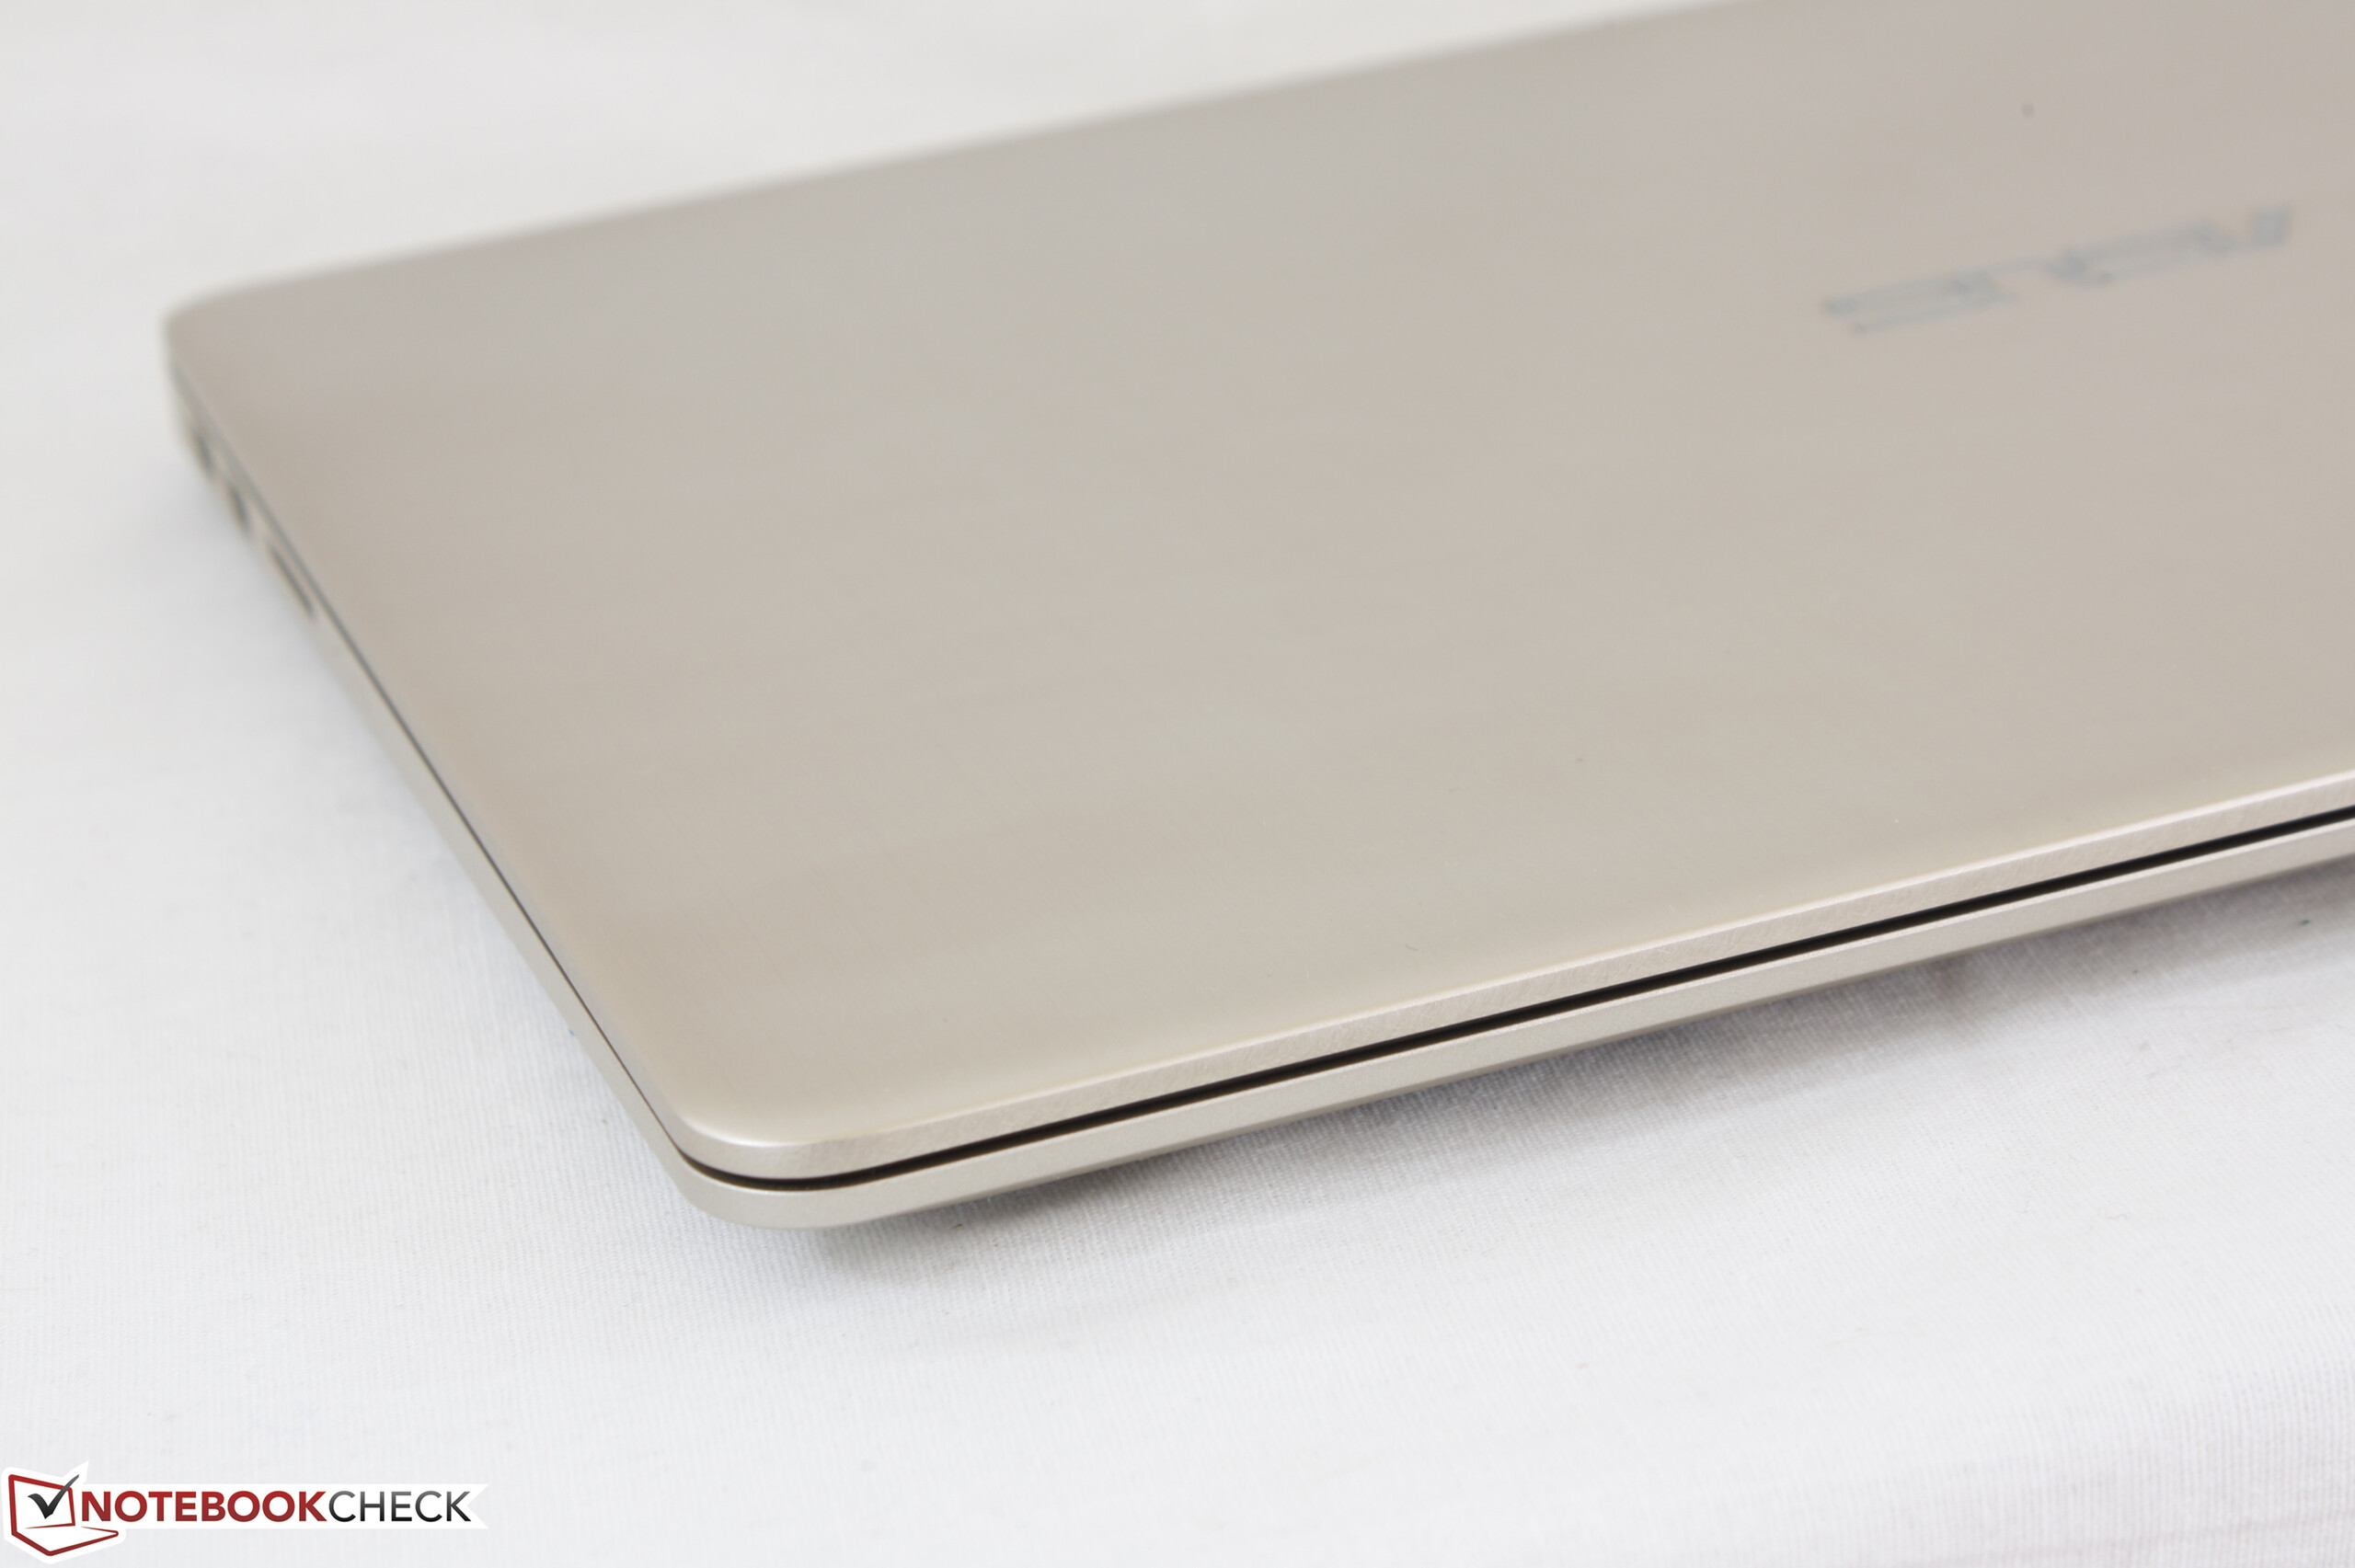
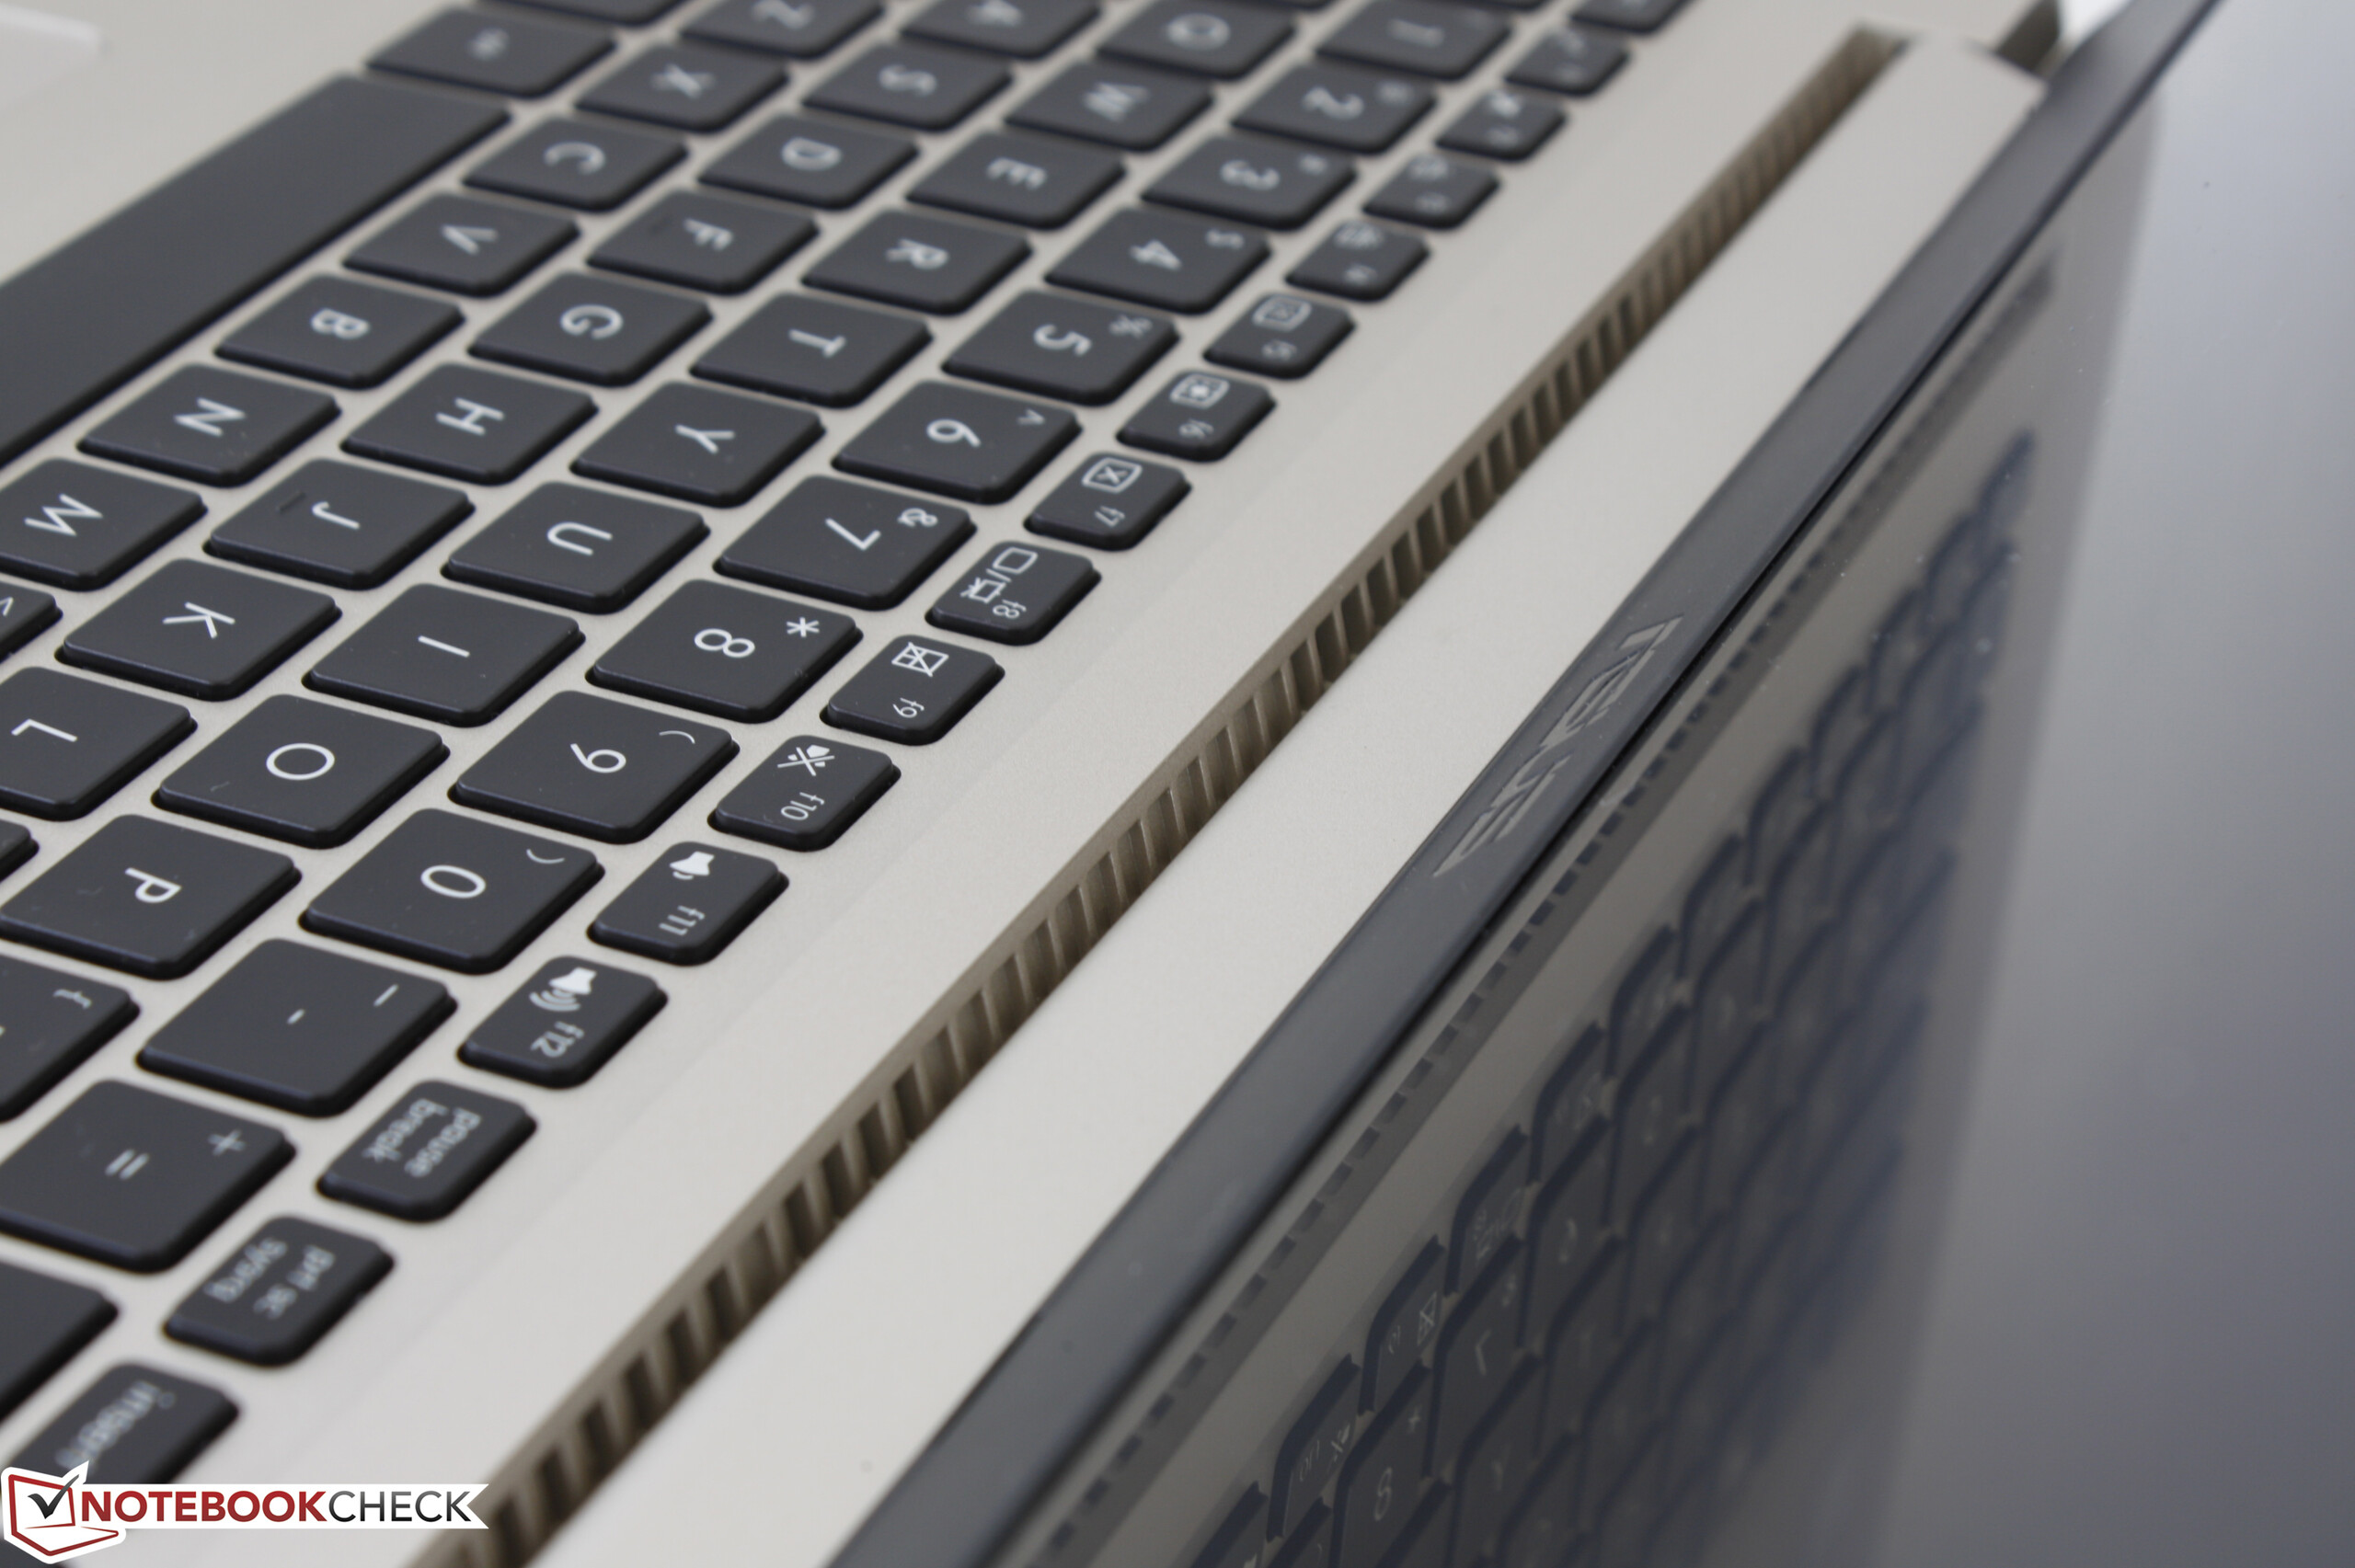
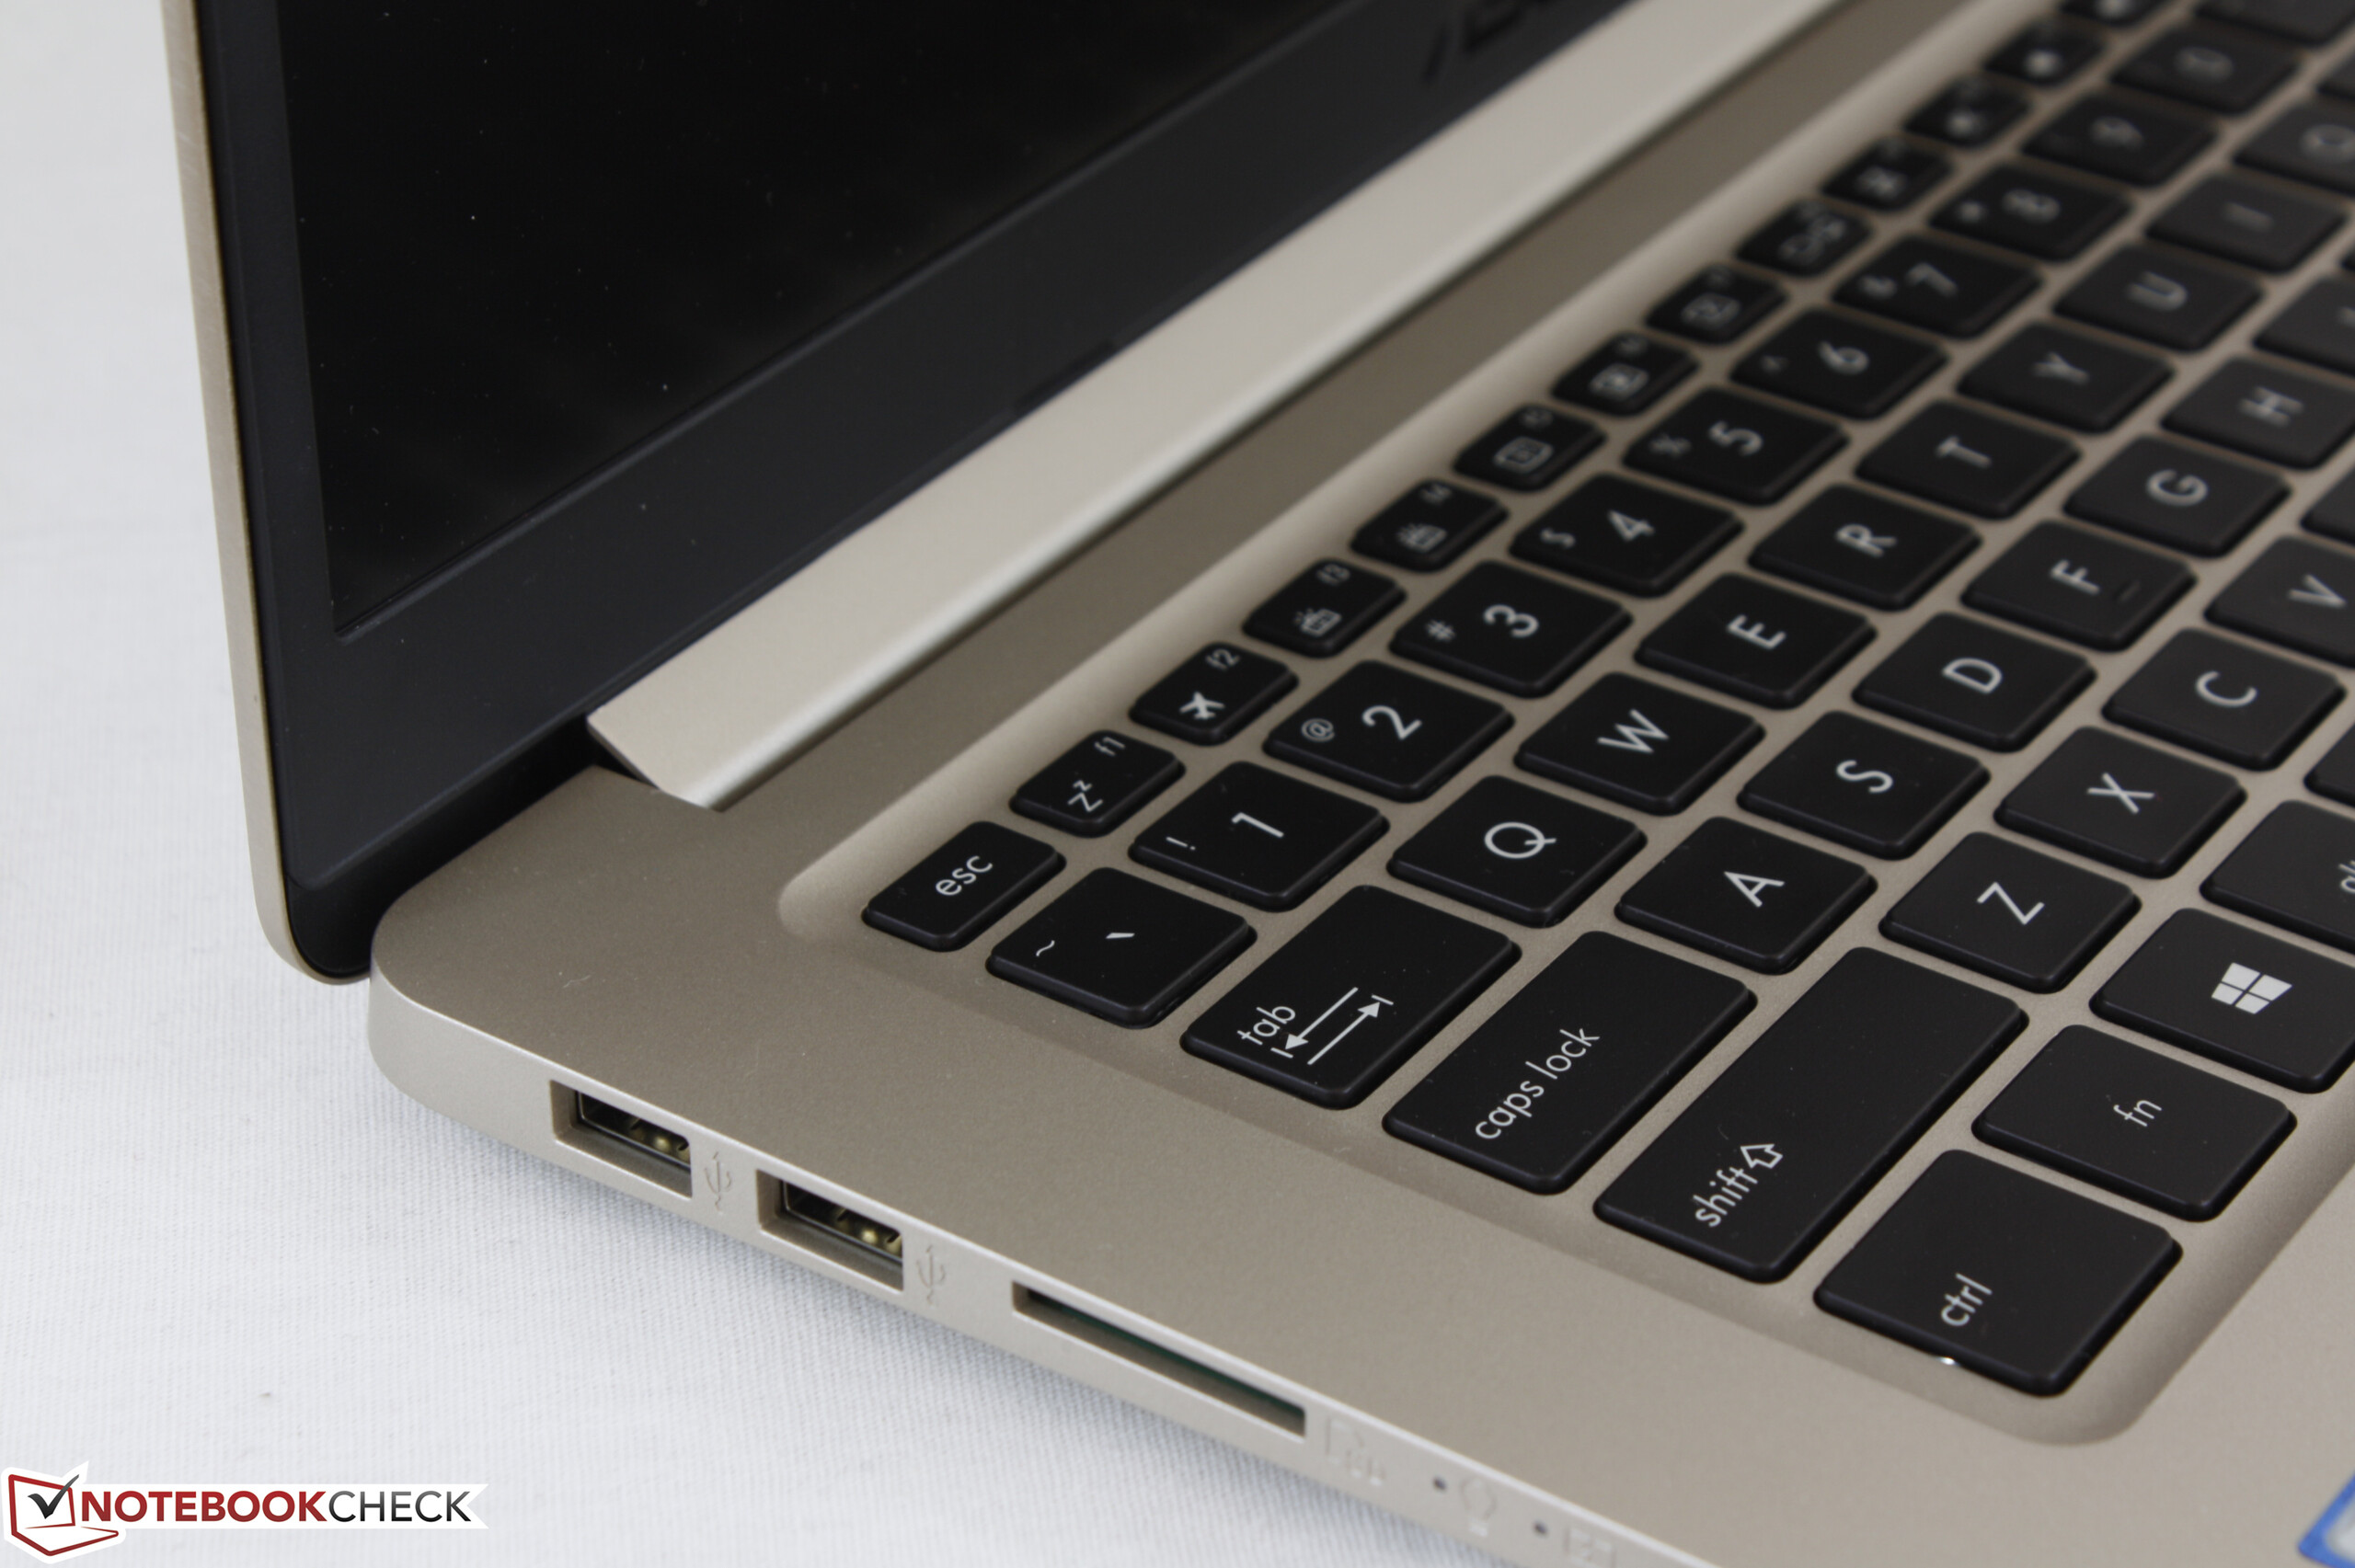
Onde o S510UA vacila, no entanto, é difícil de ignorar. A carcaça não é muito rígida e tanto o teclado como o trackpad não se sentem tão firmes quanto poderiam ter sido. Seu chassi pode parecer uma oferta de carro-chefe, mas não se sente em lugar algum tão sólido quanto um. A duração da bateria é curta e o entalhe superficial na parte inferior do notebook em torno do processador dá sinais de um design mais econômico ou econômico. Esperemos que essas falhas estranhas de hardware na nossa unidade de teste não sejam indicativas de um problema mais amplo com a nova série VivoBook S15 como um todo, então provavelmente analisaremos mais SKUs no futuro para ter uma perspectiva melhor.
Nós podemos recomendar o VivoBook S15 S510 sobre o HP Pavilion 15 antigo ou a série Asus F se a acessibilidade e a portabilidade forem de grande preocupação. Caso contrário, os usuários que desejam investir cerca de $ 200 ou US $ 300 em um SKU ZenBook, XPS ou Specter introdutório, encontrarão uma experiência muito superior.
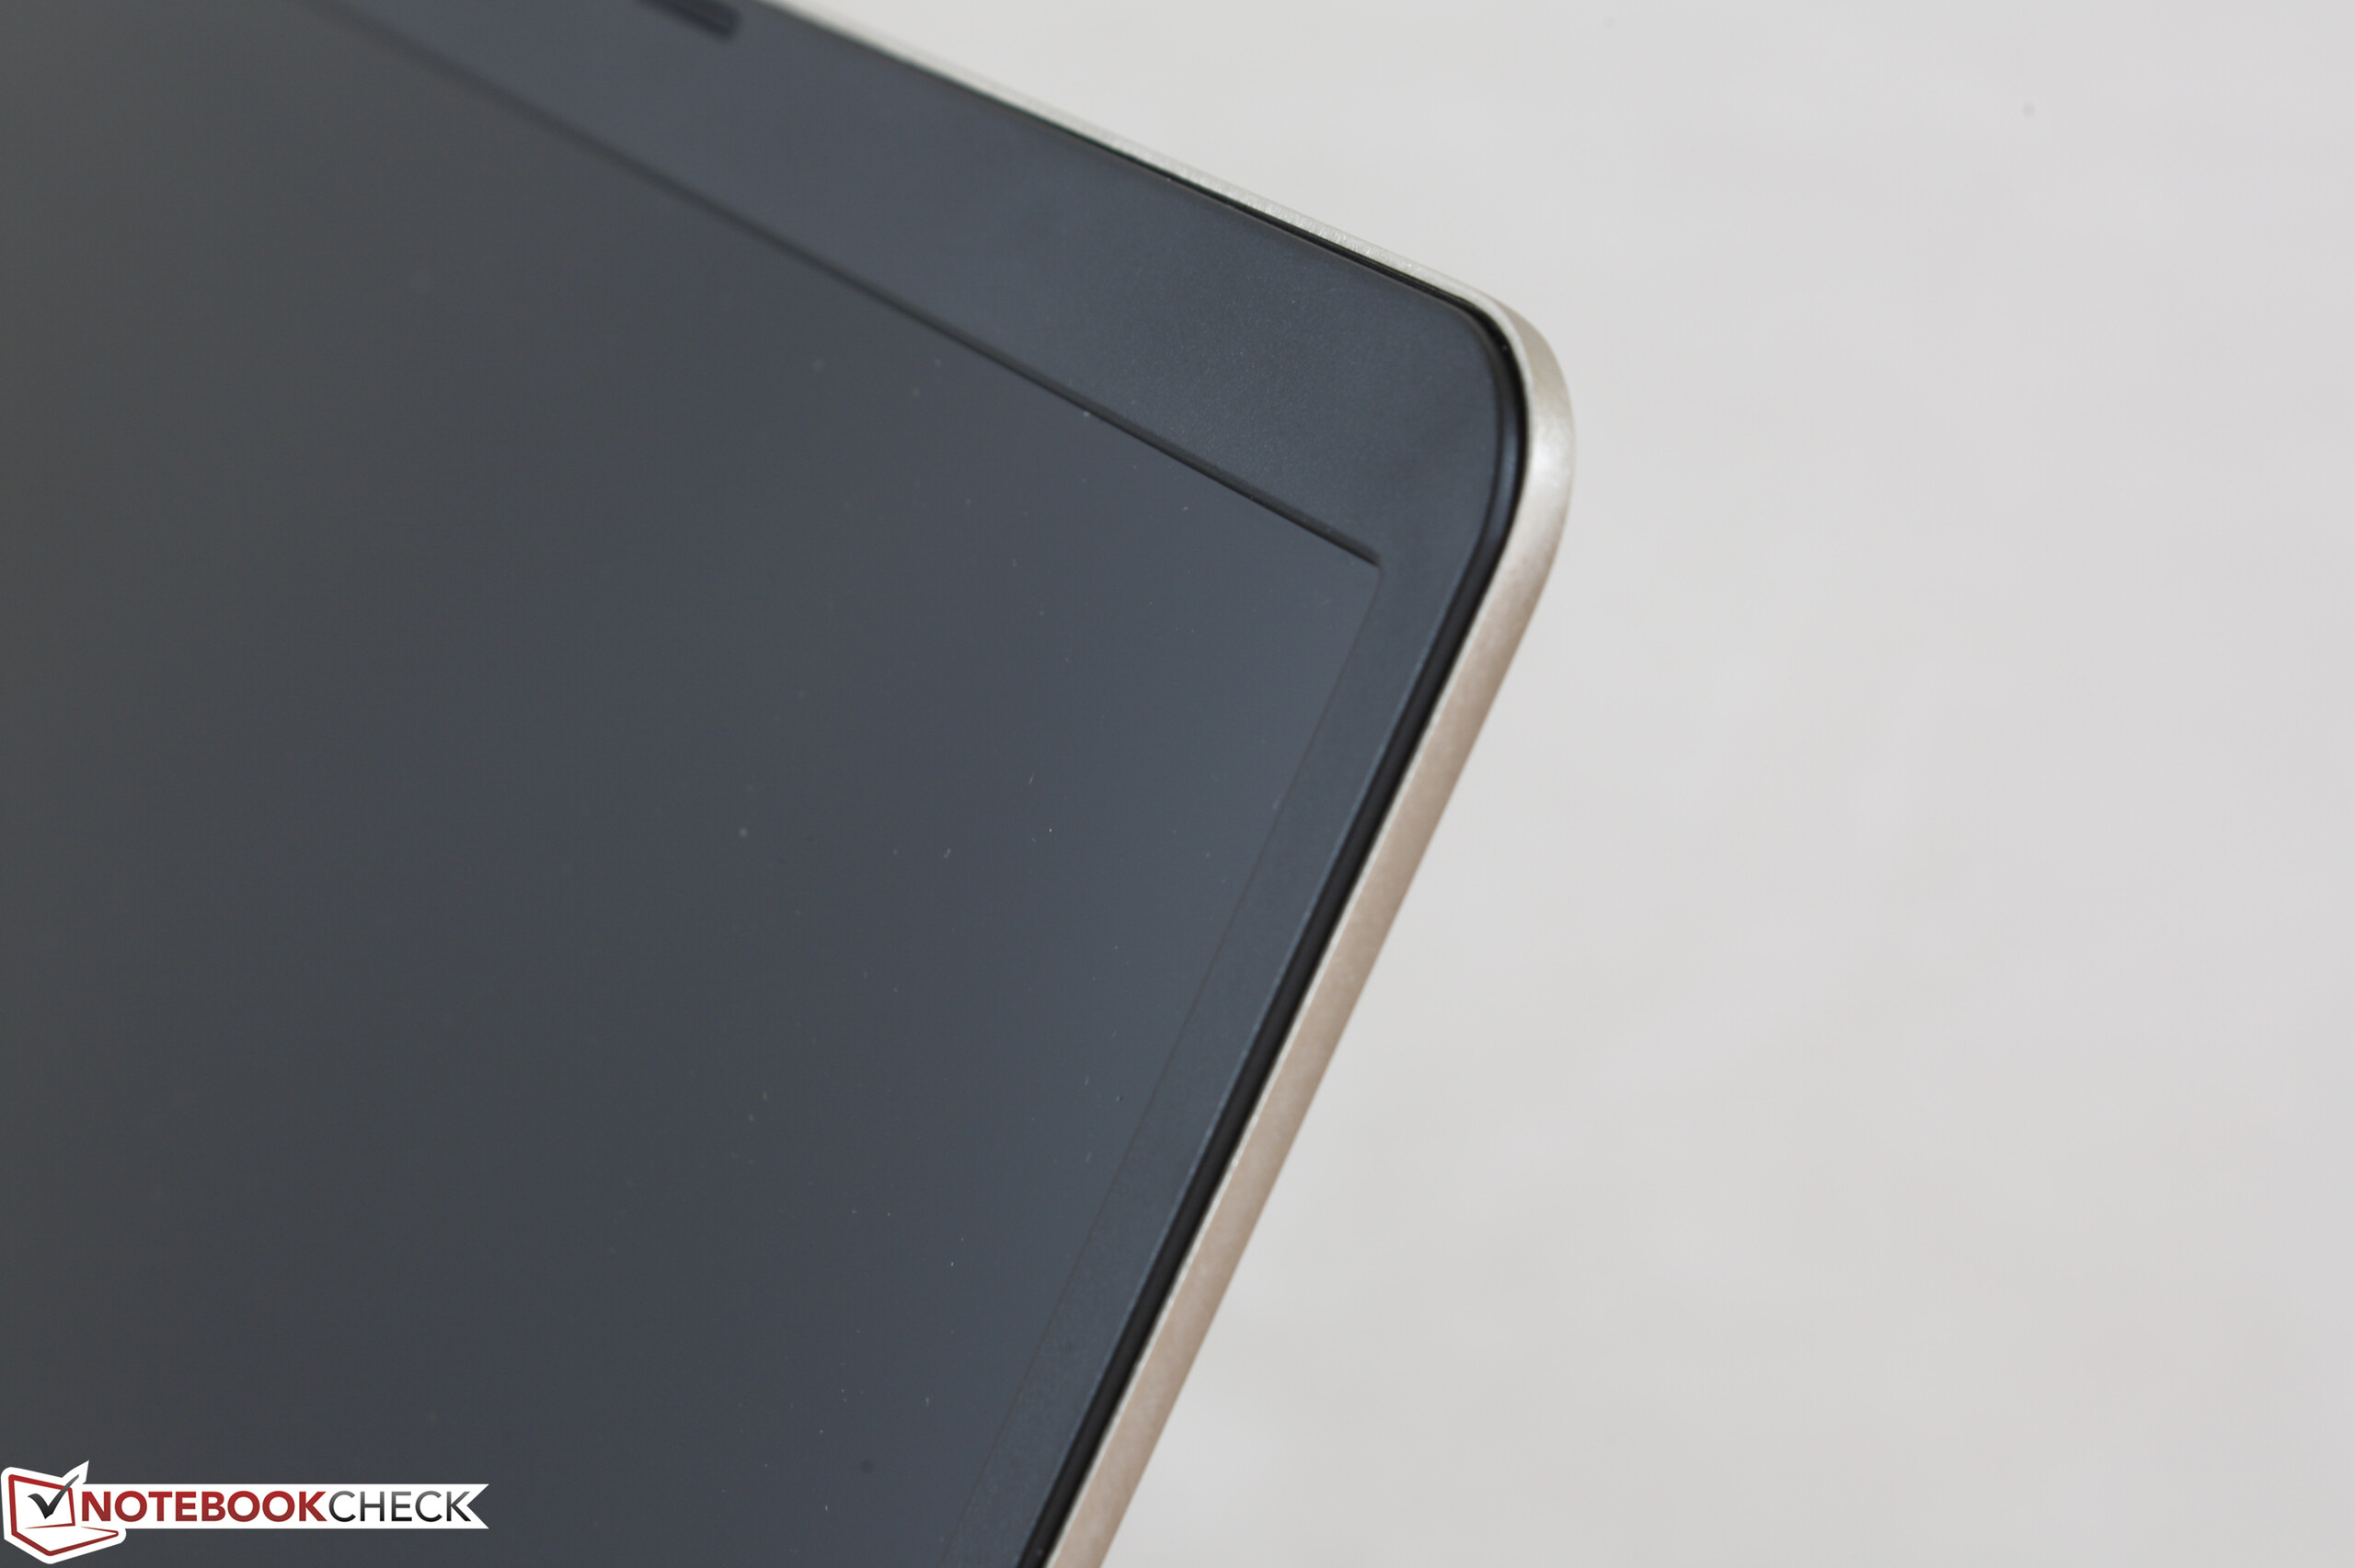
O leve S510UA parece elegante, se desempenha maravilhosamente, e carrega uma respeitável tela IPS de 1080p. O teclado esponjoso, a duração da bateria abaixo da média e as estranhas falhas do hardware na nossa unidade de teste sugerem que os compradores devem seguir com cuidado antes de investir na nova série VivoBook S15.
Asus VivoBook S15 S510UA
- 06/11/2017 v6 (old)
Allen Ngo
Price comparison
