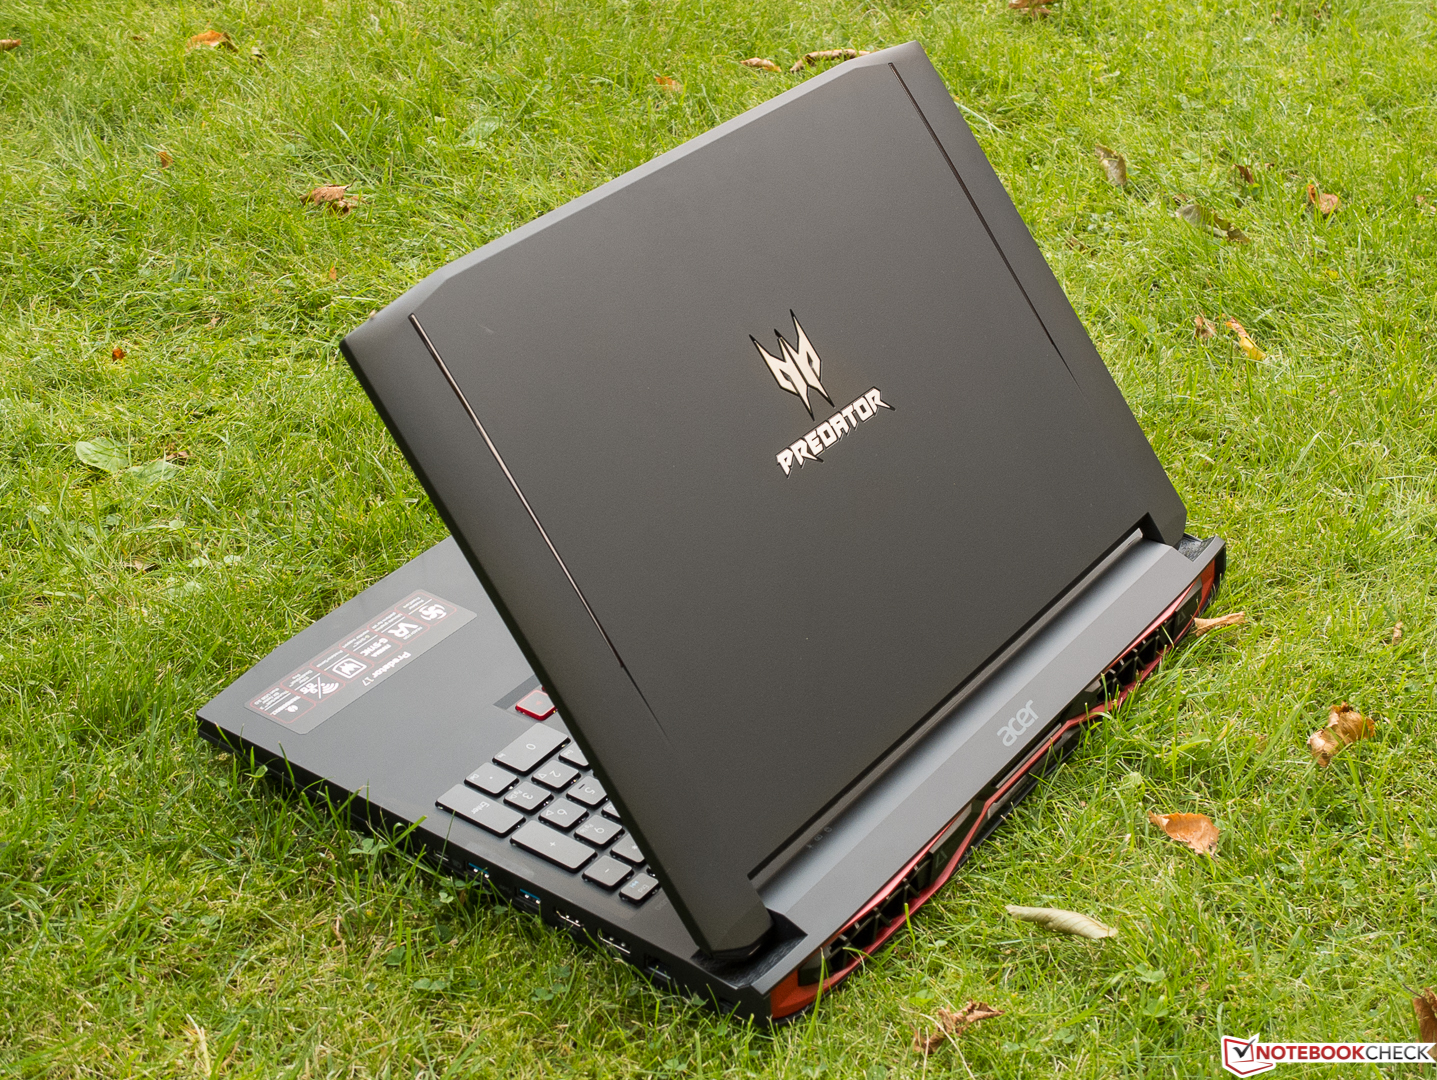
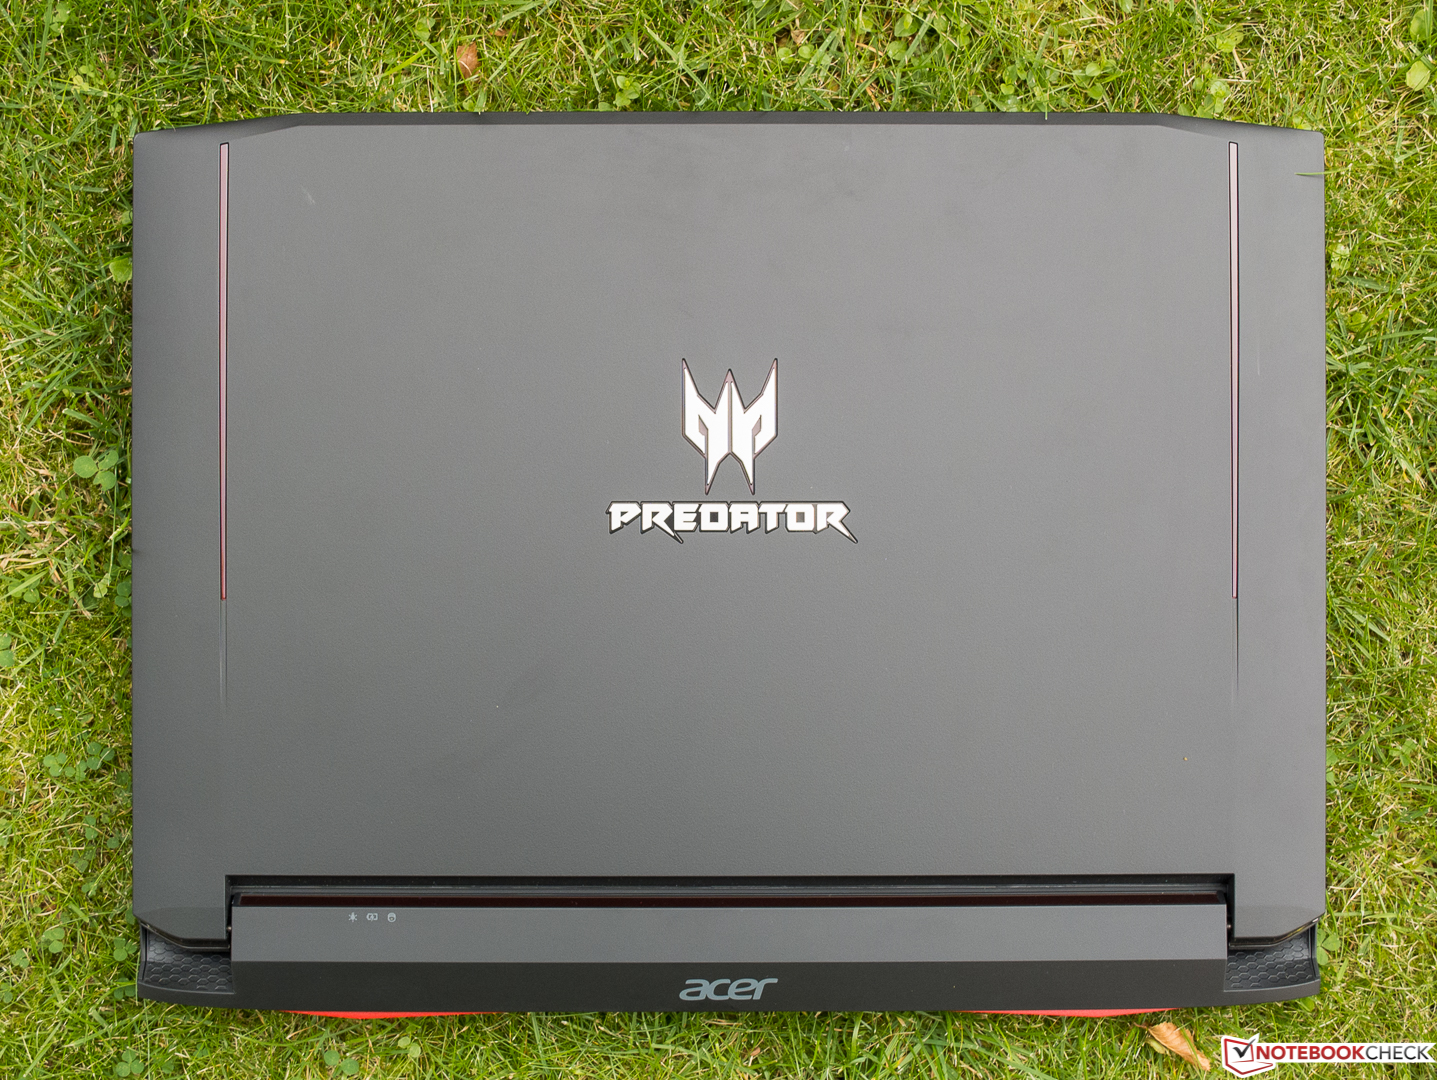
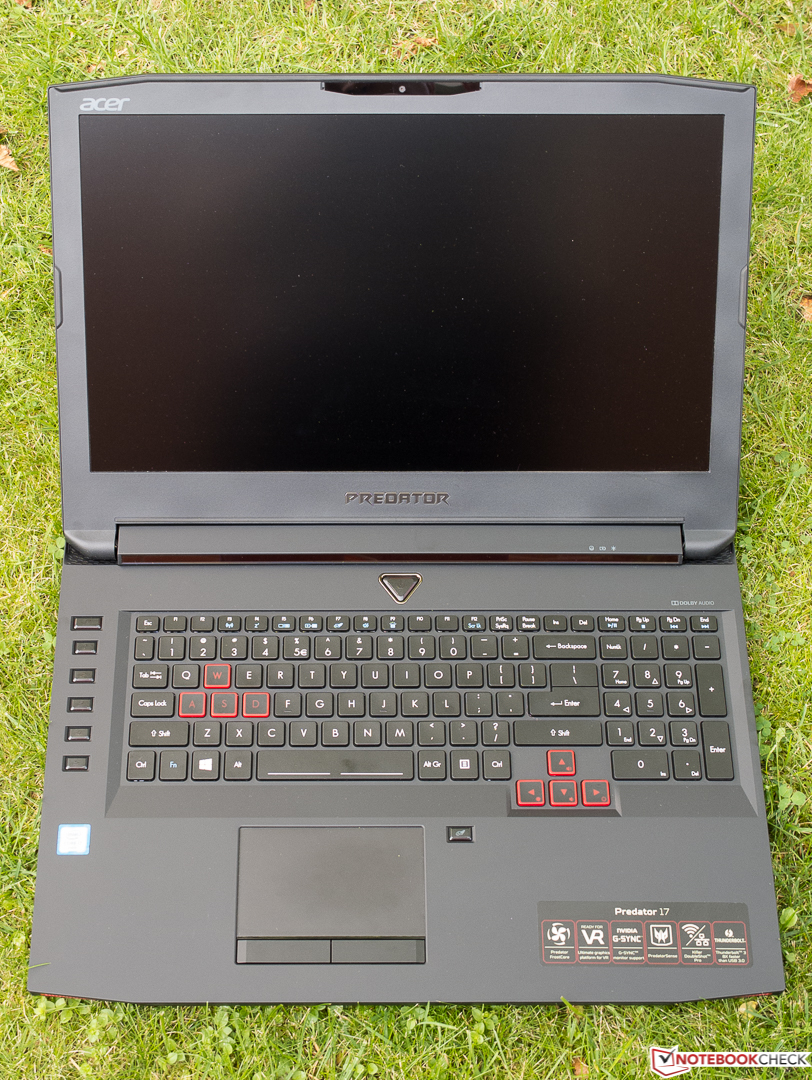
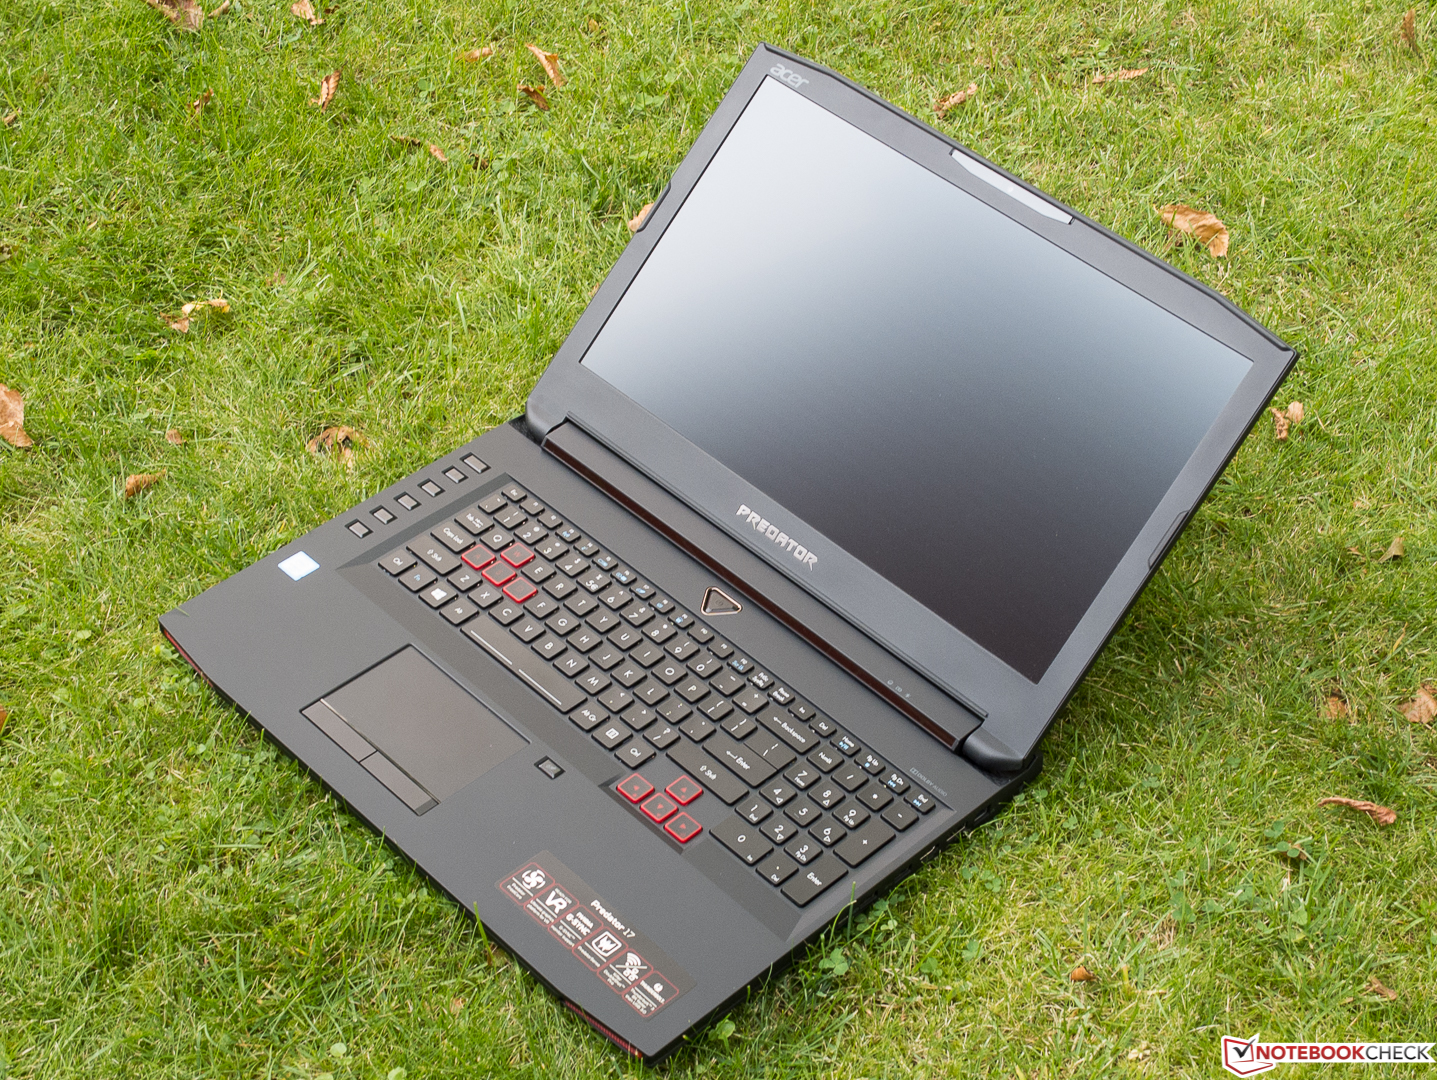
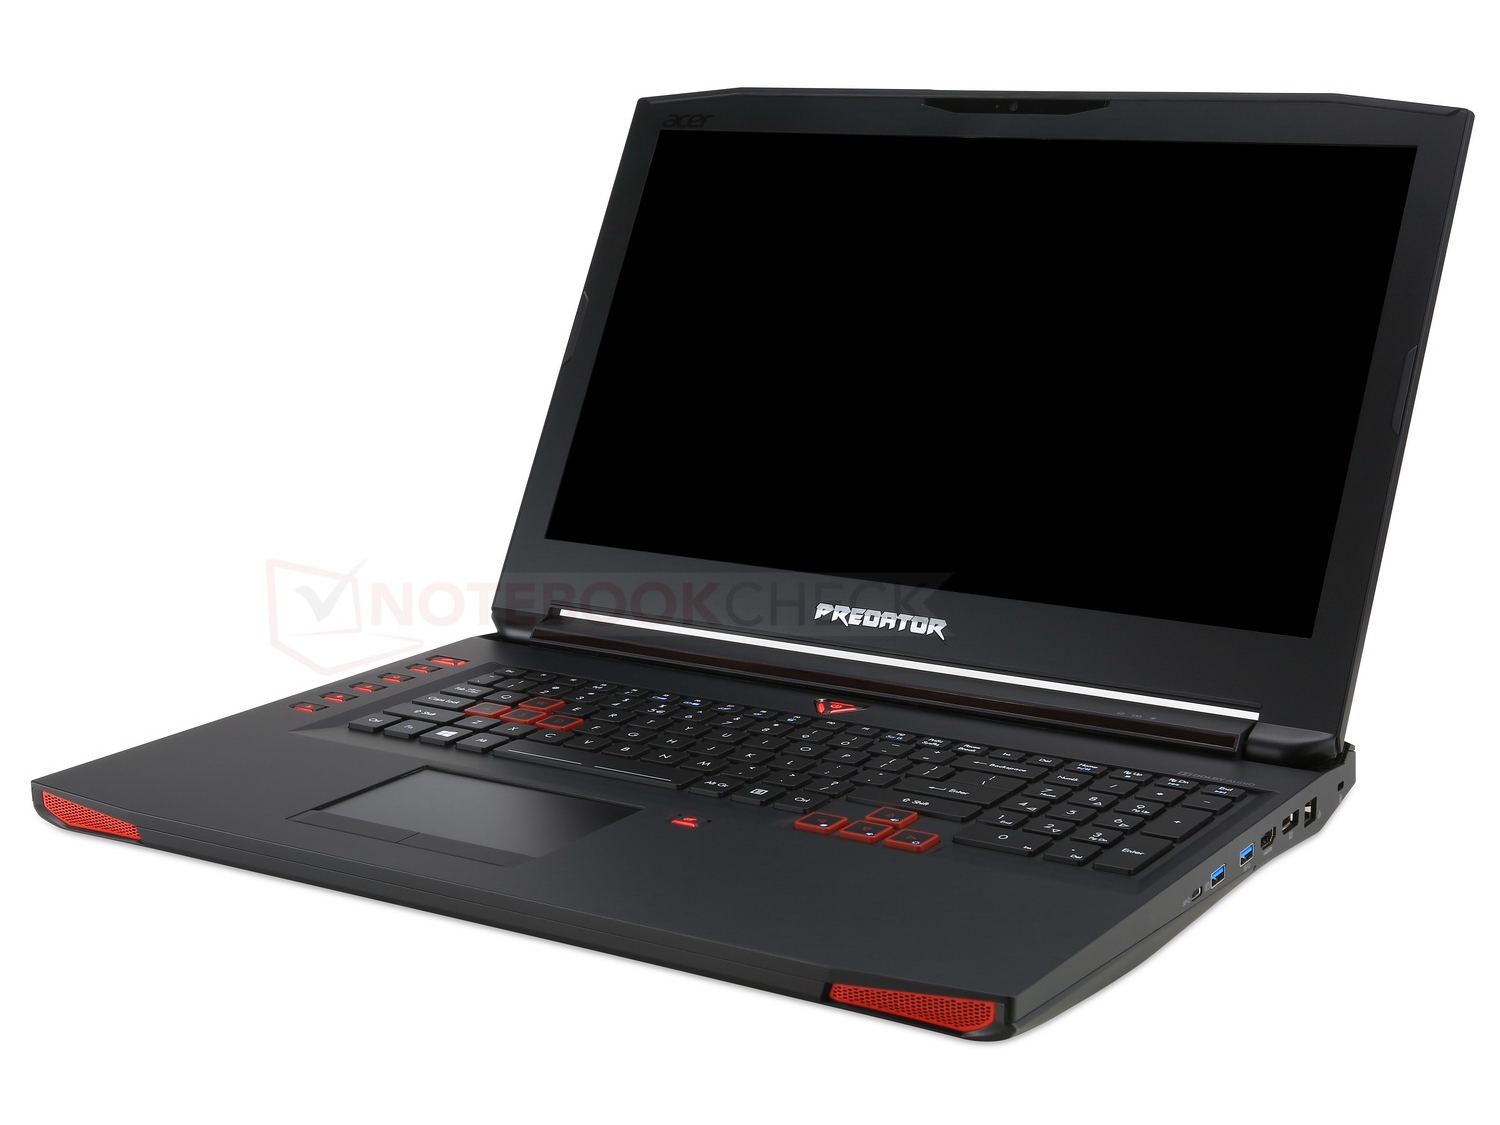
Breve Análise do Portátil Acer Predator 17 (7700HQ, GTX 1070, UHD)

| SD Card Reader | |
| average JPG Copy Test (av. of 3 runs) | |
| Schenker XMG U727 2017 | |
| MSI GT72VR 7RE-433 | |
| Acer Predator 17 X GX-792-76DL | |
| Acer Predator 17 G9-793-70PJ | |
| Asus G752VS-XB78K | |
| maximum AS SSD Seq Read Test (1GB) | |
| Schenker XMG U727 2017 | |
| MSI GT72VR 7RE-433 | |
| Acer Predator 17 X GX-792-76DL | |
| Acer Predator 17 G9-793-70PJ | |
| Asus G752VS-XB78K | |
| Networking | |
| iperf3 transmit AX12 | |
| Acer Predator 17 X GX-792-76DL | |
| Acer Predator 17 G9-793-70PJ | |
| MSI GT72VR 7RE-433 | |
| Schenker XMG U727 2017 | |
| iperf3 receive AX12 | |
| Acer Predator 17 G9-793-70PJ | |
| Schenker XMG U727 2017 | |
| Acer Predator 17 X GX-792-76DL | |
| MSI GT72VR 7RE-433 | |
| |||||||||||||||||||||||||
iluminação: 84 %
iluminação com acumulador: 343 cd/m²
Contraste: 1183:1 (Preto: 0.29 cd/m²)
ΔE ColorChecker Calman: 4.01 | ∀{0.5-29.43 Ø4.71}
ΔE Greyscale Calman: 4.7 | ∀{0.09-98 Ø4.96}
100% sRGB (Argyll 1.6.3 3D)
88% AdobeRGB 1998 (Argyll 1.6.3 3D)
99.1% AdobeRGB 1998 (Argyll 3D)
99.9% sRGB (Argyll 3D)
86.4% Display P3 (Argyll 3D)
Gamma: 2.4
CCT: 6451 K
| Acer Predator 17 G9-793-70PJ AU Optronics B173ZAN01.0 (AUO109B), 3840x2160 | MSI GT72VR 7RE-433 Chi Mei N173HHE-G32 (CMN1747), 1920x1080 | Asus G752VS-XB78K LG Philips LP173WF4-SPF3 (LGD04E8), 1920x1080 | Acer Predator 17 X GX-792-76DL LP173WF4-SPF5 (LGD056D), 1920x1080 | Schenker XMG U727 2017 AU Optronics B173ZAN01.0 (AUO109B), 3840x2160 | |
|---|---|---|---|---|---|
| Display | -23% | -25% | -26% | 0% | |
| Display P3 Coverage (%) | 86.4 | 68.3 -21% | 66.9 -23% | 66 -24% | 86.6 0% |
| sRGB Coverage (%) | 99.9 | 86.7 -13% | 85.2 -15% | 83.7 -16% | 99.9 0% |
| AdobeRGB 1998 Coverage (%) | 99.1 | 63.4 -36% | 62.3 -37% | 61.2 -38% | 99.5 0% |
| Response Times | 58% | 19% | 1% | 2% | |
| Response Time Grey 50% / Grey 80% * (ms) | 50 ? | 29 ? 42% | 38 ? 24% | 45 ? 10% | 44 ? 12% |
| Response Time Black / White * (ms) | 25.6 ? | 7 ? 73% | 22 ? 14% | 28 ? -9% | 28 ? -9% |
| PWM Frequency (Hz) | |||||
| Screen | -44% | -6% | -9% | 8% | |
| Brightness middle (cd/m²) | 343 | 299 -13% | 328 -4% | 380 11% | 362 6% |
| Brightness (cd/m²) | 328 | 277 -16% | 317 -3% | 362 10% | 344 5% |
| Brightness Distribution (%) | 84 | 87 4% | 88 5% | 91 8% | 85 1% |
| Black Level * (cd/m²) | 0.29 | 0.27 7% | 0.3 -3% | 0.37 -28% | 0.35 -21% |
| Contrast (:1) | 1183 | 1107 -6% | 1093 -8% | 1027 -13% | 1034 -13% |
| Colorchecker dE 2000 * | 4.01 | 9.65 -141% | 3.74 7% | 4.12 -3% | 2.46 39% |
| Colorchecker dE 2000 max. * | 6.03 | 15.43 -156% | 8.97 -49% | 8.19 -36% | 4.26 29% |
| Greyscale dE 2000 * | 4.7 | 9.68 -106% | 2.67 43% | 3.95 16% | 2.9 38% |
| Gamma | 2.4 92% | 1.89 116% | 2.41 91% | 2.47 89% | 2.31 95% |
| CCT | 6451 101% | 11652 56% | 6861 95% | 6539 99% | 6120 106% |
| Color Space (Percent of AdobeRGB 1998) (%) | 88 | 75 -15% | 56 -36% | 55 -37% | 88 0% |
| Color Space (Percent of sRGB) (%) | 100 | 100 0% | 85 -15% | 84 -16% | 100 0% |
| Média Total (Programa/Configurações) | -3% /
-26% | -4% /
-7% | -11% /
-11% | 3% /
6% |
* ... menor é melhor
Exibir tempos de resposta
| ↔ Tempo de resposta preto para branco | ||
|---|---|---|
| 25.6 ms ... ascensão ↗ e queda ↘ combinadas | ↗ 11.2 ms ascensão | 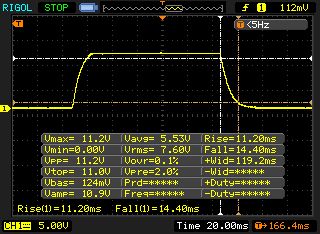 |
| ↘ 14.4 ms queda | ||
| A tela mostra taxas de resposta relativamente lentas em nossos testes e pode ser muito lenta para os jogadores. Em comparação, todos os dispositivos testados variam de 0.1 (mínimo) a 240 (máximo) ms. » 61 % de todos os dispositivos são melhores. Isso significa que o tempo de resposta medido é pior que a média de todos os dispositivos testados (19.8 ms). | ||
| ↔ Tempo de resposta 50% cinza a 80% cinza | ||
| 50 ms ... ascensão ↗ e queda ↘ combinadas | ↗ 24.4 ms ascensão | 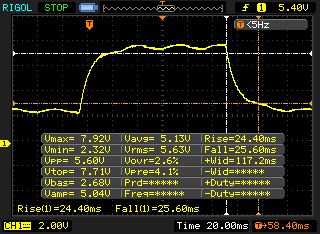 |
| ↘ 25.6 ms queda | ||
| A tela mostra taxas de resposta lentas em nossos testes e será insatisfatória para os jogadores. Em comparação, todos os dispositivos testados variam de 0.165 (mínimo) a 636 (máximo) ms. » 86 % de todos os dispositivos são melhores. Isso significa que o tempo de resposta medido é pior que a média de todos os dispositivos testados (31 ms). | ||
Cintilação da tela / PWM (modulação por largura de pulso)
| Tela tremeluzindo / PWM não detectado | 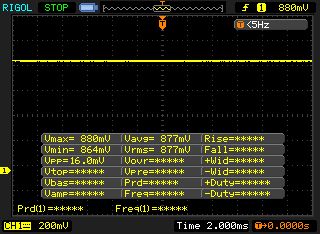 | ||
[pwm_comparison] Em comparação: 52 % de todos os dispositivos testados não usam PWM para escurecer a tela. Se PWM foi detectado, uma média de 7754 (mínimo: 5 - máximo: 343500) Hz foi medida. | |||
| PCMark 8 | |
| Home Score Accelerated v2 | |
| Acer Predator 17 X GX-792-76DL | |
| Asus G752VS-XB78K | |
| MSI GT72VR 7RE-433 | |
| Schenker XMG U727 2017 | |
| Acer Predator 17 G9-793-70PJ | |
| Work Score Accelerated v2 | |
| Acer Predator 17 X GX-792-76DL | |
| Asus G752VS-XB78K | |
| MSI GT72VR 7RE-433 | |
| Schenker XMG U727 2017 | |
| Acer Predator 17 G9-793-70PJ | |
| PCMark 7 - Score | |
| Schenker XMG U727 2017 | |
| Acer Predator 17 X GX-792-76DL | |
| Asus G752VS-XB78K | |
| Acer Predator 17 G9-793-70PJ | |
| MSI GT72VR 7RE-433 | |
| PCMark 7 Score | 6692 pontos | |
| PCMark 8 Home Score Accelerated v2 | 4395 pontos | |
| PCMark 8 Work Score Accelerated v2 | 4541 pontos | |
Ajuda | ||
| Acer Predator 17 G9-793-70PJ Toshiba NVMe THNSN5512GPU7 | MSI GT72VR 7RE-433 Kingston RBU-SNS8152S3256GG5 | Asus G752VS-XB78K Toshiba NVMe THNSN5512GPU7 | Acer Predator 17 X GX-792-76DL Toshiba NVMe THNSN5512GPU7 | Schenker XMG U727 2017 Samsung SM961 MZVPW256 m.2 PCI-e | |
|---|---|---|---|---|---|
| AS SSD | -45% | 5% | 38% | ||
| Seq Read (MB/s) | 2237 | 509 -77% | 2261 1% | 2746 23% | |
| Seq Write (MB/s) | 1230 | 282.1 -77% | 1338 9% | 1445 17% | |
| 4K Read (MB/s) | 37.51 | 40.04 7% | 39.52 5% | 56.8 51% | |
| 4K Write (MB/s) | 120.8 | 95.8 -21% | 133.8 11% | 175.9 46% | |
| Score Total (Points) | 2547 | 1142 -55% | 2581 1% | 3938 55% |

| 3DMark | |
| 1920x1080 Fire Strike Graphics | |
| Acer Predator 17 X GX-792-76DL | |
| Schenker XMG U727 2017 | |
| MSI GT72VR 7RE-433 | |
| Acer Predator 17 G9-793-70PJ | |
| Asus G752VS-XB78K | |
| 2560x1440 Time Spy Graphics | |
| Acer Predator 17 X GX-792-76DL | |
| Schenker XMG U727 2017 | |
| MSI GT72VR 7RE-433 | |
| Asus G752VS-XB78K | |
| Acer Predator 17 G9-793-70PJ | |
| 3DMark 11 - 1280x720 Performance GPU | |
| Schenker XMG U727 2017 | |
| Acer Predator 17 X GX-792-76DL | |
| MSI GT72VR 7RE-433 | |
| Acer Predator 17 G9-793-70PJ | |
| Asus G752VS-XB78K | |
| 3DMark 11 Performance | 16430 pontos | |
| 3DMark Cloud Gate Standard Score | 27050 pontos | |
| 3DMark Fire Strike Score | 13353 pontos | |
| 3DMark Time Spy Score | 5059 pontos | |
Ajuda | ||
| baixo | média | alto | ultra | 4K | |
|---|---|---|---|---|---|
| The Witcher 3 (2015) | 104 | 59.4 | 38.7 | ||
| For Honor (2017) | 142 | 106 | 43.6 | ||
| Ghost Recon Wildlands (2017) | 84.6 | 49.5 | 32.3 | ||
| Mass Effect Andromeda (2017) | 77.7 | 68.9 | 31.6 | ||
| Warhammer 40.000: Dawn of War III (2017) | 57.8 | 51.4 | 18.2 | ||
| Prey (2017) | 134 | 129 | 46.7 |
Barulho
| Ocioso |
| 32 / 35 / 38 dB |
| HDD |
| 35 dB |
| Carga |
| 42 / 50 dB |
 | ||
30 dB silencioso 40 dB(A) audível 50 dB(A) ruidosamente alto |
||
min: | ||
| Acer Predator 17 G9-793-70PJ i7-7700HQ, GeForce GTX 1070 Mobile | MSI GT72VR 7RE-433 i7-7700HQ, GeForce GTX 1070 Mobile | Asus G752VS-XB78K 6820HK, GeForce GTX 1070 Mobile | Acer Predator 17 X GX-792-76DL i7-7820HK, GeForce GTX 1080 Mobile | Schenker XMG U727 2017 i7-7700K, GeForce GTX 1080 Mobile | |
|---|---|---|---|---|---|
| Noise | 4% | 7% | 1% | -2% | |
| desligado / ambiente * (dB) | 31 | 31 -0% | 30 3% | 30 3% | 30 3% |
| Idle Minimum * (dB) | 32 | 34 -6% | 31 3% | 33 -3% | 31 3% |
| Idle Average * (dB) | 35 | 35 -0% | 32 9% | 35 -0% | 34 3% |
| Idle Maximum * (dB) | 38 | 37 3% | 33 13% | 37 3% | 37 3% |
| Load Average * (dB) | 42 | 37 12% | 40 5% | 40 5% | 44 -5% |
| Witcher 3 ultra * (dB) | 44 | 51 -16% | |||
| Load Maximum * (dB) | 50 | 44 12% | 47 6% | 50 -0% | 52 -4% |
* ... menor é melhor
(+) A temperatura máxima no lado superior é 39.1 °C / 102 F, em comparação com a média de 40.4 °C / 105 F , variando de 21.2 a 68.8 °C para a classe Gaming.
(±) A parte inferior aquece até um máximo de 42.1 °C / 108 F, em comparação com a média de 43.2 °C / 110 F
(+) Em uso inativo, a temperatura média para o lado superior é 25.3 °C / 78 F, em comparação com a média do dispositivo de 33.9 °C / ### class_avg_f### F.
(±) Jogando The Witcher 3, a temperatura média para o lado superior é 33.3 °C / 92 F, em comparação com a média do dispositivo de 33.9 °C / ## #class_avg_f### F.
(+) Os apoios para as mãos e o touchpad são mais frios que a temperatura da pele, com um máximo de 31.8 °C / 89.2 F e, portanto, são frios ao toque.
(-) A temperatura média da área do apoio para as mãos de dispositivos semelhantes foi 28.8 °C / 83.8 F (-3 °C / -5.4 F).
| Acer Predator 17 G9-793-70PJ i7-7700HQ, GeForce GTX 1070 Mobile | MSI GT72VR 7RE-433 i7-7700HQ, GeForce GTX 1070 Mobile | Asus G752VS-XB78K 6820HK, GeForce GTX 1070 Mobile | Acer Predator 17 X GX-792-76DL i7-7820HK, GeForce GTX 1080 Mobile | Schenker XMG U727 2017 i7-7700K, GeForce GTX 1080 Mobile | |
|---|---|---|---|---|---|
| Heat | -5% | -9% | -14% | -27% | |
| Maximum Upper Side * (°C) | 39.1 | 41.5 -6% | 42.9 -10% | 44.2 -13% | 47.5 -21% |
| Maximum Bottom * (°C) | 42.1 | 50.6 -20% | 41.5 1% | 43 -2% | 56 -33% |
| Idle Upper Side * (°C) | 27.9 | 26.4 5% | 31.6 -13% | 32.4 -16% | 34.5 -24% |
| Idle Bottom * (°C) | 26.1 | 25.4 3% | 29.5 -13% | 32.8 -26% | 33.6 -29% |
* ... menor é melhor
Acer Predator 17 G9-793-70PJ análise de áudio
(+) | os alto-falantes podem tocar relativamente alto (###valor### dB)
Graves 100 - 315Hz
(±) | graves reduzidos - em média 5.5% menor que a mediana
(±) | a linearidade dos graves é média (8% delta para a frequência anterior)
Médios 400 - 2.000 Hz
(+) | médios equilibrados - apenas 2.9% longe da mediana
(+) | médios são lineares (3.5% delta para frequência anterior)
Altos 2 - 16 kHz
(±) | máximos reduzidos - em média 5.2% menor que a mediana
(+) | os máximos são lineares (6.2% delta da frequência anterior)
Geral 100 - 16.000 Hz
(+) | o som geral é linear (10.3% diferença em relação à mediana)
Comparado com a mesma classe
» 6% de todos os dispositivos testados nesta classe foram melhores, 2% semelhantes, 93% piores
» O melhor teve um delta de 6%, a média foi 18%, o pior foi 132%
Comparado com todos os dispositivos testados
» 5% de todos os dispositivos testados foram melhores, 1% semelhantes, 94% piores
» O melhor teve um delta de 4%, a média foi 23%, o pior foi 134%
MSI GT72VR 7RE-433 análise de áudio
(+) | os alto-falantes podem tocar relativamente alto (###valor### dB)
Graves 100 - 315Hz
(±) | graves reduzidos - em média 5.4% menor que a mediana
(±) | a linearidade dos graves é média (11.3% delta para a frequência anterior)
Médios 400 - 2.000 Hz
(±) | médios mais altos - em média 5% maior que a mediana
(+) | médios são lineares (4.1% delta para frequência anterior)
Altos 2 - 16 kHz
(+) | agudos equilibrados - apenas 4.7% longe da mediana
(+) | os máximos são lineares (5.7% delta da frequência anterior)
Geral 100 - 16.000 Hz
(+) | o som geral é linear (11.7% diferença em relação à mediana)
Comparado com a mesma classe
» 11% de todos os dispositivos testados nesta classe foram melhores, 4% semelhantes, 85% piores
» O melhor teve um delta de 6%, a média foi 18%, o pior foi 132%
Comparado com todos os dispositivos testados
» 8% de todos os dispositivos testados foram melhores, 3% semelhantes, 89% piores
» O melhor teve um delta de 4%, a média foi 23%, o pior foi 134%
| desligado | |
| Ocioso | |
| Carga |
|
Key:
min: | |
| Acer Predator 17 G9-793-70PJ i7-7700HQ, GeForce GTX 1070 Mobile | MSI GT72VR 7RE-433 i7-7700HQ, GeForce GTX 1070 Mobile | Asus G752VS-XB78K 6820HK, GeForce GTX 1070 Mobile | Acer Predator 17 X GX-792-76DL i7-7820HK, GeForce GTX 1080 Mobile | Schenker XMG U727 2017 i7-7700K, GeForce GTX 1080 Mobile | |
|---|---|---|---|---|---|
| Power Consumption | 16% | 5% | -7% | -43% | |
| Idle Minimum * (Watt) | 23 | 20 13% | 24 -4% | 27 -17% | 32 -39% |
| Idle Average * (Watt) | 33 | 27 18% | 31 6% | 32 3% | 43 -30% |
| Idle Maximum * (Watt) | 40 | 31 22% | 36 10% | 41 -2% | 51 -27% |
| Load Average * (Watt) | 94 | 86 9% | 94 -0% | 102 -9% | 138 -47% |
| Witcher 3 ultra * (Watt) | 177 | 279 -58% | |||
| Load Maximum * (Watt) | 228 | 184 19% | 204 11% | 248 -9% | 350 -54% |
* ... menor é melhor
| Acer Predator 17 G9-793-70PJ i7-7700HQ, GeForce GTX 1070 Mobile, 88 Wh | MSI GT72VR 7RE-433 i7-7700HQ, GeForce GTX 1070 Mobile, 83 Wh | Asus G752VS-XB78K 6820HK, GeForce GTX 1070 Mobile, 90 Wh | Acer Predator 17 X GX-792-76DL i7-7820HK, GeForce GTX 1080 Mobile, 88.8 Wh | Schenker XMG U727 2017 i7-7700K, GeForce GTX 1080 Mobile, 89 Wh | |
|---|---|---|---|---|---|
| Duração da bateria | 1% | -5% | 4% | -15% | |
| Reader / Idle (h) | 5.4 | 5.3 -2% | 5.2 -4% | 5.2 -4% | 3.7 -31% |
| WiFi v1.3 (h) | 3.6 | 3.8 6% | 3.5 -3% | 4.2 17% | 2.8 -22% |
| Load (h) | 1.5 | 1.5 0% | 1.4 -7% | 1.5 0% | 1.6 7% |
| H.264 (h) | 3.8 | 3.1 | 3.4 |
Pro
Contra
Desde o nosso teste Skylake, nosso veredicto sobre o Predator visualmente extravagante permanece quase inalterado.
Com o equipamento destacado, a versão Kaby-Lake também ganha pontos com um excelente painel UHD, que está no topo da maioria das disciplinas (como nos ângulos de visão, contraste e espaço de cores).
Além disso, está um desempenho de primeira classe que pode ser aumentado ainda mais através do PredatorSense (overclock da GPU opcional). A proteção para o futuro também é atendida, seja na forma dos 32 GB de RAM, a alta capacidade das unidades (combinação SSD-HD) ou a porta Thunderbolt-3.
Vemos as desvantagens no tamanho e peso. Qualquer pessoa que costuma transportar seu portátil deve comprar um dispositivo mais compacto, que suporte Optimus (dado que tende a ter uma melhor duração de bateria). No entanto, os jogadores que jogam principalmente em um lugar fixo, dificilmente devem ser incomodados por isso.
Acer Predator 17 G9-793-70PJ
- 05/20/2017 v6 (old)
Florian Glaser