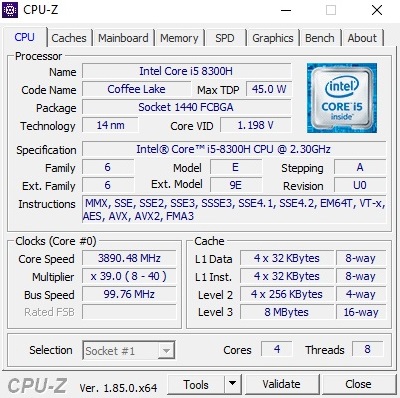
Breve Análise do Portátil Acer Predator Helios 300 (i5-8300H, GTX 1050 Ti, Full-HD)
| SD Card Reader | |
| average JPG Copy Test (av. of 3 runs) | |
| Média da turma Gaming (20.9 - 210, n=54, últimos 2 anos) | |
| Acer Predator Helios 300 (Toshiba Exceria Pro SDXC 64 GB UHS-II) | |
| Acer Predator Helios 300 PH317-52-51M6 (Toshiba Exceria Pro SDXC 64 GB UHS-II) | |
| Asus GL753VE-DS74 (Toshiba Exceria Pro SDXC 64 GB UHS-II) | |
| Asus ROG Strix GL702ZC-GC204T (Toshiba Exceria Pro SDXC 64 GB UHS-II) | |
| Acer Aspire Nitro BE VN7-793G-5811 (Toshiba Exceria Pro SDXC 64 GB UHS-II) | |
| maximum AS SSD Seq Read Test (1GB) | |
| Média da turma Gaming (25.5 - 261, n=51, últimos 2 anos) | |
| Asus GL753VE-DS74 (Toshiba Exceria Pro SDXC 64 GB UHS-II) | |
| Asus ROG Strix GL702ZC-GC204T (Toshiba Exceria Pro SDXC 64 GB UHS-II) | |
| Acer Predator Helios 300 PH317-52-51M6 (Toshiba Exceria Pro SDXC 64 GB UHS-II) | |
| Acer Predator Helios 300 (Toshiba Exceria Pro SDXC 64 GB UHS-II) | |
| Acer Aspire Nitro BE VN7-793G-5811 (Toshiba Exceria Pro SDXC 64 GB UHS-II) | |
| |||||||||||||||||||||||||
iluminação: 89 %
iluminação com acumulador: 365 cd/m²
Contraste: 1141:1 (Preto: 0.32 cd/m²)
ΔE ColorChecker Calman: 6.51 | ∀{0.5-29.43 Ø4.71}
calibrated: 2.9
ΔE Greyscale Calman: 7.65 | ∀{0.09-98 Ø4.96}
86% sRGB (Argyll 1.6.3 3D)
56% AdobeRGB 1998 (Argyll 1.6.3 3D)
63% AdobeRGB 1998 (Argyll 3D)
86.1% sRGB (Argyll 3D)
67.1% Display P3 (Argyll 3D)
Gamma: 2.64
CCT: 8066 K
| Acer Predator Helios 300 PH317-52-51M6 LG Philips LP173WF4-SPF5 (LGD056D), IPS, 1920x1080 | Acer Predator Helios 300 LG LP173WF4-SPF5 (LGD056D), AH-IPS, WLED, 1920x1080 | Acer Aspire Nitro BE VN7-793G-5811 AU Optronics, IPS, 1920x1080 | Asus GL753VE-DS74 LG Philips LP173WF4-SPF3, IPS, 1920x1080 | Asus ROG Strix GL702ZC-GC204T LG Philips LP173WF4-SPF5, IPS, 1920x1080 | |
|---|---|---|---|---|---|
| Display | 0% | -2% | -4% | ||
| Display P3 Coverage (%) | 67.1 | 66.8 0% | 63.1 -6% | 65.4 -3% | |
| sRGB Coverage (%) | 86.1 | 85.8 0% | 86.5 0% | 82.6 -4% | |
| AdobeRGB 1998 Coverage (%) | 63 | 62.8 0% | 63.3 0% | 60.4 -4% | |
| Response Times | 5% | -15% | 0% | -3% | |
| Response Time Grey 50% / Grey 80% * (ms) | 36 ? | 36 ? -0% | 38 ? -6% | 36 ? -0% | 36 ? -0% |
| Response Time Black / White * (ms) | 22 ? | 20 ? 9% | 27 ? -23% | 22 ? -0% | 23 ? -5% |
| PWM Frequency (Hz) | 122000 ? | 119000 ? | |||
| Screen | 9% | 6% | 10% | 5% | |
| Brightness middle (cd/m²) | 365 | 384 5% | 301 -18% | 366 0% | 415 14% |
| Brightness (cd/m²) | 341 | 373 9% | 270 -21% | 348 2% | 365 7% |
| Brightness Distribution (%) | 89 | 93 4% | 79 -11% | 90 1% | 82 -8% |
| Black Level * (cd/m²) | 0.32 | 0.35 -9% | 0.38 -19% | 0.35 -9% | 0.42 -31% |
| Contrast (:1) | 1141 | 1097 -4% | 792 -31% | 1046 -8% | 988 -13% |
| Colorchecker dE 2000 * | 6.51 | 4.81 26% | 3.49 46% | 4.4 32% | 4.95 24% |
| Colorchecker dE 2000 max. * | 12.32 | 8.69 29% | 7.49 39% | 9.7 21% | 9.34 24% |
| Colorchecker dE 2000 calibrated * | 2.9 | ||||
| Greyscale dE 2000 * | 7.65 | 5.33 30% | 1.88 75% | 3 61% | 4.69 39% |
| Gamma | 2.64 83% | 2.45 90% | 2.35 94% | 2.1 105% | 2.33 94% |
| CCT | 8066 81% | 7137 91% | 6587 99% | 6362 102% | 6485 100% |
| Color Space (Percent of AdobeRGB 1998) (%) | 56 | 56 0% | 56 0% | 56 0% | 54 -4% |
| Color Space (Percent of sRGB) (%) | 86 | 86 0% | 86 0% | 86 0% | 82 -5% |
| Média Total (Programa/Configurações) | 5% /
7% | -4% /
2% | 5% /
8% | -1% /
2% |
* ... menor é melhor
Exibir tempos de resposta
| ↔ Tempo de resposta preto para branco | ||
|---|---|---|
| 22 ms ... ascensão ↗ e queda ↘ combinadas | ↗ 10.4 ms ascensão | 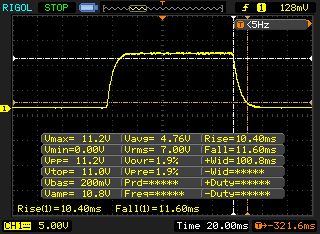 |
| ↘ 11.6 ms queda | ||
| A tela mostra boas taxas de resposta em nossos testes, mas pode ser muito lenta para jogadores competitivos. Em comparação, todos os dispositivos testados variam de 0.1 (mínimo) a 240 (máximo) ms. » 49 % de todos os dispositivos são melhores. Isso significa que o tempo de resposta medido é pior que a média de todos os dispositivos testados (19.8 ms). | ||
| ↔ Tempo de resposta 50% cinza a 80% cinza | ||
| 36 ms ... ascensão ↗ e queda ↘ combinadas | ↗ 18.8 ms ascensão | 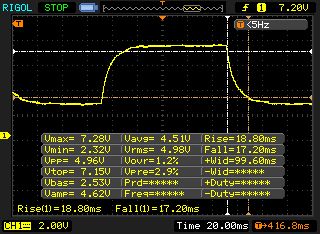 |
| ↘ 17.2 ms queda | ||
| A tela mostra taxas de resposta lentas em nossos testes e será insatisfatória para os jogadores. Em comparação, todos os dispositivos testados variam de 0.165 (mínimo) a 636 (máximo) ms. » 51 % de todos os dispositivos são melhores. Isso significa que o tempo de resposta medido é pior que a média de todos os dispositivos testados (31 ms). | ||
Cintilação da tela / PWM (modulação por largura de pulso)
| Tela tremeluzindo/PWM detectado | 122000 Hz | ≤ 95 % configuração de brilho | 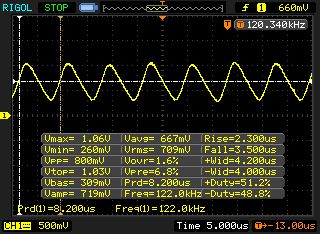 |
A luz de fundo da tela pisca em 122000 Hz (pior caso, por exemplo, utilizando PWM) Cintilação detectada em uma configuração de brilho de 95 % e abaixo. Não deve haver cintilação ou PWM acima desta configuração de brilho. A frequência de 122000 Hz é bastante alta, então a maioria dos usuários sensíveis ao PWM não deve notar nenhuma oscilação. [pwm_comparison] Em comparação: 52 % de todos os dispositivos testados não usam PWM para escurecer a tela. Se PWM foi detectado, uma média de 7754 (mínimo: 5 - máximo: 343500) Hz foi medida. | |||
| PCMark 8 Home Score Accelerated v2 | 4253 pontos | |
| PCMark 8 Work Score Accelerated v2 | 5347 pontos | |
Ajuda | ||
| Acer Predator Helios 300 PH317-52-51M6 Hynix HFS128G39TND | Acer Predator Helios 300 Intel SSD 600p SSDPEKKW512G7 | Acer Aspire Nitro BE VN7-793G-5811 Seagate Mobile HDD 1TB ST1000LM035 | Asus GL753VE-DS74 Intel SSD 600p SSDPEKKW512G7 | Asus ROG Strix GL702ZC-GC204T Seagate Mobile HDD 1TB ST1000LX015-1U7172 | |
|---|---|---|---|---|---|
| AS SSD | 141% | 142% | |||
| Seq Read (MB/s) | 513 | 1558 204% | 1500 192% | ||
| Seq Write (MB/s) | 128.2 | 552 331% | 558 335% | ||
| 4K Read (MB/s) | 26.5 | 29.02 10% | 32.5 23% | ||
| 4K Write (MB/s) | 62.7 | 111.3 78% | 119.7 91% | ||
| Score Read (Points) | 414 | 690 67% | 681 64% | ||
| Score Write (Points) | 196 | 588 200% | 575 193% | ||
| Score Total (Points) | 811 | 1588 96% | 1566 93% |

| 3DMark 11 Performance | 9101 pontos | |
| 3DMark Ice Storm Standard Score | 85238 pontos | |
| 3DMark Cloud Gate Standard Score | 22710 pontos | |
| 3DMark Fire Strike Score | 6685 pontos | |
Ajuda | ||
| The Witcher 3 | |
| 1920x1080 Ultra Graphics & Postprocessing (HBAO+) | |
| Média da turma Gaming (104.7 - 240, n=7, últimos 2 anos) | |
| Acer Predator Helios 300 | |
| Asus ROG Strix GL702ZC-GC204T | |
| Asus GL753VE-DS74 | |
| Acer Predator Helios 300 PH317-52-51M6 | |
| Acer Aspire Nitro BE VN7-793G-5811 | |
| 1920x1080 High Graphics & Postprocessing (Nvidia HairWorks Off) | |
| Média da turma Gaming (341 - 404, n=2, últimos 2 anos) | |
| Acer Predator Helios 300 | |
| Asus ROG Strix GL702ZC-GC204T | |
| Acer Aspire Nitro BE VN7-793G-5811 | |
| Acer Predator Helios 300 PH317-52-51M6 | |
| baixo | média | alto | ultra | |
|---|---|---|---|---|
| The Witcher 3 (2015) | 46.7 | 26 | ||
| Playerunknown's Battlegrounds (PUBG) (2017) | 62.4 | 41.4 | ||
| The Evil Within 2 (2017) | 31.5 | 30.7 | ||
| ELEX (2017) | 43.4 | 32.7 | ||
| Wolfenstein II: The New Colossus (2017) | 56.9 | 52.5 | ||
| Call of Duty WWII (2017) | 63.4 | 47.9 | ||
| Fortnite (2018) | 76.7 | 54.6 | ||
| Kingdom Come: Deliverance (2018) | 38.9 | 28.8 |
Barulho
| Ocioso |
| 29 / 31 / 33 dB |
| HDD |
| 31 dB |
| Carga |
| 45 / 51 dB |
 | ||
30 dB silencioso 40 dB(A) audível 50 dB(A) ruidosamente alto |
||
min: | ||
| Acer Predator Helios 300 PH317-52-51M6 i5-8300H, GeForce GTX 1050 Ti Mobile | Acer Predator Helios 300 i7-7700HQ, GeForce GTX 1060 Mobile | Acer Aspire Nitro BE VN7-793G-5811 i5-7300HQ, GeForce GTX 1050 Ti Mobile | Asus GL753VE-DS74 i7-7700HQ, GeForce GTX 1050 Ti Mobile | Asus ROG Strix GL702ZC-GC204T R5 1600, Radeon RX 580 (Laptop) | Média da turma Gaming | |
|---|---|---|---|---|---|---|
| Noise | -2% | 8% | -2% | -3% | 8% | |
| desligado / ambiente * (dB) | 29 | 31 -7% | 29.7 -2% | 29.1 -0% | 30.2 -4% | 24.1 ? 17% |
| Idle Minimum * (dB) | 29 | 31 -7% | 30.2 -4% | 33.3 -15% | 30.6 -6% | 26 ? 10% |
| Idle Average * (dB) | 31 | 32 -3% | 30.2 3% | 33.3 -7% | 32.7 -5% | 27.4 ? 12% |
| Idle Maximum * (dB) | 33 | 33 -0% | 30.6 7% | 33.4 -1% | 32.7 1% | 30.1 ? 9% |
| Load Average * (dB) | 45 | 44 2% | 33.8 25% | 42.6 5% | 38.9 14% | 43.6 ? 3% |
| Witcher 3 ultra * (dB) | 45 | 46 -2% | 39.5 12% | 46.8 -4% | 53.4 -19% | |
| Load Maximum * (dB) | 51 | 50 2% | 42.6 16% | 46.8 8% | 50.6 1% | 54.2 ? -6% |
* ... menor é melhor
(-) A temperatura máxima no lado superior é 50 °C / 122 F, em comparação com a média de 40.4 °C / 105 F , variando de 21.2 a 68.8 °C para a classe Gaming.
(-) A parte inferior aquece até um máximo de 52 °C / 126 F, em comparação com a média de 43.2 °C / 110 F
(+) Em uso inativo, a temperatura média para o lado superior é 28.2 °C / 83 F, em comparação com a média do dispositivo de 33.9 °C / ### class_avg_f### F.
(-) Jogando The Witcher 3, a temperatura média para o lado superior é 39.3 °C / 103 F, em comparação com a média do dispositivo de 33.9 °C / ## #class_avg_f### F.
(+) Os apoios para as mãos e o touchpad são mais frios que a temperatura da pele, com um máximo de 31 °C / 87.8 F e, portanto, são frios ao toque.
(-) A temperatura média da área do apoio para as mãos de dispositivos semelhantes foi 28.8 °C / 83.8 F (-2.2 °C / -4 F).
| Acer Predator Helios 300 PH317-52-51M6 i5-8300H, GeForce GTX 1050 Ti Mobile | Acer Predator Helios 300 i7-7700HQ, GeForce GTX 1060 Mobile | Acer Aspire Nitro BE VN7-793G-5811 i5-7300HQ, GeForce GTX 1050 Ti Mobile | Asus GL753VE-DS74 i7-7700HQ, GeForce GTX 1050 Ti Mobile | Asus ROG Strix GL702ZC-GC204T R5 1600, Radeon RX 580 (Laptop) | Média da turma Gaming | |
|---|---|---|---|---|---|---|
| Heat | -10% | 9% | 29% | -8% | 2% | |
| Maximum Upper Side * (°C) | 50 | 57 -14% | 48 4% | 35.8 28% | 54.3 -9% | 45.2 ? 10% |
| Maximum Bottom * (°C) | 52 | 59 -13% | 40.8 22% | 36.4 30% | 51 2% | 48.1 ? 7% |
| Idle Upper Side * (°C) | 33 | 36 -9% | 29.9 9% | 22.2 33% | 36 -9% | 31 ? 6% |
| Idle Bottom * (°C) | 30 | 31 -3% | 29.8 1% | 22.2 26% | 34.3 -14% | 34.2 ? -14% |
* ... menor é melhor
Acer Predator Helios 300 PH317-52-51M6 análise de áudio
(+) | os alto-falantes podem tocar relativamente alto (###valor### dB)
Graves 100 - 315Hz
(±) | graves reduzidos - em média 10.8% menor que a mediana
(-) | graves não são lineares (15.2% delta para frequência anterior)
Médios 400 - 2.000 Hz
(±) | médios mais altos - em média 9.7% maior que a mediana
(+) | médios são lineares (6.7% delta para frequência anterior)
Altos 2 - 16 kHz
(+) | agudos equilibrados - apenas 3.2% longe da mediana
(+) | os máximos são lineares (5.6% delta da frequência anterior)
Geral 100 - 16.000 Hz
(±) | a linearidade do som geral é média (18.4% diferença em relação à mediana)
Comparado com a mesma classe
» 59% de todos os dispositivos testados nesta classe foram melhores, 9% semelhantes, 32% piores
» O melhor teve um delta de 6%, a média foi 18%, o pior foi 132%
Comparado com todos os dispositivos testados
» 41% de todos os dispositivos testados foram melhores, 8% semelhantes, 51% piores
» O melhor teve um delta de 4%, a média foi 23%, o pior foi 134%
Acer Aspire Nitro BE VN7-793G-5811 análise de áudio
(±) | o volume do alto-falante é médio, mas bom (###valor### dB)
Graves 100 - 315Hz
(±) | graves reduzidos - em média 6.9% menor que a mediana
(+) | o baixo é linear (5.5% delta para a frequência anterior)
Médios 400 - 2.000 Hz
(+) | médios equilibrados - apenas 4.5% longe da mediana
(+) | médios são lineares (6.3% delta para frequência anterior)
Altos 2 - 16 kHz
(+) | agudos equilibrados - apenas 1.1% longe da mediana
(+) | os máximos são lineares (3.5% delta da frequência anterior)
Geral 100 - 16.000 Hz
(+) | o som geral é linear (11.5% diferença em relação à mediana)
Comparado com a mesma classe
» 18% de todos os dispositivos testados nesta classe foram melhores, 4% semelhantes, 78% piores
» O melhor teve um delta de 5%, a média foi 17%, o pior foi 45%
Comparado com todos os dispositivos testados
» 8% de todos os dispositivos testados foram melhores, 2% semelhantes, 90% piores
» O melhor teve um delta de 4%, a média foi 23%, o pior foi 134%
| desligado | |
| Ocioso | |
| Carga |
|
Key:
min: | |
| Acer Predator Helios 300 PH317-52-51M6 i5-8300H, GeForce GTX 1050 Ti Mobile | Acer Predator Helios 300 i7-7700HQ, GeForce GTX 1060 Mobile | Acer Aspire Nitro BE VN7-793G-5811 i5-7300HQ, GeForce GTX 1050 Ti Mobile | Asus GL753VE-DS74 i7-7700HQ, GeForce GTX 1050 Ti Mobile | Asus ROG Strix GL702ZC-GC204T R5 1600, Radeon RX 580 (Laptop) | Média da turma Gaming | |
|---|---|---|---|---|---|---|
| Power Consumption | -24% | -12% | -2% | -329% | -85% | |
| Idle Minimum * (Watt) | 6 | 7 -17% | 8.7 -45% | 7.5 -25% | 49 -717% | 13 ? -117% |
| Idle Average * (Watt) | 9 | 13 -44% | 12.4 -38% | 11.3 -26% | 60 -567% | 19 ? -111% |
| Idle Maximum * (Watt) | 13 | 20 -54% | 15.4 -18% | 11.8 9% | 68 -423% | 24.6 ? -89% |
| Load Average * (Watt) | 95 | 81 15% | 73 23% | 82.1 14% | 150 -58% | 110.7 ? -17% |
| Witcher 3 ultra * (Watt) | 102 | 127 -25% | 98 4% | 96.3 6% | 214 -110% | |
| Load Maximum * (Watt) | 134 | 162 -21% | 130 3% | 116.6 13% | 262 -96% | 259 ? -93% |
* ... menor é melhor
| Acer Predator Helios 300 PH317-52-51M6 i5-8300H, GeForce GTX 1050 Ti Mobile, 48 Wh | Acer Predator Helios 300 i7-7700HQ, GeForce GTX 1060 Mobile, 48 Wh | Acer Aspire Nitro BE VN7-793G-5811 i5-7300HQ, GeForce GTX 1050 Ti Mobile, 52.5 Wh | Asus GL753VE-DS74 i7-7700HQ, GeForce GTX 1050 Ti Mobile, 48 Wh | Asus ROG Strix GL702ZC-GC204T R5 1600, Radeon RX 580 (Laptop), 74 Wh | Média da turma Gaming | |
|---|---|---|---|---|---|---|
| Duração da bateria | -27% | -22% | -38% | -78% | -7% | |
| Reader / Idle (h) | 11.8 | 10.2 -14% | 8.7 -26% | 8.27 ? -30% | ||
| WiFi v1.3 (h) | 5.9 | 4.7 -20% | 4.6 -22% | 3.9 -34% | 1.3 -78% | 7.11 ? 21% |
| Load (h) | 1.7 | 0.9 -47% | 0.8 -53% | 1.502 ? -12% | ||
| H.264 (h) | 4.7 | 8.32 ? |
Pro
Contra
Mesmo que a Acer tenha cortado muitos cantos para baixar o preço (SSD lento, poucas portas, baixa qualidade de som), o Predator Helios 300 ainda é um excelente dispositivo.
Os dispositivos de entrada e a qualidade de construção definitivamente não são de alto nível. Dito isto, algumas falhas são esperadas de um dispositivo de 1000 euros ($1178).
Os compradores não ficarão desapontados quando se tratar do desempenho. Até mesmo a configuração básica com o Core i5 2430M e a GeForce GTX 1050 Ti pode rodar quase todos os títulos a 1080p. No entanto, a tela IPS, que possui alto brilho e boa relação de contraste, sofre com o bleeding da tela e a reprodução de cores inadequada. O gerenciamento térmico e o ruído do sistema não são relevantes.
Em suma, o dispositivos de 17 polegadas é uma oferta interessante para os jogadores conscientes dos preços. A duração da bateria também fala em favor do dispositivo.
Acer Predator Helios 300 PH317-52-51M6
- 06/02/2018 v6 (old)
Florian Glaser