Breve Análise do Asus ROG GL753VE (7700HQ, 1050 Ti)
| SD Card Reader | |
| average JPG Copy Test (av. of 3 runs) | |
| Nexoc G739 | |
| Asus Strix GL753VD-GC045T | |
| Lenovo Legion Y520-15IKBN-80WK001KUS | |
| Asus GL753VE-DS74 | |
| MSI GE72 7RE-046 | |
| Acer Aspire Nitro BE VN7-793G-5811 | |
| Dell Inspiron 15 7000 7567 | |
| maximum AS SSD Seq Read Test (1GB) | |
| Asus GL753VE-DS74 | |
| Lenovo Legion Y520-15IKBN-80WK001KUS | |
| Nexoc G739 | |
| Asus Strix GL753VD-GC045T | |
| MSI GE72 7RE-046 | |
| Dell Inspiron 15 7000 7567 | |
| Acer Aspire Nitro BE VN7-793G-5811 | |
| |||||||||||||||||||||||||
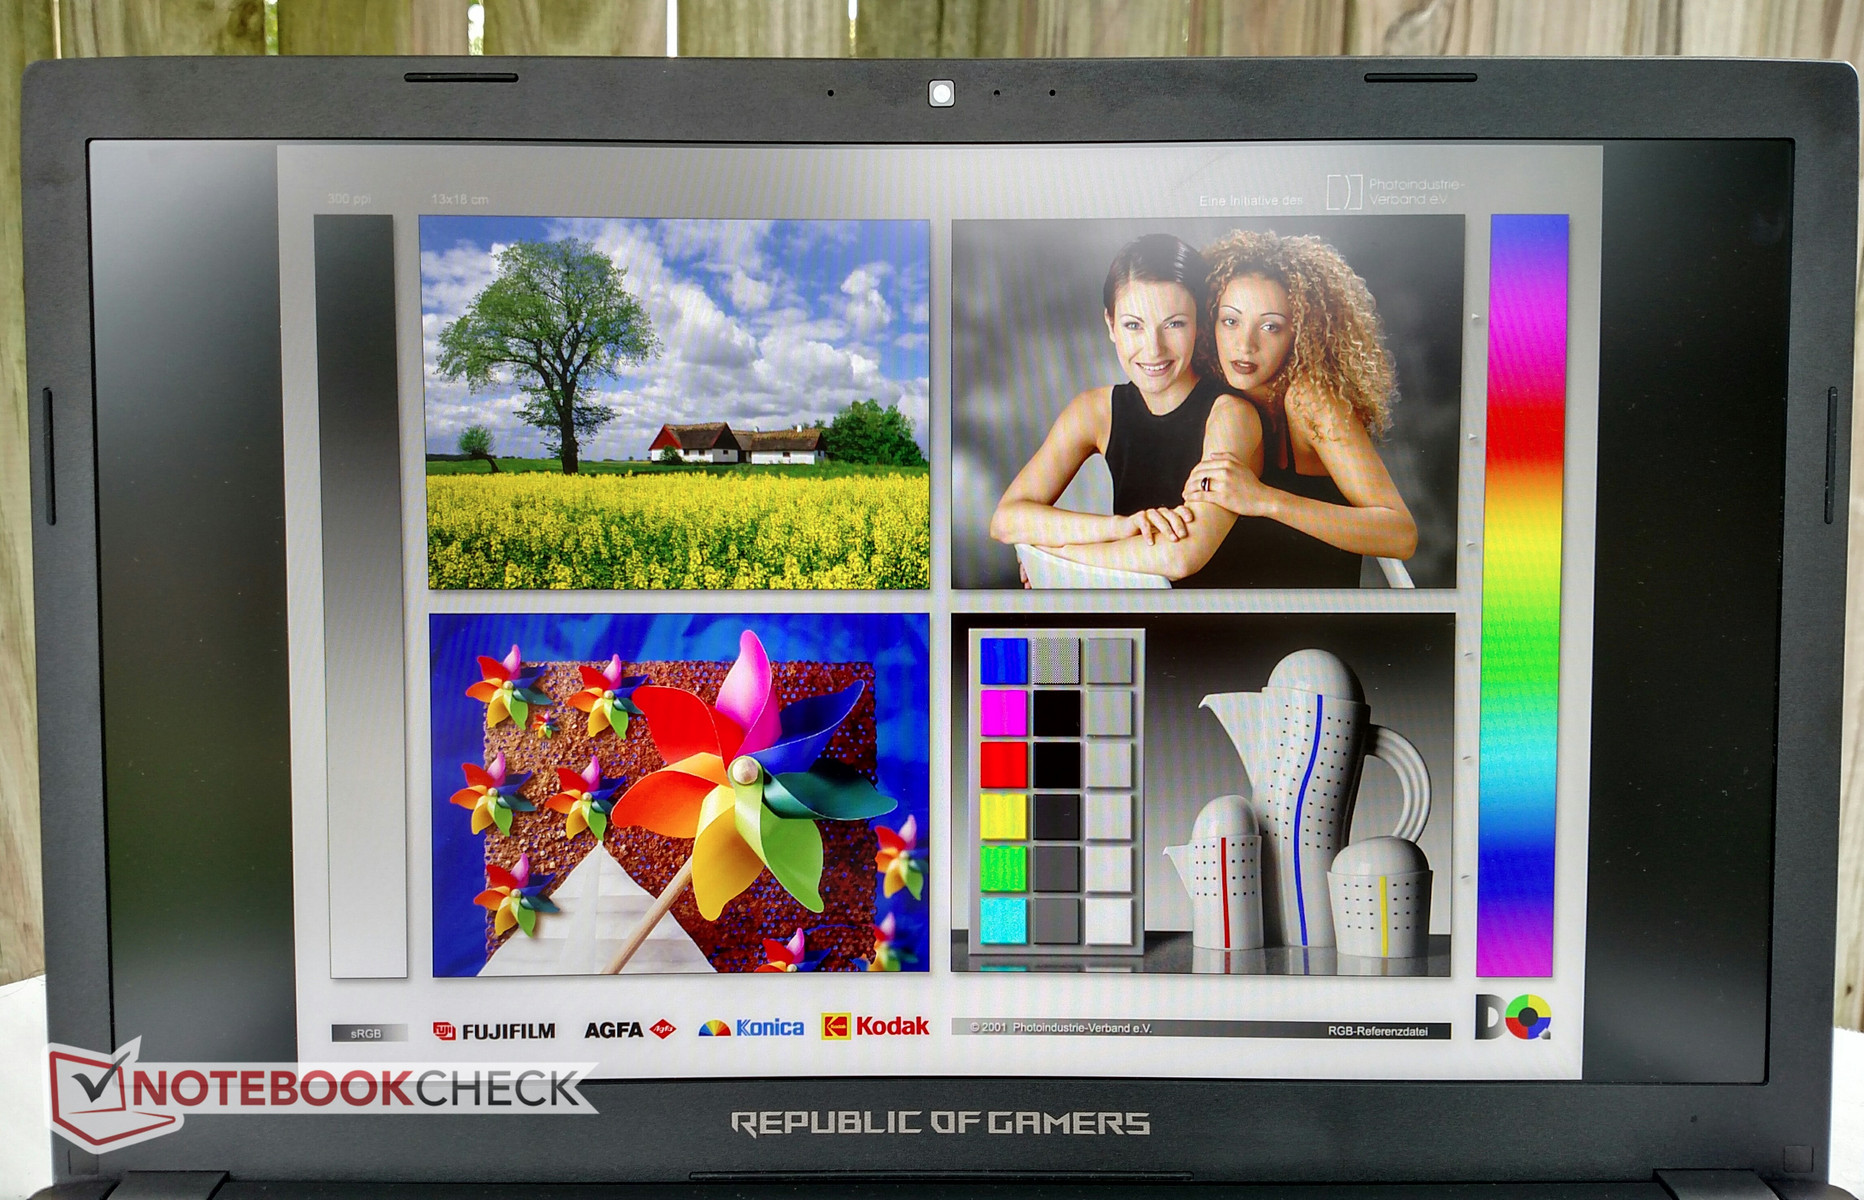
iluminação: 90 %
iluminação com acumulador: 366 cd/m²
Contraste: 1046:1 (Preto: 0.35 cd/m²)
ΔE ColorChecker Calman: 4.4 | ∀{0.5-29.43 Ø4.71}
ΔE Greyscale Calman: 3 | ∀{0.09-98 Ø4.96}
86% sRGB (Argyll 1.6.3 3D)
56% AdobeRGB 1998 (Argyll 1.6.3 3D)
Gamma: 2.1
CCT: 6362 K
| Asus GL753VE-DS74 LG Philips LP173WF4-SPF3, IPS, 17.3", 1920x1080 | Asus Strix GL753VD-GC045T LP173WF4-SPF3, LED IPS, 17.3", 1920x1080 | Acer Aspire Nitro BE VN7-793G-5811 AU Optronics, IPS, 17.3", 1920x1080 | Nexoc G739 CMN1738, IPS, 17.3", 1920x1080 | MSI GE72 7RE-046 N173HHE-G32 (CMN1747), TN LED, 17.3", 1920x1080 | Dell Inspiron 15 7000 7567 AU Optronics AUO38ED B156HTN 28H80, TN, 15.6", 1920x1080 | Lenovo Legion Y520-15IKBN-80WK001KUS LP156WF6-SPK3, IPS, 15.6", 1920x1080 | |
|---|---|---|---|---|---|---|---|
| Display | |||||||
| Display P3 Coverage (%) | 67.1 | 63.1 | 66.7 | 90.7 | 36.42 | ||
| sRGB Coverage (%) | 84.8 | 86.5 | 91 | 99.9 | 54.9 | ||
| AdobeRGB 1998 Coverage (%) | 62 | 63.3 | 66.4 | 85.2 | 37.62 | ||
| Response Times | -12% | -15% | -26% | 42% | -32% | -64% | |
| Response Time Grey 50% / Grey 80% * (ms) | 36 ? | 33.2 ? 8% | 38 ? -6% | 45 ? -25% | 27 ? 25% | 36 ? -0% | 58.8 ? -63% |
| Response Time Black / White * (ms) | 22 ? | 28.8 ? -31% | 27 ? -23% | 28 ? -27% | 9 ? 59% | 36 ? -64% | 36 ? -64% |
| PWM Frequency (Hz) | 450 ? | 21550 ? | |||||
| Screen | -15% | -0% | 3% | -15% | -88% | -46% | |
| Brightness middle (cd/m²) | 366 | 349 -5% | 301 -18% | 312 -15% | 253 -31% | 246 -33% | 239 -35% |
| Brightness (cd/m²) | 348 | 337 -3% | 270 -22% | 304 -13% | 230 -34% | 235 -32% | 244 -30% |
| Brightness Distribution (%) | 90 | 91 1% | 79 -12% | 85 -6% | 86 -4% | 75 -17% | 88 -2% |
| Black Level * (cd/m²) | 0.35 | 0.58 -66% | 0.38 -9% | 0.23 34% | 0.24 31% | 0.55 -57% | 0.35 -0% |
| Contrast (:1) | 1046 | 602 -42% | 792 -24% | 1357 30% | 1054 1% | 447 -57% | 683 -35% |
| Colorchecker dE 2000 * | 4.4 | 4.5 -2% | 3.49 21% | 4.19 5% | 5.01 -14% | 10.97 -149% | 7.3 -66% |
| Colorchecker dE 2000 max. * | 9.7 | 10.2 -5% | 7.49 23% | 8.7 10% | 10.4 -7% | 24.7 -155% | |
| Greyscale dE 2000 * | 3 | 3.3 -10% | 1.88 37% | 3.72 -24% | 7.26 -142% | 14.25 -375% | 4.9 -63% |
| Gamma | 2.1 105% | 2.15 102% | 2.35 94% | 2.29 96% | 2.09 105% | 1.83 120% | 2.19 100% |
| CCT | 6362 102% | 6103 107% | 6587 99% | 7104 91% | 6329 103% | 11200 58% | 7332 89% |
| Color Space (Percent of AdobeRGB 1998) (%) | 56 | 55.7 -1% | 56 0% | 59 5% | 76 36% | 35 -37% | 35 -37% |
| Color Space (Percent of sRGB) (%) | 86 | 75.7 -12% | 86 0% | 91 6% | 100 16% | 55 -36% | 55 -36% |
| Média Total (Programa/Configurações) | -14% /
-14% | -8% /
-3% | -12% /
-2% | 14% /
-5% | -60% /
-78% | -55% /
-49% |
* ... menor é melhor
Exibir tempos de resposta
| ↔ Tempo de resposta preto para branco | ||
|---|---|---|
| 22 ms ... ascensão ↗ e queda ↘ combinadas | ↗ 12.4 ms ascensão | 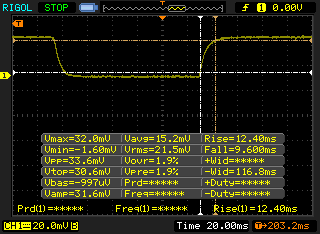 |
| ↘ 9.6 ms queda | ||
| A tela mostra boas taxas de resposta em nossos testes, mas pode ser muito lenta para jogadores competitivos. Em comparação, todos os dispositivos testados variam de 0.1 (mínimo) a 240 (máximo) ms. » 49 % de todos os dispositivos são melhores. Isso significa que o tempo de resposta medido é pior que a média de todos os dispositivos testados (19.8 ms). | ||
| ↔ Tempo de resposta 50% cinza a 80% cinza | ||
| 36 ms ... ascensão ↗ e queda ↘ combinadas | ↗ 18.4 ms ascensão | 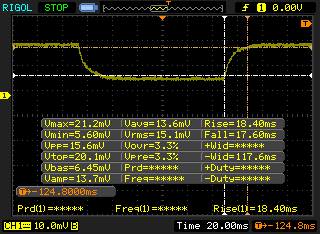 |
| ↘ 17.6 ms queda | ||
| A tela mostra taxas de resposta lentas em nossos testes e será insatisfatória para os jogadores. Em comparação, todos os dispositivos testados variam de 0.165 (mínimo) a 636 (máximo) ms. » 51 % de todos os dispositivos são melhores. Isso significa que o tempo de resposta medido é pior que a média de todos os dispositivos testados (31 ms). | ||
Cintilação da tela / PWM (modulação por largura de pulso)
| Tela tremeluzindo / PWM não detectado | 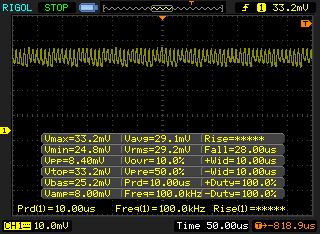 | ||
[pwm_comparison] Em comparação: 52 % de todos os dispositivos testados não usam PWM para escurecer a tela. Se PWM foi detectado, uma média de 7757 (mínimo: 5 - máximo: 343500) Hz foi medida. | |||

| Cinebench R15 | |
| CPU Single 64Bit | |
| Aorus x3 Plus v7 | |
| Aorus X7 v6 AO-S107Q716-PL-005 | |
| Dell Inspiron 15 7000 7567 | |
| Asus GL753VE-DS74 | |
| Asus Strix GL753VD-GC045T | |
| MSI GT80 Titan SLI | |
| Acer Predator 17 G9-793-77LG | |
| Acer Aspire Nitro BE VN7-793G-5811 | |
| CPU Multi 64Bit | |
| Aorus x3 Plus v7 | |
| Aorus X7 v6 AO-S107Q716-PL-005 | |
| Asus Strix GL753VD-GC045T | |
| Asus GL753VE-DS74 | |
| MSI GT80 Titan SLI | |
| Dell Inspiron 15 7000 7567 | |
| Acer Predator 17 G9-793-77LG | |
| Acer Aspire Nitro BE VN7-793G-5811 | |
| Cinebench R11.5 | |
| CPU Single 64Bit | |
| Aorus x3 Plus v7 | |
| Asus Strix GL753VD-GC045T | |
| MSI GT80 Titan SLI | |
| Asus GL753VE-DS74 | |
| CPU Multi 64Bit | |
| Aorus x3 Plus v7 | |
| Asus Strix GL753VD-GC045T | |
| Asus GL753VE-DS74 | |
| MSI GT80 Titan SLI | |
| Cinebench R10 | |
| Rendering Multiple CPUs 32Bit | |
| Aorus x3 Plus v7 | |
| Asus GL753VE-DS74 | |
| MSI GT80 Titan SLI | |
| Acer Aspire Nitro BE VN7-793G-5811 | |
| Rendering Single 32Bit | |
| Aorus x3 Plus v7 | |
| Asus GL753VE-DS74 | |
| MSI GT80 Titan SLI | |
| Acer Aspire Nitro BE VN7-793G-5811 | |
| wPrime 2.10 - 1024m | |
| Aorus x3 Plus v7 | |
| Asus GL753VE-DS74 | |
| Aorus X7 v6 AO-S107Q716-PL-005 | |
* ... menor é melhor
| PCMark 8 | |
| Home Score Accelerated v2 | |
| Nexoc G739 | |
| Asus Strix GL753VD-GC045T | |
| Dell Inspiron 15 7000 7567 | |
| Acer Aspire Nitro BE VN7-793G-5811 | |
| Asus GL753VE-DS74 | |
| Work Score Accelerated v2 | |
| Nexoc G739 | |
| Asus GL753VE-DS74 | |
| Dell Inspiron 15 7000 7567 | |
| Acer Aspire Nitro BE VN7-793G-5811 | |
| Creative Score Accelerated v2 | |
| Nexoc G739 | |
| Asus GL753VE-DS74 | |
| Acer Aspire Nitro BE VN7-793G-5811 | |
| PCMark 8 Home Score Accelerated v2 | 3570 pontos | |
| PCMark 8 Creative Score Accelerated v2 | 4243 pontos | |
| PCMark 8 Work Score Accelerated v2 | 5171 pontos | |
Ajuda | ||
| Asus GL753VE-DS74 Intel SSD 600p SSDPEKKW512G7 | Asus Strix GL753VD-GC045T Micron SSD 1100 (MTFDDAV256TBN) | Acer Aspire Nitro BE VN7-793G-5811 Seagate Mobile HDD 1TB ST1000LM035 | Nexoc G739 Samsung PM961 MZVLW256HEHP | MSI GE72 7RE-046 Toshiba HG6 THNSNJ256G8NY | Dell Inspiron 15 7000 7567 Intel SSDSCKKF256H6 | Lenovo Legion Y520-15IKBN-80WK001KUS Samsung PM961 MZVLW256HEHP | |
|---|---|---|---|---|---|---|---|
| CrystalDiskMark 3.0 | 27% | -91% | 221% | 64% | 37% | 178% | |
| Read Seq (MB/s) | 1049 | 475.7 -55% | 117.6 -89% | 1666 59% | 540 -49% | 485.8 -54% | 2170 107% |
| Write Seq (MB/s) | 584 | 419.1 -28% | 109.1 -81% | 1192 104% | 495.7 -15% | 422.8 -28% | 1202 106% |
| Read 512 (MB/s) | 583 | 336.1 -42% | 39.93 -93% | 857 47% | 455.1 -22% | 338.9 -42% | 786 35% |
| Write 512 (MB/s) | 458 | 346.6 -24% | 98.6 -78% | 827 81% | 481.4 5% | 304 -34% | 822 79% |
| Read 4k (MB/s) | 14.1 | 24.7 75% | 0.435 -97% | 60.7 330% | 22.7 61% | 27.11 92% | 58.9 318% |
| Write 4k (MB/s) | 108 | 76.8 -29% | 3.152 -97% | 154.5 43% | 112.9 5% | 85.4 -21% | 146.4 36% |
| Read 4k QD32 (MB/s) | 57.8 | 247.6 328% | 1.008 -98% | 636 1000% | 372.5 544% | 279.6 384% | 457.7 692% |
| Write 4k QD32 (MB/s) | 264 | 234.9 -11% | 4.705 -98% | 544 106% | 212.9 -19% | 255.1 -3% | 392.9 49% |

| 3DMark Ice Storm Standard Score | 62164 pontos | |
| 3DMark Cloud Gate Standard Score | 20619 pontos | |
| 3DMark Fire Strike Score | 6584 pontos | |
| 3DMark Fire Strike Extreme Score | 3495 pontos | |
Ajuda | ||
| BioShock Infinite - 1920x1080 Ultra Preset, DX11 (DDOF) (classificar por valor) | |
| Asus GL753VE-DS74 | |
| Dell Inspiron 15 7000 7567 | |
| Lenovo Legion Y520-15IKBN-80WK001KUS | |
| HP Pavilion 17 FHD V3A33AV | |
| Metro: Last Light - 1920x1080 Very High (DX11) AF:16x (classificar por valor) | |
| Asus GL753VE-DS74 | |
| Asus Strix GL753VD-GC045T | |
| HP Pavilion 17 FHD V3A33AV | |
| Thief - 1920x1080 Very High Preset AA:FXAA & High SS AF:8x (classificar por valor) | |
| Asus GL753VE-DS74 | |
| HP Pavilion 17 FHD V3A33AV | |
| The Witcher 3 - 1920x1080 Ultra Graphics & Postprocessing (HBAO+) (classificar por valor) | |
| Asus GL753VE-DS74 | |
| Asus Strix GL753VD-GC045T | |
| Lenovo Legion Y520-15IKBN-80WK001KUS | |
| Acer Aspire V17 Nitro BE VN7-793G-706L | |
| Fallout 4 - 1920x1080 Ultra Preset AA:T AF:16x (classificar por valor) | |
| Asus GL753VE-DS74 | |
| Asus Strix GL753VD-GC045T | |
| Acer Aspire V17 Nitro BE VN7-793G-706L | |
| HP Pavilion 17 FHD V3A33AV | |
| Rise of the Tomb Raider - 1920x1080 Very High Preset AA:FX AF:16x (classificar por valor) | |
| Asus GL753VE-DS74 | |
| Asus Strix GL753VD-GC045T | |
| Dell Inspiron 15 7000 7567 | |
| Lenovo Legion Y520-15IKBN-80WK001KUS | |
| Acer Aspire V17 Nitro BE VN7-793G-706L | |
| HP Pavilion 17 FHD V3A33AV | |
| Ashes of the Singularity - 1920x1080 high (classificar por valor) | |
| Asus GL753VE-DS74 | |
| Asus Strix GL753VD-GC045T | |
| Doom - 1920x1080 Ultra Preset AA:SM (classificar por valor) | |
| Asus GL753VE-DS74 | |
| Asus Strix GL753VD-GC045T | |
| Dell Inspiron 15 7000 7567 | |
| HP Omen 17-w010ng | |
| Mafia 3 - 1920x1080 High Preset (classificar por valor) | |
| Asus GL753VE-DS74 | |
| Asus Strix GL753VD-GC045T | |
| Dell Inspiron 15 7000 7567 | |
| baixo | média | alto | ultra | |
|---|---|---|---|---|
| BioShock Infinite (2013) | 97 | |||
| Metro: Last Light (2013) | 59 | |||
| Thief (2014) | 50 | |||
| The Witcher 3 (2015) | 32 | |||
| Fallout 4 (2015) | 44 | |||
| Rise of the Tomb Raider (2016) | 37 | |||
| Ashes of the Singularity (2016) | 36 | |||
| Doom (2016) | 62 | |||
| Mafia 3 (2016) | 31 |
(+) A temperatura máxima no lado superior é 35.8 °C / 96 F, em comparação com a média de 40.4 °C / 105 F , variando de 21.2 a 68.8 °C para a classe Gaming.
(+) A parte inferior aquece até um máximo de 36.4 °C / 98 F, em comparação com a média de 43.2 °C / 110 F
(+) Em uso inativo, a temperatura média para o lado superior é 21.5 °C / 71 F, em comparação com a média do dispositivo de 33.9 °C / ### class_avg_f### F.
(+) Jogando The Witcher 3, a temperatura média para o lado superior é 28 °C / 82 F, em comparação com a média do dispositivo de 33.9 °C / ## #class_avg_f### F.
(+) Os apoios para as mãos e o touchpad são mais frios que a temperatura da pele, com um máximo de 27.2 °C / 81 F e, portanto, são frios ao toque.
(±) A temperatura média da área do apoio para as mãos de dispositivos semelhantes foi 28.8 °C / 83.8 F (+1.6 °C / 2.8 F).
Barulho
| Ocioso |
| 33.3 / 33.3 / 33.4 dB |
| Carga |
| 42.6 / 46.8 dB |
 | ||
30 dB silencioso 40 dB(A) audível 50 dB(A) ruidosamente alto |
||
min: | ||
| Asus GL753VE-DS74 GeForce GTX 1050 Ti Mobile, i7-7700HQ, Intel SSD 600p SSDPEKKW512G7 | Asus Strix GL753VD-GC045T GeForce GTX 1050 Mobile, i7-7700HQ, Micron SSD 1100 (MTFDDAV256TBN) | Acer Aspire Nitro BE VN7-793G-5811 GeForce GTX 1050 Ti Mobile, i5-7300HQ, Seagate Mobile HDD 1TB ST1000LM035 | Nexoc G739 GeForce GTX 1050 Ti Mobile, i7-7700HQ, Samsung PM961 MZVLW256HEHP | MSI GE72 7RE-046 GeForce GTX 1050 Ti Mobile, i7-7700HQ, Toshiba HG6 THNSNJ256G8NY | Dell Inspiron 15 7000 7567 GeForce GTX 1050 Ti Mobile, i7-7700HQ, Intel SSDSCKKF256H6 | Lenovo Legion Y520-15IKBN-80WK001KUS GeForce GTX 1050 Ti Mobile, i7-7700HQ, Samsung PM961 MZVLW256HEHP | |
|---|---|---|---|---|---|---|---|
| Noise | -3% | 10% | -3% | -3% | 1% | 8% | |
| desligado / ambiente * (dB) | 29.1 | 28.8 1% | 29.7 -2% | 30 -3% | 30 -3% | 30.3 -4% | 27.7 5% |
| Idle Minimum * (dB) | 33.3 | 33.9 -2% | 30.2 9% | 31 7% | 34 -2% | 30.9 7% | 30.5 8% |
| Idle Average * (dB) | 33.3 | 33.9 -2% | 30.2 9% | 32 4% | 35 -5% | 30.9 7% | 30.5 8% |
| Idle Maximum * (dB) | 33.4 | 37.8 -13% | 30.6 8% | 38 -14% | 36 -8% | 31 7% | 30.6 8% |
| Load Average * (dB) | 42.6 | 42.7 -0% | 33.8 21% | 44 -3% | 41 4% | 46.5 -9% | 40 6% |
| Witcher 3 ultra * (dB) | 46.8 | 39.5 16% | 40 15% | ||||
| Load Maximum * (dB) | 46.8 | 47.4 -1% | 42.6 9% | 50 -7% | 49 -5% | 46.8 -0% | 42.6 9% |
* ... menor é melhor
Acer Aspire Nitro BE VN7-793G-5811 análise de áudio
(±) | o volume do alto-falante é médio, mas bom (###valor### dB)
Graves 100 - 315Hz
(±) | graves reduzidos - em média 6.9% menor que a mediana
(+) | o baixo é linear (5.5% delta para a frequência anterior)
Médios 400 - 2.000 Hz
(+) | médios equilibrados - apenas 4.5% longe da mediana
(+) | médios são lineares (6.3% delta para frequência anterior)
Altos 2 - 16 kHz
(+) | agudos equilibrados - apenas 1.1% longe da mediana
(+) | os máximos são lineares (3.5% delta da frequência anterior)
Geral 100 - 16.000 Hz
(+) | o som geral é linear (11.5% diferença em relação à mediana)
Comparado com a mesma classe
» 18% de todos os dispositivos testados nesta classe foram melhores, 4% semelhantes, 78% piores
» O melhor teve um delta de 5%, a média foi 17%, o pior foi 45%
Comparado com todos os dispositivos testados
» 8% de todos os dispositivos testados foram melhores, 2% semelhantes, 90% piores
» O melhor teve um delta de 4%, a média foi 23%, o pior foi 134%
MSI GE72 7RE-046 análise de áudio
(+) | os alto-falantes podem tocar relativamente alto (###valor### dB)
Graves 100 - 315Hz
(-) | quase nenhum baixo - em média 17.2% menor que a mediana
(±) | a linearidade dos graves é média (9.2% delta para a frequência anterior)
Médios 400 - 2.000 Hz
(+) | médios equilibrados - apenas 3.3% longe da mediana
(+) | médios são lineares (4.7% delta para frequência anterior)
Altos 2 - 16 kHz
(+) | agudos equilibrados - apenas 3.3% longe da mediana
(+) | os máximos são lineares (4% delta da frequência anterior)
Geral 100 - 16.000 Hz
(+) | o som geral é linear (13.7% diferença em relação à mediana)
Comparado com a mesma classe
» 21% de todos os dispositivos testados nesta classe foram melhores, 7% semelhantes, 72% piores
» O melhor teve um delta de 6%, a média foi 18%, o pior foi 132%
Comparado com todos os dispositivos testados
» 15% de todos os dispositivos testados foram melhores, 4% semelhantes, 81% piores
» O melhor teve um delta de 4%, a média foi 23%, o pior foi 134%
| desligado | |
| Ocioso | |
| Carga |
|
Key:
min: | |
| Asus GL753VE-DS74 i7-7700HQ, GeForce GTX 1050 Ti Mobile, Intel SSD 600p SSDPEKKW512G7, IPS, 1920x1080, 17.3" | Asus Strix GL753VD-GC045T i7-7700HQ, GeForce GTX 1050 Mobile, Micron SSD 1100 (MTFDDAV256TBN), LED IPS, 1920x1080, 17.3" | Acer Aspire Nitro BE VN7-793G-5811 i5-7300HQ, GeForce GTX 1050 Ti Mobile, Seagate Mobile HDD 1TB ST1000LM035, IPS, 1920x1080, 17.3" | Nexoc G739 i7-7700HQ, GeForce GTX 1050 Ti Mobile, Samsung PM961 MZVLW256HEHP, IPS, 1920x1080, 17.3" | MSI GE72 7RE-046 i7-7700HQ, GeForce GTX 1050 Ti Mobile, Toshiba HG6 THNSNJ256G8NY, TN LED, 1920x1080, 17.3" | Dell Inspiron 15 7000 7567 i7-7700HQ, GeForce GTX 1050 Ti Mobile, Intel SSDSCKKF256H6, TN, 1920x1080, 15.6" | Lenovo Legion Y520-15IKBN-80WK001KUS i7-7700HQ, GeForce GTX 1050 Ti Mobile, Samsung PM961 MZVLW256HEHP, IPS, 1920x1080, 15.6" | |
|---|---|---|---|---|---|---|---|
| Power Consumption | -5% | -10% | -30% | -58% | 21% | 4% | |
| Idle Minimum * (Watt) | 7.5 | 6.2 17% | 8.7 -16% | 7 7% | 14 -87% | 4.4 41% | 8.5 -13% |
| Idle Average * (Watt) | 11.3 | 12.2 -8% | 12.4 -10% | 14 -24% | 20 -77% | 6.8 40% | 9.1 19% |
| Idle Maximum * (Watt) | 11.8 | 14.8 -25% | 15.4 -31% | 23 -95% | 25 -112% | 8.3 30% | 9.7 18% |
| Load Average * (Watt) | 82.1 | 84.9 -3% | 73 11% | 82 -0% | 82 -0% | 81 1% | 79.9 3% |
| Witcher 3 ultra * (Watt) | 96.3 | 98 -2% | 97.7 -1% | ||||
| Load Maximum * (Watt) | 116.6 | 120.7 -4% | 130 -11% | 163 -40% | 135 -16% | 127 -9% | 121.5 -4% |
* ... menor é melhor
| Asus GL753VE-DS74 i7-7700HQ, GeForce GTX 1050 Ti Mobile, 48 Wh | Asus Strix GL753VD-GC045T i7-7700HQ, GeForce GTX 1050 Mobile, 48 Wh | Acer Aspire Nitro BE VN7-793G-5811 i5-7300HQ, GeForce GTX 1050 Ti Mobile, 52.5 Wh | Nexoc G739 i7-7700HQ, GeForce GTX 1050 Ti Mobile, 62 Wh | MSI GE72 7RE-046 i7-7700HQ, GeForce GTX 1050 Ti Mobile, 51.4 Wh | Dell Inspiron 15 7000 7567 i7-7700HQ, GeForce GTX 1050 Ti Mobile, 74 Wh | Lenovo Legion Y520-15IKBN-80WK001KUS i7-7700HQ, GeForce GTX 1050 Ti Mobile, 45 Wh | |
|---|---|---|---|---|---|---|---|
| Duração da bateria | 4% | 18% | 68% | -21% | 122% | 0% | |
| Reader / Idle (h) | 8.7 | 8.6 -1% | 10.2 17% | 19.6 125% | 8.5 -2% | ||
| WiFi v1.3 (h) | 3.9 | 4.4 13% | 4.6 18% | 4.8 23% | 3.1 -21% | 10.4 167% | 4 3% |
| Load (h) | 0.8 | 0.8 0% | 2.1 163% | 1.4 75% | 0.8 0% |
Pro
Contra

Depois de tudo isso, o que há para dizer sobre o GL753VE? A Asus criou um portátil muito bem equilibrado, e sua abordagem "poli funcional" realmente brilha aqui. Há alguns avanços definitivos para este modelo específico na linha dos ROG: o GTX 1050 Ti pode lidar com jogos 1080p com serenidade, sem consumir muita energia ou gerar muito calor, as temperaturas e o ruído do sistema são muito bem gerenciados e a tela é maravilhosa de usar.
No entanto, existem algumas falhas. A CPU é impedida de atingir seu potencial pleno sob carga, o que pode desanimar alguns usuários avançados. Embora conjecturemos, isso provavelmente foi feito para gerenciar as emissões, ainda é uma um ponto em contra do aparelho. O posicionamento pobre das portas no GL753VD continua a prejudicar esta variante. Talvez a maior desvantagem seja o seu preço. Com $1.400 para esta unidade em particular e $1.300 para o modelo básico, pode ser um remédio difícil de engolir. Existem portáteis que oferecem desempenho muito similar por muito menos dinheiro.
O Dell Inspiron 7000 e o Lenovo Legion Y520 seriam rivais muito difíceis de derrotar. Embora sejam máquinas muito mais simples em um corpo menor, oferecem uma relação preço-desempenho convincente que é difícil de bater. Os preços caíram para esses dois portáteis, e eles podem ser encontrados rotineiramente à venda, adoçando ainda mais o negócio.
Para o preço mais alto, o Asus GL753VE oferece alguns extras muito legais. A tela é brilhante e bonita, o teclado é excelente (e tem iluminação de fundo RGB!), e o pacote geral está bem ajustado e bem equilibrado. No entanto, para os gamers com um orçamento apertado, existem opções muito mais econômicas disponíveis, que oferecem desempenho de jogos semelhante (ou melhor).
Os usuários que não gostam de sacrificar alguns mimos devem ignorar o Asus GL753VE, mas aqueles que estão dispostos a gastar um pouco mais para um pacote mais completo devem estar felizes com este portátil.
Asus GL753VE-DS74
- 05/29/2017 v6 (old)
Sam Medley
Price comparison
