Breve Análise do Portátil Asus ROG Strix GL702ZC (Ryzen 5 1600, Radeon RX 580, FHD)
| SD Card Reader | |
| average JPG Copy Test (av. of 3 runs) | |
| Acer Predator Helios 300 (Toshiba Exceria Pro SDXC 64 GB UHS-II) | |
| Nexoc G739 (Toshiba Exceria Pro SDXC 64 GB UHS-II) | |
| HP Omen 17-w206ng (Toshiba Exceria Pro SDXC 64 GB UHS-II) | |
| Asus GL702ZC-GC104T (Toshiba Exceria Pro SDXC 64 GB UHS-II) | |
| Asus ROG Strix GL702ZC-GC204T (Toshiba Exceria Pro SDXC 64 GB UHS-II) | |
| MSI GF72VR 7RF (Toshiba Exceria Pro SDXC 64 GB UHS-II) | |
| MSI GL72 7RDX-602 (Toshiba Exceria Pro SDXC 64 GB UHS-II) | |
| maximum AS SSD Seq Read Test (1GB) | |
| Asus ROG Strix GL702ZC-GC204T (Toshiba Exceria Pro SDXC 64 GB UHS-II) | |
| Asus GL702ZC-GC104T (Toshiba Exceria Pro SDXC 64 GB UHS-II) | |
| Nexoc G739 (Toshiba Exceria Pro SDXC 64 GB UHS-II) | |
| HP Omen 17-w206ng (Toshiba Exceria Pro SDXC 64 GB UHS-II) | |
| Acer Predator Helios 300 (Toshiba Exceria Pro SDXC 64 GB UHS-II) | |
| MSI GF72VR 7RF (Toshiba Exceria Pro SDXC 64 GB UHS-II) | |
| MSI GL72 7RDX-602 (Toshiba Exceria Pro SDXC 64 GB UHS-II) | |
| |||||||||||||||||||||||||
iluminação: 82 %
iluminação com acumulador: 415 cd/m²
Contraste: 988:1 (Preto: 0.42 cd/m²)
ΔE ColorChecker Calman: 4.95 | ∀{0.5-29.43 Ø4.71}
ΔE Greyscale Calman: 4.69 | ∀{0.09-98 Ø4.96}
82% sRGB (Argyll 1.6.3 3D)
54% AdobeRGB 1998 (Argyll 1.6.3 3D)
60.4% AdobeRGB 1998 (Argyll 3D)
82.6% sRGB (Argyll 3D)
65.4% Display P3 (Argyll 3D)
Gamma: 2.33
CCT: 6485 K
| Asus ROG Strix GL702ZC-GC204T IPS, 1920x1080, 17.3" | Asus GL702ZC-GC104T IPS, 1920x1080, 17.3" | MSI GF72VR 7RF TN LED, 1920x1080, 17.3" | Acer Predator Helios 300 AH-IPS, WLED, 1920x1080, 17.3" | MSI GL72 7RDX-602 TN LED, 1920x1080, 17.3" | Nexoc G739 IPS, 1920x1080, 17.3" | HP Omen 17-w206ng IPS, 1920x1080, 17.3" | |
|---|---|---|---|---|---|---|---|
| Display | 3% | 34% | 3% | 8% | 7% | 9% | |
| Display P3 Coverage (%) | 65.4 | 67.1 3% | 90.8 39% | 66.8 2% | 65.2 0% | 66.7 2% | 67.2 3% |
| sRGB Coverage (%) | 82.6 | 85.4 3% | 99.8 21% | 85.8 4% | 94.3 14% | 91 10% | 93.1 13% |
| AdobeRGB 1998 Coverage (%) | 60.4 | 62.5 3% | 85.6 42% | 62.8 4% | 65.6 9% | 66.4 10% | 67.4 12% |
| Response Times | -4% | 39% | 7% | 3% | -24% | -10% | |
| Response Time Grey 50% / Grey 80% * (ms) | 36 ? | 39.2 ? -9% | 24.4 ? 32% | 36 ? -0% | 29 ? 19% | 45 ? -25% | 38 ? -6% |
| Response Time Black / White * (ms) | 23 ? | 22.8 ? 1% | 12.6 ? 45% | 20 ? 13% | 26 ? -13% | 28 ? -22% | 26 ? -13% |
| PWM Frequency (Hz) | 122000 ? | 25000 ? | 119000 ? | 961 | 450 ? | 200 ? | |
| Screen | 9% | -13% | 4% | -42% | 11% | 5% | |
| Brightness middle (cd/m²) | 415 | 379 -9% | 329.2 -21% | 384 -7% | 299 -28% | 312 -25% | 318 -23% |
| Brightness (cd/m²) | 365 | 354 -3% | 318 -13% | 373 2% | 274 -25% | 304 -17% | 295 -19% |
| Brightness Distribution (%) | 82 | 89 9% | 92 12% | 93 13% | 80 -2% | 85 4% | 79 -4% |
| Black Level * (cd/m²) | 0.42 | 0.31 26% | 0.4 5% | 0.35 17% | 0.25 40% | 0.23 45% | 0.25 40% |
| Contrast (:1) | 988 | 1223 24% | 823 -17% | 1097 11% | 1196 21% | 1357 37% | 1272 29% |
| Colorchecker dE 2000 * | 4.95 | 4.32 13% | 6.4 -29% | 4.81 3% | 12.92 -161% | 4.19 15% | 4.7 5% |
| Colorchecker dE 2000 max. * | 9.34 | 8.56 8% | 11.7 -25% | 8.69 7% | 19.91 -113% | 8.7 7% | 8.8 6% |
| Greyscale dE 2000 * | 4.69 | 4 15% | 9.2 -96% | 5.33 -14% | 13.16 -181% | 3.72 21% | 5 -7% |
| Gamma | 2.33 94% | 2.47 89% | 2.18 101% | 2.45 90% | 2.36 93% | 2.29 96% | 2.28 96% |
| CCT | 6485 100% | 6984 93% | 10484 62% | 7137 91% | 15046 43% | 7104 91% | 7374 88% |
| Color Space (Percent of AdobeRGB 1998) (%) | 54 | 56 4% | 76 41% | 56 4% | 60 11% | 59 9% | 61 13% |
| Color Space (Percent of sRGB) (%) | 82 | 85 4% | 92 12% | 86 5% | 94 15% | 91 11% | 93 13% |
| Média Total (Programa/Configurações) | 3% /
6% | 20% /
3% | 5% /
4% | -10% /
-26% | -2% /
5% | 1% /
4% |
* ... menor é melhor
Cintilação da tela / PWM (modulação por largura de pulso)
| Tela tremeluzindo / PWM não detectado | ||
[pwm_comparison] Em comparação: 52 % de todos os dispositivos testados não usam PWM para escurecer a tela. Se PWM foi detectado, uma média de 7757 (mínimo: 5 - máximo: 343500) Hz foi medida. | ||
Exibir tempos de resposta
| ↔ Tempo de resposta preto para branco | ||
|---|---|---|
| 23 ms ... ascensão ↗ e queda ↘ combinadas | ↗ 14 ms ascensão | 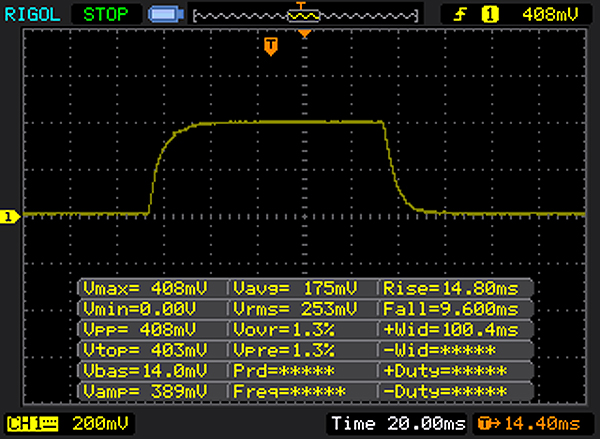 |
| ↘ 9 ms queda | ||
| A tela mostra boas taxas de resposta em nossos testes, mas pode ser muito lenta para jogadores competitivos. Em comparação, todos os dispositivos testados variam de 0.1 (mínimo) a 240 (máximo) ms. » 52 % de todos os dispositivos são melhores. Isso significa que o tempo de resposta medido é pior que a média de todos os dispositivos testados (19.8 ms). | ||
| ↔ Tempo de resposta 50% cinza a 80% cinza | ||
| 36 ms ... ascensão ↗ e queda ↘ combinadas | ↗ 18 ms ascensão | 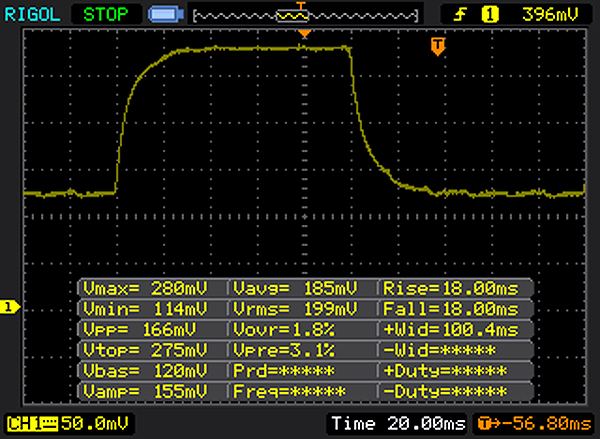 |
| ↘ 18 ms queda | ||
| A tela mostra taxas de resposta lentas em nossos testes e será insatisfatória para os jogadores. Em comparação, todos os dispositivos testados variam de 0.165 (mínimo) a 636 (máximo) ms. » 51 % de todos os dispositivos são melhores. Isso significa que o tempo de resposta medido é pior que a média de todos os dispositivos testados (31 ms). | ||
| Geekbench 4.0 | |
| 64 Bit Multi-Core Score | |
| no name | |
| Asus ROG Strix GL702ZC-GC204T | |
| Gigabyte Aero 15X | |
| Acer Aspire Nitro BE VN7-793G-5811 | |
| Acer Aspire VX15 VX5-591G-589S | |
| 64 Bit Single-Core Score | |
| no name | |
| Gigabyte Aero 15X | |
| Acer Aspire Nitro BE VN7-793G-5811 | |
| Asus ROG Strix GL702ZC-GC204T | |
| Acer Aspire VX15 VX5-591G-589S | |
| Geekbench 4.4 | |
| 64 Bit Multi-Core Score | |
| no name | |
| Asus GL702ZC-GC104T | |
| Asus ROG Strix GL702ZC-GC204T | |
| Gigabyte Aero 15X | |
| Acer Aspire Nitro BE VN7-793G-5811 | |
| Acer Aspire VX15 VX5-591G-589S | |
| 64 Bit Single-Core Score | |
| no name | |
| Gigabyte Aero 15X | |
| Acer Aspire Nitro BE VN7-793G-5811 | |
| Asus GL702ZC-GC104T | |
| Asus ROG Strix GL702ZC-GC204T | |
| Acer Aspire VX15 VX5-591G-589S | |
| Mozilla Kraken 1.1 - Total | |
| Asus GL702ZC-GC104T (Edge 15) | |
| MSI GF72VR 7RF (Microsoft Edge 40.15063.674.0) | |
| Asus ROG Strix GL702ZC-GC204T (Edge 41) | |
| Acer Predator Helios 300 (Edge 40.15063.0.0) | |
| MSI GL72 7RDX-602 (EDGE 38.14393.1066.0) | |
| Gigabyte Aero 15X (Edge 41) | |
| Nexoc G739 (Edge 38.14393.0.0) | |
| Eurocom Sky X9C (Edge 41.16299.15.0) | |
| Octane V2 - Total Score | |
| Eurocom Sky X9C (Edge 41.16299.15.0) | |
| Nexoc G739 (Edge 38.14393.0.0) | |
| MSI GL72 7RDX-602 (EDGE 38.14393.1066.0) | |
| Gigabyte Aero 15X (Edge 41) | |
| Acer Predator Helios 300 (Edge 40.15063.0.0) | |
| Asus GL702ZC-GC104T (Edge 15) | |
| Asus ROG Strix GL702ZC-GC204T (Edge 41) | |
| JetStream 1.1 - 1.1 Total | |
| Eurocom Sky X9C (Edge 41.16299.15.0) | |
| Gigabyte Aero 15X (Edge 41) | |
| Nexoc G739 (Edge 38.14393.0.0) | |
| MSI GF72VR 7RF (Microsoft Edge 40.15063.674.0) | |
| MSI GL72 7RDX-602 (EDGE 38.14393.1066.0) | |
| HP Omen 17-w206ng | |
| Acer Predator Helios 300 (Edge 40.15063.0.0) | |
| Acer Aspire Nitro BE VN7-793G-5811 (Edge 40) | |
| Acer Aspire VX15 VX5-591G-589S (Edge 38) | |
| Asus GL702ZC-GC104T (Edge 15) | |
| Asus ROG Strix GL702ZC-GC204T (Edge 41) | |
* ... menor é melhor
| PCMark 7 Score | 5444 pontos | |
| PCMark 8 Home Score Accelerated v2 | 4186 pontos | |
| PCMark 8 Creative Score Accelerated v2 | 5608 pontos | |
| PCMark 8 Work Score Accelerated v2 | 4988 pontos | |
| PCMark 10 Score | 4440 pontos | |
Ajuda | ||
| PCMark 8 - Home Score Accelerated v2 | |
| Acer Predator Helios 300 | |
| Nexoc G739 | |
| HP Omen 17-w206ng | |
| Asus ROG Strix GL702ZC-GC204T | |
| Asus GL702ZC-GC104T | |
| MSI GF72VR 7RF | |
| MSI GL72 7RDX-602 | |

| Asus ROG Strix GL702ZC-GC204T Seagate Mobile HDD 1TB ST1000LX015-1U7172 | Acer Predator Helios 300 Intel SSD 600p SSDPEKKW512G7 | MSI GL72 7RDX-602 HGST Travelstar 7K1000 HTS721010A9E630 | Nexoc G739 Samsung PM961 MZVLW256HEHP | HP Omen 17-w206ng Samsung PM961 MZVLW256HEHP | |
|---|---|---|---|---|---|
| CrystalDiskMark 3.0 | 37802% | 119% | 50561% | 47936% | |
| Read Seq (MB/s) | 92.5 | 899 872% | 135.3 46% | 1666 1701% | 1606 1636% |
| Write Seq (MB/s) | 105.1 | 569 441% | 127 21% | 1192 1034% | 1176 1019% |
| Read 512 (MB/s) | 37.67 | 580 1440% | 45.57 21% | 857 2175% | 846 2146% |
| Write 512 (MB/s) | 101.8 | 425.9 318% | 58.3 -43% | 827 712% | 805 691% |
| Read 4k (MB/s) | 0.484 | 34.29 6985% | 0.582 20% | 60.7 12441% | 59.9 12276% |
| Write 4k (MB/s) | 0.169 | 125.5 74160% | 1.022 505% | 154.5 91320% | 155.6 91971% |
| Read 4k QD32 (MB/s) | 1.294 | 457.7 35271% | 1.068 -17% | 636 49050% | 588 45340% |
| Write 4k QD32 (MB/s) | 0.221 | 404.5 182932% | 1.102 399% | 544 246054% | 505 228407% |
| 3DMark 06 Standard Score | 28909 pontos | |
| 3DMark 11 Performance | 12626 pontos | |
| 3DMark Cloud Gate Standard Score | 28295 pontos | |
| 3DMark Fire Strike Score | 9866 pontos | |
| 3DMark Time Spy Score | 3718 pontos | |
Ajuda | ||
| 3DMark 11 - 1280x720 Performance GPU | |
| Eurocom Sky X9C | |
| Guru Mars K | |
| Smart7 Karme GX17E G2 | |
| MSI GS63VR 7RG-005 | |
| Acer Predator Helios 300 | |
| Asus GL702ZC-GC104T | |
| Asus ROG Strix GL702ZC-GC204T | |
| MSI GF72VR 7RF | |
| HP Omen 15t-ce000 | |
| Acer Aspire Nitro BE VN7-793G-5811 | |
| HP Omen 17-w206ng | |
| MSI GL72 7RDX-602 | |
| 3DMark | |
| 1920x1080 Fire Strike Score | |
| Eurocom Sky X9C | |
| no name | |
| Guru Mars K | |
| Smart7 Karme GX17E G2 | |
| MSI GS63VR 7RG-005 | |
| Acer Predator Helios 300 | |
| MSI GF62VR 7RF-877 | |
| Asus ROG Strix GL702ZC-GC204T | |
| Asus GL702ZC-GC104T | |
| MSI GF72VR 7RF | |
| HP Omen 15t-ce000 | |
| Acer Aspire Nitro BE VN7-793G-5811 | |
| MSI GL72 7RDX-602 | |
| 2560x1440 Time Spy Score | |
| no name | |
| MSI GS63VR 7RG-005 | |
| Acer Predator Helios 300 | |
| Asus ROG Strix GL702ZC-GC204T | |
| Asus GL702ZC-GC104T | |
| Acer Aspire Nitro BE VN7-793G-5811 | |
| baixo | média | alto | ultra | |
|---|---|---|---|---|
| X-Plane 10.25 (2013) | 72 | 42.2 | 21.8 | 20.6 |
| Dragon Age: Inquisition (2014) | 163.5 | 102.6 | 81.3 | 54.1 |
| GTA V (2015) | 120.4 | 115.5 | 83.4 | 39.6 |
| The Witcher 3 (2015) | 173 | 121 | 68.9 | 36 |
| Dota 2 Reborn (2015) | 86 | 77 | 76.3 | 69 |
| World of Warships (2015) | 135.1 | 115 | 101 | 95.9 |
| Anno 2205 (2015) | 98.6 | 95.4 | 65.5 | 25.7 |
| XCOM 2 (2016) | 82 | 66 | 51.1 | 24.5 |
| Hitman 2016 (2016) | 56.2 | 54.4 | 49.8 | 47.7 |
| Ashes of the Singularity (2016) | 35.3 | 30 | 29.2 | |
| Overwatch (2016) | 276.3 | 276 | 191.1 | 96.2 |
| Mafia 3 (2016) | 55.9 | 45.9 | 35 | |
| Civilization 6 (2016) | 105.6 | 84.8 | 69.8 | 63.5 |
| Mass Effect Andromeda (2017) | 38.2 | 33.6 | 27.1 | 25.1 |
| Warhammer 40.000: Dawn of War III (2017) | 106.7 | 72.3 | 69.4 | 53.4 |
| Team Fortress 2 (2017) | 108 | 105 | 102 | 101 |
| FIFA 18 (2017) | 242.9 | 242.2 | 218.1 | 215.4 |
| Middle-earth: Shadow of War (2017) | 117 | 85 | 66 | 49 |
| The Evil Within 2 (2017) | 56.4 | 47.1 | 45.4 | 44.3 |
| ELEX (2017) | 117.1 | 80 | 63.5 | 48.6 |
| Destiny 2 (2017) | 97.6 | 91.4 | 83.3 | 69.7 |
| Assassin´s Creed Origins (2017) | 50 | 44 | 43 | 37 |
| Call of Duty WWII (2017) | 132.3 | 128.8 | 68 | 39.1 |
| Need for Speed Payback (2017) | 92.8 | 86 | 78.5 | 75.6 |
| Star Wars Battlefront 2 (2017) | 62 | 53.9 | 45.6 | 45.7 |
| Fortnite (2018) | 238.5 | 183.1 | 80.6 | 59.5 |
| Middle-earth: Shadow of War - 1920x1080 Ultra Preset AA:T | |
| Eurocom Sky X9C | |
| Gigabyte Aero 15X | |
| MSI GS63VR 7RG-005 | |
| PC Zentrum Defiance IV | |
| Asus ROG Strix GL702ZC-GC204T | |
| HP Omen 15t-ce000 | |
| The Witcher 3 - 1920x1080 High Graphics & Postprocessing (Nvidia HairWorks Off) | |
| Eurocom Sky X9C | |
| Guru Mars K | |
| Gigabyte Aero 15X | |
| MSI GS63VR 7RG-005 | |
| Saelic Vidi G771D | |
| Acer Aspire V17 Nitro BE VN7-793G-706L | |
| PC Zentrum Defiance IV | |
| Acer Predator Helios 300 | |
| Asus ROG Strix GL702ZC-GC204T | |
| HP Omen 15t-ce000 | |
| MSI GF62VR 7RF-877 | |
| Asus GL702ZC-GC104T | |
| Schenker XMG P507 | |
| Nexoc G739 | |
| HP Omen 17-w206ng | |
| Acer Nitro 5 AN515-51-788E | |
| Acer Aspire Nitro BE VN7-793G-5811 | |
| MSI GL72 7RDX-602 | |
| World of Warships - 1920x1080 Very High Preset AA:High FX AF:16x | |
| Asus ROG Strix GL702ZC-GC204T | |
| Acer Aspire V17 Nitro BE VN7-793G-706L | |
| Need for Speed Payback - 1920x1080 Ultra Preset | |
| MSI GS63VR 7RG-005 | |
| Asus ROG Strix GL702ZC-GC204T | |
| PC Zentrum Defiance IV | |
| Call of Duty WWII - 1920x1080 High / On AA:Filmic 1X SM | |
| MSI GS63VR 7RG-005 | |
| PC Zentrum Defiance IV | |
| Asus ROG Strix GL702ZC-GC204T | |
| Civilization 6 - 1920x1080 Ultra Preset AA:4xMS | |
| Asus ROG Strix GL702ZC-GC204T | |
| MSI GS73VR 7RF | |
| HP Omen 17-w100ng | |
| GTA V - 1920x1080 Highest AA:4xMSAA + FX AF:16x | |
| Asus GL702VM-GC102D | |
| Asus ROG Strix GL702ZC-GC204T | |
| Hitman 2016 - 1920x1080 Ultra / On AA:SM AF:16x | |
| MSI GS73VR 7RF | |
| Asus Strix GL502VM-FY039T | |
| MSI GF62VR 7RF-877 | |
| Schenker XMG P507 | |
| Asus ROG Strix GL702ZC-GC204T | |
| MSI GF72VR 7RF | |
| Mafia 3 - 1366x768 Medium Preset | |
| Eurocom Sky X9C | |
| Saelic Vidi G771D | |
| MSI GF62VR 7RF-877 | |
| Asus GL702VM-GC102D | |
| Asus ROG Strix GL702ZC-GC204T | |
| Star Wars Battlefront 2 - 1920x1080 Ultra Preset | |
| PC Zentrum Defiance IV | |
| Asus ROG Strix GL702ZC-GC204T | |
| Overwatch - 1920x1080 Epic (Render Scale 100 %) AA:SM AF:16x | |
| Eurocom Sky X9C | |
| Schenker XMG P507 | |
| Asus ROG Strix GL702ZC-GC204T | |
| Destiny 2 - 1920x1080 Highest Preset AA:SM AF:16x | |
| Eurocom Sky X9C | |
| PC Zentrum Defiance IV | |
| Asus ROG Strix GL702ZC-GC204T | |
Barulho
| Ocioso |
| 30.6 / 32.7 / 32.7 dB |
| HDD |
| 31.2 dB |
| Carga |
| 38.9 / 50.6 dB |
 | ||
30 dB silencioso 40 dB(A) audível 50 dB(A) ruidosamente alto |
||
min: | ||
(-) A temperatura máxima no lado superior é 54.3 °C / 130 F, em comparação com a média de 40.4 °C / 105 F , variando de 21.2 a 68.8 °C para a classe Gaming.
(-) A parte inferior aquece até um máximo de 51 °C / 124 F, em comparação com a média de 43.2 °C / 110 F
(+) Em uso inativo, a temperatura média para o lado superior é 4 °C / 39 F, em comparação com a média do dispositivo de 33.9 °C / ### class_avg_f### F.
(+) Jogando The Witcher 3, a temperatura média para o lado superior é 6.2 °C / 43 F, em comparação com a média do dispositivo de 33.9 °C / ## #class_avg_f### F.
(+) Os apoios para as mãos e o touchpad estão atingindo a temperatura máxima da pele (34 °C / 93.2 F) e, portanto, não estão quentes.
(-) A temperatura média da área do apoio para as mãos de dispositivos semelhantes foi 28.8 °C / 83.8 F (-5.2 °C / -9.4 F).
Asus ROG Strix GL702ZC-GC204T análise de áudio
(-) | alto-falantes não muito altos (###valor### dB)
Graves 100 - 315Hz
(+) | bons graves - apenas 3.9% longe da mediana
(±) | a linearidade dos graves é média (7.5% delta para a frequência anterior)
Médios 400 - 2.000 Hz
(+) | médios equilibrados - apenas 4.4% longe da mediana
(+) | médios são lineares (4.6% delta para frequência anterior)
Altos 2 - 16 kHz
(+) | agudos equilibrados - apenas 3.2% longe da mediana
(±) | a linearidade dos máximos é média (7.7% delta para frequência anterior)
Geral 100 - 16.000 Hz
(+) | o som geral é linear (13.5% diferença em relação à mediana)
Comparado com a mesma classe
» 20% de todos os dispositivos testados nesta classe foram melhores, 7% semelhantes, 73% piores
» O melhor teve um delta de 6%, a média foi 18%, o pior foi 132%
Comparado com todos os dispositivos testados
» 14% de todos os dispositivos testados foram melhores, 4% semelhantes, 82% piores
» O melhor teve um delta de 4%, a média foi 23%, o pior foi 134%
Apple MacBook 12 (Early 2016) 1.1 GHz análise de áudio
(+) | os alto-falantes podem tocar relativamente alto (###valor### dB)
Graves 100 - 315Hz
(±) | graves reduzidos - em média 11.3% menor que a mediana
(±) | a linearidade dos graves é média (14.2% delta para a frequência anterior)
Médios 400 - 2.000 Hz
(+) | médios equilibrados - apenas 2.4% longe da mediana
(+) | médios são lineares (5.5% delta para frequência anterior)
Altos 2 - 16 kHz
(+) | agudos equilibrados - apenas 2% longe da mediana
(+) | os máximos são lineares (4.5% delta da frequência anterior)
Geral 100 - 16.000 Hz
(+) | o som geral é linear (10.2% diferença em relação à mediana)
Comparado com a mesma classe
» 7% de todos os dispositivos testados nesta classe foram melhores, 2% semelhantes, 90% piores
» O melhor teve um delta de 5%, a média foi 18%, o pior foi 53%
Comparado com todos os dispositivos testados
» 5% de todos os dispositivos testados foram melhores, 1% semelhantes, 94% piores
» O melhor teve um delta de 4%, a média foi 23%, o pior foi 134%
| desligado | |
| Ocioso | |
| Carga |
|
Key:
min: | |
| Battery Runtime - WiFi Websurfing | |
| HP Omen 17-w206ng | |
| Nexoc G739 | |
| Acer Predator Helios 300 | |
| MSI GL72 7RDX-602 | |
| MSI GF72VR 7RF | |
| Asus GL702ZC-GC104T | |
| Asus ROG Strix GL702ZC-GC204T | |
Pro
Contra
O portátil de jogos da Asus pode rodar a maioria dos jogos sem problemas na resolução Full HD e com altas configurações de gráficos. Apenas alguns títulos exigem a redução da resolução e/ou das configurações de gráficos. A tecnologia FreeSync da AMD cria uma experiência de jogo fluida na tela de 60Hz. A tela IPS mate agrada com uma alta relação de contraste, bom brilho e ângulos de visão estáveis.
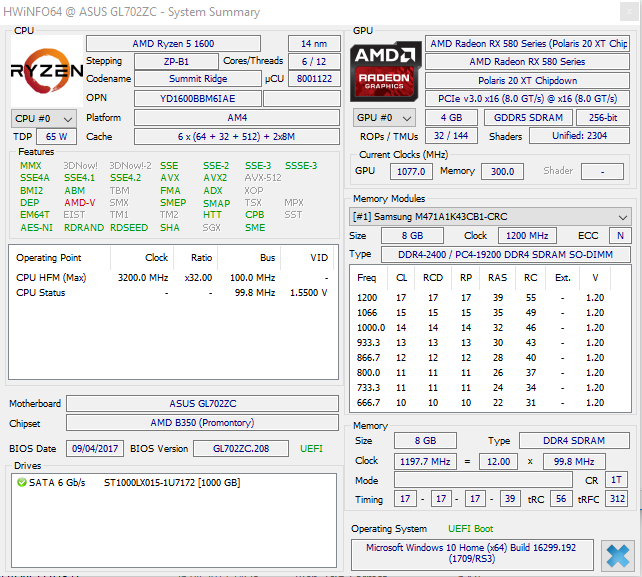
O processador integrado hexa-core deixa uma boa impressão.
Oferece potência de computação mais que suficiente para todos os aplicativos modernos. Em termos de desempenho multi-core, a CPU se sai melhor do que a concorrência da Intel - na verdade, foi apenas derrotada pelo Core i7-8700K. No entanto, o Core i7-8700K é um chip de 95 watts, que não compete diretamente com o processador Ryzen. Além disso, o Core i7-8700K custa significativamente mais do que a CPU Ryzen.
O portátil oferece muito espaço de armazenamento. A Asus equipou o portátil com uma unidade híbrida de 1 TB. Para alcançar o menor preço possível, a Asus decidiu renunciar a um SSD. No entanto, um SSD pode ser adicionado após a compra, porque o portátil vem com um slot M.2-2280 livre.
Como o portátil vem apenas com uma poderosa GPU dedicada, ele precisa de muita energia, mesmo durante o modo inativo. Portanto, os usuários que gostariam de usar o portátil para o trabalho diário do escritório devem ficar longe dele. Aqui, o portátil da Asus não possui uma GPU integrada energeticamente eficiente. Além disso, o portátil produz muito barulho para uso no escritório.
A Asus cobra 1200 Euros (~$1485) pelo modelo de nível de entrada na linha GL702ZC. Portanto, em termos de preços, é comparável aos portáteis que vêm equipados com um processador Intel Core e uma placa gráfica Nvidia GeForce GTX 1060. No entanto, esses dispositivos geralmente são utilizáveis em cenários cotidianos, porque, como norma, eles vêm com uma GPU dedicada e uma GPU integrada. Como resultado, esses dispositivos têm uma demanda de energia significativamente menor durante o modo inativo e produzem muito menos ruído - aqui, por exemplo, temos em mente o Acer Aspire V17 Nitro BE VN7-793G. Portanto, o GL702ZC é para aqueles que querem o máximo de desempenho de vários núcleos quanto possível por um preço relativamente baixo e que colocam uma vantagem na capacidade de substituir a CPU.
Asus ROG Strix GL702ZC-GC204T
- 02/02/2018 v6 (old)
Sascha Mölck