Breve Análise do Portátil Acer Swift 5 SF515-51T (i7-8565U, SSD, FHD)
| |||||||||||||||||||||||||
iluminação: 87 %
iluminação com acumulador: 336 cd/m²
Contraste: 1100:1 (Preto: 0.31 cd/m²)
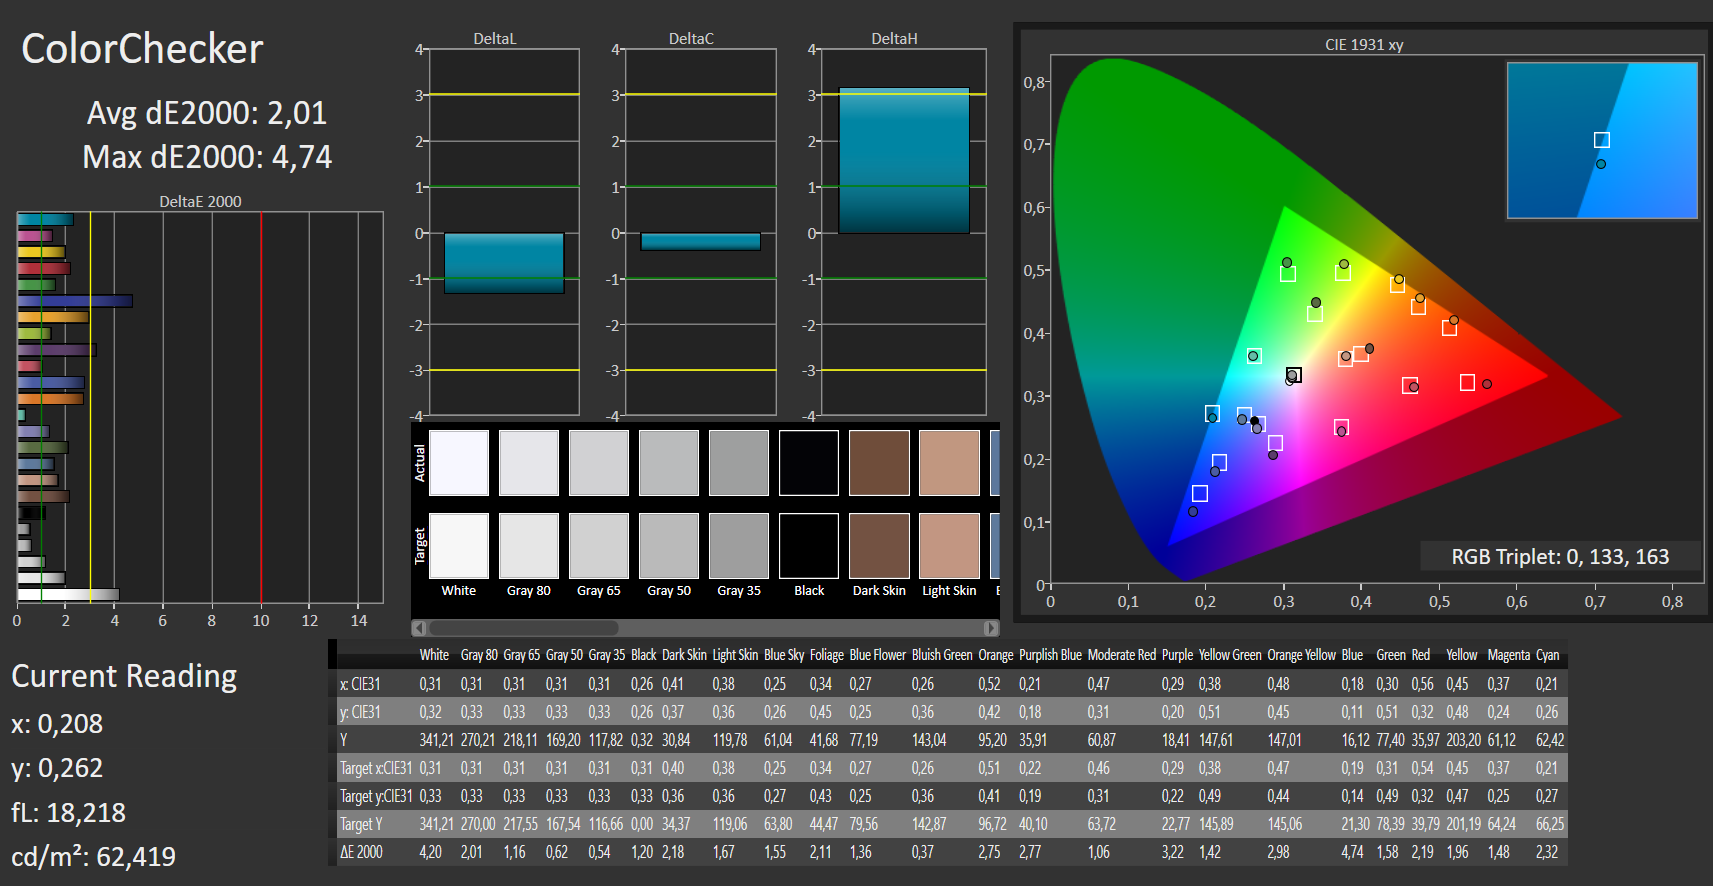
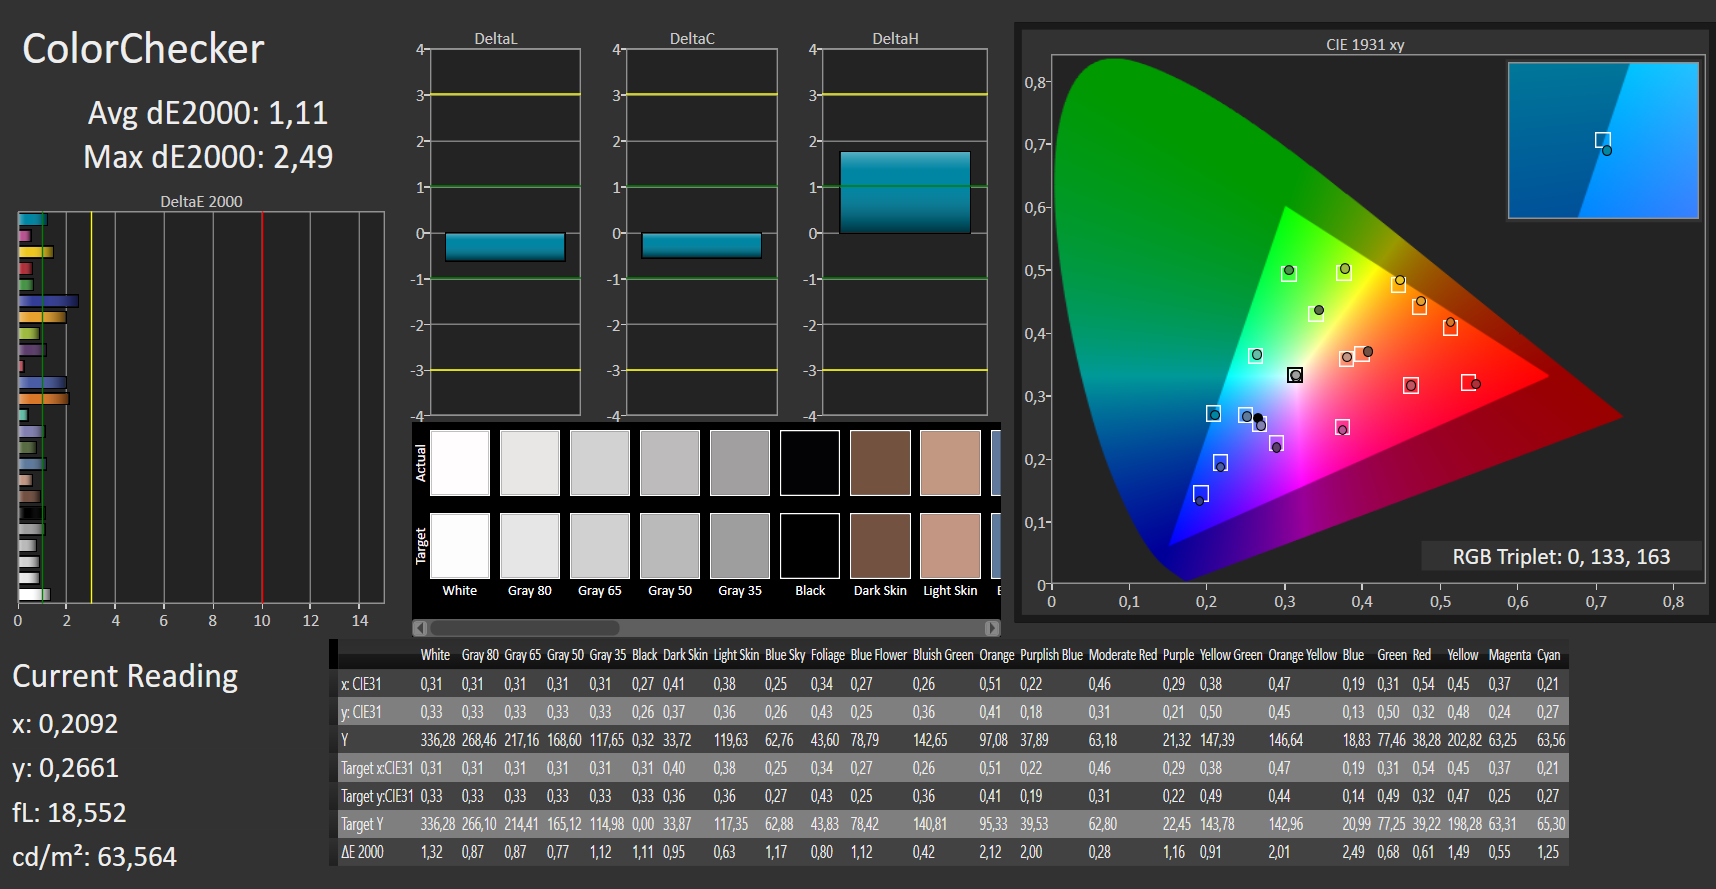
ΔE ColorChecker Calman: 2.01 | ∀{0.5-29.43 Ø4.73}
calibrated: 1.11
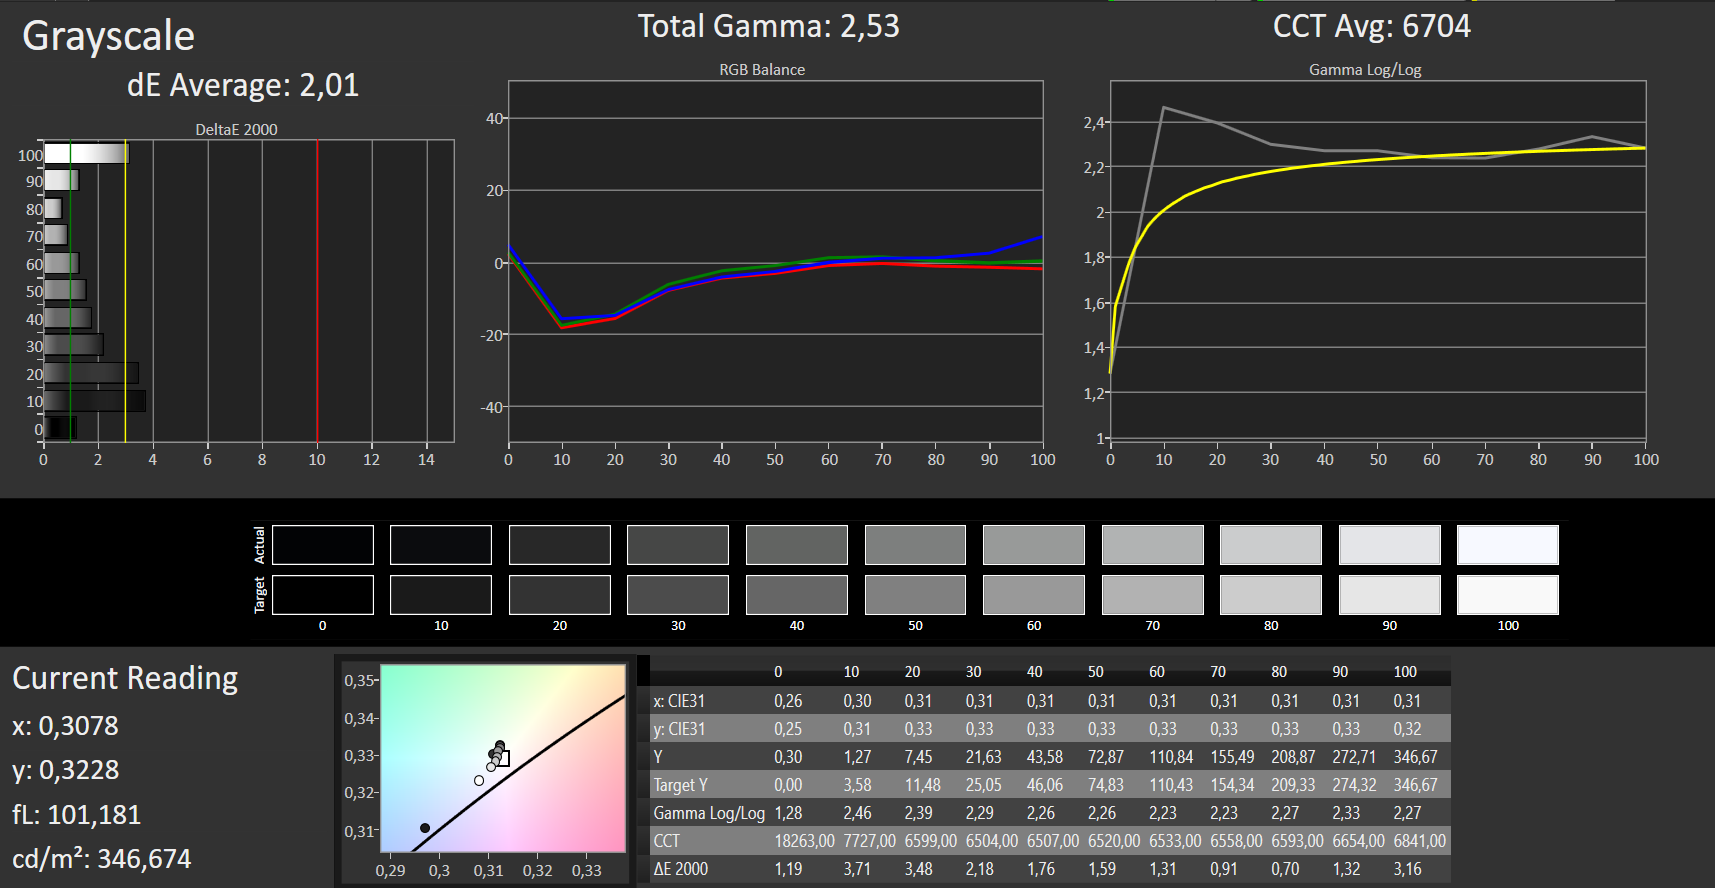
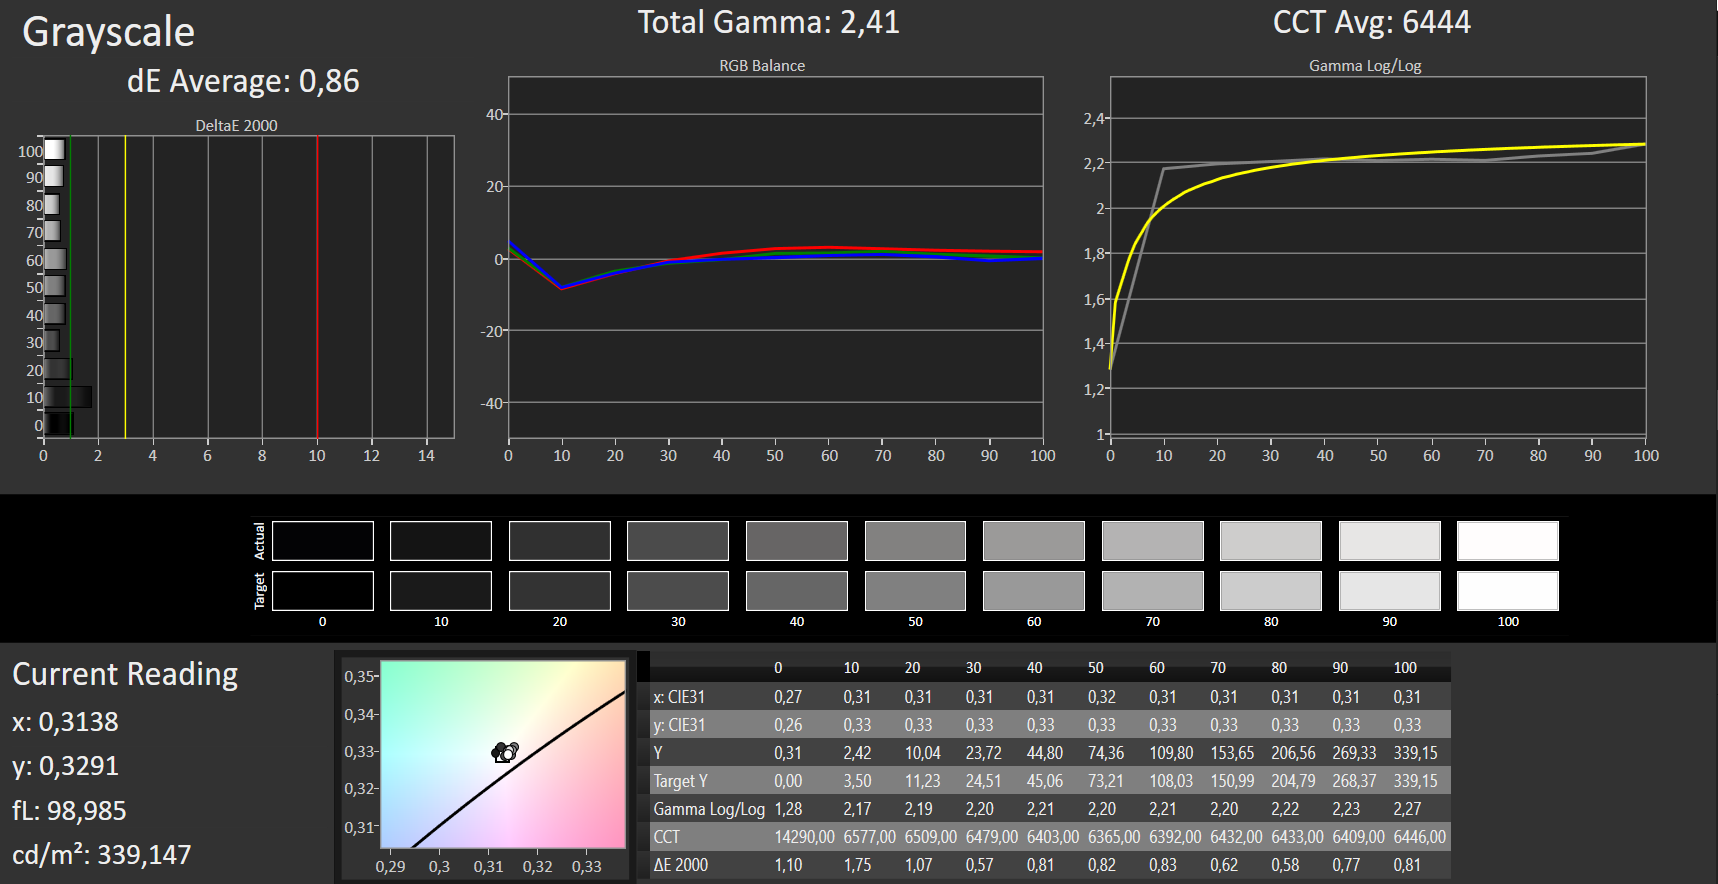
ΔE Greyscale Calman: 2.01 | ∀{0.09-98 Ø4.97}
98% sRGB (Argyll 1.6.3 3D)
63% AdobeRGB 1998 (Argyll 1.6.3 3D)
67.8% AdobeRGB 1998 (Argyll 3D)
98% sRGB (Argyll 3D)
66.8% Display P3 (Argyll 3D)
Gamma: 2.52
CCT: 6704 K
| Acer Swift 5 SF515-51T-76B6 IPS, 1920x1080, 15.6" | Lenovo ThinkPad X1 Carbon G6-20KG0025UK IPS, 1920x1080, 14" | Asus ZenBook 14 UX433FA IPS, 1920x1080, 14" | LG Gram 15Z980-B.AA78B IPS LED, 1920x1080, 15.6" | |
|---|---|---|---|---|
| Display | 0% | -5% | -2% | |
| Display P3 Coverage (%) | 66.8 | 68.3 2% | 64.3 -4% | 65.3 -2% |
| sRGB Coverage (%) | 98 | 94.9 -3% | 89.7 -8% | 96.2 -2% |
| AdobeRGB 1998 Coverage (%) | 67.8 | 69.3 2% | 65.1 -4% | 66.3 -2% |
| Response Times | -3% | 0% | 8% | |
| Response Time Grey 50% / Grey 80% * (ms) | 38 ? | 40 ? -5% | 39.6 ? -4% | 34.3 ? 10% |
| Response Time Black / White * (ms) | 25 ? | 25 ? -0% | 24 ? 4% | 23.7 ? 5% |
| PWM Frequency (Hz) | ||||
| Screen | -0% | -80% | -18% | |
| Brightness middle (cd/m²) | 341 | 298 -13% | 332.8 -2% | 349 2% |
| Brightness (cd/m²) | 319 | 287 -10% | 310 -3% | 331 4% |
| Brightness Distribution (%) | 87 | 91 5% | 87 0% | 84 -3% |
| Black Level * (cd/m²) | 0.31 | 0.2 35% | 0.29 6% | 0.32 -3% |
| Contrast (:1) | 1100 | 1490 35% | 1148 4% | 1091 -1% |
| Colorchecker dE 2000 * | 2.01 | 2.19 -9% | 5.14 -156% | 3.1 -54% |
| Colorchecker dE 2000 max. * | 4.74 | 4.39 7% | 11.88 -151% | 6.6 -39% |
| Colorchecker dE 2000 calibrated * | 1.11 | 1.67 -50% | 3.61 -225% | 1.5 -35% |
| Greyscale dE 2000 * | 2.01 | 1.97 2% | 8.8 -338% | 3.3 -64% |
| Gamma | 2.52 87% | 2.43 91% | 2.33 94% | 2.16 102% |
| CCT | 6704 97% | 6571 99% | 8227 79% | 6973 93% |
| Color Space (Percent of AdobeRGB 1998) (%) | 63 | 62 -2% | 58.1 -8% | 61.46 -2% |
| Color Space (Percent of sRGB) (%) | 98 | 95 -3% | 89.2 -9% | 96.05 -2% |
| Média Total (Programa/Configurações) | -1% /
-0% | -28% /
-56% | -4% /
-12% |
* ... menor é melhor
Cintilação da tela / PWM (modulação por largura de pulso)
| Tela tremeluzindo / PWM não detectado |  | ||
[pwm_comparison] Em comparação: 52 % de todos os dispositivos testados não usam PWM para escurecer a tela. Se PWM foi detectado, uma média de 7784 (mínimo: 5 - máximo: 343500) Hz foi medida. | |||
Exibir tempos de resposta
| ↔ Tempo de resposta preto para branco | ||
|---|---|---|
| 25 ms ... ascensão ↗ e queda ↘ combinadas | ↗ 14 ms ascensão | 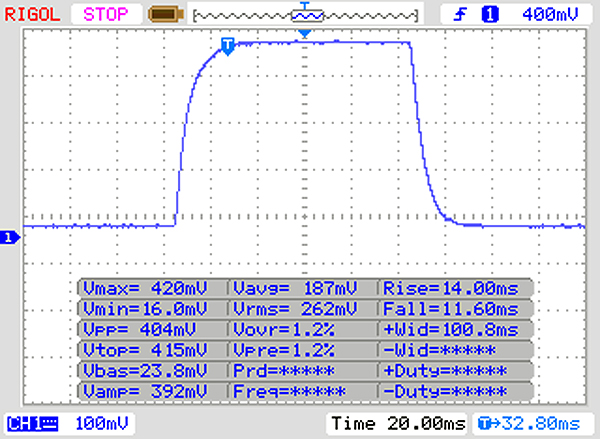 |
| ↘ 11 ms queda | ||
| A tela mostra taxas de resposta relativamente lentas em nossos testes e pode ser muito lenta para os jogadores. Em comparação, todos os dispositivos testados variam de 0.1 (mínimo) a 240 (máximo) ms. » 59 % de todos os dispositivos são melhores. Isso significa que o tempo de resposta medido é pior que a média de todos os dispositivos testados (19.9 ms). | ||
| ↔ Tempo de resposta 50% cinza a 80% cinza | ||
| 38 ms ... ascensão ↗ e queda ↘ combinadas | ↗ 19 ms ascensão |  |
| ↘ 19 ms queda | ||
| A tela mostra taxas de resposta lentas em nossos testes e será insatisfatória para os jogadores. Em comparação, todos os dispositivos testados variam de 0.165 (mínimo) a 636 (máximo) ms. » 55 % de todos os dispositivos são melhores. Isso significa que o tempo de resposta medido é pior que a média de todos os dispositivos testados (31.1 ms). | ||
| Cinebench R10 | |
| Rendering Single 32Bit | |
| Média da turma Subnotebook (2299 - 10697, n=13, últimos 2 anos) | |
| Asus ZenBook 14 UX433FA | |
| Média Intel Core i7-8565U (2682 - 8906, n=16) | |
| Acer Swift 5 SF515-51T-76B6 | |
| Rendering Multiple CPUs 32Bit | |
| Média da turma Subnotebook (14395 - 51868, n=13, últimos 2 anos) | |
| Asus ZenBook 14 UX433FA | |
| Média Intel Core i7-8565U (13806 - 23118, n=16) | |
| Acer Swift 5 SF515-51T-76B6 | |
| Geekbench 3 | |
| 32 Bit Multi-Core Score | |
| Média da turma Subnotebook (n=1últimos 2 anos) | |
| Média Intel Core i7-8565U (10521 - 13703, n=12) | |
| Acer Swift 5 SF515-51T-76B6 | |
| 32 Bit Single-Core Score | |
| Média da turma Subnotebook (n=1últimos 2 anos) | |
| Acer Swift 5 SF515-51T-76B6 | |
| Média Intel Core i7-8565U (3340 - 4820, n=12) | |
| Geekbench 4.0 | |
| 64 Bit Multi-Core Score | |
| Média da turma Subnotebook (n=1últimos 2 anos) | |
| Média Intel Core i7-8565U (11576 - 14655, n=4) | |
| Acer Swift 5 SF515-51T-76B6 | |
| 64 Bit Single-Core Score | |
| Média da turma Subnotebook (n=1últimos 2 anos) | |
| Acer Swift 5 SF515-51T-76B6 | |
| Média Intel Core i7-8565U (4701 - 4791, n=3) | |
| Mozilla Kraken 1.1 - Total | |
| Média Intel Core i7-8565U (730 - 2622, n=43) | |
| Acer Swift 5 SF515-51T-76B6 (Edge 44) | |
| Asus ZenBook 14 UX433FA (Edge 42.17134.1.0) | |
| Média da turma Subnotebook (234 - 1104, n=61, últimos 2 anos) | |
| Octane V2 - Total Score | |
| Média da turma Subnotebook (35801 - 142020, n=29, últimos 2 anos) | |
| Asus ZenBook 14 UX433FA (Edge 42.17134.1.0) | |
| Acer Swift 5 SF515-51T-76B6 (Edge 44) | |
| Média Intel Core i7-8565U (13935 - 49795, n=42) | |
| JetStream 1.1 - 1.1 Total | |
| Média da turma Subnotebook (215 - 476, n=2, últimos 2 anos) | |
| Acer Swift 5 SF515-51T-76B6 (Edge 44) | |
| Asus ZenBook 14 UX433FA (Edge 42.17134.1.0) | |
| Média Intel Core i7-8565U (107.6 - 277, n=37) | |
* ... menor é melhor
| PCMark 7 Score | 6240 pontos | |
| PCMark 8 Home Score Accelerated v2 | 4093 pontos | |
| PCMark 8 Creative Score Accelerated v2 | 5013 pontos | |
| PCMark 8 Work Score Accelerated v2 | 5181 pontos | |
| PCMark 10 Score | 4006 pontos | |
Ajuda | ||

| Acer Swift 5 SF515-51T-76B6 SK Hynix BC501 HFM512GDJTNG | Lenovo ThinkPad X1 Carbon G6-20KG0025UK Lenovo LENSE20256GMSP34MEAT2TA | LG Gram 15Z980-B.AA78B SK Hynix Canvas SC300 512GB M.2 (HFS512G39TNF) | Média SK Hynix BC501 HFM512GDJTNG | |
|---|---|---|---|---|
| CrystalDiskMark 3.0 | -20% | -51% | -16% | |
| Write 4k QD32 (MB/s) | 490.1 | 184.7 -62% | 224.2 -54% | 330 ? -33% |
| Read 4k QD32 (MB/s) | 571 | 306.1 -46% | 251.5 -56% | 353 ? -38% |
| Write 4k (MB/s) | 149.1 | 94.1 -37% | 71.1 -52% | 116.2 ? -22% |
| Read 4k (MB/s) | 48.68 | 34.87 -28% | 23.6 -52% | 43.6 ? -10% |
| Write 512 (MB/s) | 678 | 243.3 -64% | 413.8 -39% | 617 ? -9% |
| Read 512 (MB/s) | 875 | 1227 40% | 367 -58% | 824 ? -6% |
| Write Seq (MB/s) | 763 | 479 -37% | 446.7 -41% | 745 ? -2% |
| Read Seq (MB/s) | 1089 | 1880 73% | 488.2 -55% | 1011 ? -7% |
| 3DMark 06 Standard Score | 12132 pontos | |
| 3DMark 11 Performance | 2087 pontos | |
| 3DMark Cloud Gate Standard Score | 9036 pontos | |
| 3DMark Fire Strike Score | 1199 pontos | |
Ajuda | ||
| baixo | média | alto | ultra | |
|---|---|---|---|---|
| Tomb Raider (2013) | 103.7 | 51.8 | 34.4 | 15.2 |
| BioShock Infinite (2013) | 76.5 | 39.9 | 33.5 | 9.4 |
| The Witcher 3 (2015) | 16.9 | 10.9 | 6.1 | 3.1 |
Barulho
| Ocioso |
| 30.5 / 30.5 / 30.9 dB |
| Carga |
| 34.9 / 35 dB |
 | ||
30 dB silencioso 40 dB(A) audível 50 dB(A) ruidosamente alto |
||
min: | ||
| Acer Swift 5 SF515-51T-76B6 i7-8565U, UHD Graphics 620 | Lenovo ThinkPad X1 Carbon G6-20KG0025UK i5-8350U, UHD Graphics 620 | Asus ZenBook 14 UX433FA i7-8565U, UHD Graphics 620 | LG Gram 15Z980-B.AA78B i5-8550U, UHD Graphics 620 | Média Intel UHD Graphics 620 | Média da turma Subnotebook | |
|---|---|---|---|---|---|---|
| Noise | 4% | 1% | 1% | 3% | 10% | |
| desligado / ambiente * (dB) | 30.5 | 30.25 1% | 28.8 6% | 29.7 3% | 29 ? 5% | 24.2 ? 21% |
| Idle Minimum * (dB) | 30.5 | 30.25 1% | 28.8 6% | 30.3 1% | 29.1 ? 5% | 24.3 ? 20% |
| Idle Average * (dB) | 30.5 | 30.25 1% | 28.8 6% | 30.3 1% | 29.1 ? 5% | 24.4 ? 20% |
| Idle Maximum * (dB) | 30.9 | 30.25 2% | 29.1 6% | 31.1 -1% | 29.7 ? 4% | 25 ? 19% |
| Load Average * (dB) | 34.9 | 31.3 10% | 36.1 -3% | 34.9 -0% | 33.5 ? 4% | 34.1 ? 2% |
| Load Maximum * (dB) | 35 | 31.3 11% | 41.2 -18% | 34.9 -0% | 36.1 ? -3% | 42 ? -20% |
* ... menor é melhor
(±) A temperatura máxima no lado superior é 44.4 °C / 112 F, em comparação com a média de 35.9 °C / 97 F , variando de 21.4 a 59 °C para a classe Subnotebook.
(-) A parte inferior aquece até um máximo de 45.7 °C / 114 F, em comparação com a média de 39.2 °C / 103 F
(+) Em uso inativo, a temperatura média para o lado superior é 24.1 °C / 75 F, em comparação com a média do dispositivo de 30.8 °C / ### class_avg_f### F.
(±) Os apoios para as mãos e o touchpad podem ficar muito quentes ao toque, com um máximo de 38.9 °C / 102 F.
(-) A temperatura média da área do apoio para as mãos de dispositivos semelhantes foi 28.2 °C / 82.8 F (-10.7 °C / -19.2 F).
| Acer Swift 5 SF515-51T-76B6 i7-8565U, UHD Graphics 620 | Lenovo ThinkPad X1 Carbon G6-20KG0025UK i5-8350U, UHD Graphics 620 | Asus ZenBook 14 UX433FA i7-8565U, UHD Graphics 620 | LG Gram 15Z980-B.AA78B i5-8550U, UHD Graphics 620 | Média Intel UHD Graphics 620 | Média da turma Subnotebook | |
|---|---|---|---|---|---|---|
| Heat | 0% | -9% | -1% | -1% | -1% | |
| Maximum Upper Side * (°C) | 44.4 | 40.7 8% | 42.4 5% | 43 3% | 41.1 ? 7% | 41.8 ? 6% |
| Maximum Bottom * (°C) | 45.7 | 41.6 9% | 45 2% | 41 10% | 44.3 ? 3% | 43.7 ? 4% |
| Idle Upper Side * (°C) | 25.4 | 28 -10% | 31 -22% | 28 -10% | 26.8 ? -6% | 26.9 ? -6% |
| Idle Bottom * (°C) | 25.8 | 27.4 -6% | 30.8 -19% | 27 -5% | 27.7 ? -7% | 27.5 ? -7% |
* ... menor é melhor
Acer Swift 5 SF515-51T-76B6 análise de áudio
(-) | alto-falantes não muito altos (###valor### dB)
Graves 100 - 315Hz
(±) | graves reduzidos - em média 14.5% menor que a mediana
(±) | a linearidade dos graves é média (13.9% delta para a frequência anterior)
Médios 400 - 2.000 Hz
(±) | médios mais altos - em média 5.6% maior que a mediana
(±) | a linearidade dos médios é média (7.8% delta para frequência anterior)
Altos 2 - 16 kHz
(+) | agudos equilibrados - apenas 1.9% longe da mediana
(+) | os máximos são lineares (6.1% delta da frequência anterior)
Geral 100 - 16.000 Hz
(±) | a linearidade do som geral é média (23.5% diferença em relação à mediana)
Comparado com a mesma classe
» 81% de todos os dispositivos testados nesta classe foram melhores, 3% semelhantes, 16% piores
» O melhor teve um delta de 5%, a média foi 18%, o pior foi 53%
Comparado com todos os dispositivos testados
» 70% de todos os dispositivos testados foram melhores, 6% semelhantes, 24% piores
» O melhor teve um delta de 4%, a média foi 24%, o pior foi 134%
LG Gram 15Z980-B.AA78B análise de áudio
(+) | os alto-falantes podem tocar relativamente alto (###valor### dB)
Graves 100 - 315Hz
(-) | quase nenhum baixo - em média 24.1% menor que a mediana
(±) | a linearidade dos graves é média (12.3% delta para a frequência anterior)
Médios 400 - 2.000 Hz
(±) | médios mais altos - em média 5.4% maior que a mediana
(+) | médios são lineares (6.5% delta para frequência anterior)
Altos 2 - 16 kHz
(+) | agudos equilibrados - apenas 1.1% longe da mediana
(+) | os máximos são lineares (3.7% delta da frequência anterior)
Geral 100 - 16.000 Hz
(±) | a linearidade do som geral é média (19.3% diferença em relação à mediana)
Comparado com a mesma classe
» 59% de todos os dispositivos testados nesta classe foram melhores, 7% semelhantes, 34% piores
» O melhor teve um delta de 5%, a média foi 18%, o pior foi 53%
Comparado com todos os dispositivos testados
» 47% de todos os dispositivos testados foram melhores, 8% semelhantes, 46% piores
» O melhor teve um delta de 4%, a média foi 24%, o pior foi 134%
| desligado | |
| Ocioso | |
| Carga |
|
Key:
min: | |
| Acer Swift 5 SF515-51T-76B6 i7-8565U, UHD Graphics 620 | Lenovo ThinkPad X1 Carbon G6-20KG0025UK i5-8350U, UHD Graphics 620 | Asus ZenBook 14 UX433FA i7-8565U, UHD Graphics 620 | LG Gram 15Z980-B.AA78B i5-8550U, UHD Graphics 620 | Média Intel UHD Graphics 620 | Média da turma Subnotebook | |
|---|---|---|---|---|---|---|
| Power Consumption | 1% | -6% | -13% | -6% | -18% | |
| Idle Minimum * (Watt) | 3 | 4.7 -57% | 3.9 -30% | 3.7 -23% | 3.81 ? -27% | 3.82 ? -27% |
| Idle Average * (Watt) | 7.7 | 7.3 5% | 5.9 23% | 8.5 -10% | 6.94 ? 10% | 6.61 ? 14% |
| Idle Maximum * (Watt) | 11.6 | 9.4 19% | 8.8 24% | 10 14% | 8.75 ? 25% | 7.99 ? 31% |
| Load Average * (Watt) | 34 | 28 18% | 41.7 -23% | 36 -6% | 35 ? -3% | 41.9 ? -23% |
| Load Maximum * (Watt) | 35 | 28.2 19% | 44 -26% | 48.7 -39% | 47.5 ? -36% | 64.1 ? -83% |
* ... menor é melhor
| Acer Swift 5 SF515-51T-76B6 i7-8565U, UHD Graphics 620, 53.9 Wh | LG Gram 15Z980-B.AA78B i5-8550U, UHD Graphics 620, 72 Wh | Lenovo ThinkPad X1 Carbon G6-20KG0025UK i5-8350U, UHD Graphics 620, 57 Wh | Asus ZenBook 14 UX433FA i7-8565U, UHD Graphics 620, 50 Wh | Média da turma Subnotebook | |
|---|---|---|---|---|---|
| Duração da bateria | 103% | 32% | 34% | 67% | |
| Reader / Idle (h) | 16.2 | 24.5 51% | 19.1 18% | 28.6 ? 77% | |
| H.264 (h) | 7.2 | 15.8 119% | 11 53% | 15.6 ? 117% | |
| WiFi v1.3 (h) | 7.2 | 13.4 86% | 10.4 44% | 10.5 46% | 14 ? 94% |
| Load (h) | 2.4 | 1.9 -21% | 3.3 38% | 1.946 ? -19% |
Pro
Contra
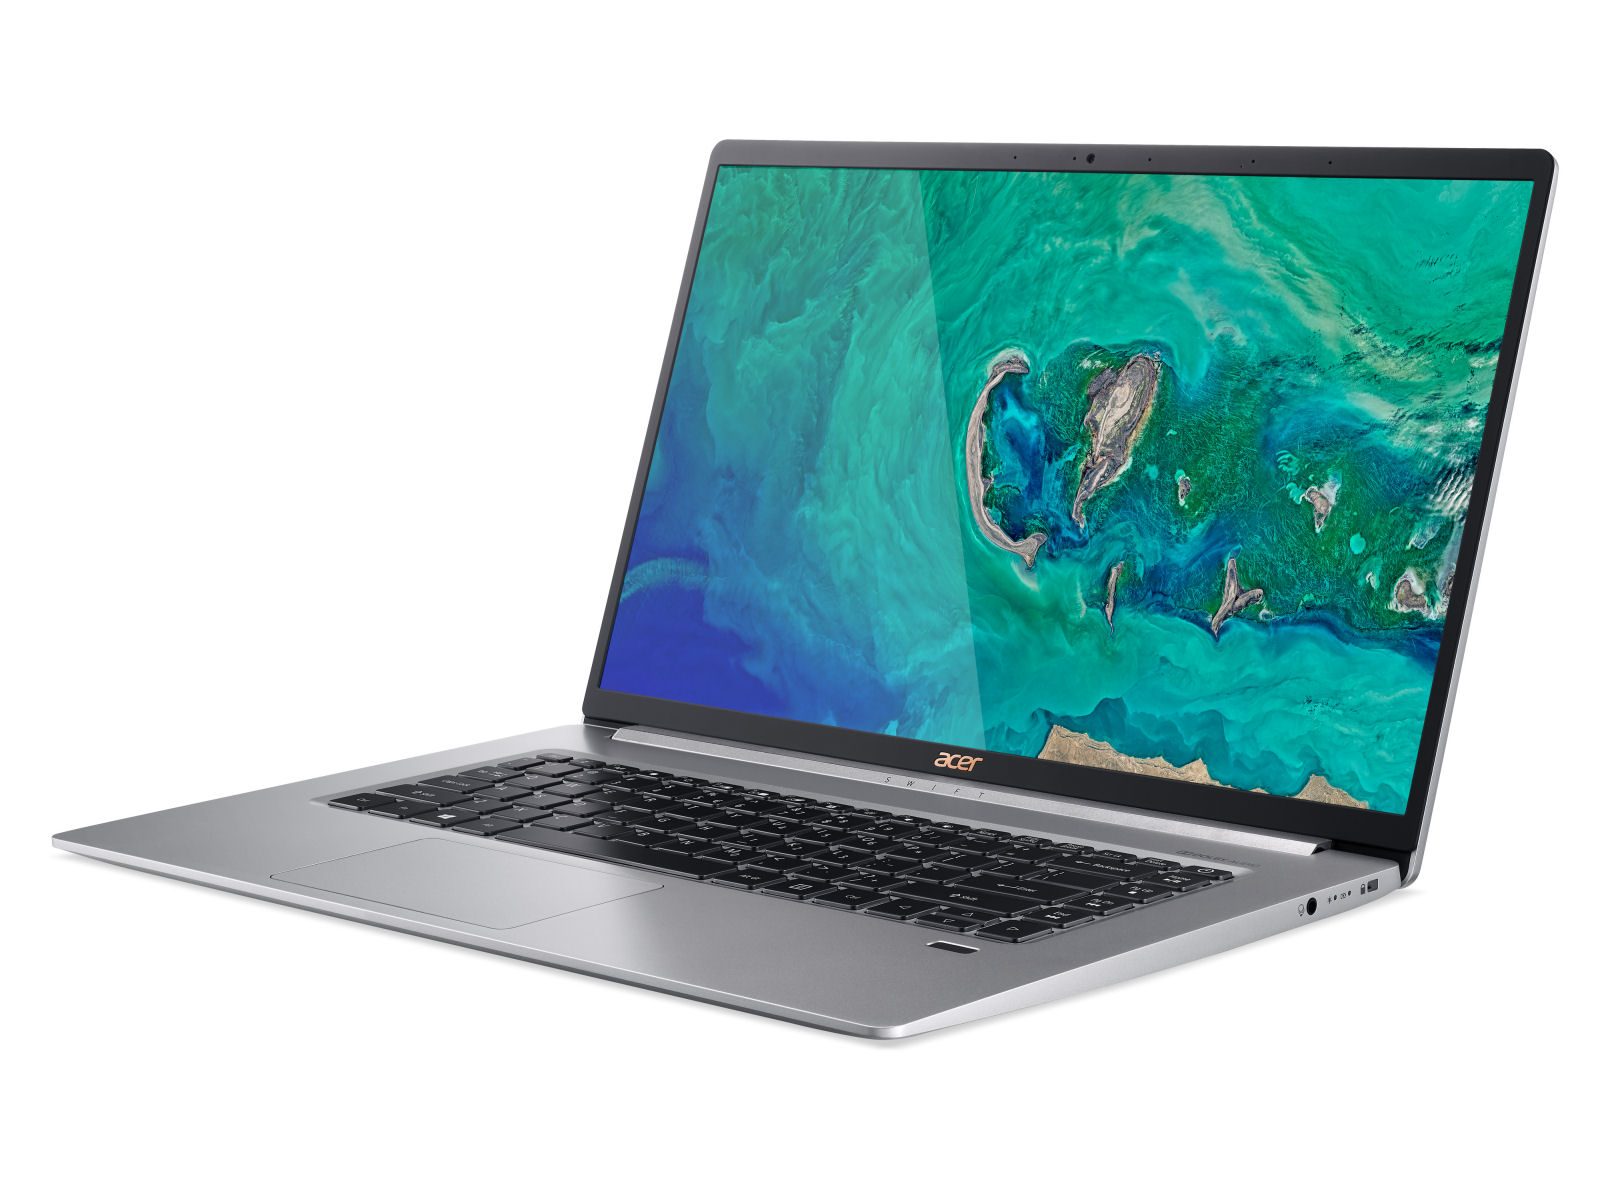
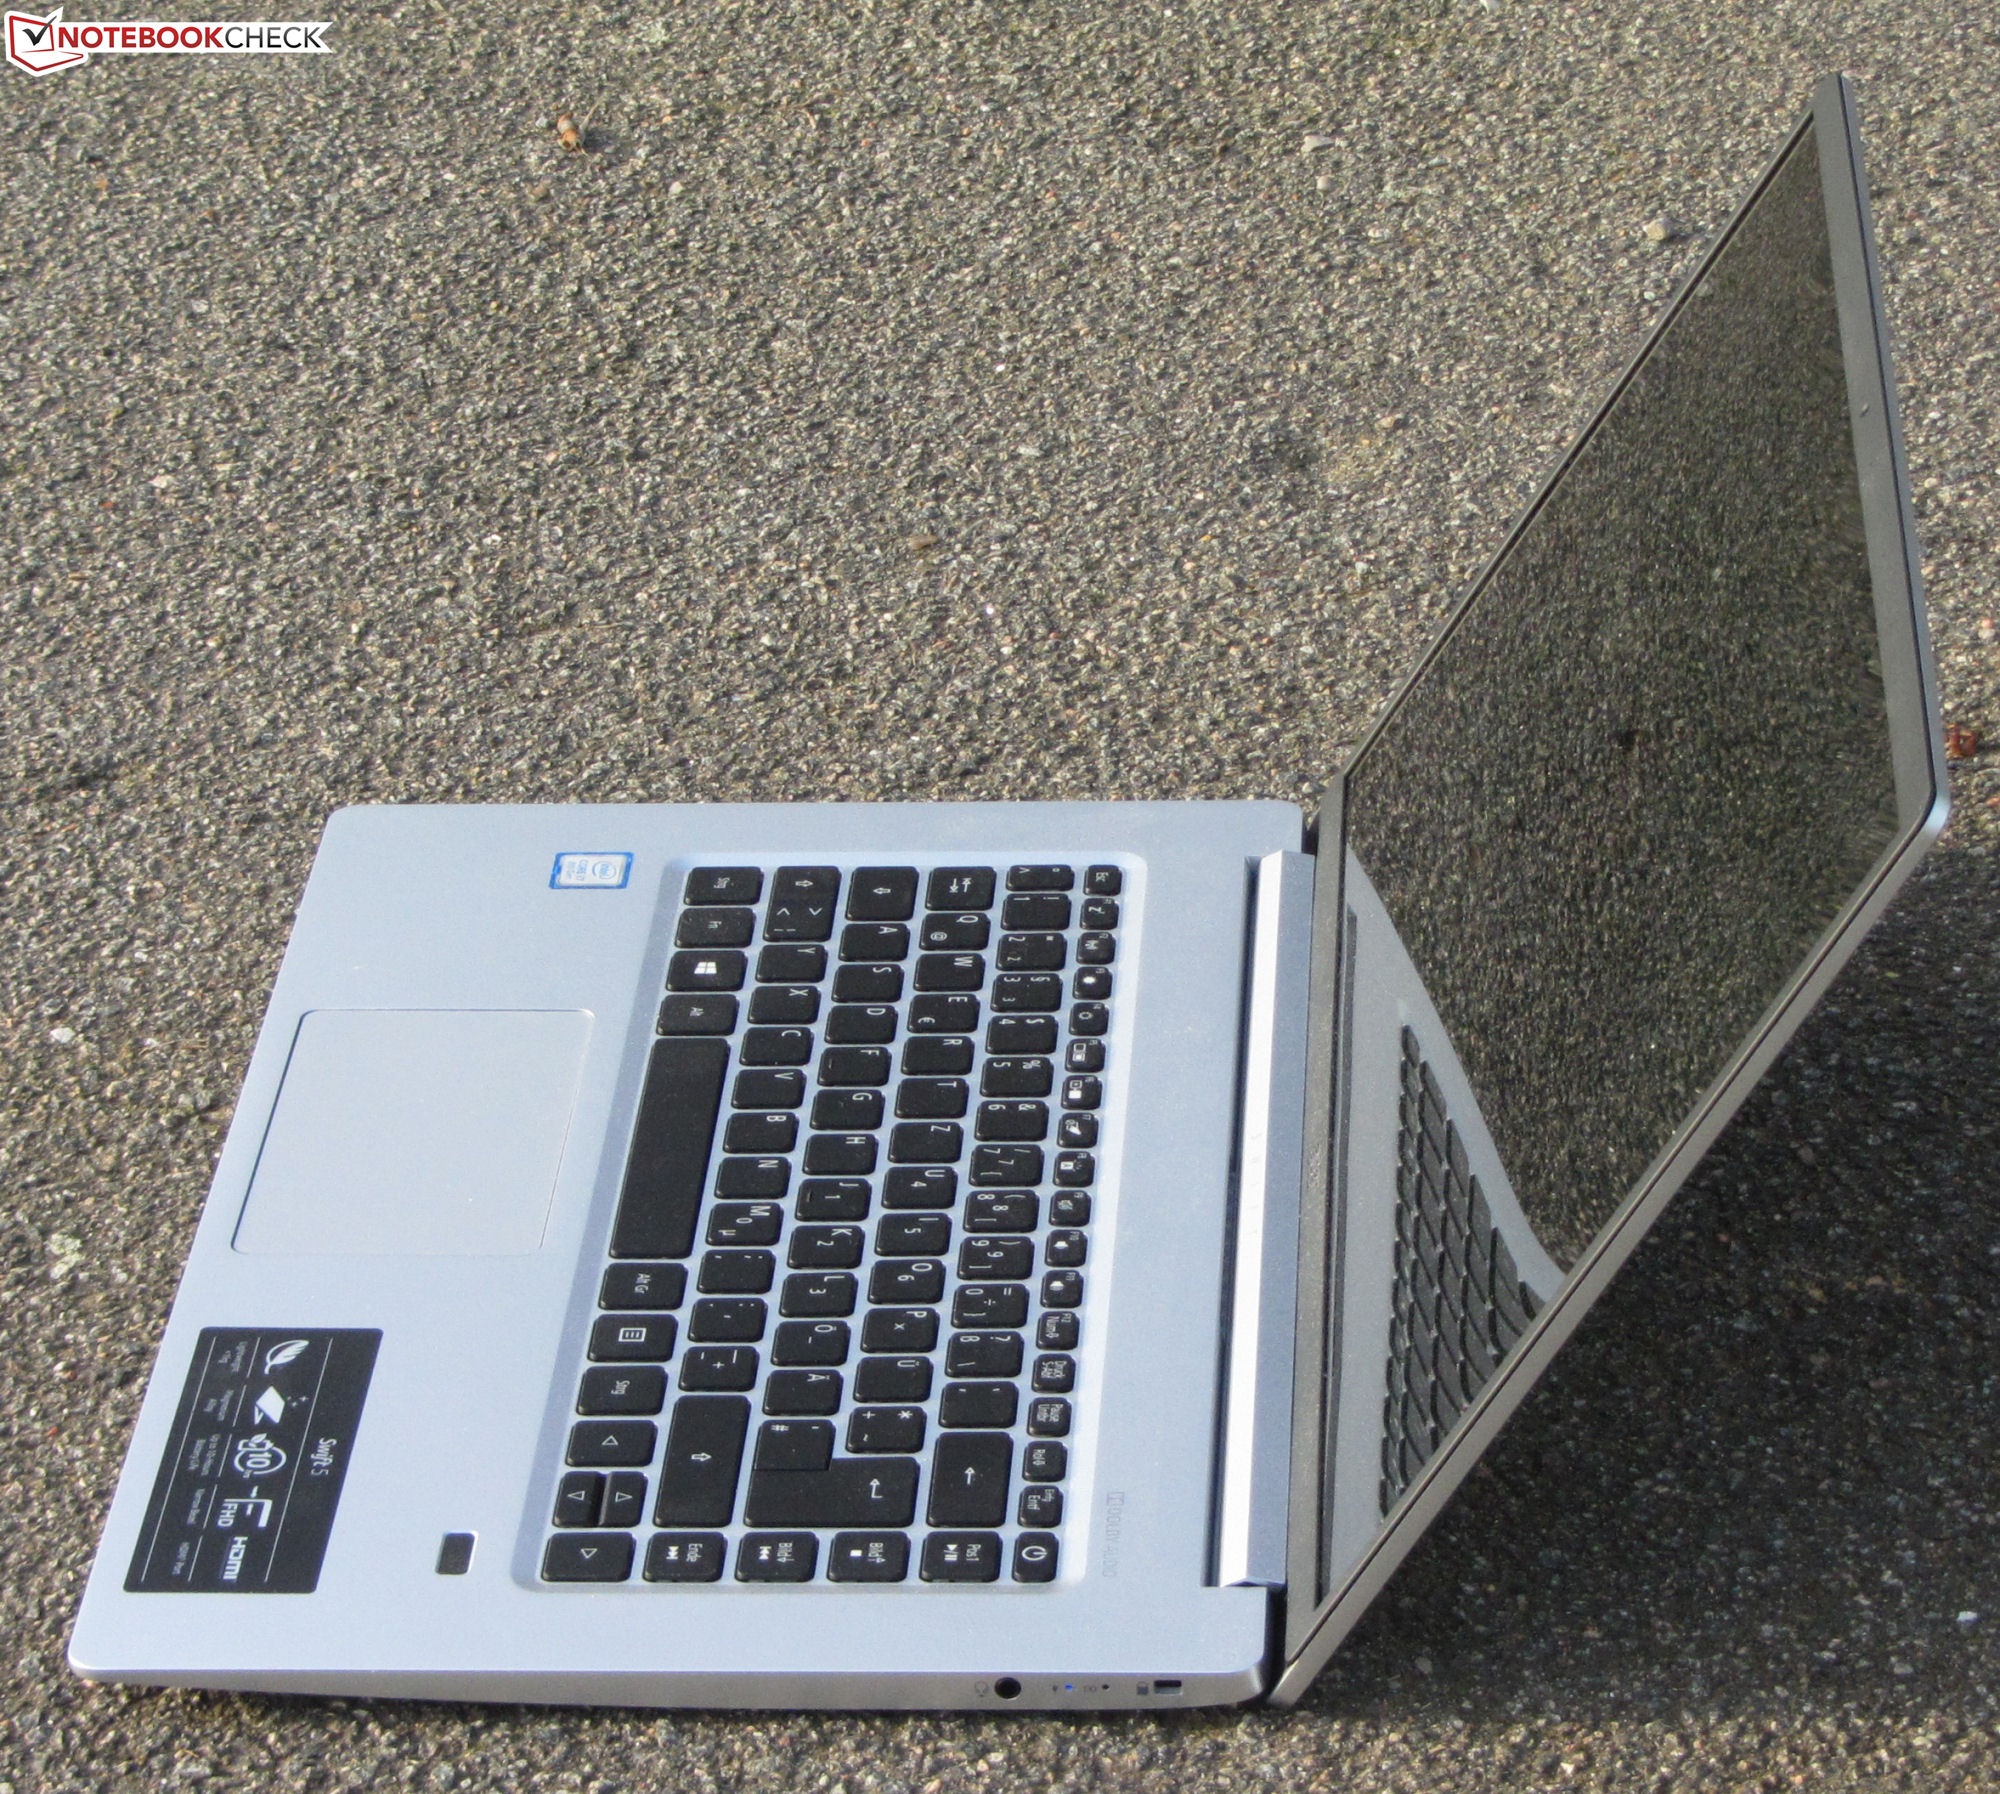
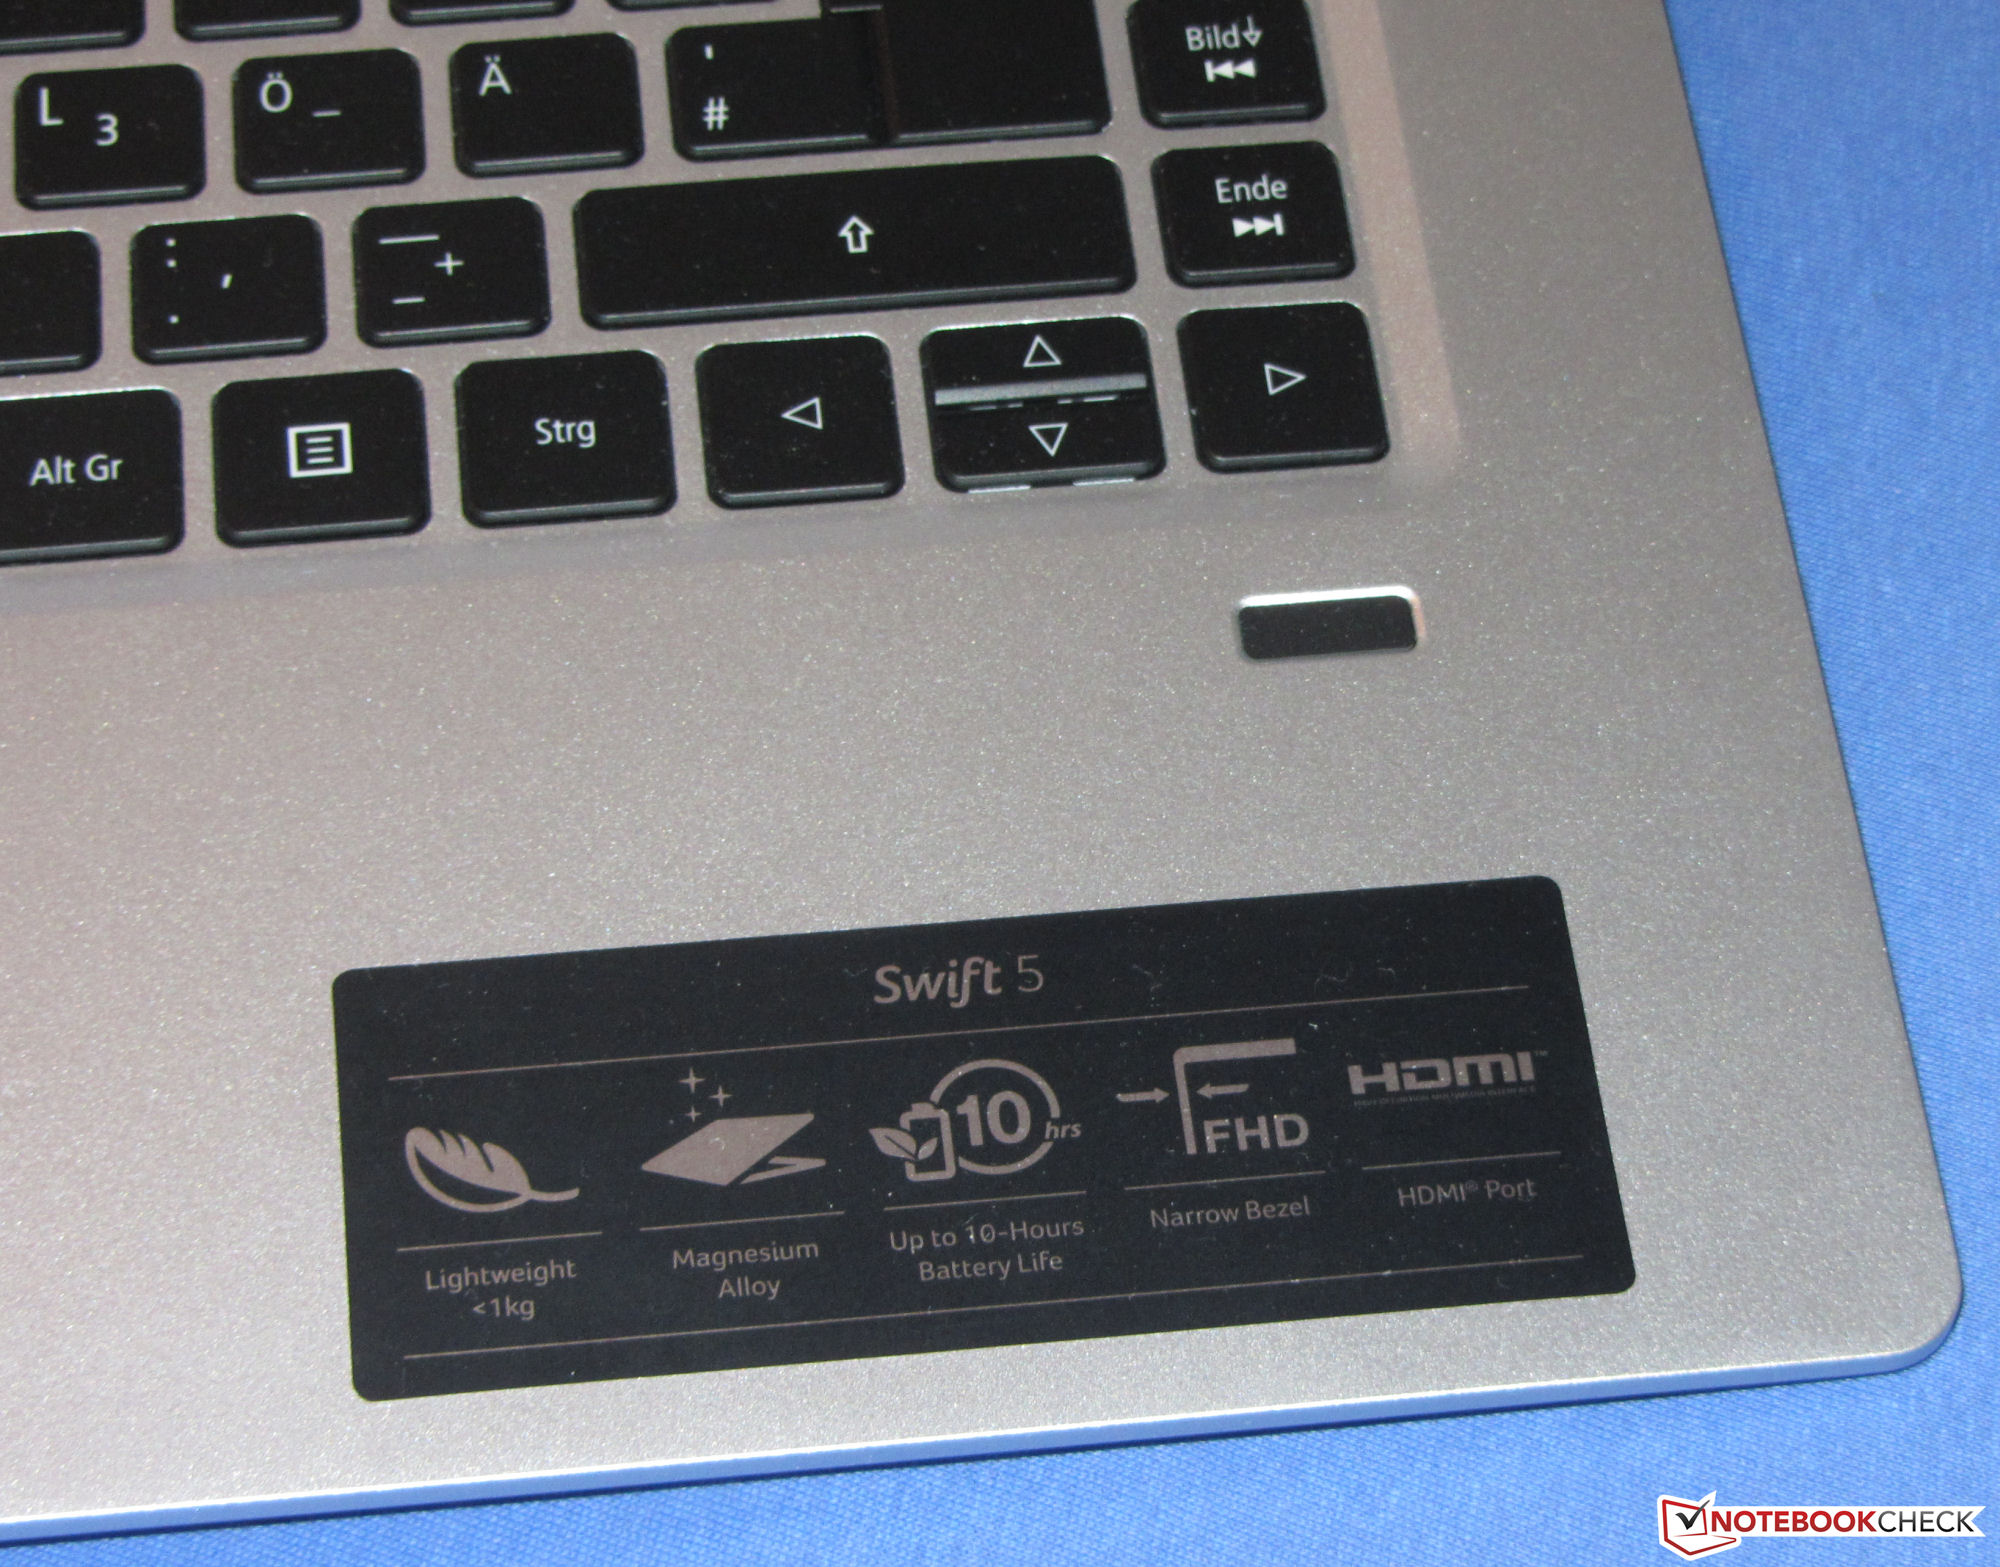
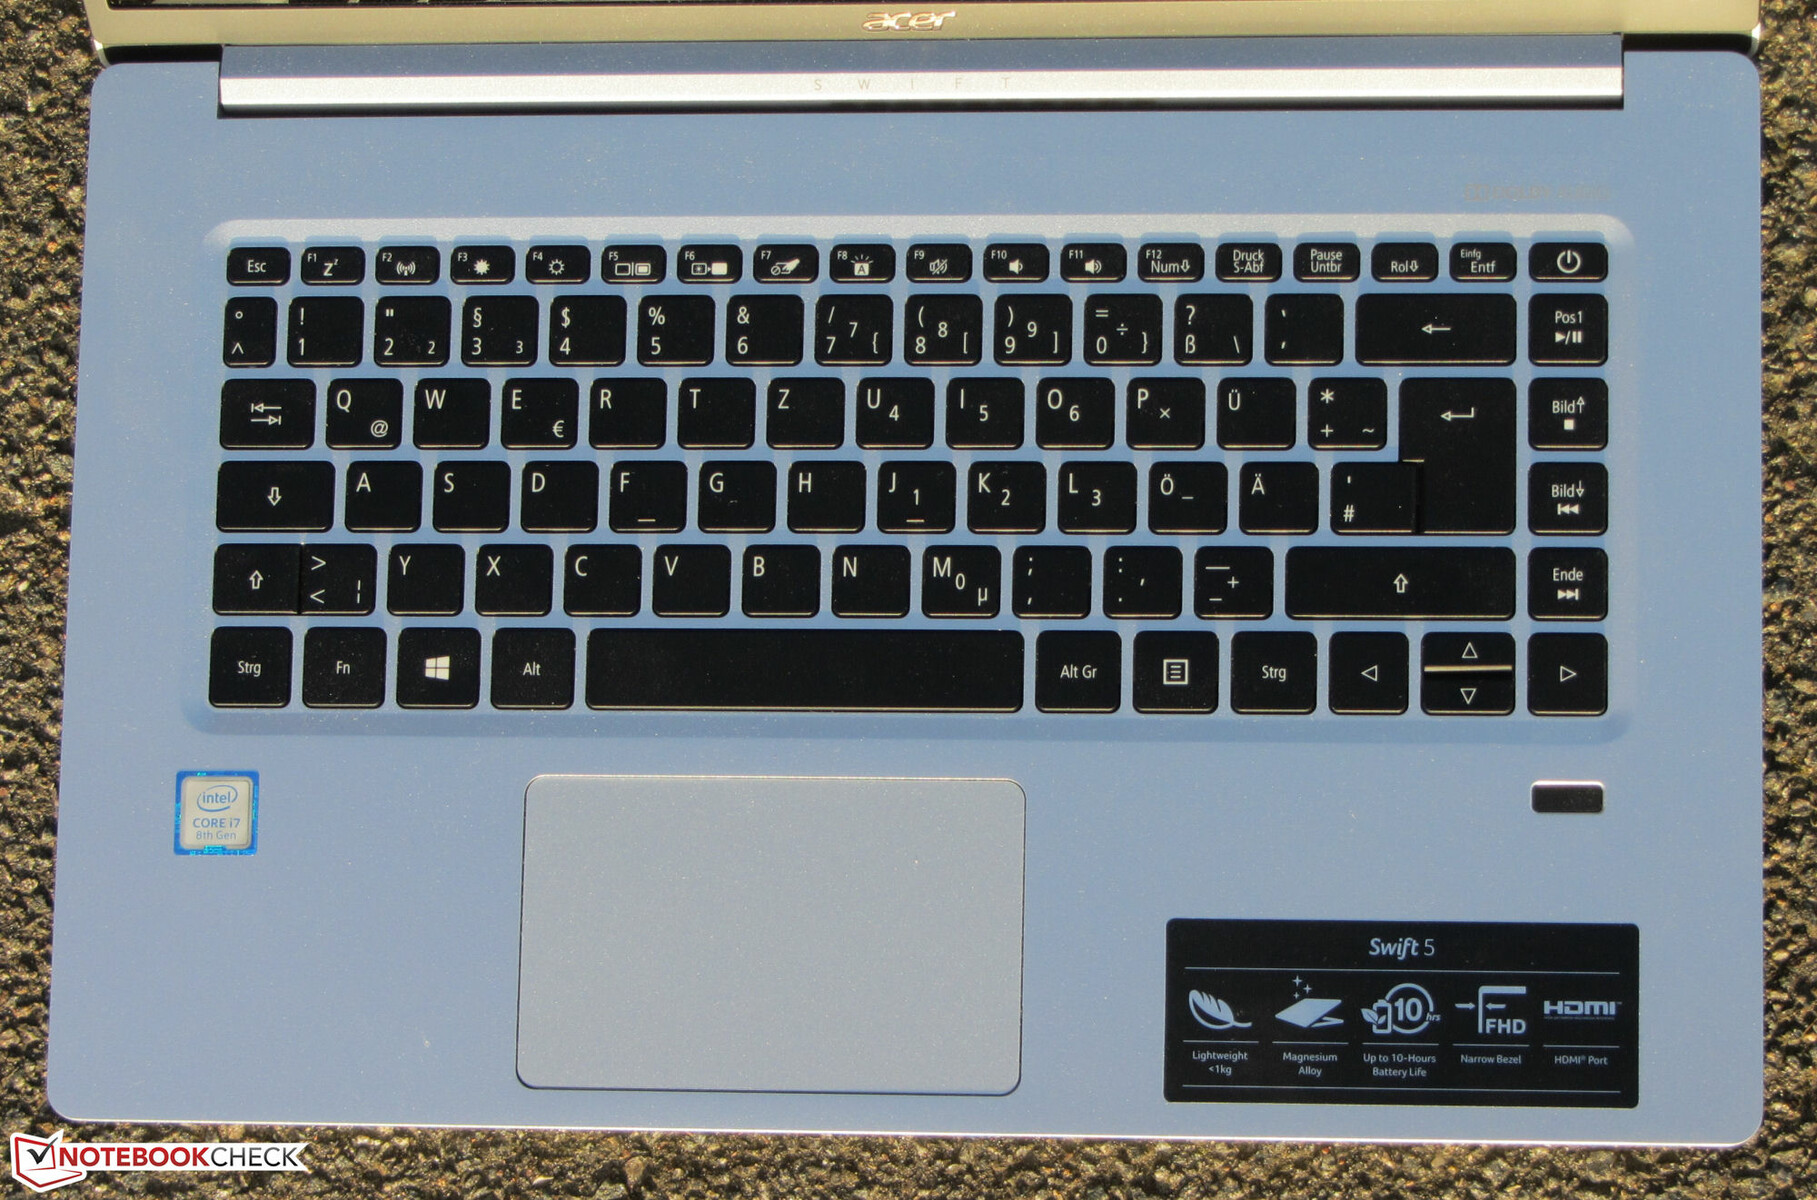
O Swift 5 SF515-51T da Acer é um portátil muito leve que é feito para viajantes frequentes que não querem abrir mão de uma grande tela de 15,6 polegadas.
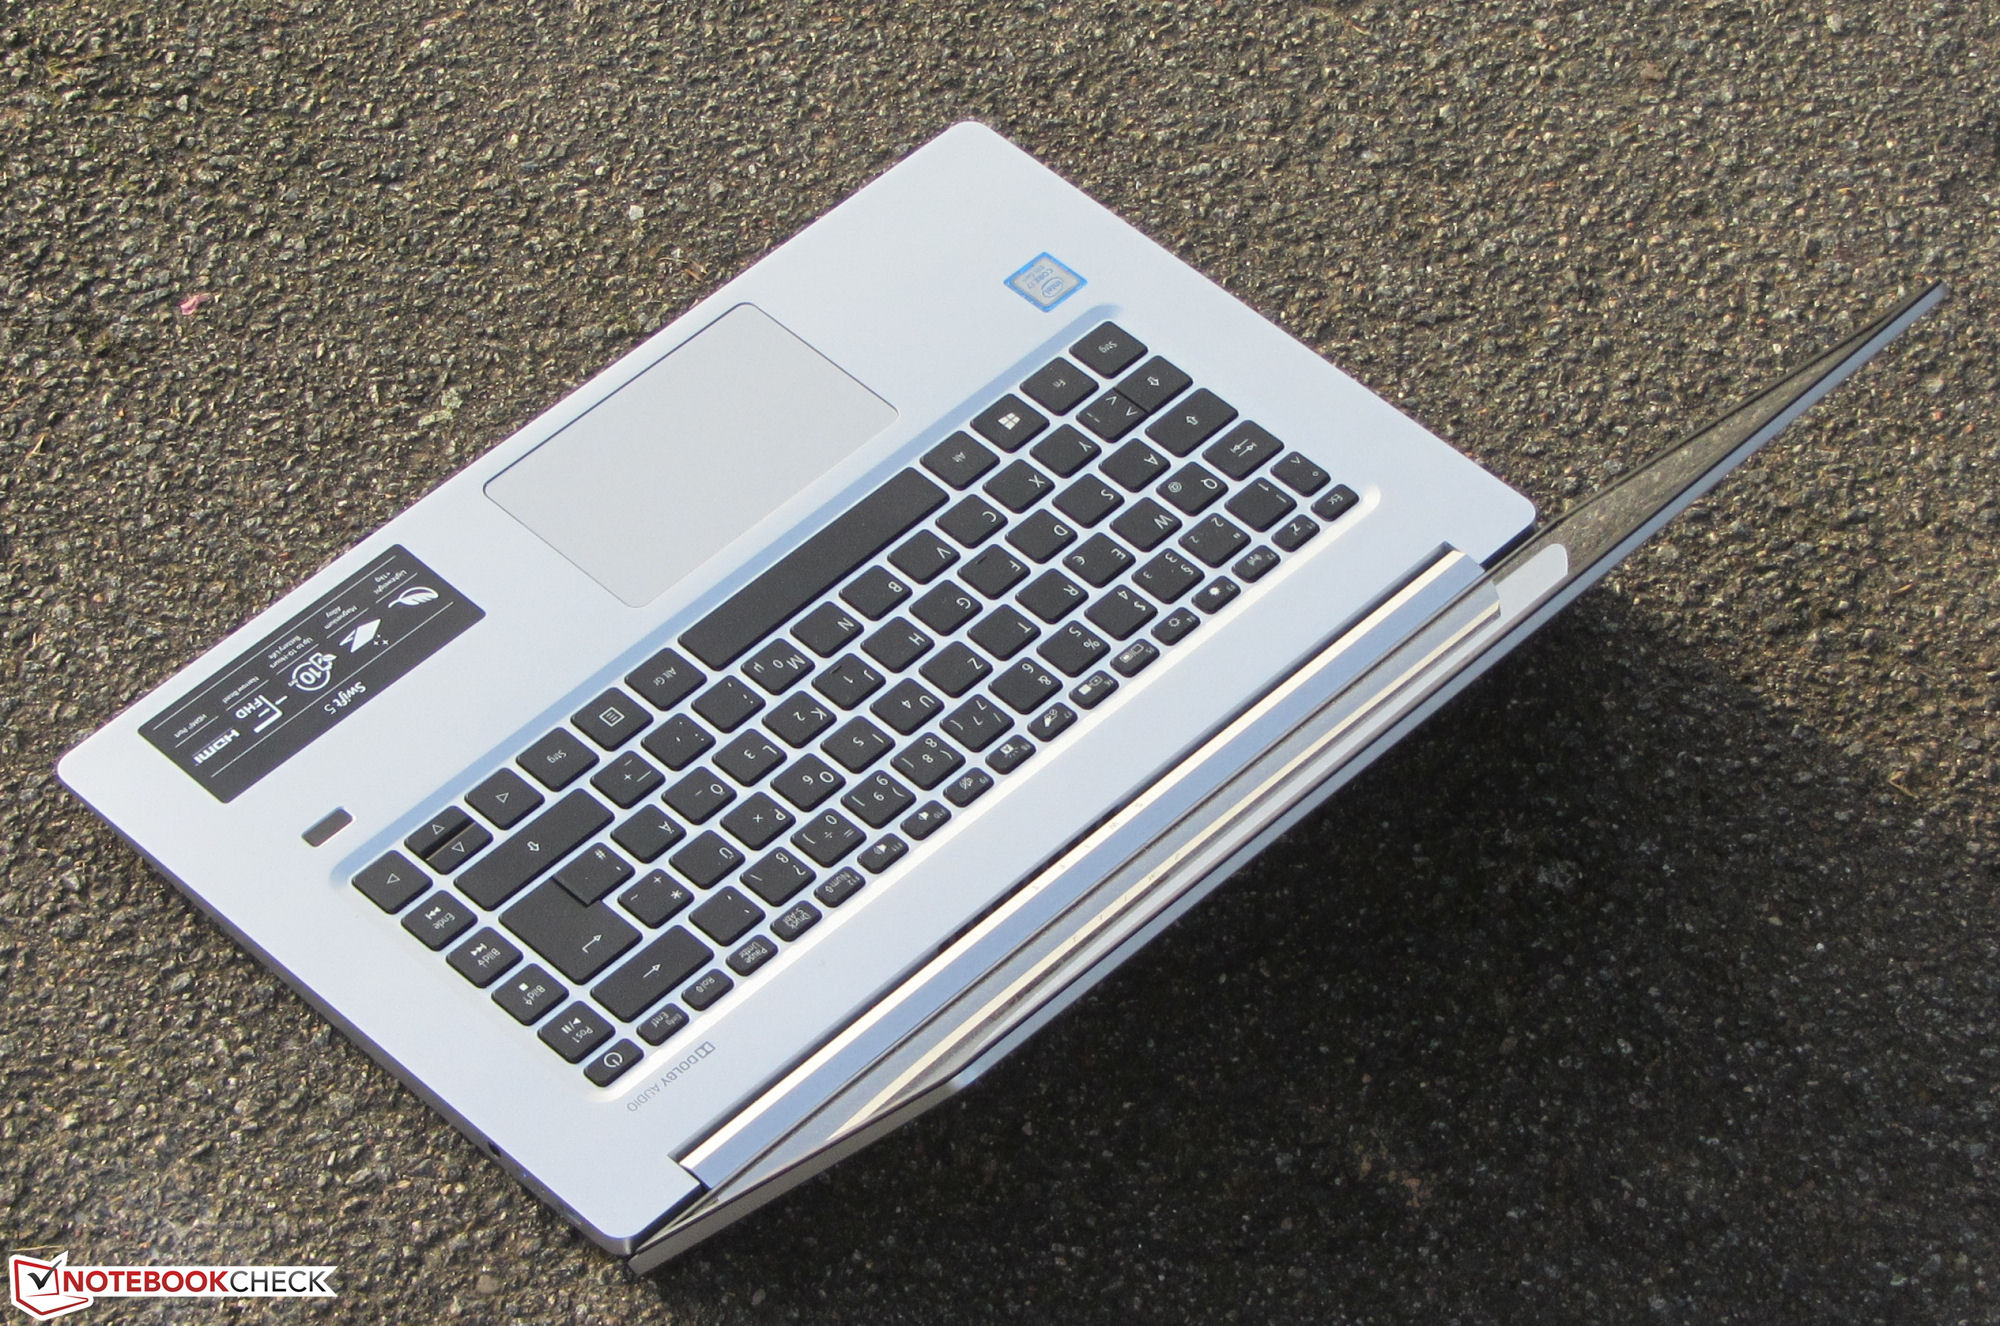
Pesando pouco menos de um quilograma, o dispositivo é dificilmente perceptível em sua bolsa - sem ombros tensos com este!
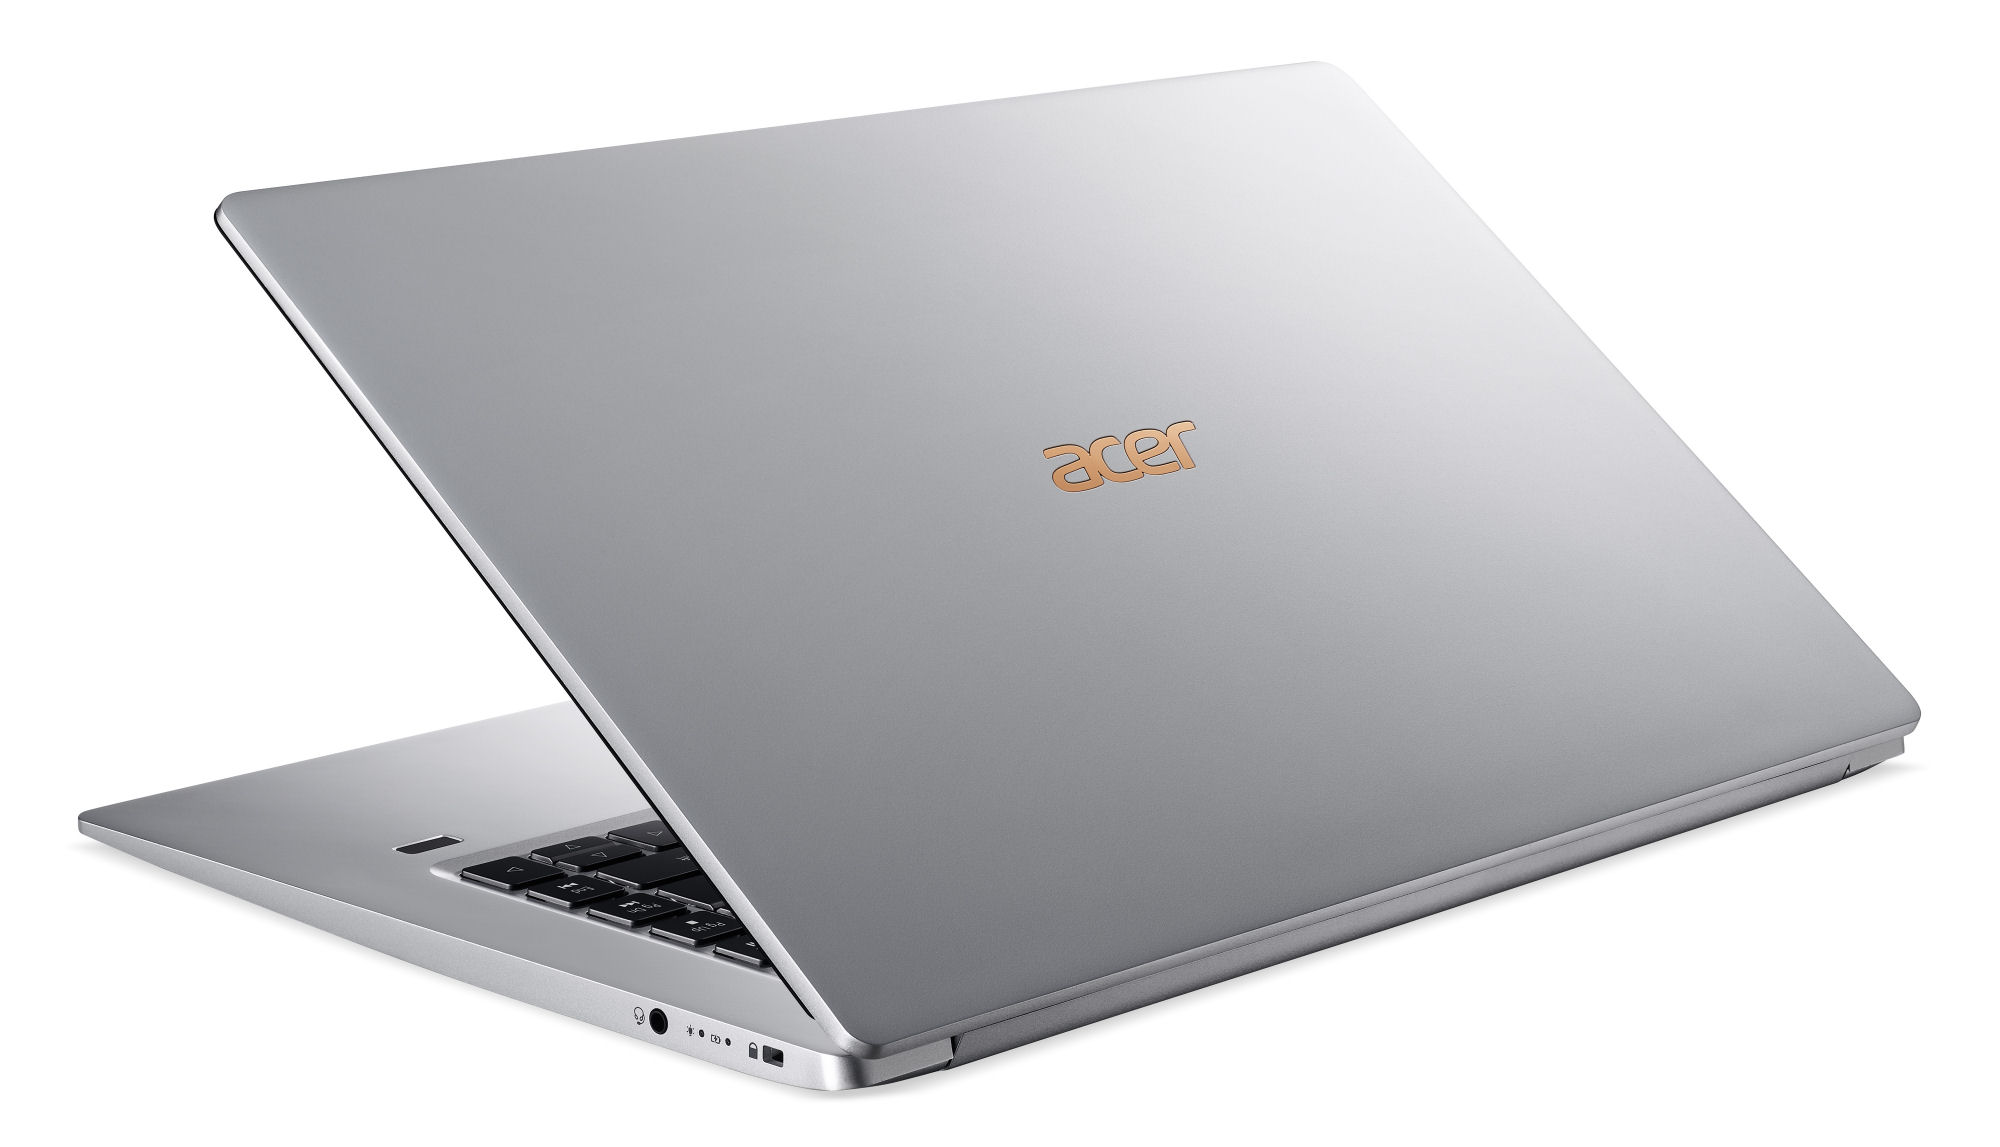
A fim de alcançar este baixo peso, a Acer escolheu uma carcaça de magnésio e várias limitações. Os módulos de RAM, SSD e Wi-Fi estão todos soldados na placa-mãe, o que significa que nenhum desses componentes pode ser trocado ou expandido. Portanto, você deve estar ciente de quanto armazenamento precisará ao longo dos próximos anos antes de comprar um Swift 5. Pelo menos há um slot M.2 2280 livre, então você pode adicionar algum armazenamento NVMe mais tarde.
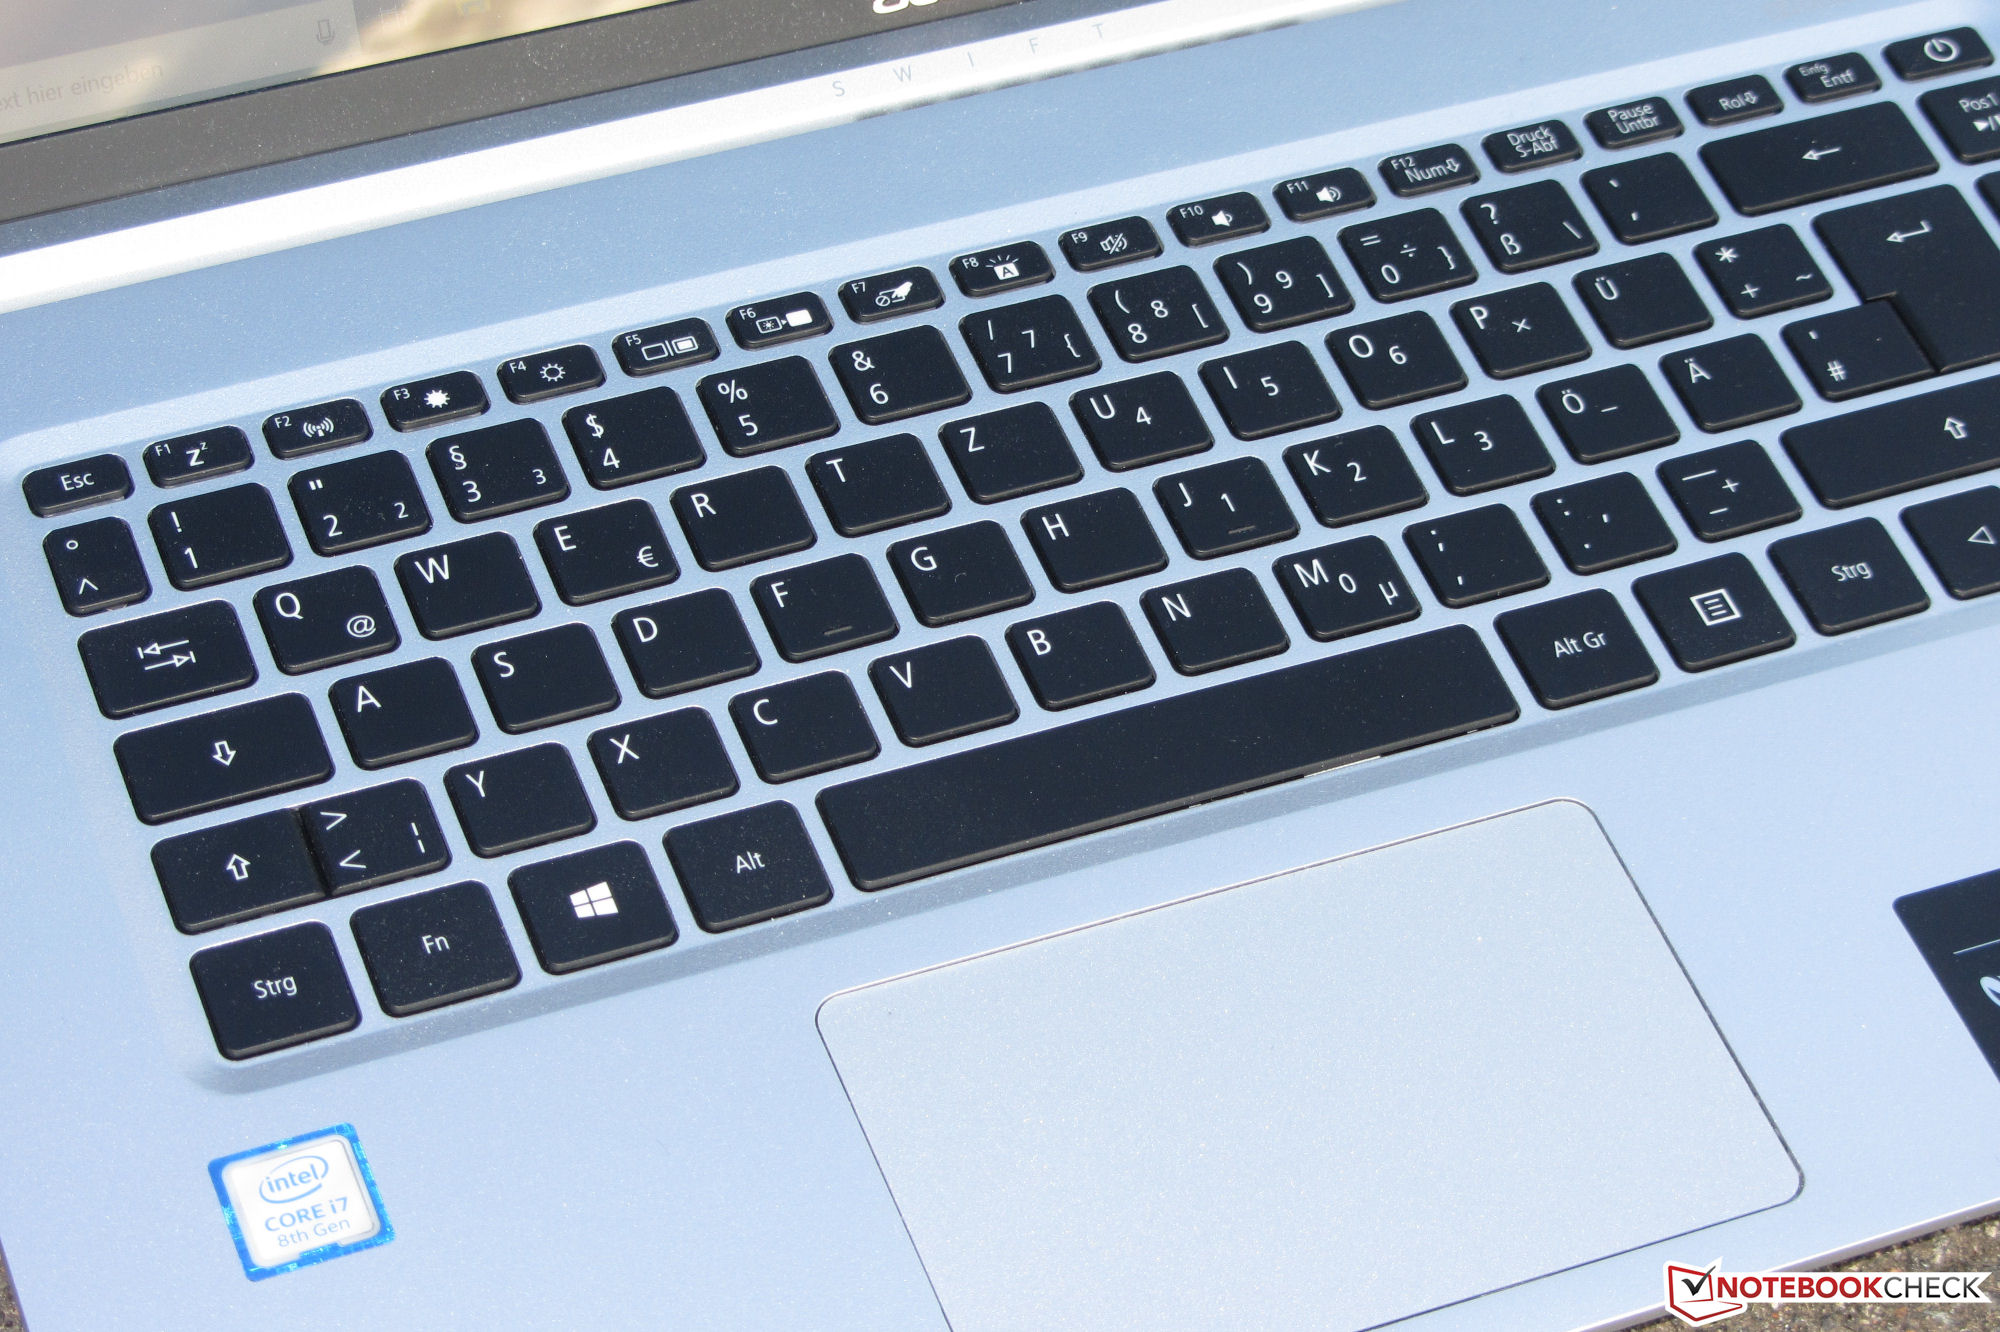
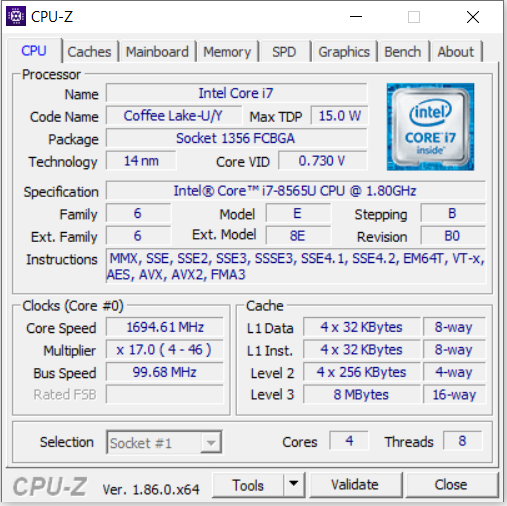
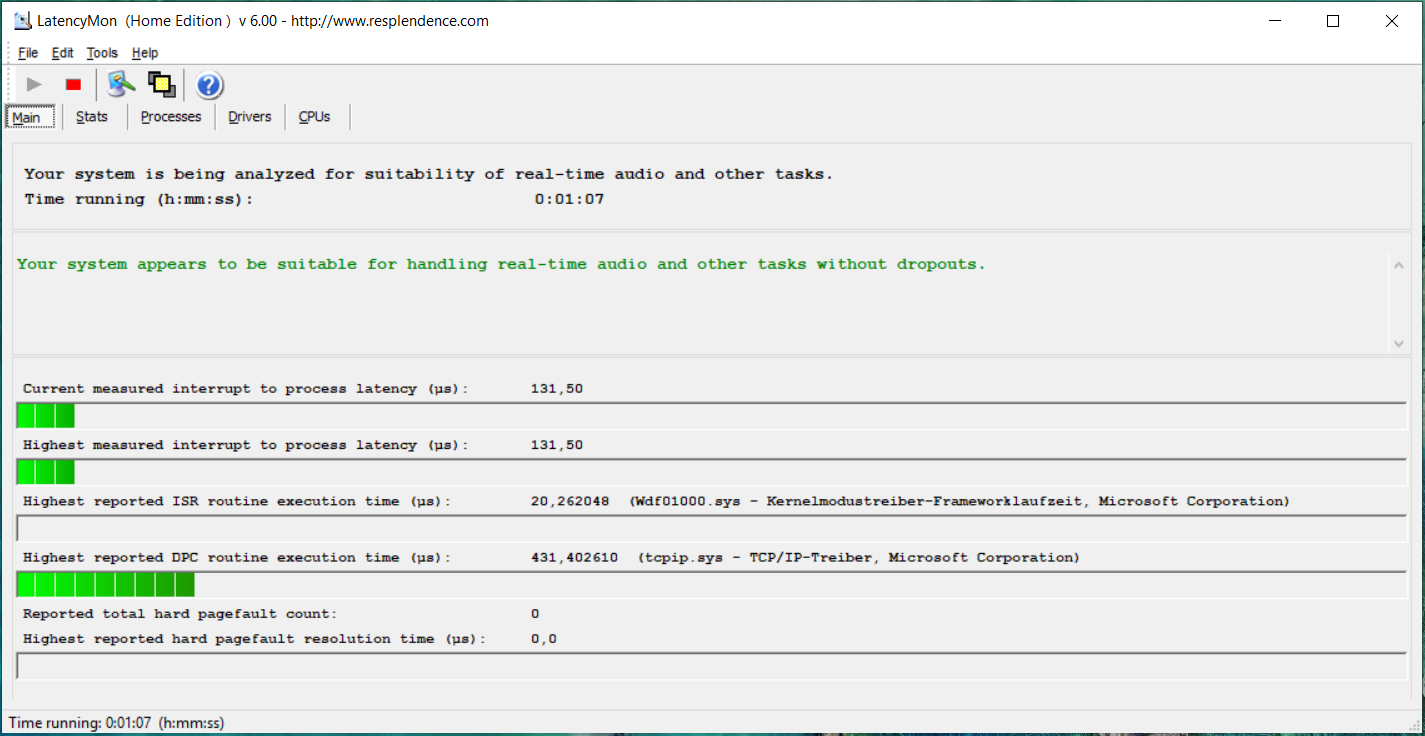
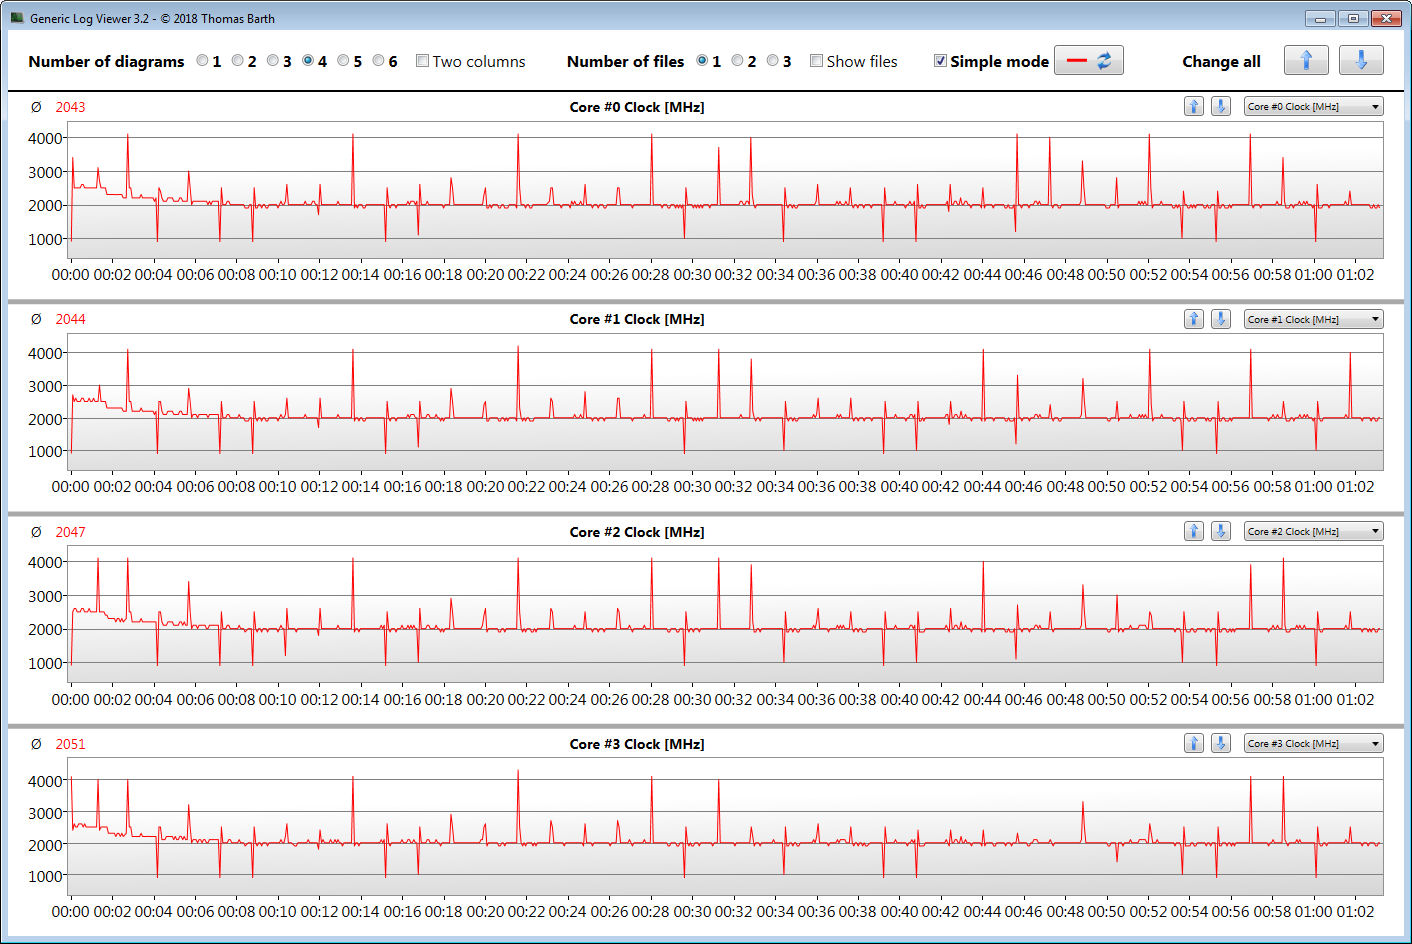
O dispositivo é alimentado por um processador Core i7 Whiskey Lake que oferece capacidade de processamento suficiente para aplicativos de escritório e internet. Infelizmente, o Swift 5 não pode tirar o máximo proveito de sua CPU ao trabalhar por um longo tempo, particularmente durante a operação multi-thread. Se você precisar de desempenho máximo contínuo, é melhor procurar em outro lugar.
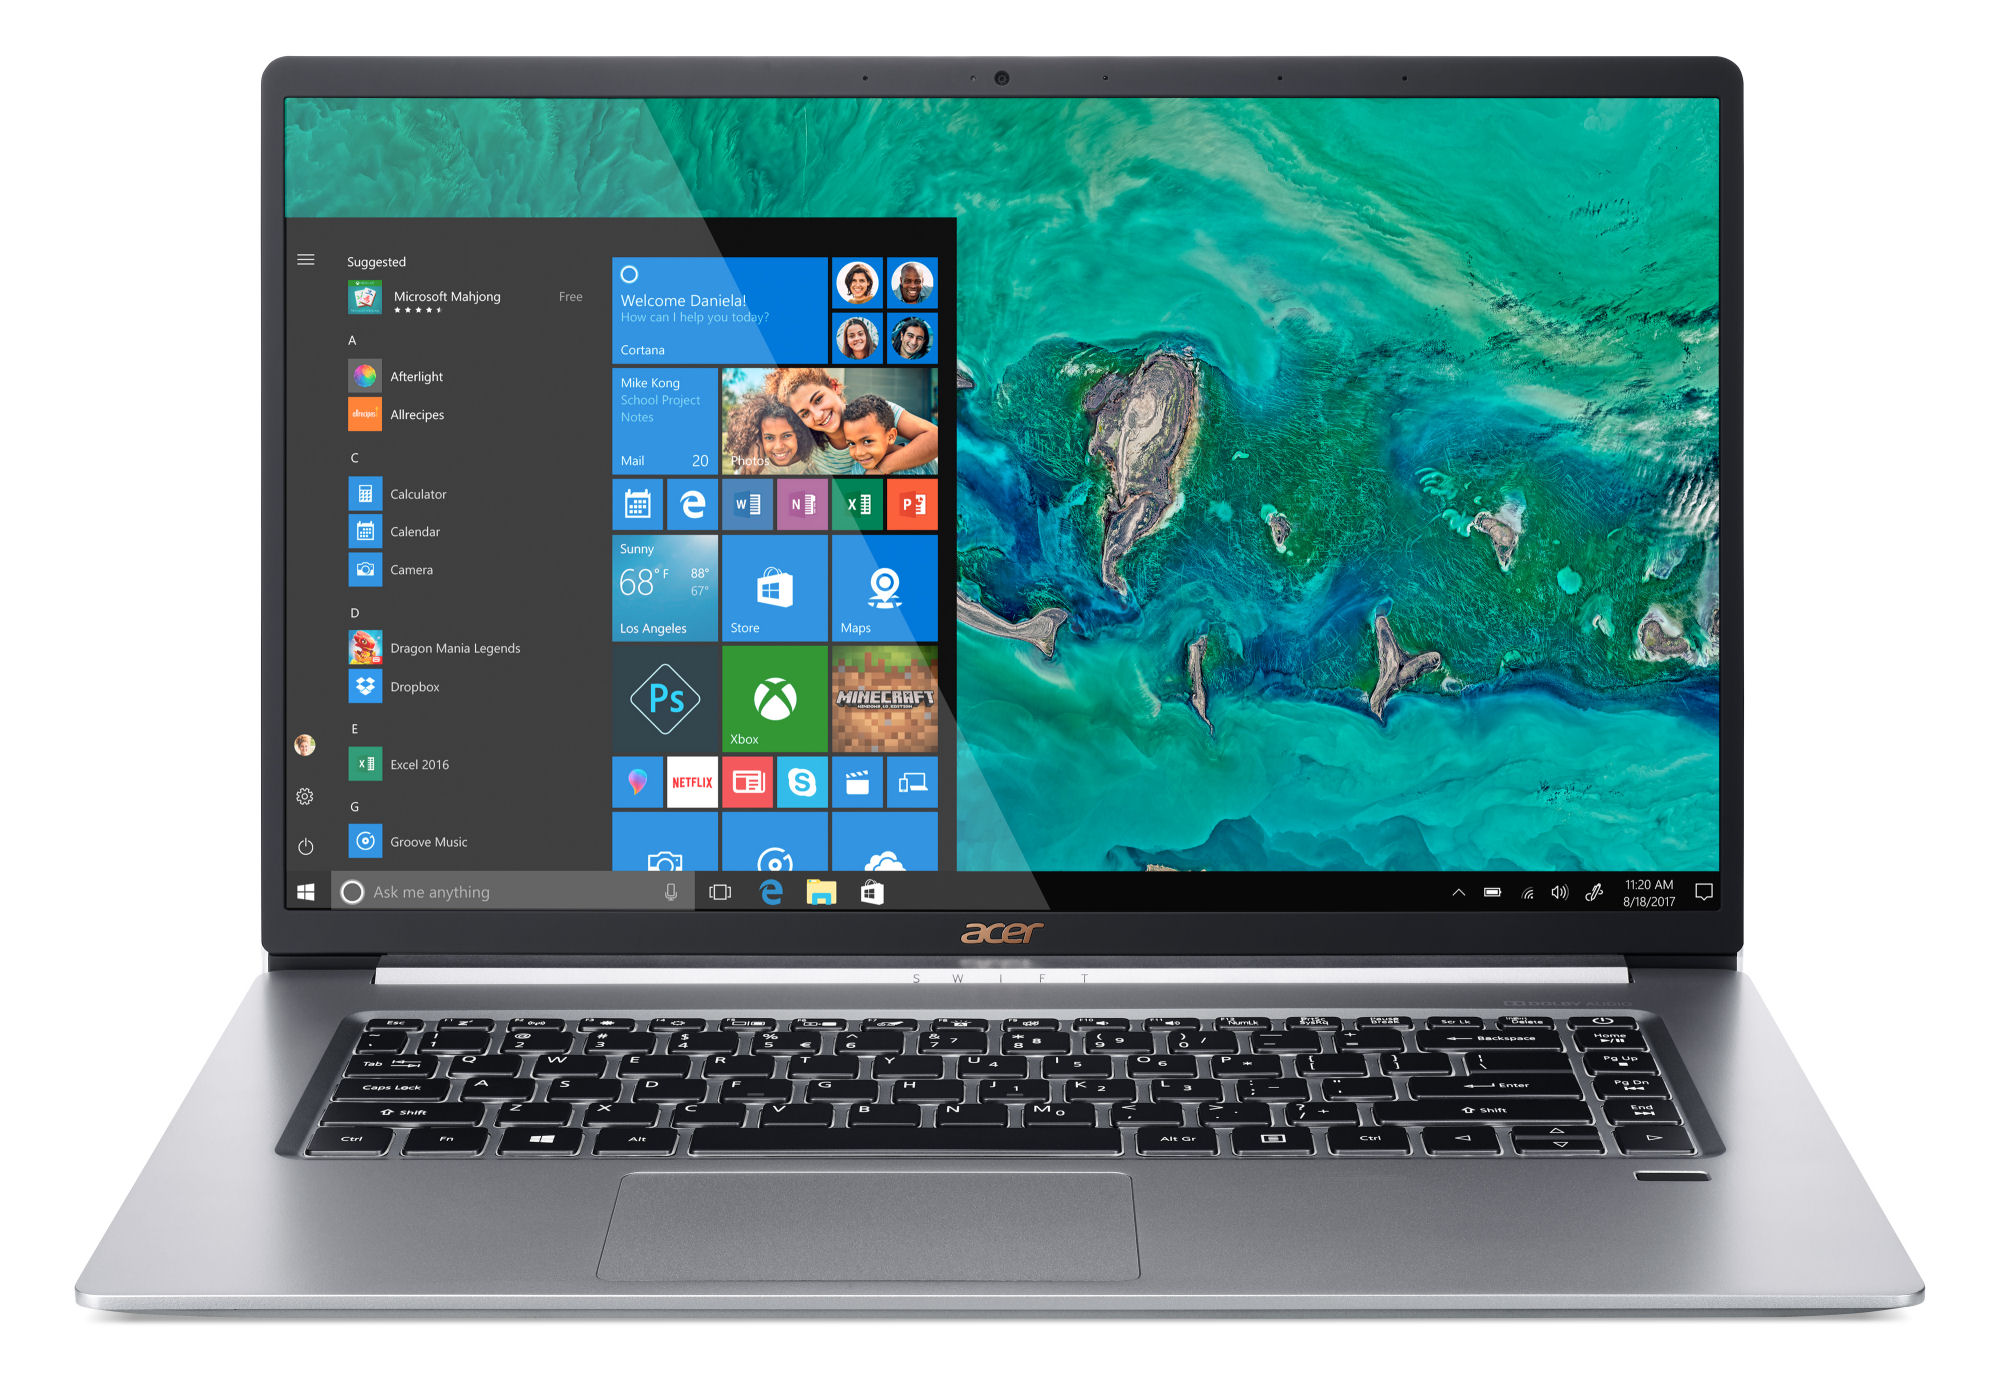
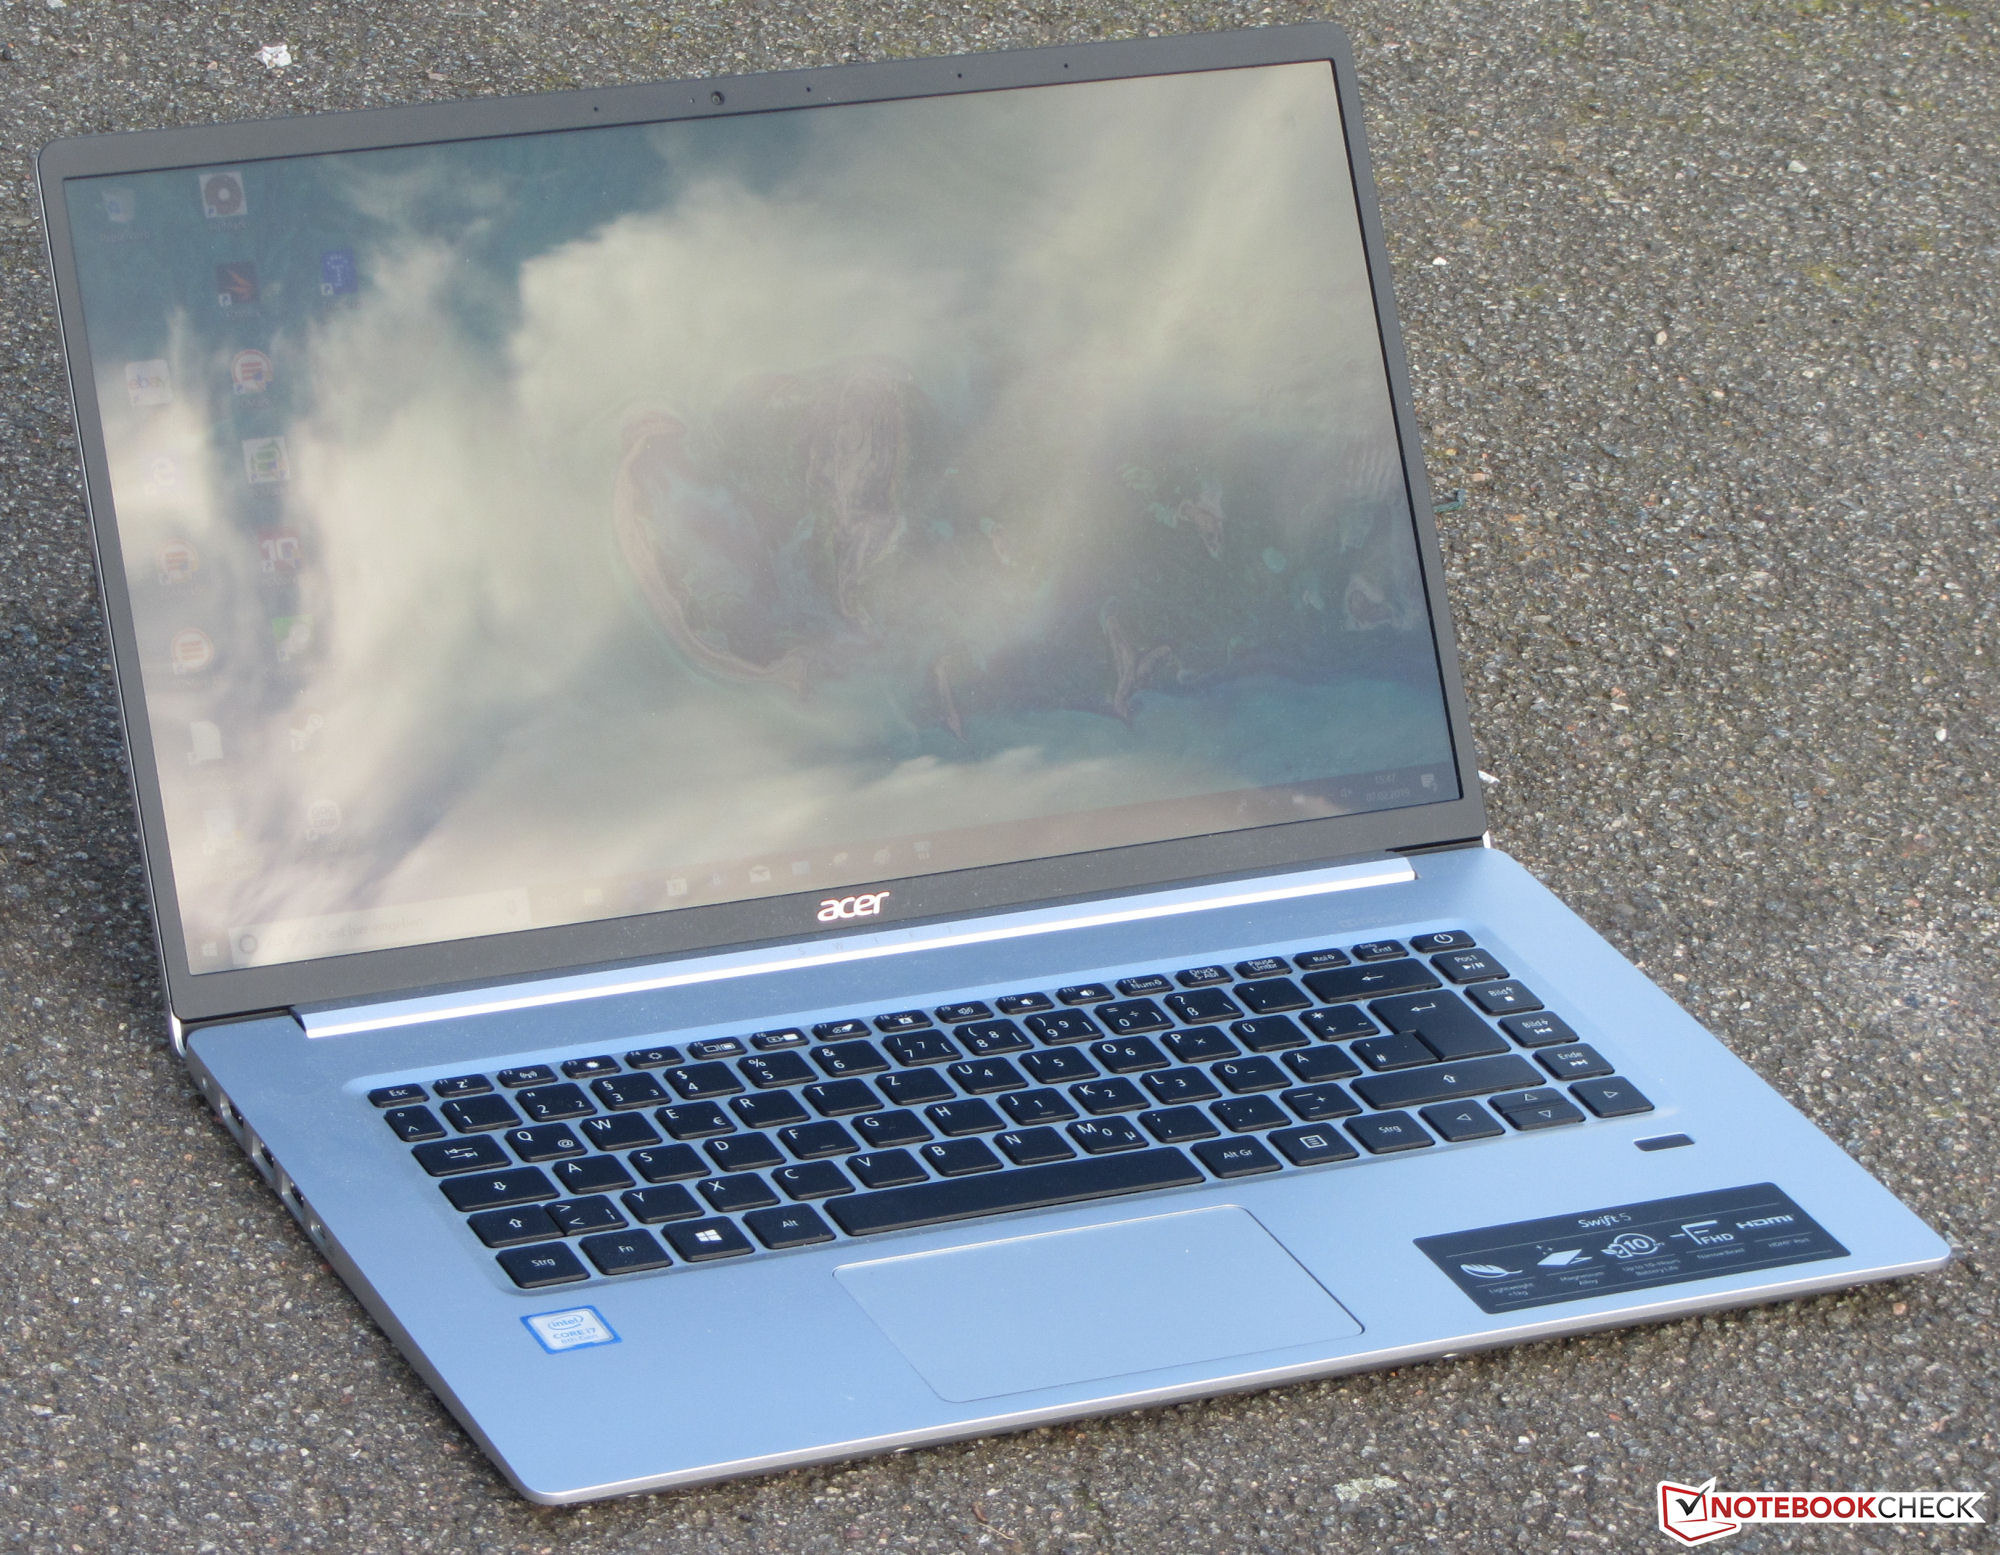
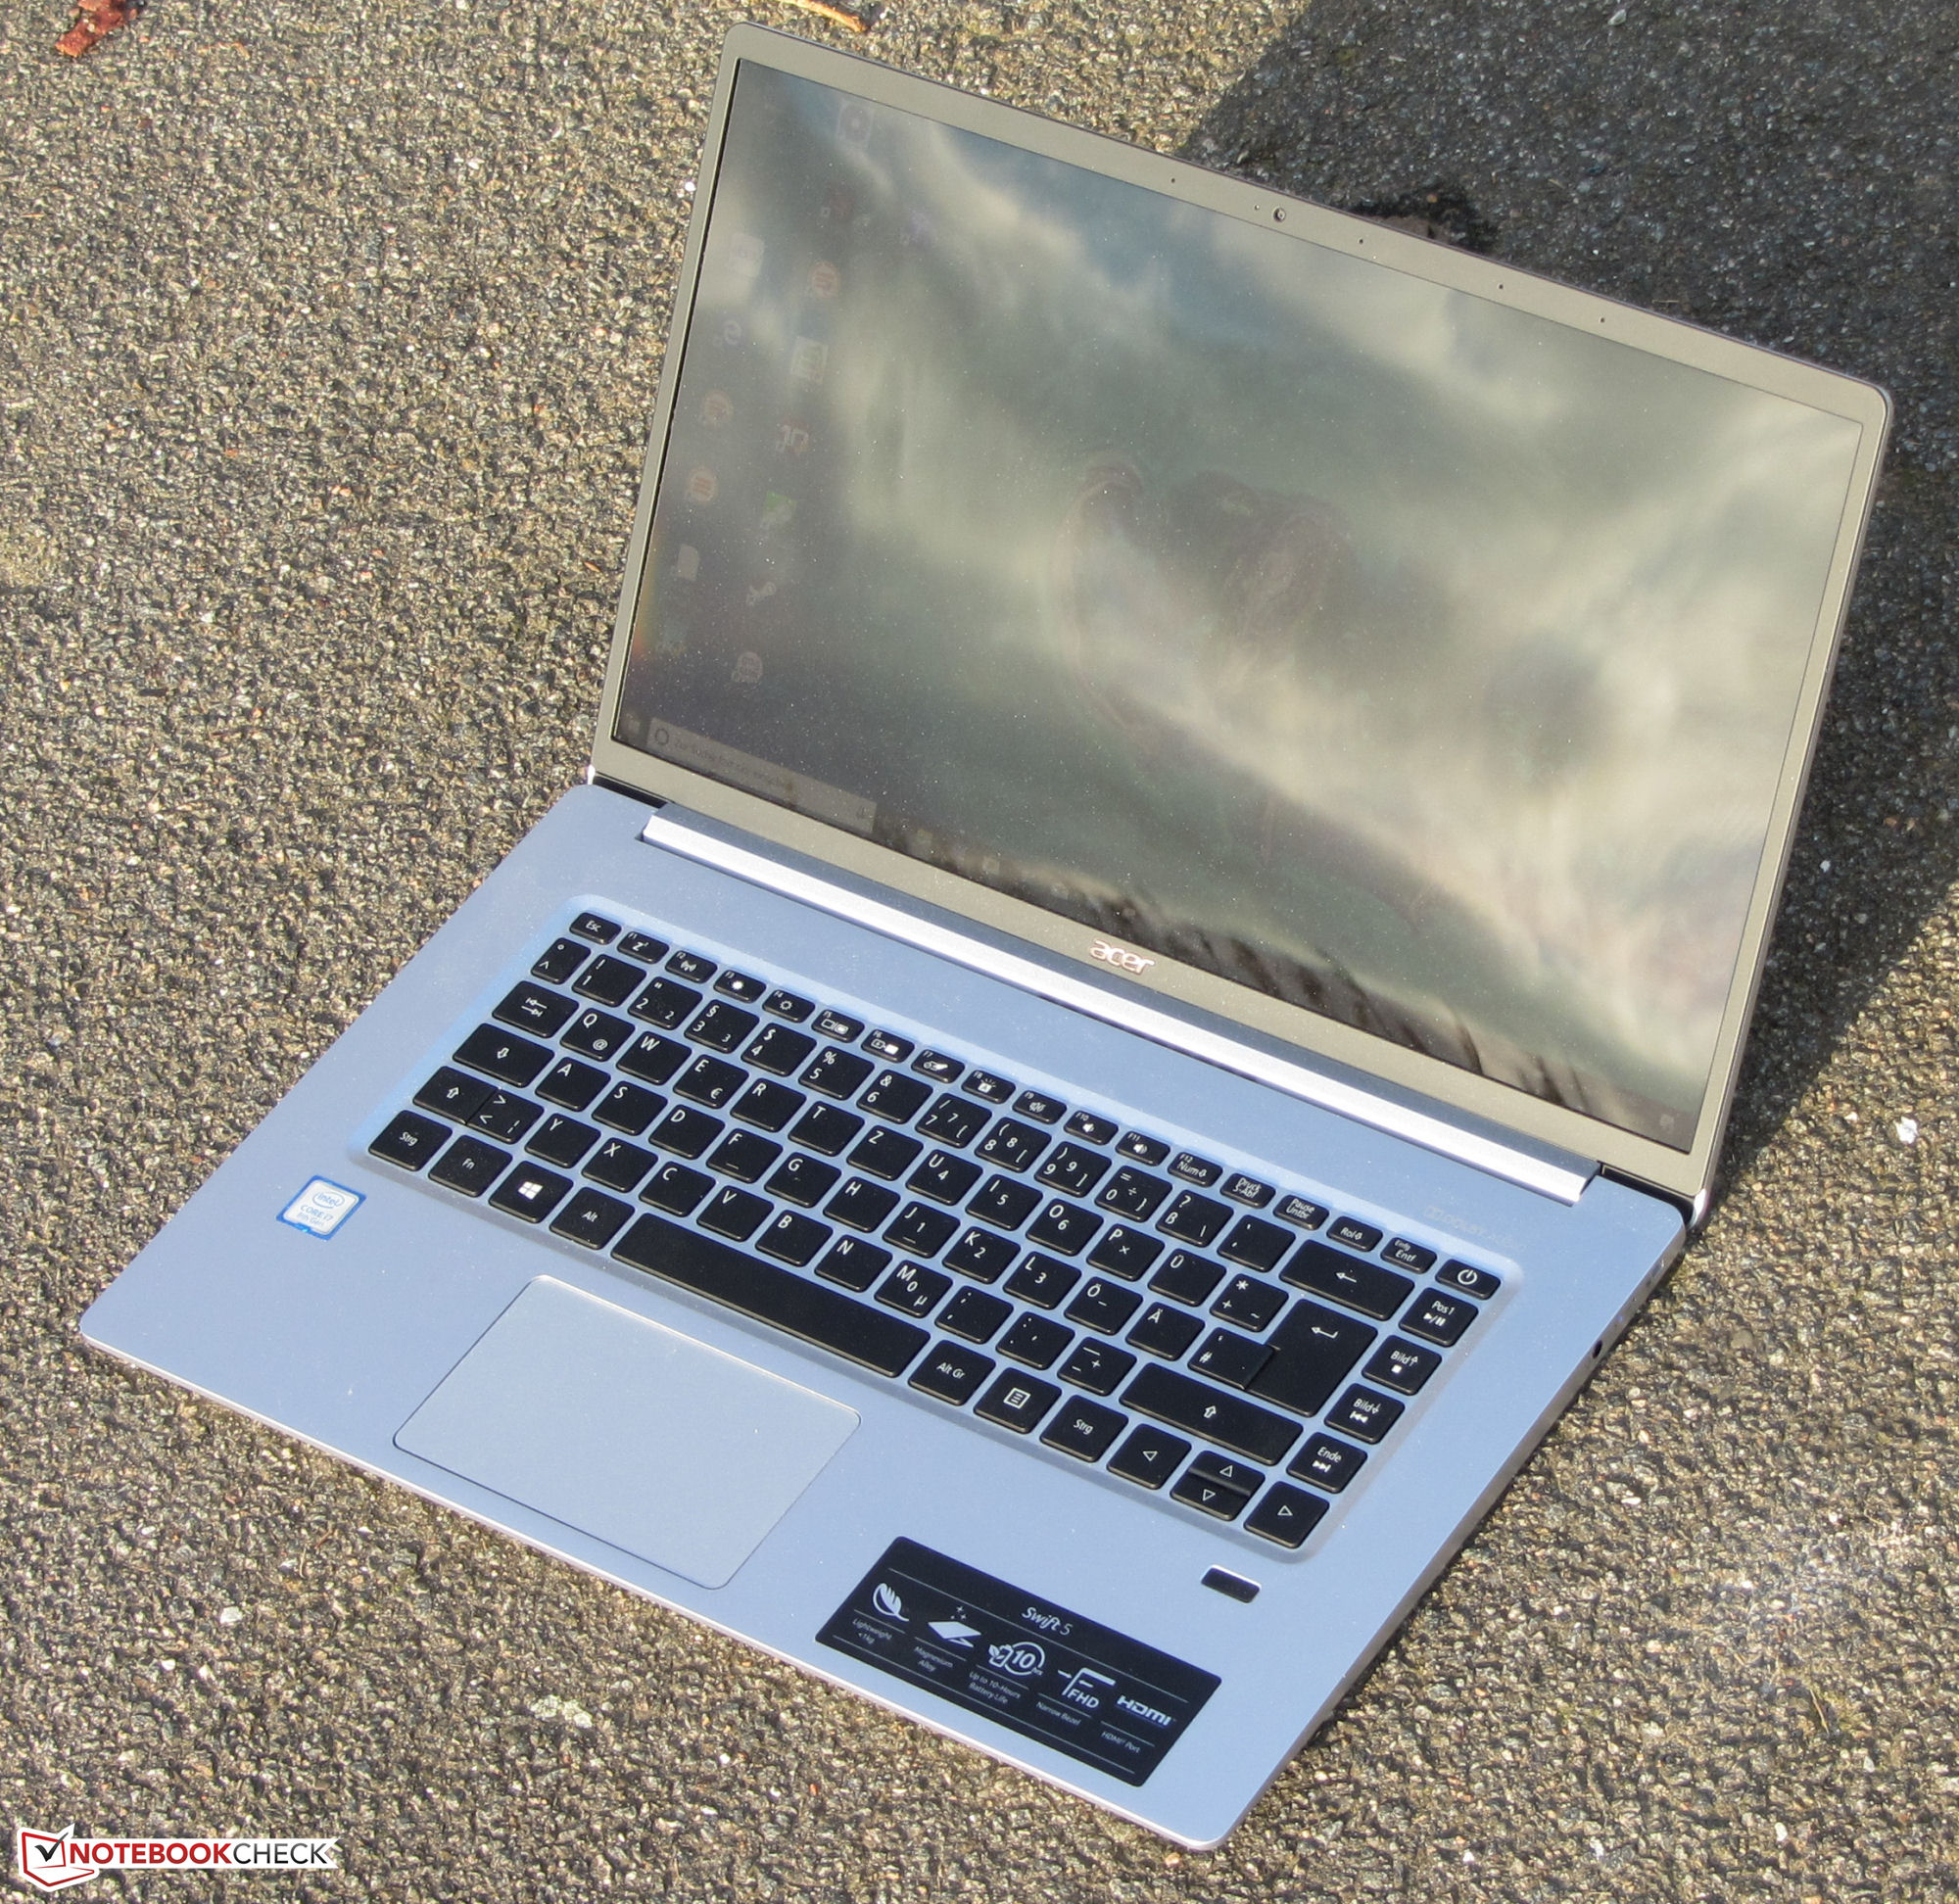
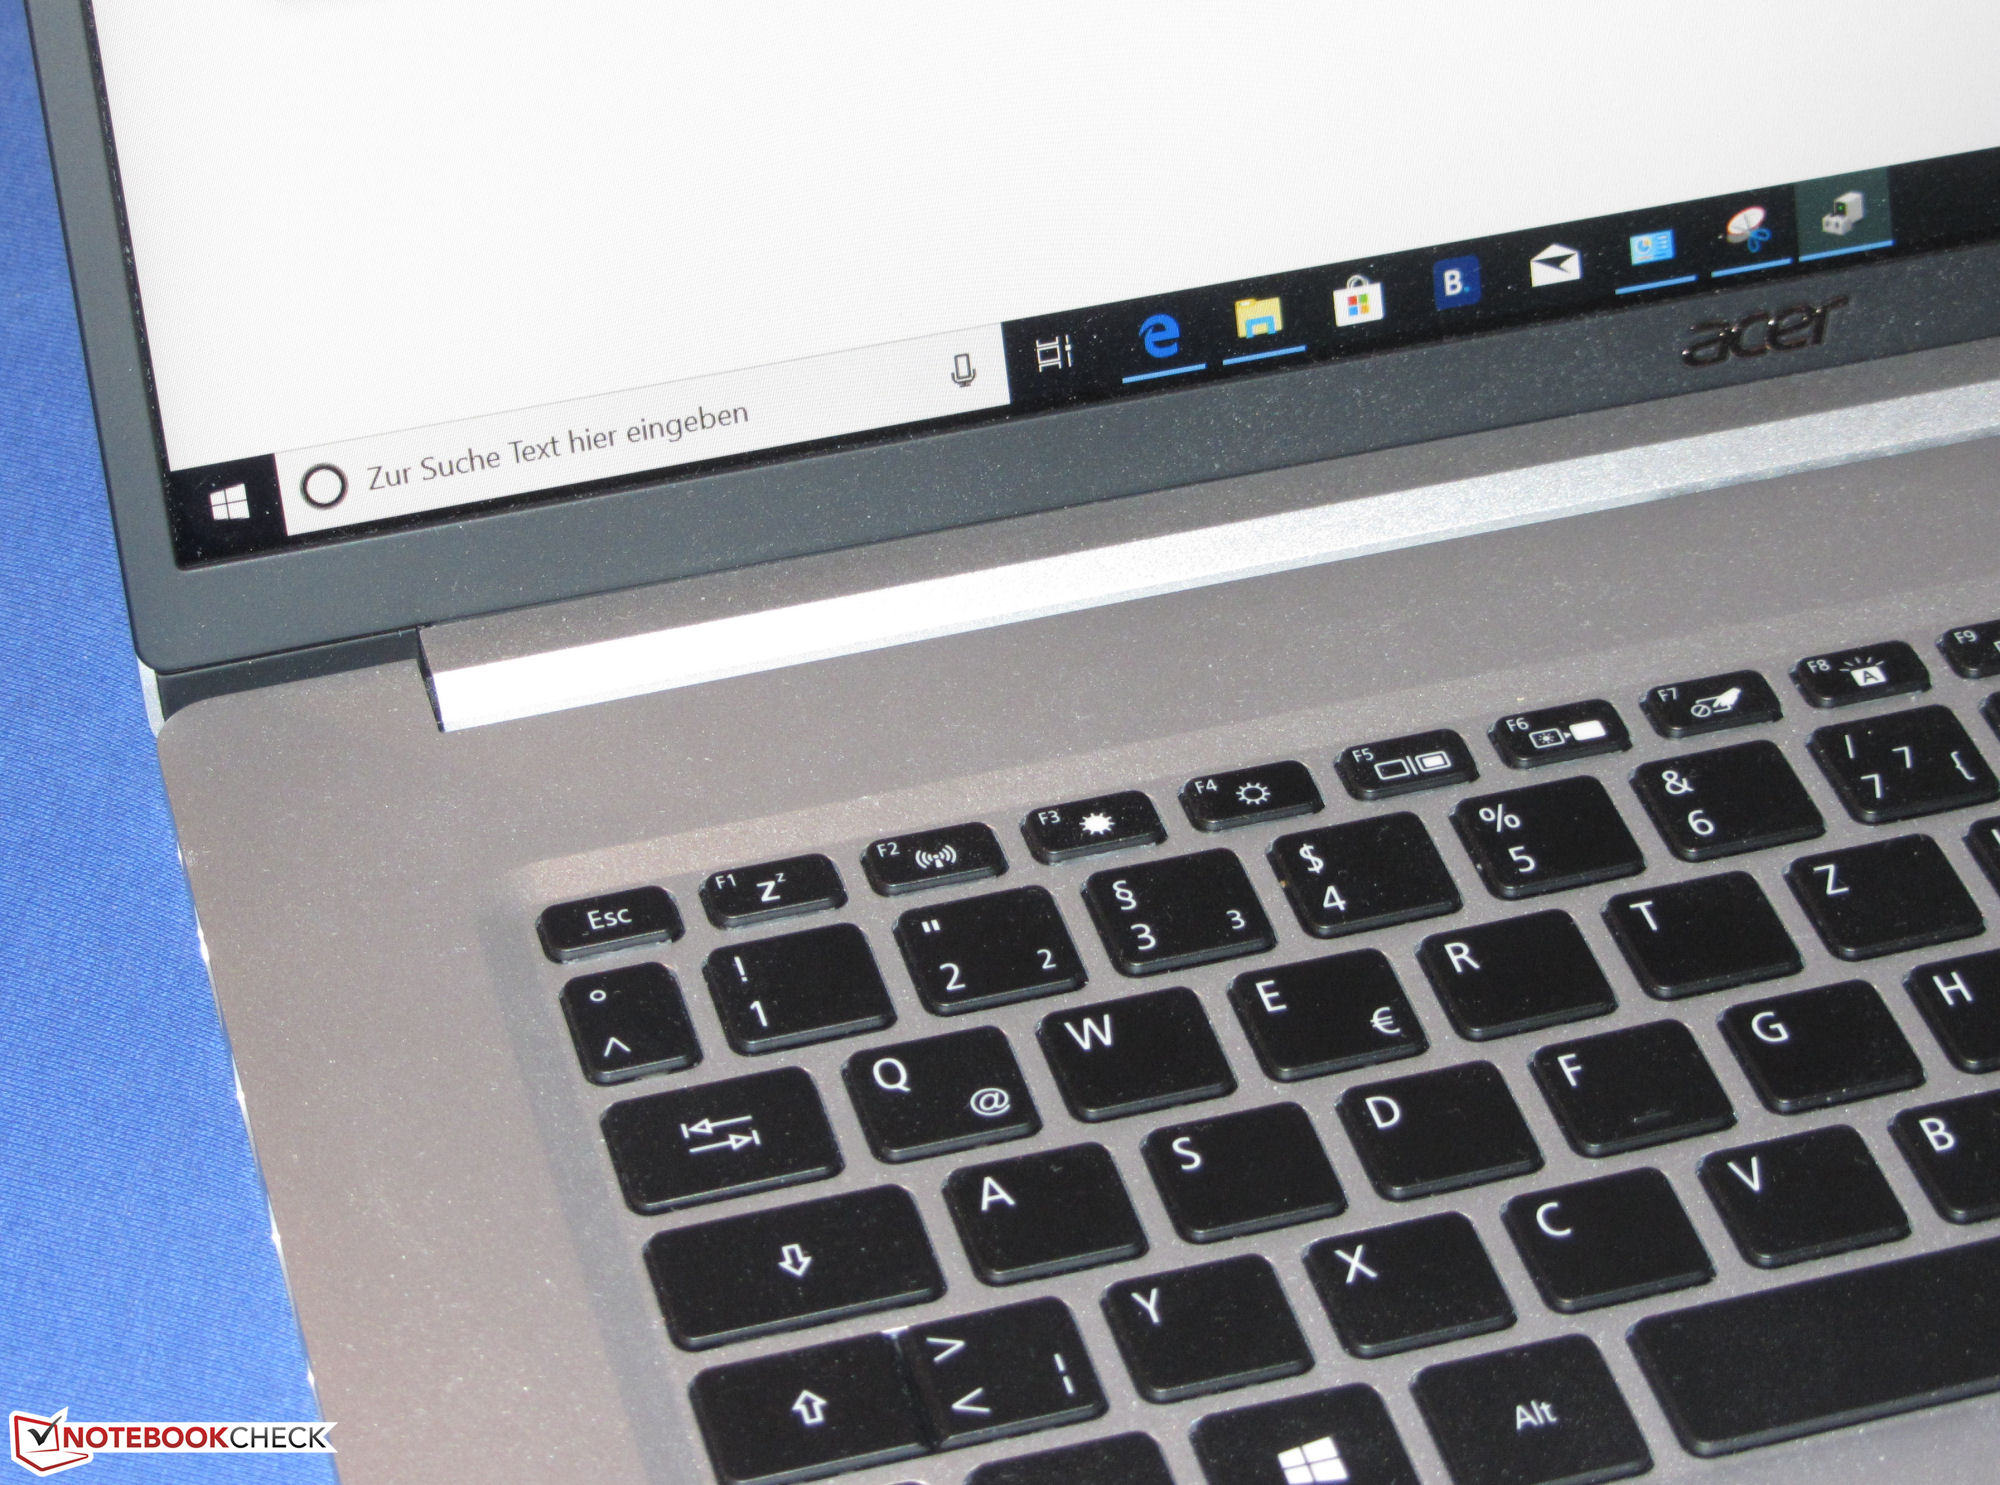
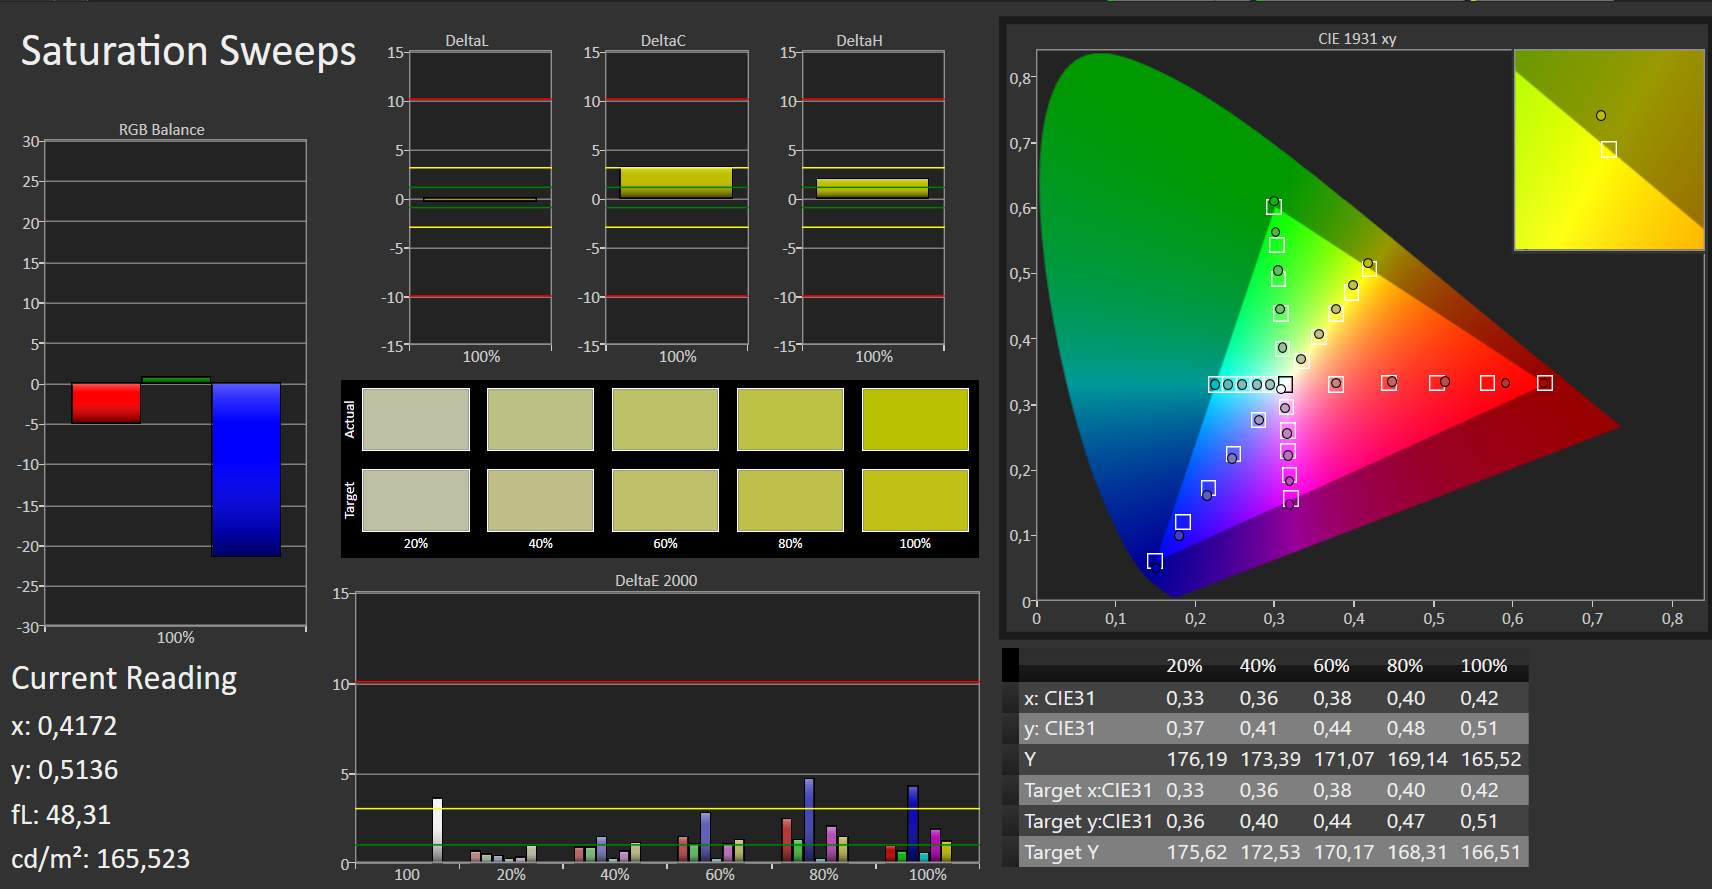
O Swift 5 oferece um teclado decente com luz de fundo de um nível, além de durações de bateria relativamente boas. A tela táctil IPS também nos deu uma boa impressão. Tem valores normais de contraste e brilho e suas cores são agradáveis. No entanto, esteja ciente de que esta é uma tela reflexiva. O ideal seria que a Acer oferecesse alternadamente uma tela mate sem o recurso de tela táctil.
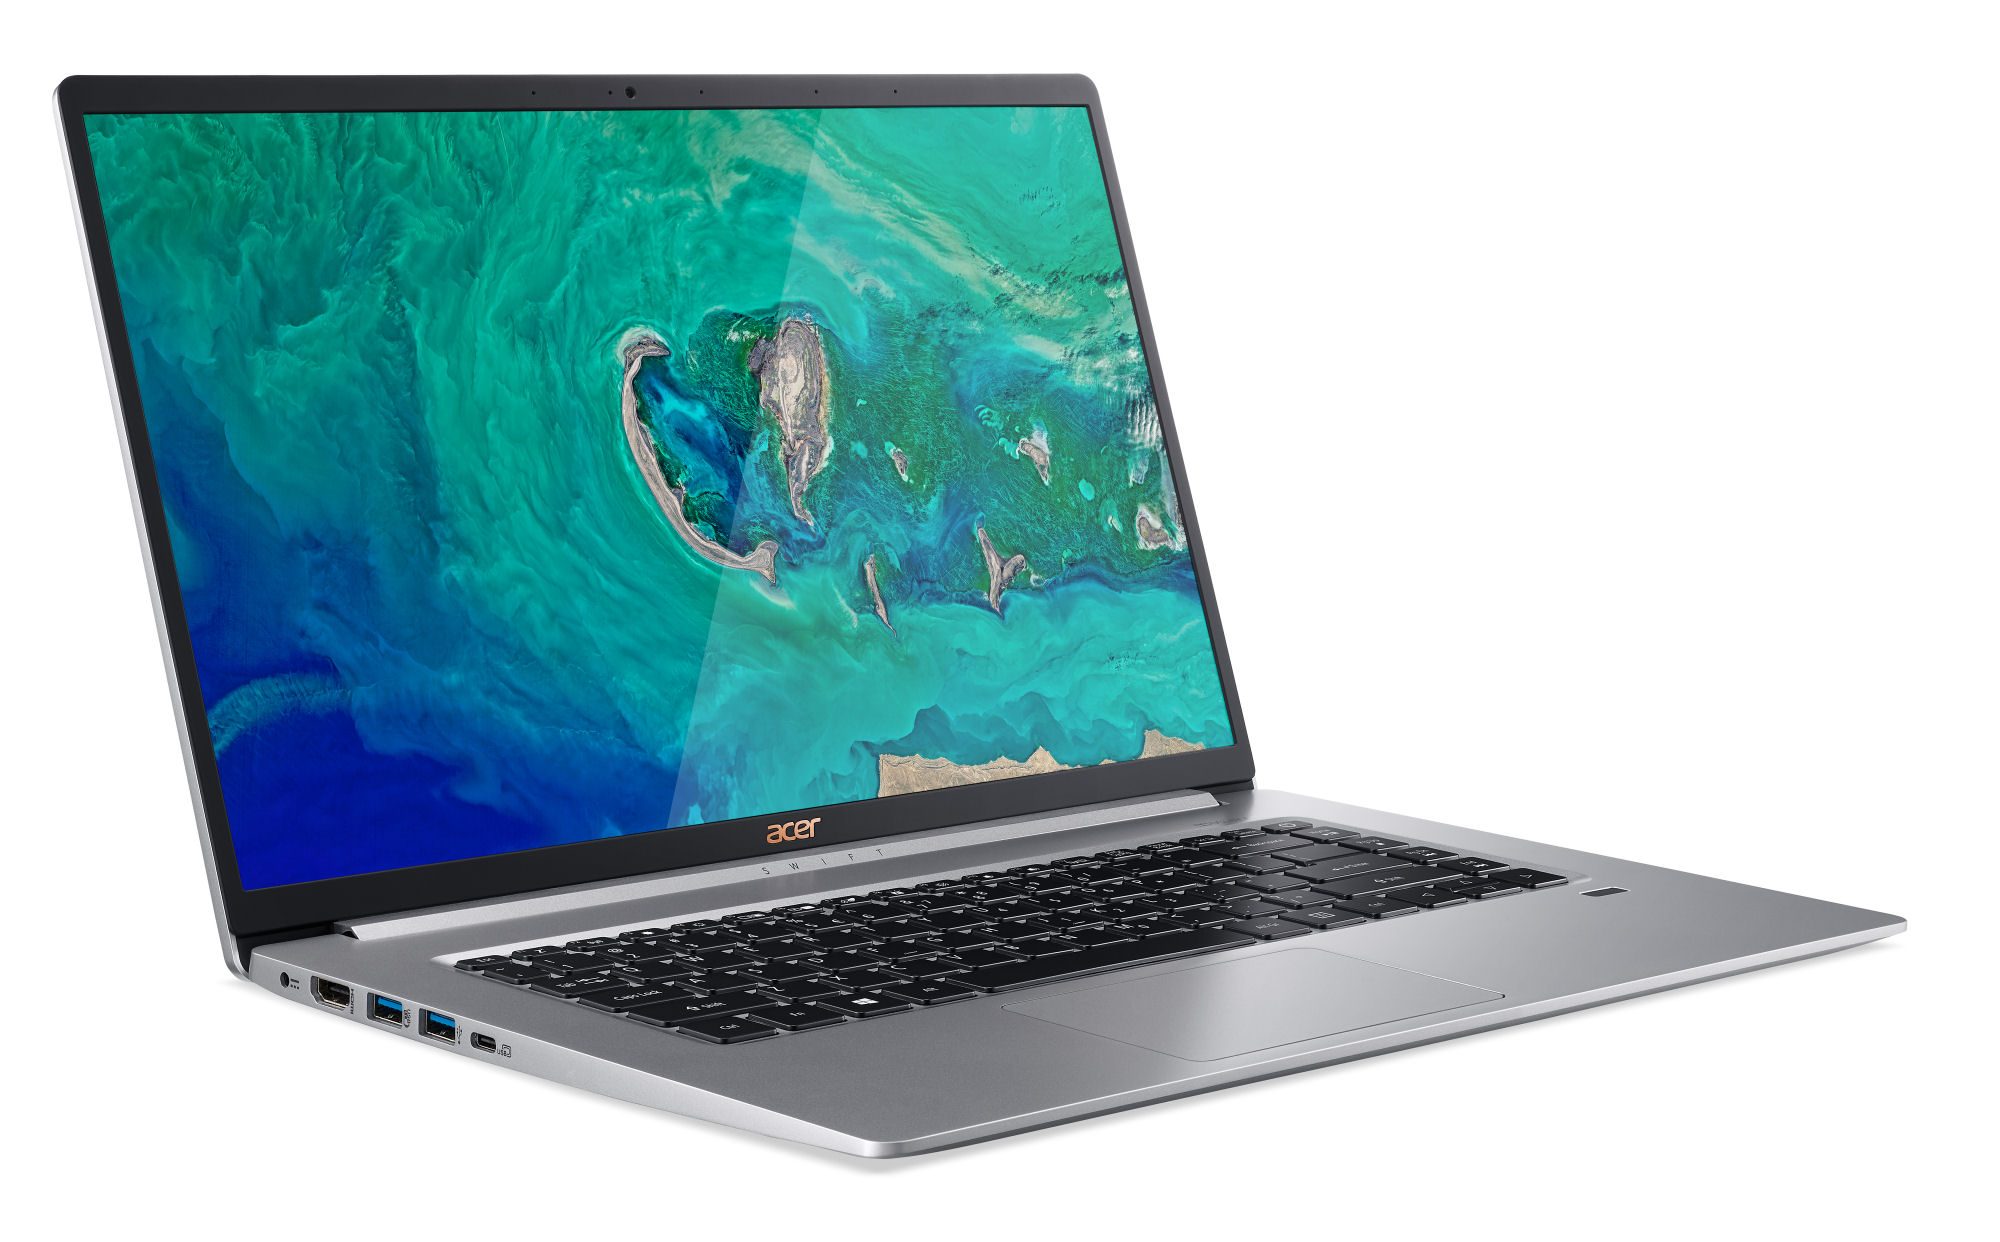
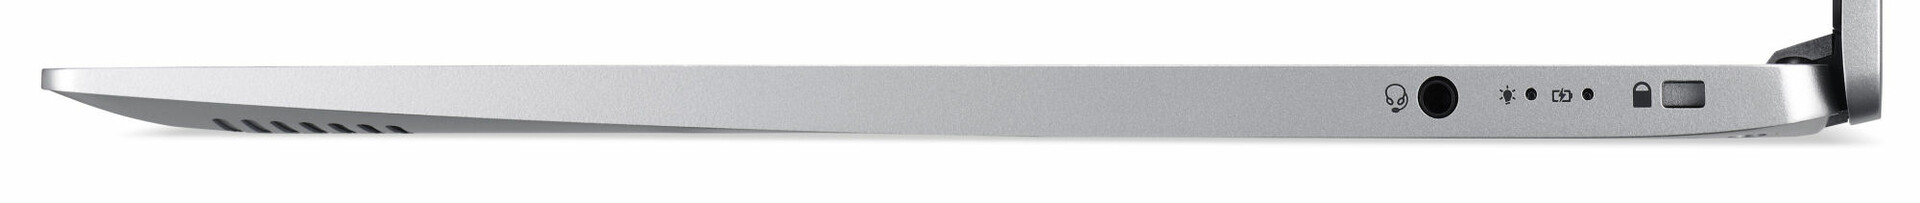
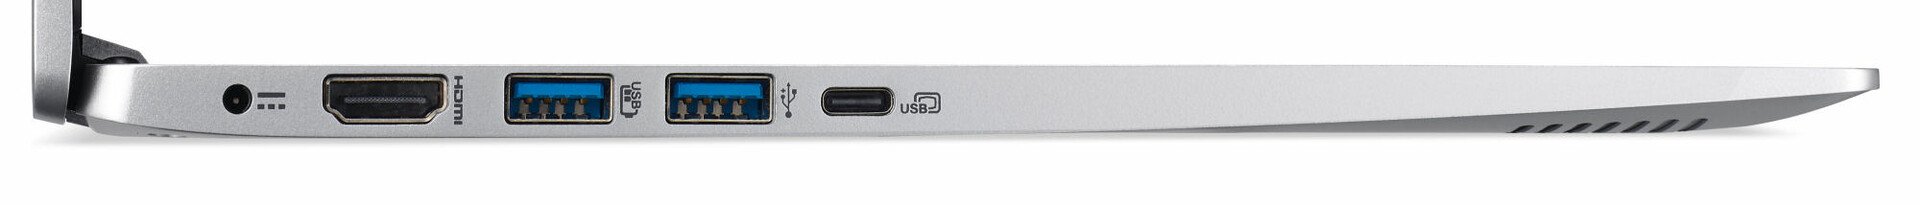
O Acer Swift 5 SF515-51T compete com o LG Gram 15Z980. O Acer é claramente o vencedor em termos de peso - o Gram, no entanto, oferece durações de bateria significativamente mais longas e uma melhor seleção de portas. Esses dois fatores podem inclinar a balança em favor do dispositivo LG para muitos compradores em potencial. Se a Acer conseguir manter o peso em futuras reencarnações do Swift 5 enquanto melhora a duração da bateria e a seleção de portas, as coisas poderiam ficar apertadas para o Gram.
Acer Swift 5 SF515-51T-76B6
- 02/11/2019 v6 (old)
Sascha Mölck
Price comparison
