Breve Análise do Portátil LG Gram 15Z980 (i7-8550U, Full-HD)

| SD Card Reader | |
| average JPG Copy Test (av. of 3 runs) | |
| Lenovo ThinkPad X1 Carbon 2018-20KGS03900 (Toshiba Exceria Pro M501) | |
| Média da turma Subnotebook (23.7 - 188, n=9, últimos 2 anos) | |
| LG Gram 15Z980-B.AA78B (Toshiba Exceria Pro M501 64BG) | |
| maximum AS SSD Seq Read Test (1GB) | |
| Lenovo ThinkPad X1 Carbon 2018-20KGS03900 (Toshiba Exceria Pro M501) | |
| Média da turma Subnotebook (24.9 - 195, n=8, últimos 2 anos) | |
| LG Gram 15Z980-B.AA78B (Toshiba Exceria Pro M501 64BG) | |
| |||||||||||||||||||||||||
iluminação: 84 %
iluminação com acumulador: 273 cd/m²
Contraste: 1091:1 (Preto: 0.32 cd/m²)
ΔE ColorChecker Calman: 3.1 | ∀{0.5-29.43 Ø4.72}
calibrated: 1.5
ΔE Greyscale Calman: 3.3 | ∀{0.09-98 Ø4.97}
98.2% sRGB (Calman 2D)
96.05% sRGB (Argyll 1.6.3 3D)
61.46% AdobeRGB 1998 (Argyll 1.6.3 3D)
66.3% AdobeRGB 1998 (Argyll 3D)
96.2% sRGB (Argyll 3D)
65.3% Display P3 (Argyll 3D)
Gamma: 2.16
CCT: 6973 K
| LG Gram 15Z980-B.AA78B LP156WF9-SPN1, , 1920x1080, 15.6" | Acer Swift 5 SF514-52T-59HY AU Optronics AUO203D, , 1920x1080, 14" | Asus Zenbook 3 Deluxe UX490UA AU Optronics AUO383D / B140HAN03.8, , 1920x1080, 14" | Lenovo ThinkPad X1 Carbon 2018-20KGS03900 B140QAN02.0, , 2560x1440, 14" | Asus ASUSPRO B9440UA-GV0100T AU Optronics AUO353D / B140HAN03.5, , 1920x1080, 14" | |
|---|---|---|---|---|---|
| Display | 5% | -10% | 30% | -4% | |
| Display P3 Coverage (%) | 65.3 | 69.7 7% | 58.7 -10% | 87.7 34% | 64 -2% |
| sRGB Coverage (%) | 96.2 | 97.1 1% | 86.9 -10% | 100 4% | 89.1 -7% |
| AdobeRGB 1998 Coverage (%) | 66.3 | 71 7% | 59.9 -10% | 99.9 51% | 65.2 -2% |
| Response Times | -3% | 6% | -59% | -36% | |
| Response Time Grey 50% / Grey 80% * (ms) | 34.3 ? | 37 ? -8% | 24 ? 30% | 59.2 ? -73% | 48.8 ? -42% |
| Response Time Black / White * (ms) | 23.7 ? | 23 ? 3% | 28 ? -18% | 34.4 ? -45% | 30.8 ? -30% |
| PWM Frequency (Hz) | |||||
| Screen | -21% | -7% | 30% | -44% | |
| Brightness middle (cd/m²) | 349 | 254 -27% | 337 -3% | 578 66% | 319 -9% |
| Brightness (cd/m²) | 331 | 231 -30% | 295 -11% | 533 61% | 294 -11% |
| Brightness Distribution (%) | 84 | 86 2% | 81 -4% | 84 0% | 87 4% |
| Black Level * (cd/m²) | 0.32 | 0.25 22% | 0.21 34% | 0.38 -19% | 0.26 19% |
| Contrast (:1) | 1091 | 1016 -7% | 1605 47% | 1521 39% | 1227 12% |
| Colorchecker dE 2000 * | 3.1 | 3.85 -24% | 4.89 -58% | 1.9 39% | 7.1 -129% |
| Colorchecker dE 2000 max. * | 6.6 | 7.05 -7% | 8.43 -28% | 3.8 42% | 13.7 -108% |
| Colorchecker dE 2000 calibrated * | 1.5 | 3.66 -144% | 0.8 47% | ||
| Greyscale dE 2000 * | 3.3 | 4.1 -24% | 4.28 -30% | 3 9% | 9.61 -191% |
| Gamma | 2.16 102% | 2.43 91% | 2.25 98% | 2.14 103% | 2.33 94% |
| CCT | 6973 93% | 7369 88% | 7352 88% | 6377 102% | 6021 108% |
| Color Space (Percent of AdobeRGB 1998) (%) | 61.46 | 63 3% | 56 -9% | 88.8 44% | 54.01 -12% |
| Color Space (Percent of sRGB) (%) | 96.05 | 97 1% | 87 -9% | 100 4% | 83.02 -14% |
| Média Total (Programa/Configurações) | -6% /
-14% | -4% /
-6% | 0% /
19% | -28% /
-35% |
* ... menor é melhor
Exibir tempos de resposta
| ↔ Tempo de resposta preto para branco | ||
|---|---|---|
| 23.7 ms ... ascensão ↗ e queda ↘ combinadas | ↗ 13.1 ms ascensão | 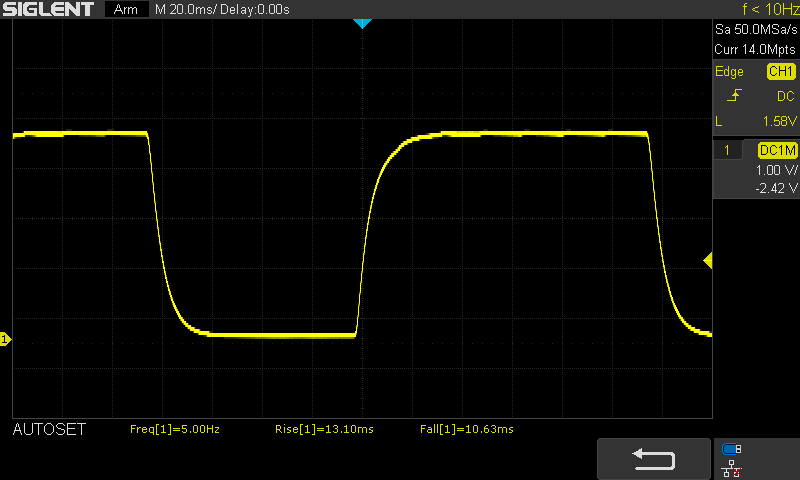 |
| ↘ 10.6 ms queda | ||
| A tela mostra boas taxas de resposta em nossos testes, mas pode ser muito lenta para jogadores competitivos. Em comparação, todos os dispositivos testados variam de 0.1 (mínimo) a 240 (máximo) ms. » 54 % de todos os dispositivos são melhores. Isso significa que o tempo de resposta medido é pior que a média de todos os dispositivos testados (19.8 ms). | ||
| ↔ Tempo de resposta 50% cinza a 80% cinza | ||
| 34.3 ms ... ascensão ↗ e queda ↘ combinadas | ↗ 16.4 ms ascensão | 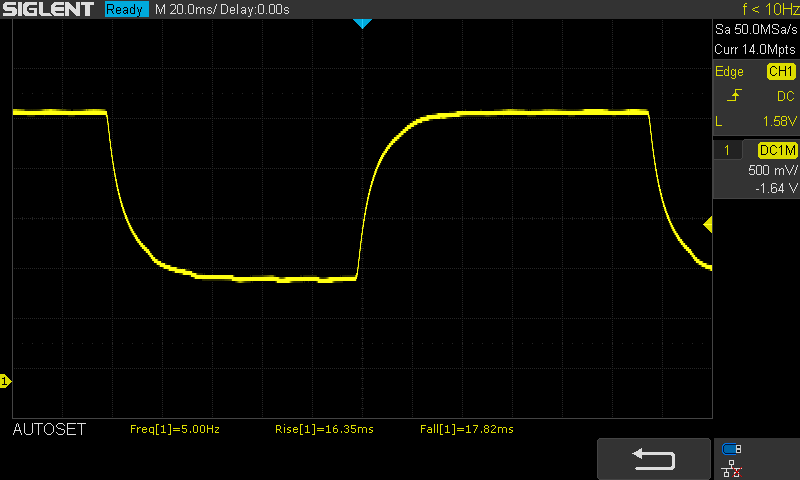 |
| ↘ 17.9 ms queda | ||
| A tela mostra taxas de resposta lentas em nossos testes e será insatisfatória para os jogadores. Em comparação, todos os dispositivos testados variam de 0.165 (mínimo) a 636 (máximo) ms. » 48 % de todos os dispositivos são melhores. Isso significa que o tempo de resposta medido é pior que a média de todos os dispositivos testados (31 ms). | ||
Cintilação da tela / PWM (modulação por largura de pulso)
| Tela tremeluzindo / PWM não detectado | 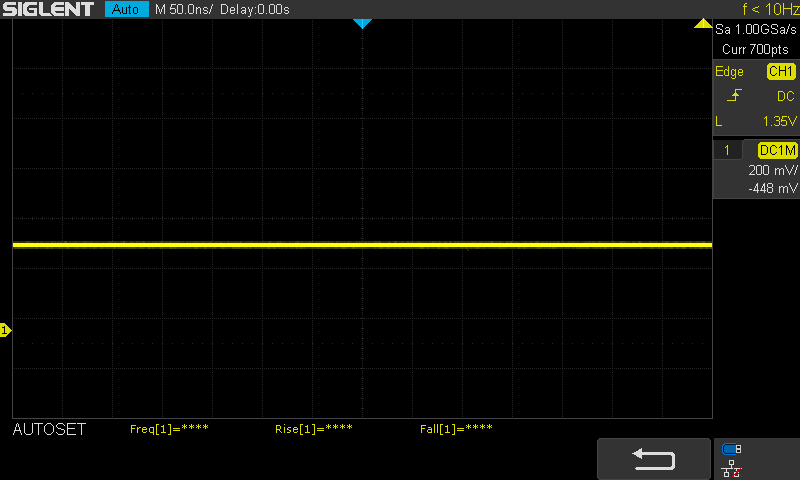 | ||
[pwm_comparison] Em comparação: 52 % de todos os dispositivos testados não usam PWM para escurecer a tela. Se PWM foi detectado, uma média de 7763 (mínimo: 5 - máximo: 343500) Hz foi medida. | |||
| PCMark 8 Home Score Accelerated v2 | 3255 pontos | |
| PCMark 8 Creative Score Accelerated v2 | 3515 pontos | |
| PCMark 8 Work Score Accelerated v2 | 3518 pontos | |
| PCMark 10 Score | 2733 pontos | |
Ajuda | ||
| LG Gram 15Z980-B.AA78B SK Hynix Canvas SC300 512GB M.2 (HFS512G39TNF) | Acer Swift 5 SF514-52T-59HY Intel SSD 600p SSDPEKKW256G7 | Asus Zenbook 3 Deluxe UX490UA Micron 1100 MTFDDAV256TBN | Lenovo ThinkPad X1 Carbon 2018-20KGS03900 Samsung SSD PM981 MZVLB512HAJQ | Asus ASUSPRO B9440UA-GV0100T Micron SSD 1100 (MTFDDAV256TBN) | Média SK Hynix Canvas SC300 512GB M.2 (HFS512G39TNF) | |
|---|---|---|---|---|---|---|
| CrystalDiskMark 3.0 | 38% | -2% | 160% | 2% | 0% | |
| Read Seq (MB/s) | 488.2 | 1113 128% | 435.3 -11% | 2327 377% | 462 -5% | 488 ? 0% |
| Write Seq (MB/s) | 446.7 | 597 34% | 413.3 -7% | 1808 305% | 441.4 -1% | 447 ? 0% |
| Read 512 (MB/s) | 367 | 642 75% | 325.9 -11% | 419.3 14% | 323.2 -12% | 367 ? 0% |
| Write 512 (MB/s) | 413.8 | 472.8 14% | 357 -14% | 1272 207% | 398.8 -4% | 414 ? 0% |
| Read 4k (MB/s) | 23.6 | 29.58 25% | 26.28 11% | 60.6 157% | 26.81 14% | 23.6 ? 0% |
| Write 4k (MB/s) | 71.1 | 89.2 25% | 85.6 20% | 132.9 87% | 87.8 23% | 71.1 ? 0% |
| Read 4k QD32 (MB/s) | 251.5 | 289.5 15% | 246.7 -2% | 340.7 35% | 247.3 -2% | 252 ? 0% |
| Write 4k QD32 (MB/s) | 224.2 | 203.3 -9% | 224.4 0% | 439.7 96% | 232.1 4% | 224 ? 0% |

| 3DMark 06 Standard Score | 11397 pontos | |
| 3DMark Cloud Gate Standard Score | 8533 pontos | |
| 3DMark Fire Strike Score | 1168 pontos | |
| 3DMark Time Spy Score | 427 pontos | |
Ajuda | ||
| Final Fantasy XV Benchmark - 1280x720 Lite Quality | |
| Média da turma Subnotebook (21.4 - 129.8, n=54, últimos 2 anos) | |
| Apple MacBook Pro 13 2018 Touchbar i5 | |
| Média Intel UHD Graphics 620 (5.61 - 14.7, n=14) | |
| LG Gram 15Z980-B.AA78B | |
| HP Spectre 13-af033ng | |
| Dell Latitude 7390 | |
| Unigine Valley 1.0 | |
| 1920x1080 Extreme HD DirectX AA:x8 | |
| Média da turma Subnotebook (4.1 - 31.5, n=6, últimos 2 anos) | |
| LG Gram 15Z980-B.AA78B | |
| Acer Spin 5 SP513-52N-566U | |
| Média Intel UHD Graphics 620 (3.9 - 5.5, n=3) | |
| Dell XPS 13 9360 QHD+ i5 | |
| Dell XPS 13 9360 QHD+ i7 | |
| 1920x1080 Extreme HD Preset OpenGL AA:x8 | |
| Média da turma Subnotebook (4.7 - 26.2, n=6, últimos 2 anos) | |
| Apple MacBook Pro 13 2018 Touchbar i5 | |
| baixo | média | alto | ultra | |
|---|---|---|---|---|
| Final Fantasy XV Benchmark (2018) | 10.2 |
Barulho
| Ocioso |
| 30.3 / 30.3 / 31.1 dB |
| Carga |
| 34.9 / 34.9 dB |
 | ||
30 dB silencioso 40 dB(A) audível 50 dB(A) ruidosamente alto |
||
min: | ||
(±) A temperatura máxima no lado superior é 43 °C / 109 F, em comparação com a média de 35.9 °C / 97 F , variando de 21.4 a 59 °C para a classe Subnotebook.
(±) A parte inferior aquece até um máximo de 41 °C / 106 F, em comparação com a média de 39.2 °C / 103 F
(+) Em uso inativo, a temperatura média para o lado superior é 26.4 °C / 80 F, em comparação com a média do dispositivo de 30.8 °C / ### class_avg_f### F.
(+) Os apoios para as mãos e o touchpad são mais frios que a temperatura da pele, com um máximo de 28 °C / 82.4 F e, portanto, são frios ao toque.
(±) A temperatura média da área do apoio para as mãos de dispositivos semelhantes foi 28.2 °C / 82.8 F (+0.2 °C / 0.4 F).
LG Gram 15Z980-B.AA78B análise de áudio
(+) | os alto-falantes podem tocar relativamente alto (###valor### dB)
Graves 100 - 315Hz
(-) | quase nenhum baixo - em média 24.1% menor que a mediana
(±) | a linearidade dos graves é média (12.3% delta para a frequência anterior)
Médios 400 - 2.000 Hz
(±) | médios mais altos - em média 5.4% maior que a mediana
(+) | médios são lineares (6.5% delta para frequência anterior)
Altos 2 - 16 kHz
(+) | agudos equilibrados - apenas 1.1% longe da mediana
(+) | os máximos são lineares (3.7% delta da frequência anterior)
Geral 100 - 16.000 Hz
(±) | a linearidade do som geral é média (19.3% diferença em relação à mediana)
Comparado com a mesma classe
» 59% de todos os dispositivos testados nesta classe foram melhores, 7% semelhantes, 34% piores
» O melhor teve um delta de 5%, a média foi 18%, o pior foi 53%
Comparado com todos os dispositivos testados
» 47% de todos os dispositivos testados foram melhores, 8% semelhantes, 46% piores
» O melhor teve um delta de 4%, a média foi 23%, o pior foi 134%
Apple MacBook 12 (Early 2016) 1.1 GHz análise de áudio
(+) | os alto-falantes podem tocar relativamente alto (###valor### dB)
Graves 100 - 315Hz
(±) | graves reduzidos - em média 11.3% menor que a mediana
(±) | a linearidade dos graves é média (14.2% delta para a frequência anterior)
Médios 400 - 2.000 Hz
(+) | médios equilibrados - apenas 2.4% longe da mediana
(+) | médios são lineares (5.5% delta para frequência anterior)
Altos 2 - 16 kHz
(+) | agudos equilibrados - apenas 2% longe da mediana
(+) | os máximos são lineares (4.5% delta da frequência anterior)
Geral 100 - 16.000 Hz
(+) | o som geral é linear (10.2% diferença em relação à mediana)
Comparado com a mesma classe
» 7% de todos os dispositivos testados nesta classe foram melhores, 2% semelhantes, 91% piores
» O melhor teve um delta de 5%, a média foi 18%, o pior foi 53%
Comparado com todos os dispositivos testados
» 5% de todos os dispositivos testados foram melhores, 1% semelhantes, 94% piores
» O melhor teve um delta de 4%, a média foi 23%, o pior foi 134%
Acer Swift 5 SF514-52T-59HY análise de áudio
(-) | alto-falantes não muito altos (###valor### dB)
Graves 100 - 315Hz
(±) | graves reduzidos - em média 7.7% menor que a mediana
(+) | o baixo é linear (6.4% delta para a frequência anterior)
Médios 400 - 2.000 Hz
(±) | médios mais altos - em média 5.5% maior que a mediana
(+) | médios são lineares (6.8% delta para frequência anterior)
Altos 2 - 16 kHz
(+) | agudos equilibrados - apenas 2.7% longe da mediana
(+) | os máximos são lineares (6.5% delta da frequência anterior)
Geral 100 - 16.000 Hz
(±) | a linearidade do som geral é média (18.9% diferença em relação à mediana)
Comparado com a mesma classe
» 57% de todos os dispositivos testados nesta classe foram melhores, 6% semelhantes, 36% piores
» O melhor teve um delta de 5%, a média foi 18%, o pior foi 53%
Comparado com todos os dispositivos testados
» 44% de todos os dispositivos testados foram melhores, 8% semelhantes, 48% piores
» O melhor teve um delta de 4%, a média foi 23%, o pior foi 134%
| desligado | |
| Ocioso | |
| Carga |
|
Key:
min: | |
| LG Gram 15Z980-B.AA78B i5-8550U, UHD Graphics 620, SK Hynix Canvas SC300 512GB M.2 (HFS512G39TNF), IPS LED, 1920x1080, 15.6" | Acer Swift 5 SF514-52T-59HY i5-8250U, UHD Graphics 620, Intel SSD 600p SSDPEKKW256G7, IPS, 1920x1080, 14" | Asus Zenbook 3 Deluxe UX490UA i5-7200U, HD Graphics 620, Micron 1100 MTFDDAV256TBN, IPS, 1920x1080, 14" | Lenovo ThinkPad X1 Carbon 2018-20KGS03900 i5-8550U, UHD Graphics 620, Samsung SSD PM981 MZVLB512HAJQ, IPS, 2560x1440, 14" | Asus ASUSPRO B9440UA-GV0100T i5-7200U, HD Graphics 620, Micron SSD 1100 (MTFDDAV256TBN), IPS, 1920x1080, 14" | Dell XPS 13 9360 QHD+ i7 i7-7500U, HD Graphics 620, Toshiba NVMe THNSN5256GPUK, IPS, 3200x1800, 13.3" | Média Intel UHD Graphics 620 | Média da turma Subnotebook | |
|---|---|---|---|---|---|---|---|---|
| Power Consumption | 40% | 25% | -13% | 22% | 8% | 6% | -1% | |
| Idle Minimum * (Watt) | 3.7 | 2.8 24% | 3.3 11% | 3.8 -3% | 3.1 16% | 6.4 -73% | 3.81 ? -3% | 3.78 ? -2% |
| Idle Average * (Watt) | 8.5 | 4.8 44% | 6.1 28% | 8.9 -5% | 6.1 28% | 6.6 22% | 6.94 ? 18% | 6.57 ? 23% |
| Idle Maximum * (Watt) | 10 | 6.3 37% | 10.1 -1% | 11.9 -19% | 6.8 32% | 6.8 32% | 8.75 ? 12% | 7.94 ? 21% |
| Load Average * (Watt) | 36 | 21 42% | 24.6 32% | 47.5 -32% | 27.4 24% | 27.5 24% | 35 ? 3% | 41.9 ? -16% |
| Load Maximum * (Watt) | 48.7 | 23 53% | 22 55% | 52.5 -8% | 43.7 10% | 32.4 33% | 47.5 ? 2% | 64.4 ? -32% |
* ... menor é melhor
| LG Gram 15Z980-B.AA78B i5-8550U, UHD Graphics 620, 72 Wh | Acer Swift 5 SF514-52T-59HY i5-8250U, UHD Graphics 620, 36 Wh | Asus Zenbook 3 Deluxe UX490UA i5-7200U, HD Graphics 620, 46 Wh | Lenovo ThinkPad X1 Carbon 2018-20KGS03900 i5-8550U, UHD Graphics 620, 57 Wh | Asus ASUSPRO B9440UA-GV0100T i5-7200U, HD Graphics 620, 48 Wh | Apple MacBook Pro 13 2018 Touchbar i5 i5-8259U, Iris Plus Graphics 655, 58 Wh | Média da turma Subnotebook | |
|---|---|---|---|---|---|---|---|
| Duração da bateria | -56% | -30% | -38% | -34% | -30% | 1% | |
| H.264 (h) | 15.8 | 7.8 -51% | 9.4 -41% | 10.9 -31% | 15.4 ? -3% | ||
| WiFi v1.3 (h) | 13.4 | 5.2 -61% | 9.4 -30% | 8.7 -35% | 8.9 -34% | 9.7 -28% | 14 ? 4% |
| Witcher 3 ultra (h) | 1.6 |
Pro
Contra
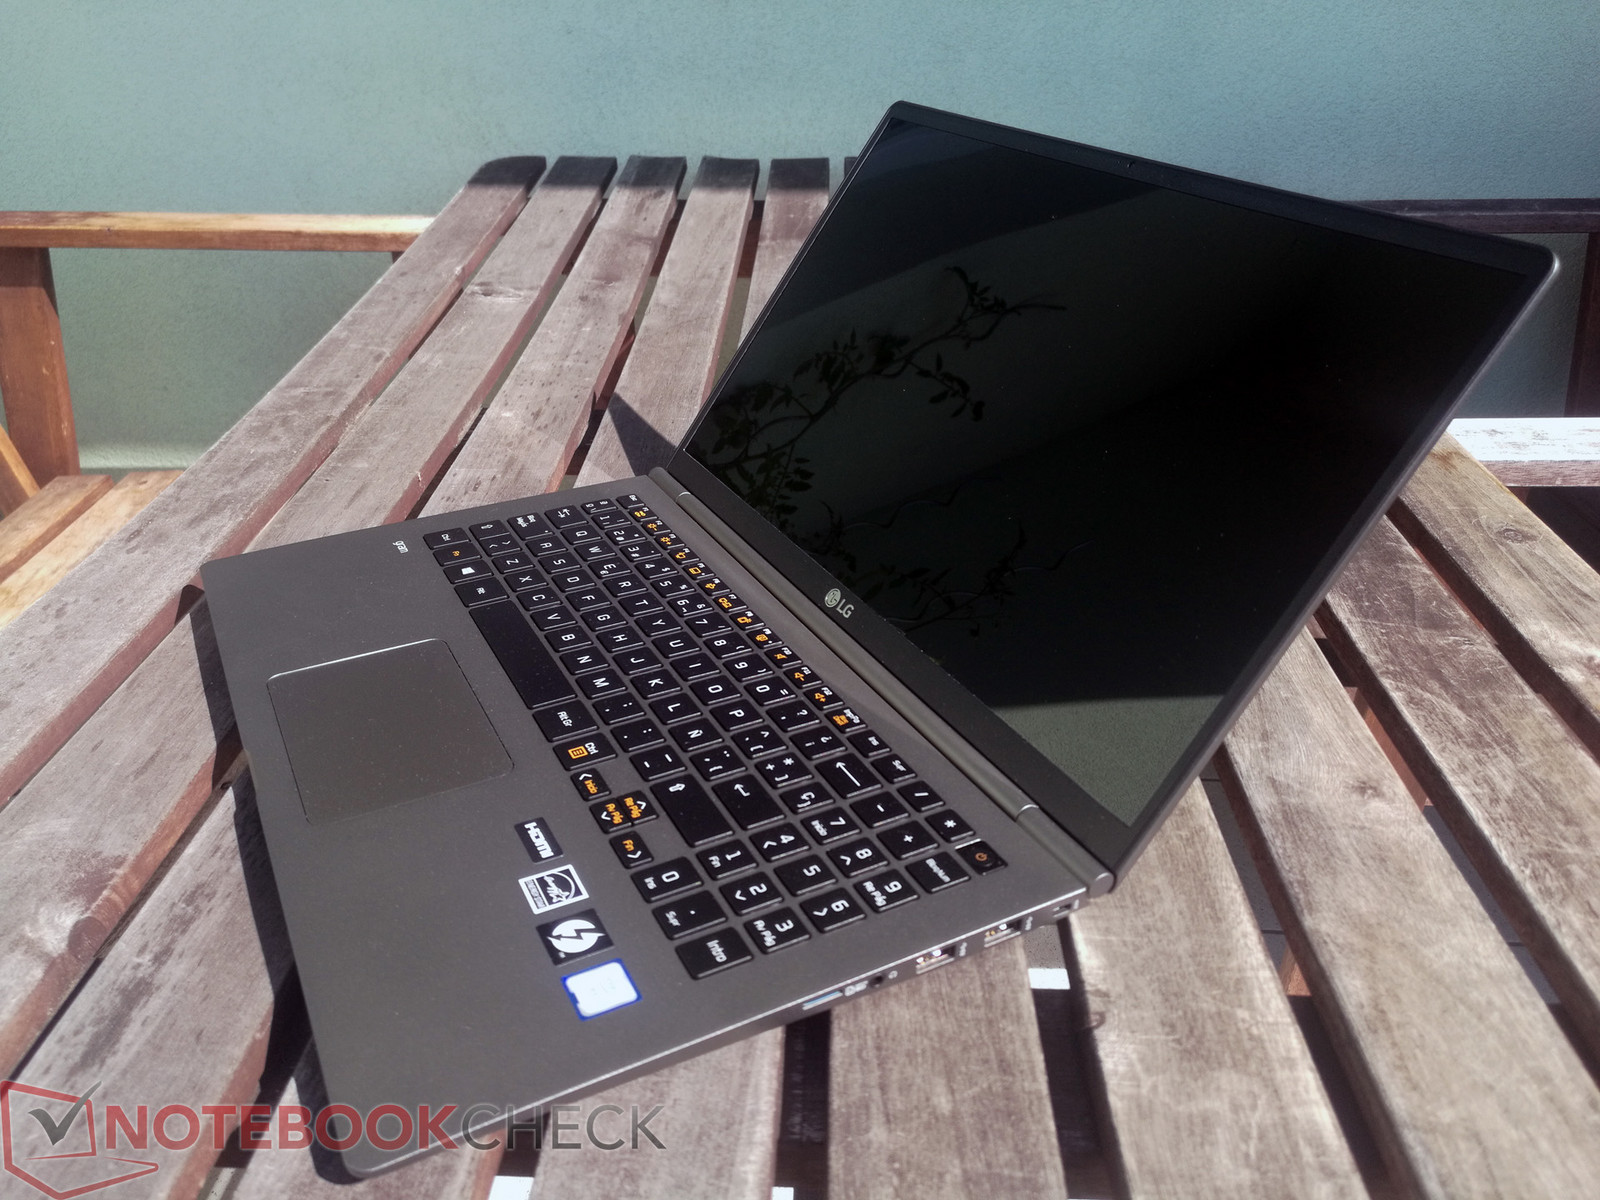
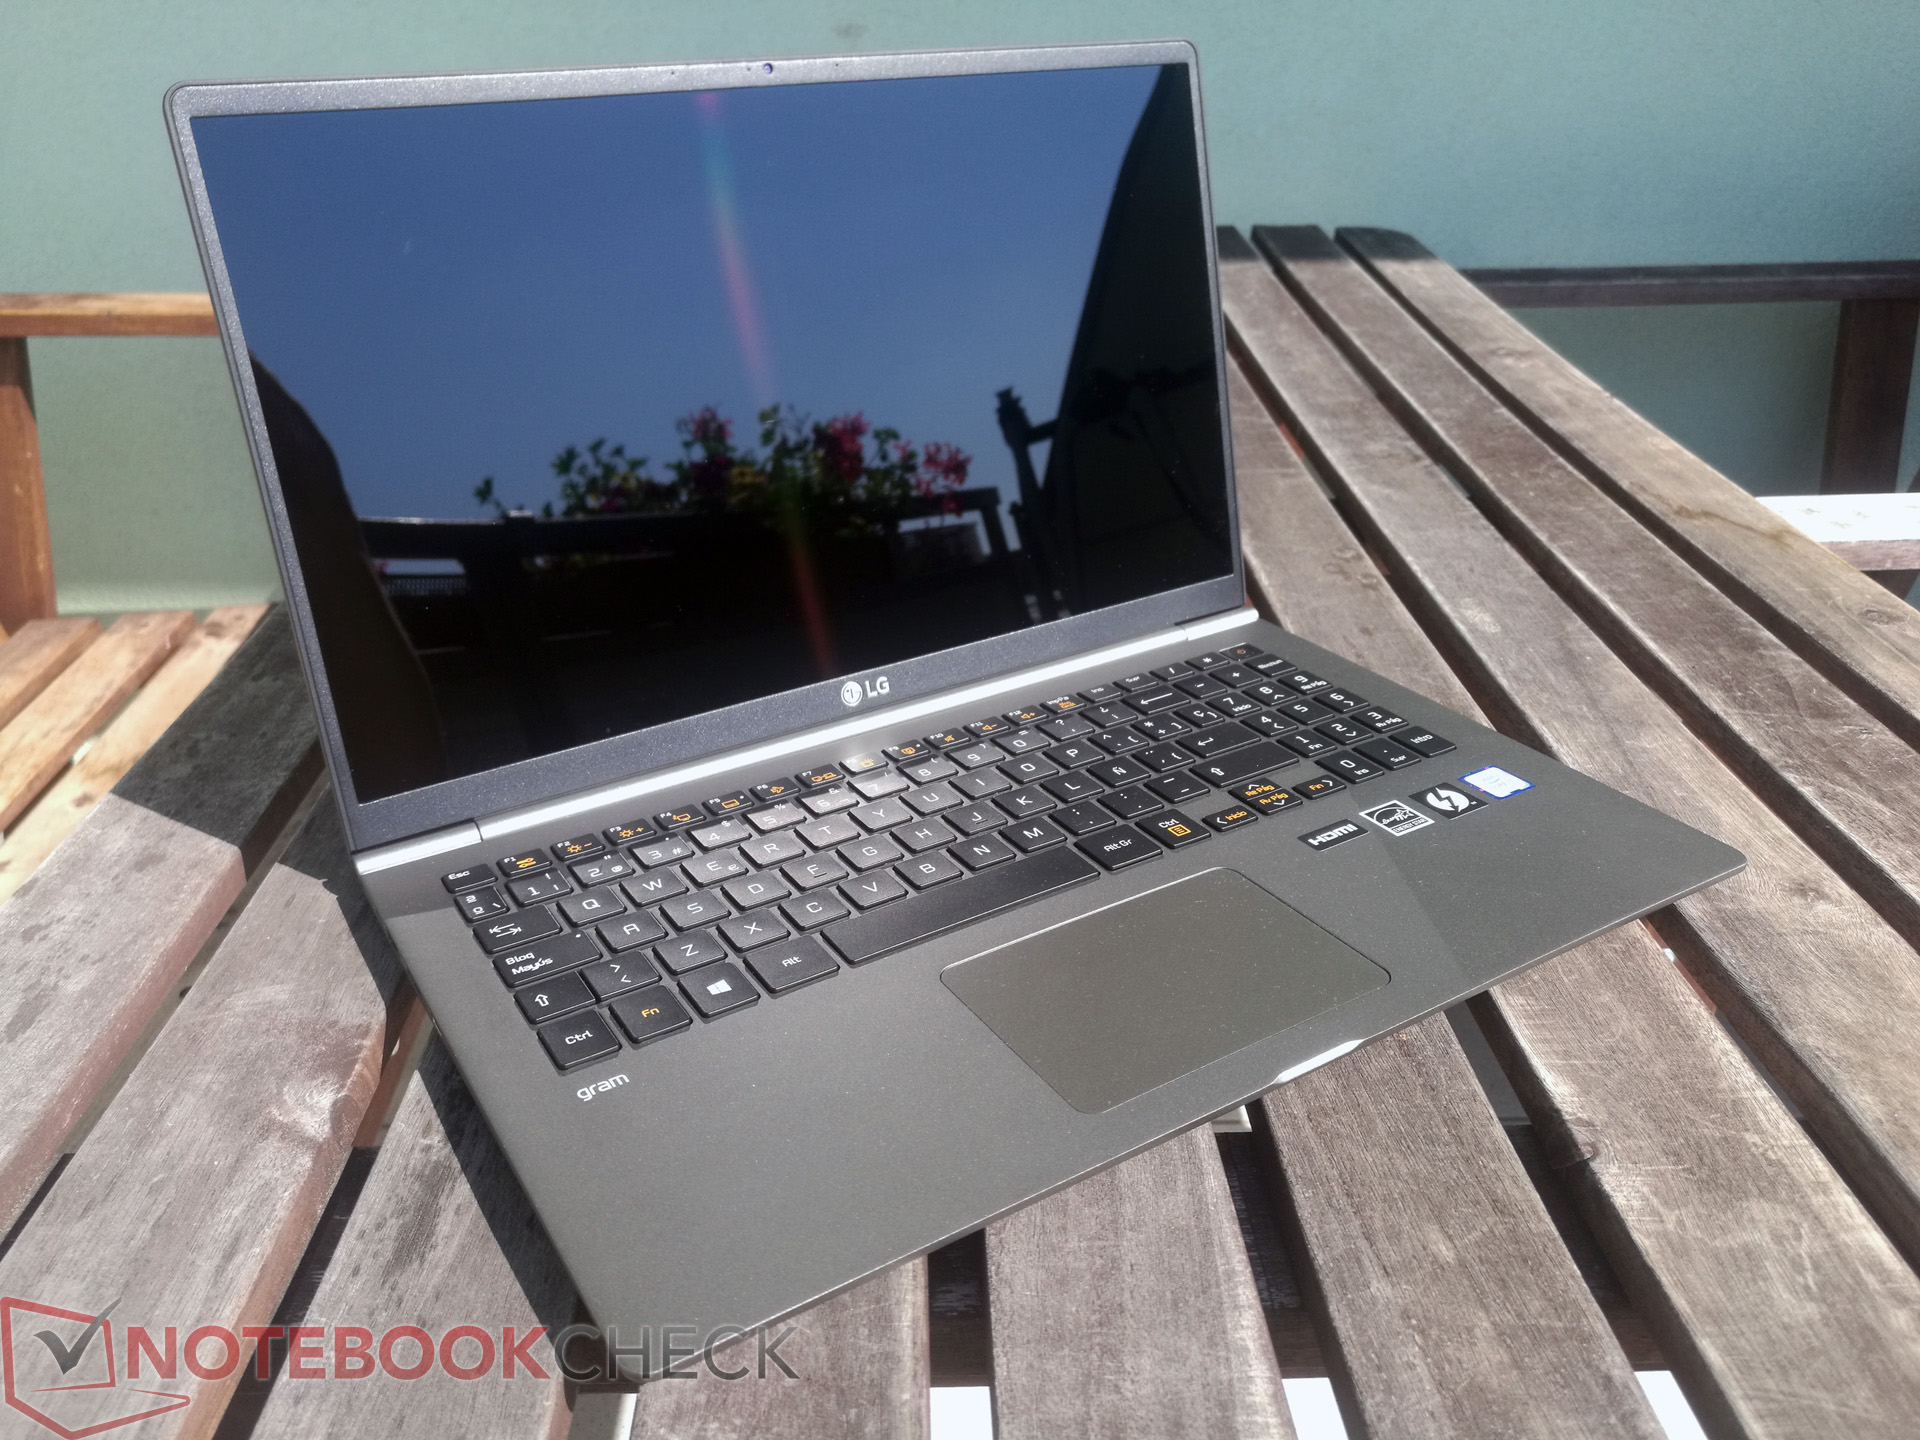
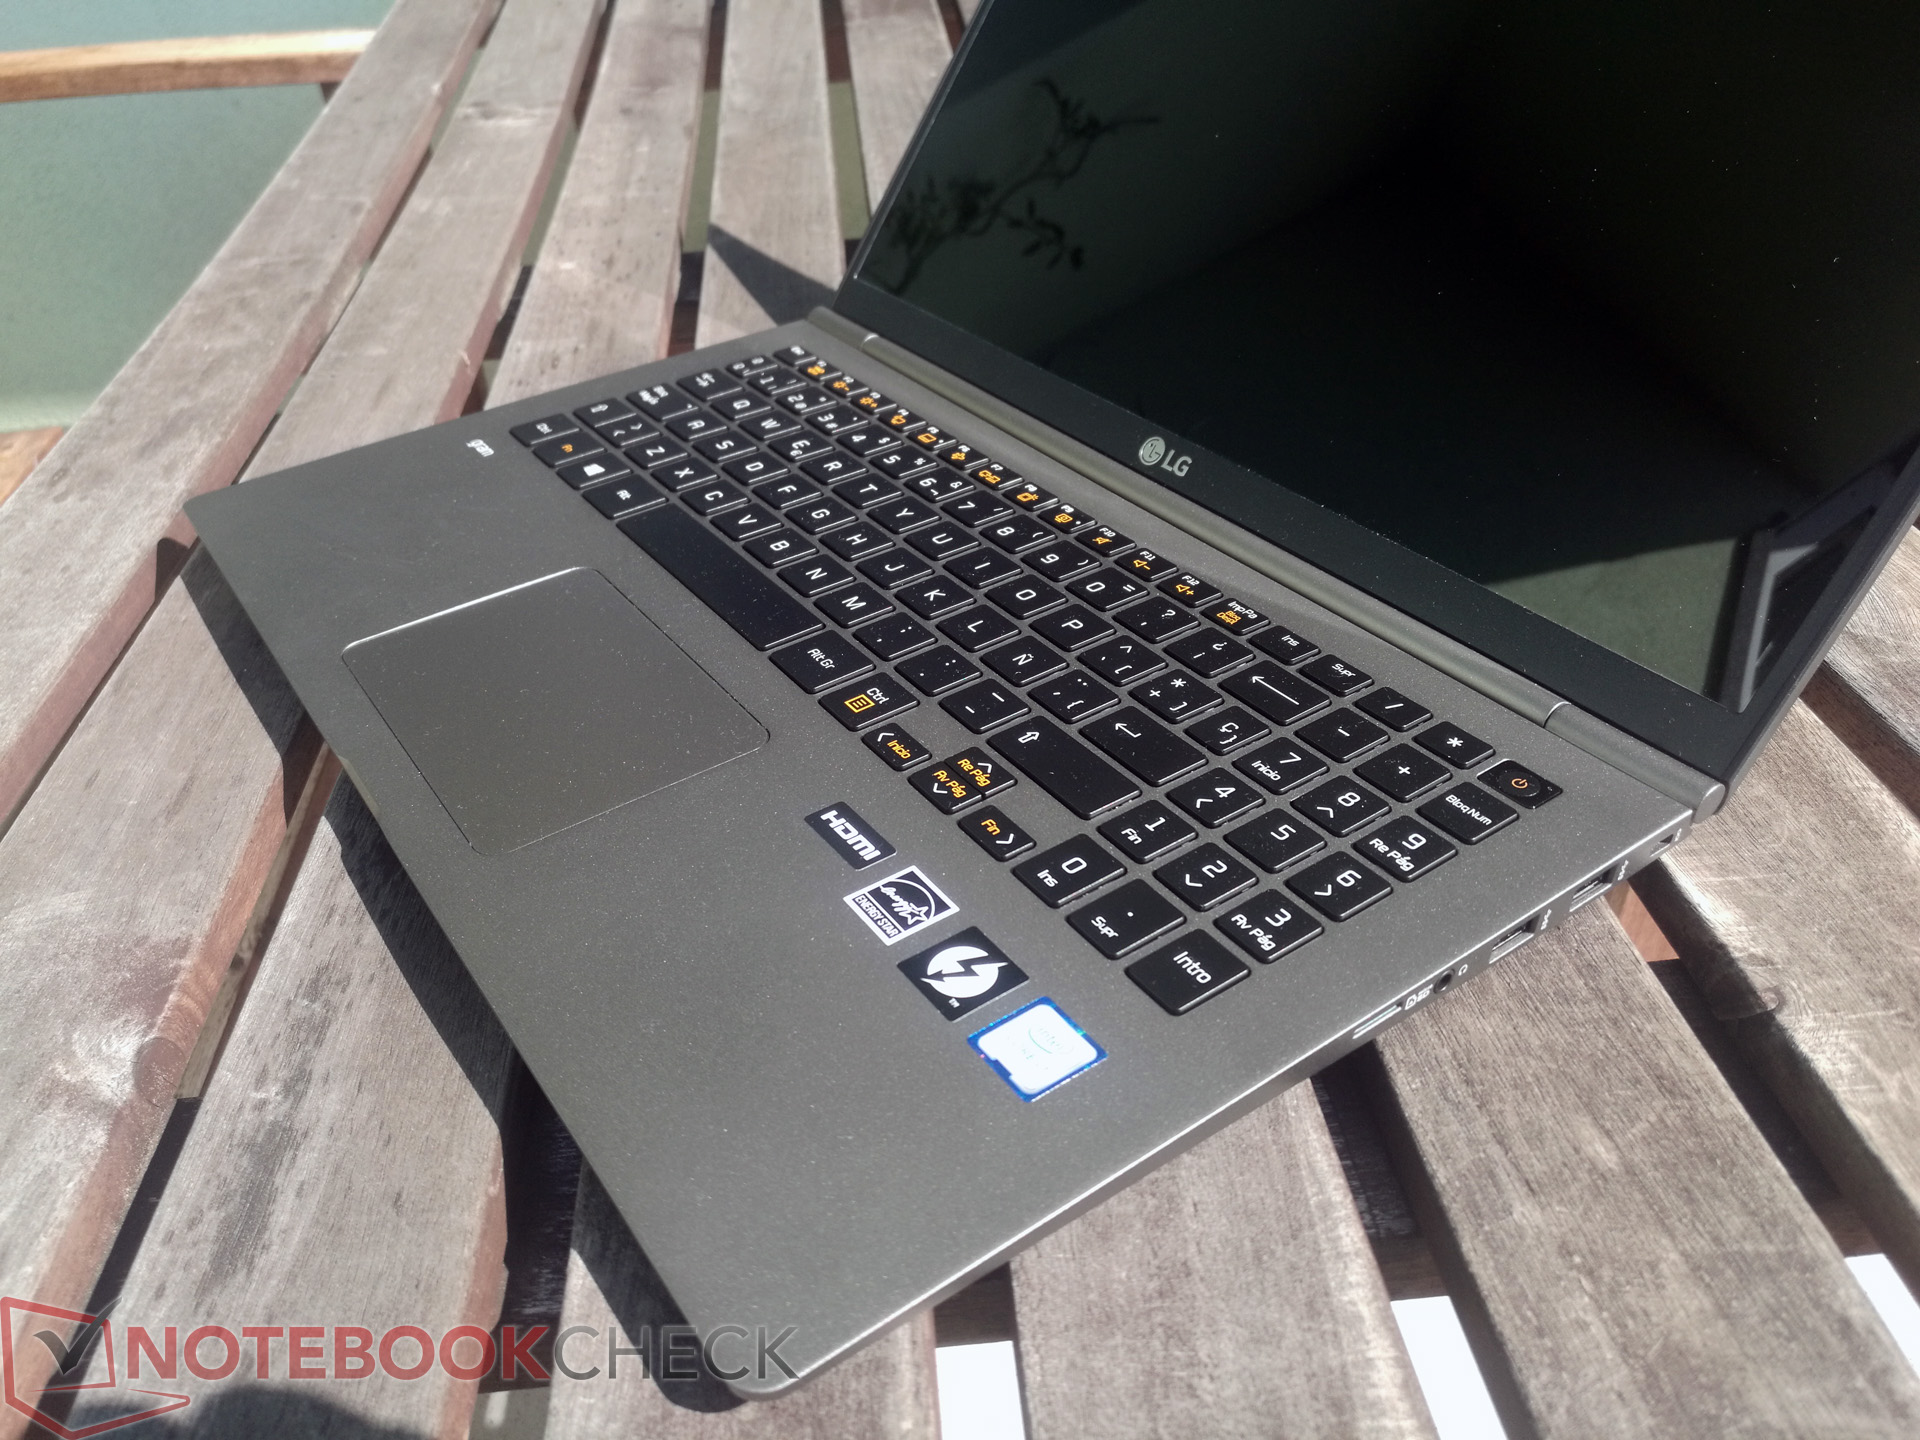
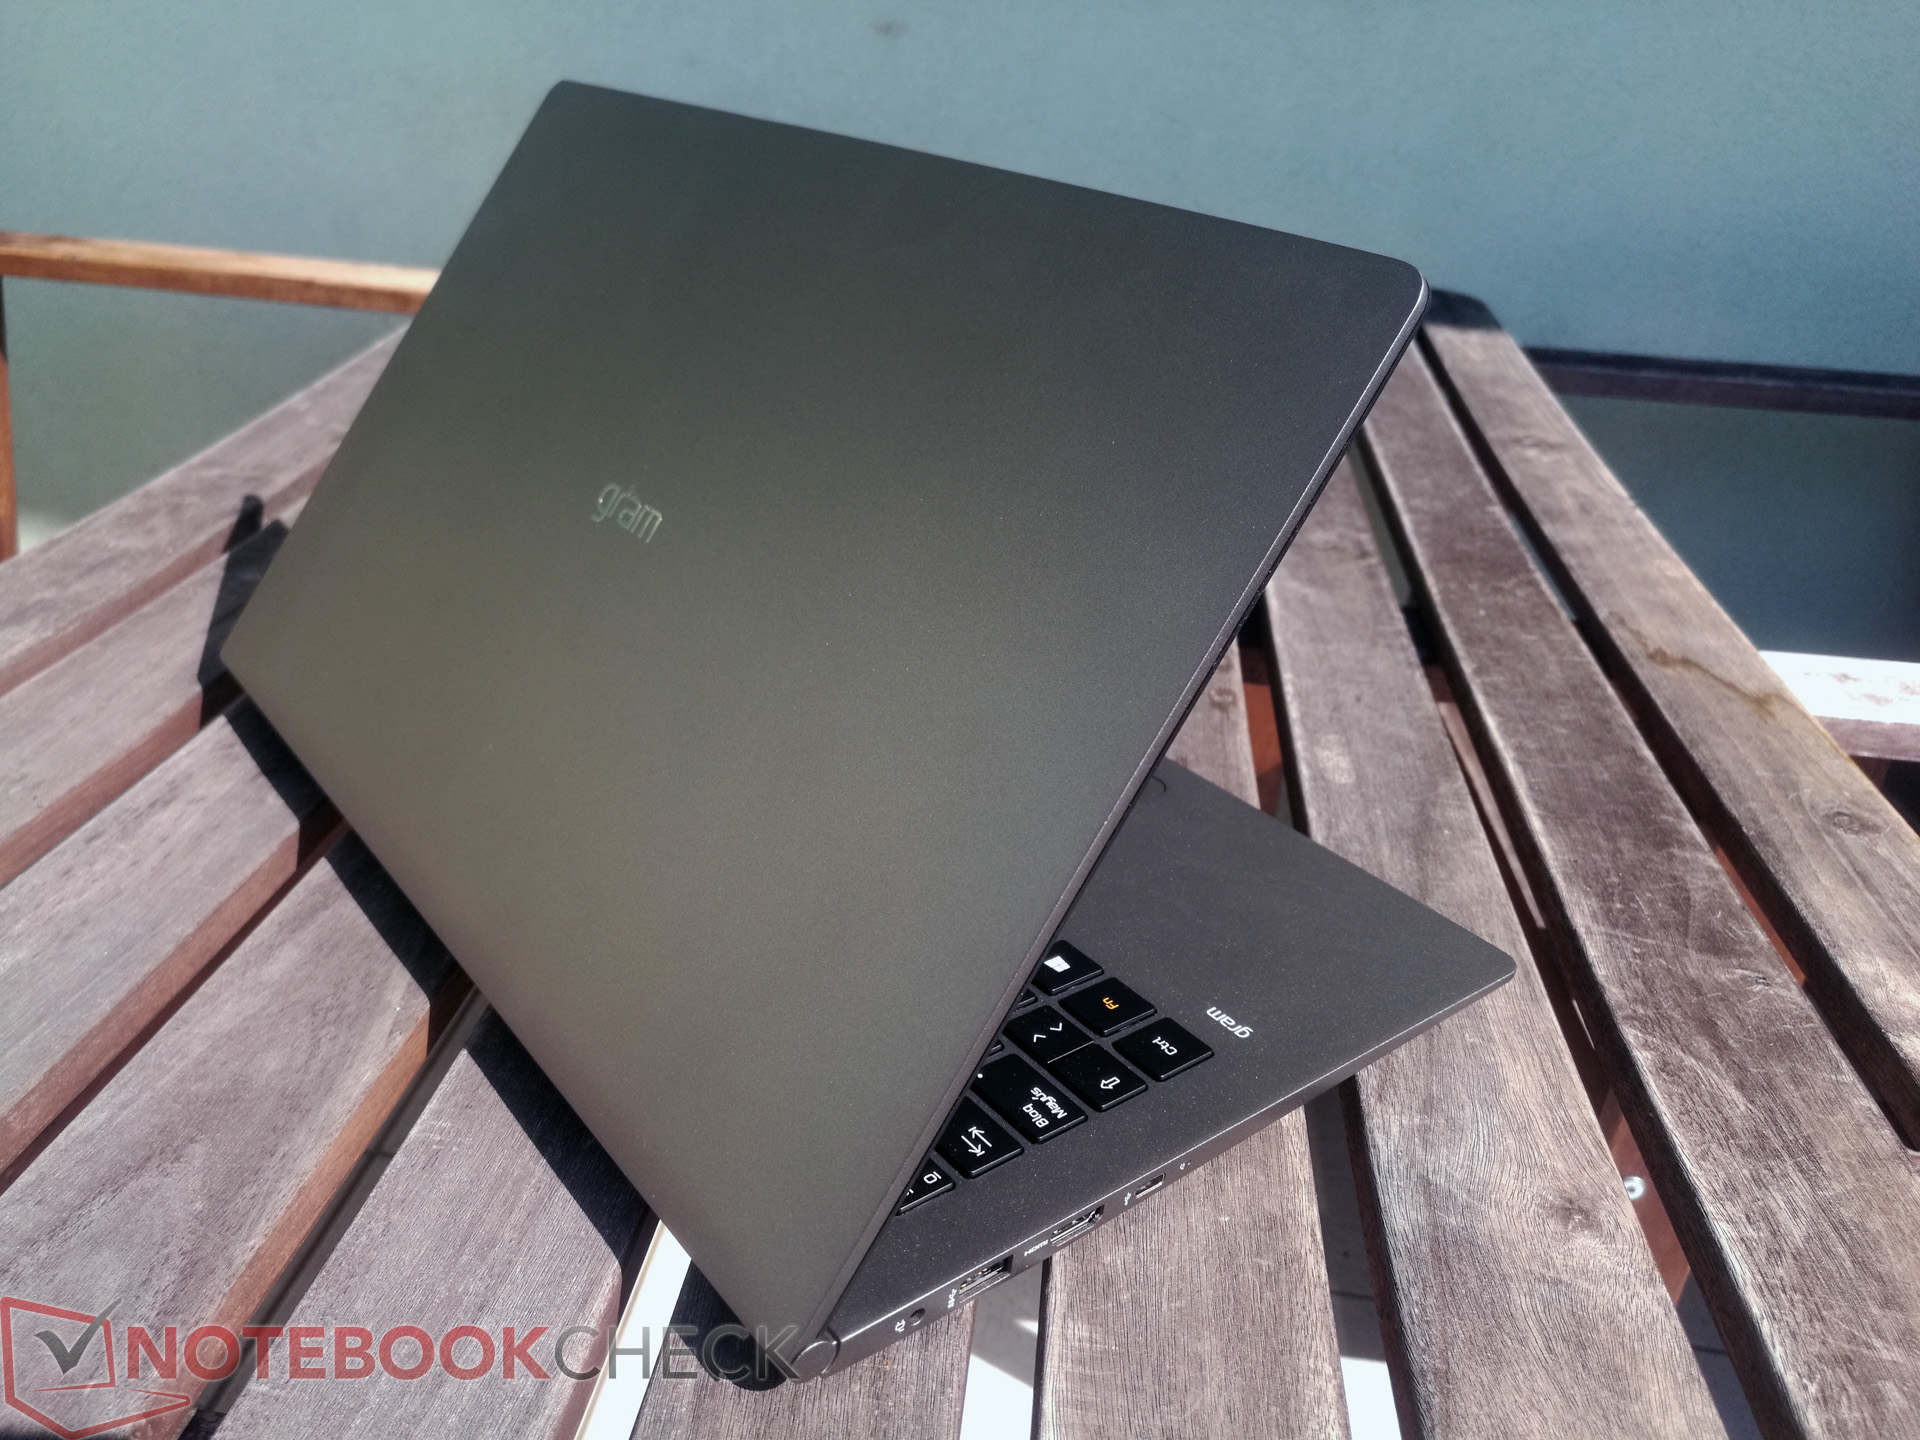
O LG Gram 15Z980 é incomparável para a coroa de portáteis finos e leves de 15 polegadas. Existem compromissos que vêm com este dispositivo de 1,1 kg (~2,4 lbs). Em geral, gostamos da abordagem da LG para tornar o dispositivo mais leve, mas não tornando o dispositivo mais fino em consequência.
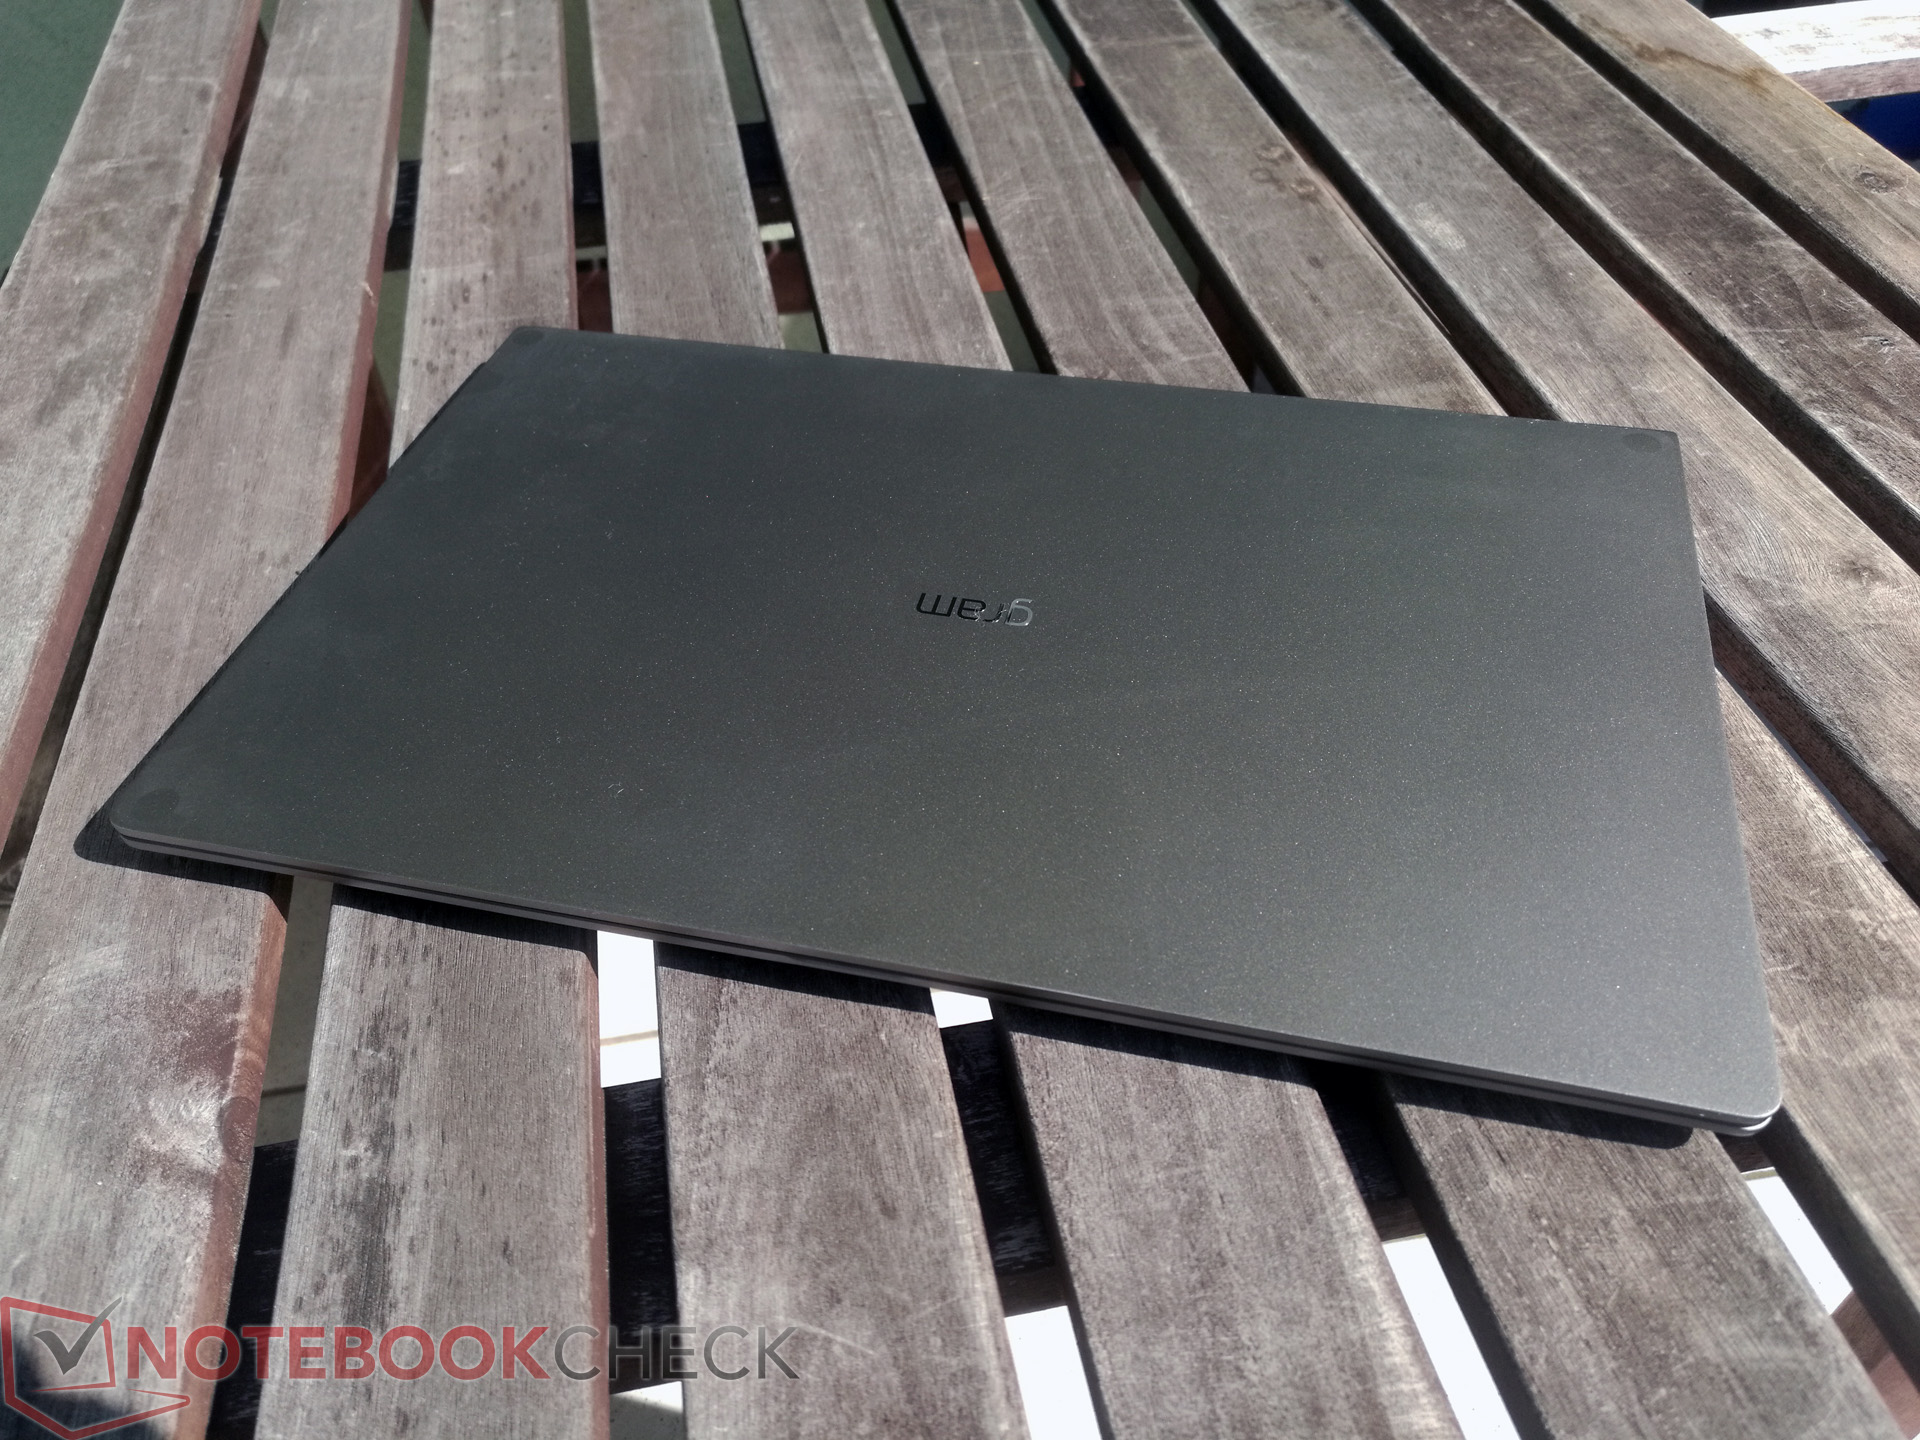
A carcaça de liga de magnésio parece premium, mas é suscetível a pressão e torção. A combinação do material e o baixo peso faz com que o dispositivo pareça frágil. No entanto, os testes de resistência e certificação MIL-STD-810G dos populares canais do YouTube ajudam a combater essa impressão.
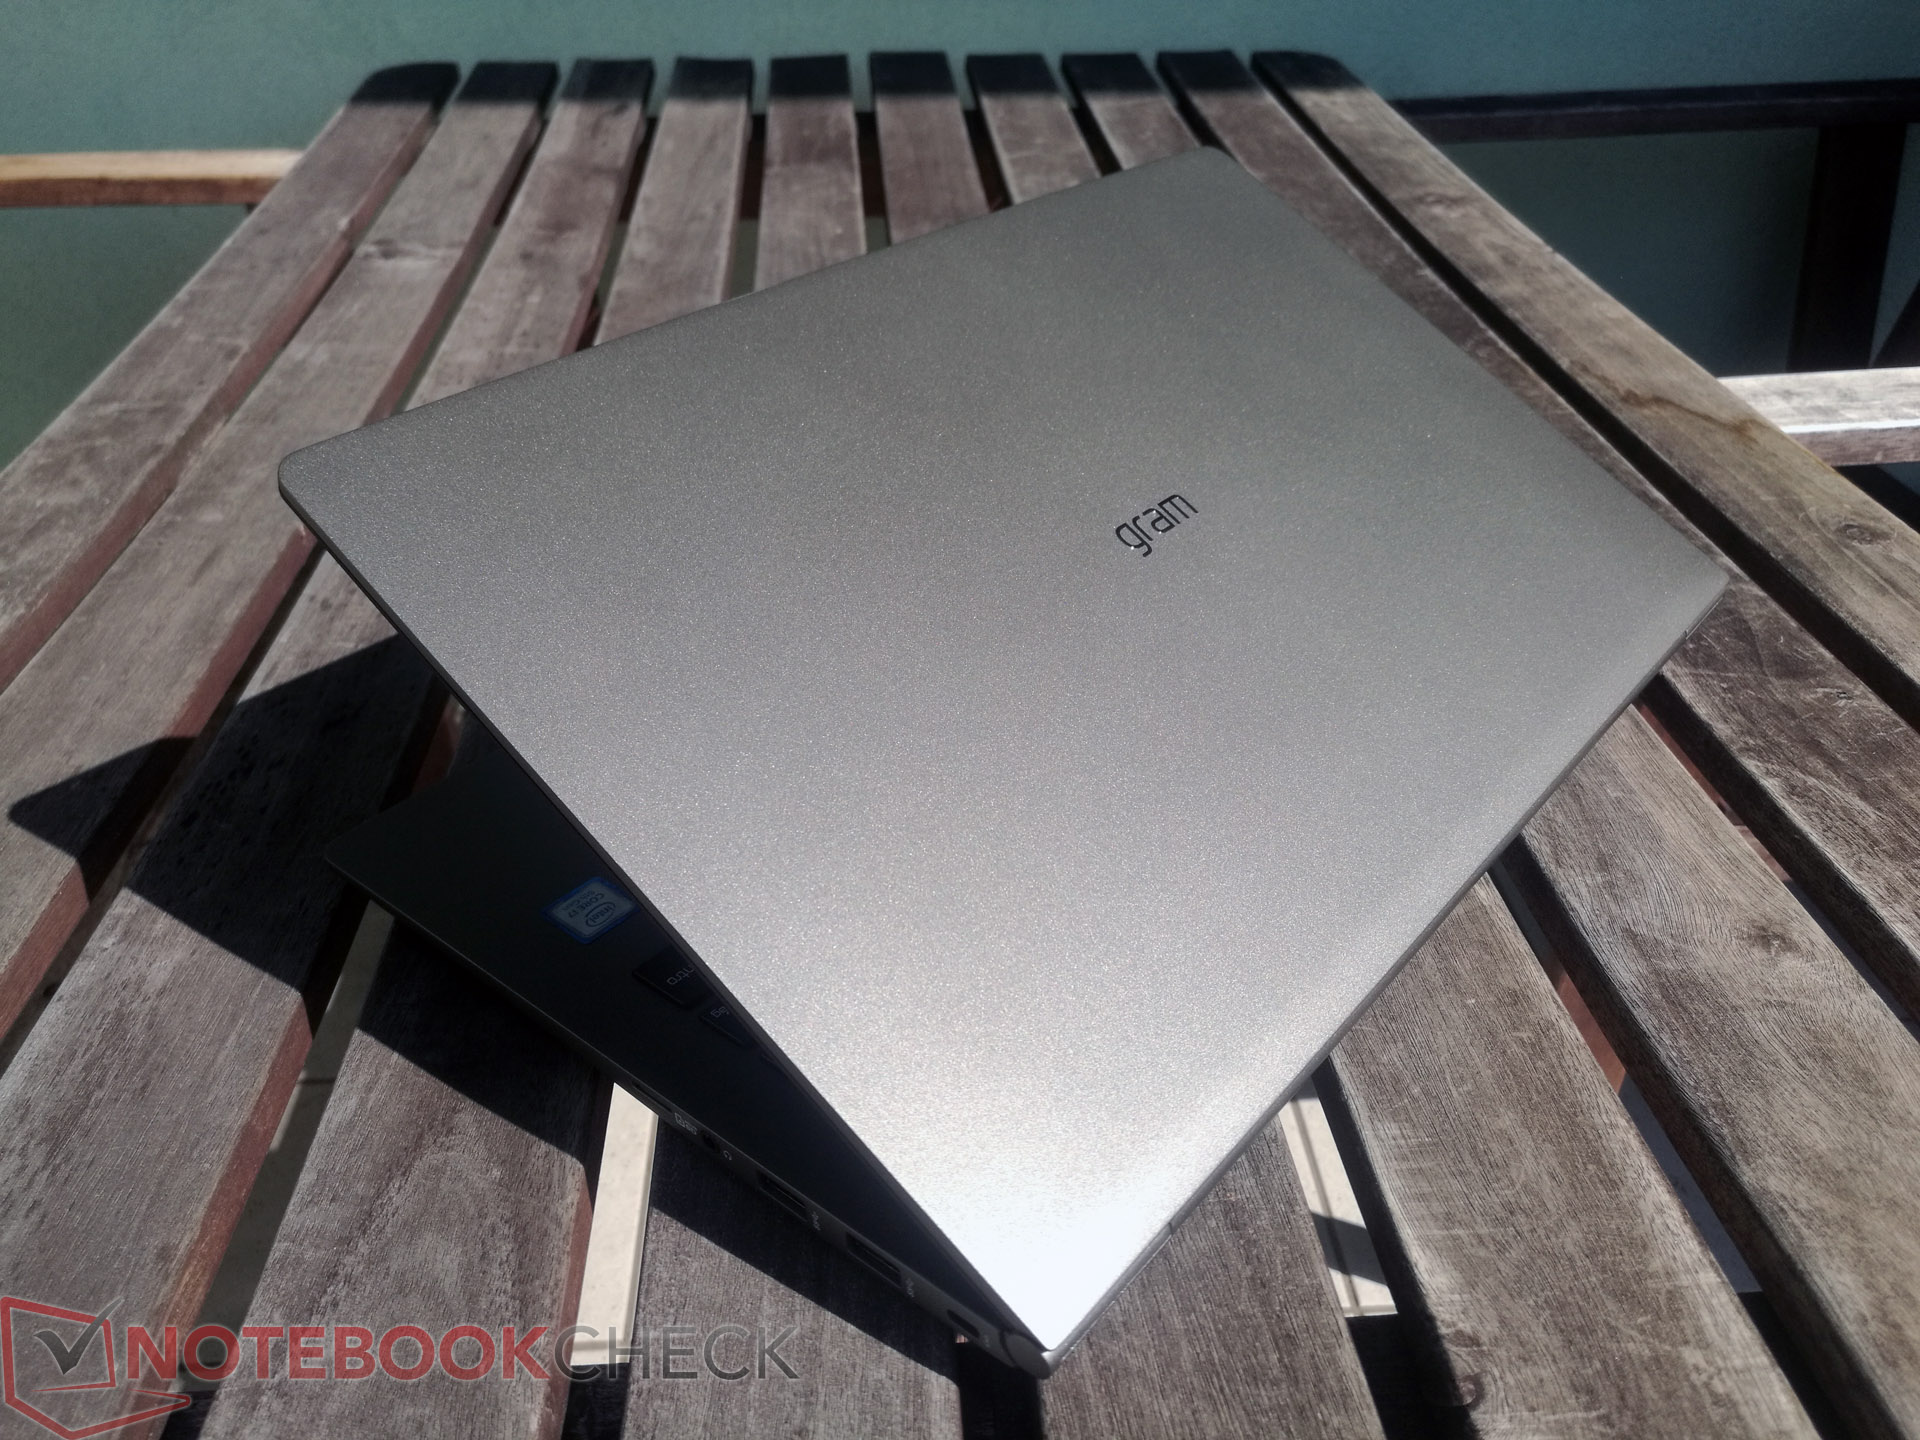
No geral, o LG Gram 15Z980 é um impressionante cavalo de batalha ultra-móvel que é extremamente leve e oferece ótima duração da bateria. É uma pena que a LG não ofereça o dispositivo em mais mercados.
Além disso, o 15Z980 não consegue fazer uso pleno da sua CPU Core i7-8550U. O nosso dispositivo de teste apenas correspondia aos concorrentes com Core i5-8250U em benchmarks. Além disso, a LG equipou nosso dispositivo de teste com um SSD SATA III lento que não pode competir com unidades NVMe muito mais rápidas. Infelizmente, o dispositivo aceita apenas o padrão SATA III mais lento. Um belo toque é o segundo M.2-2280, caso precise.
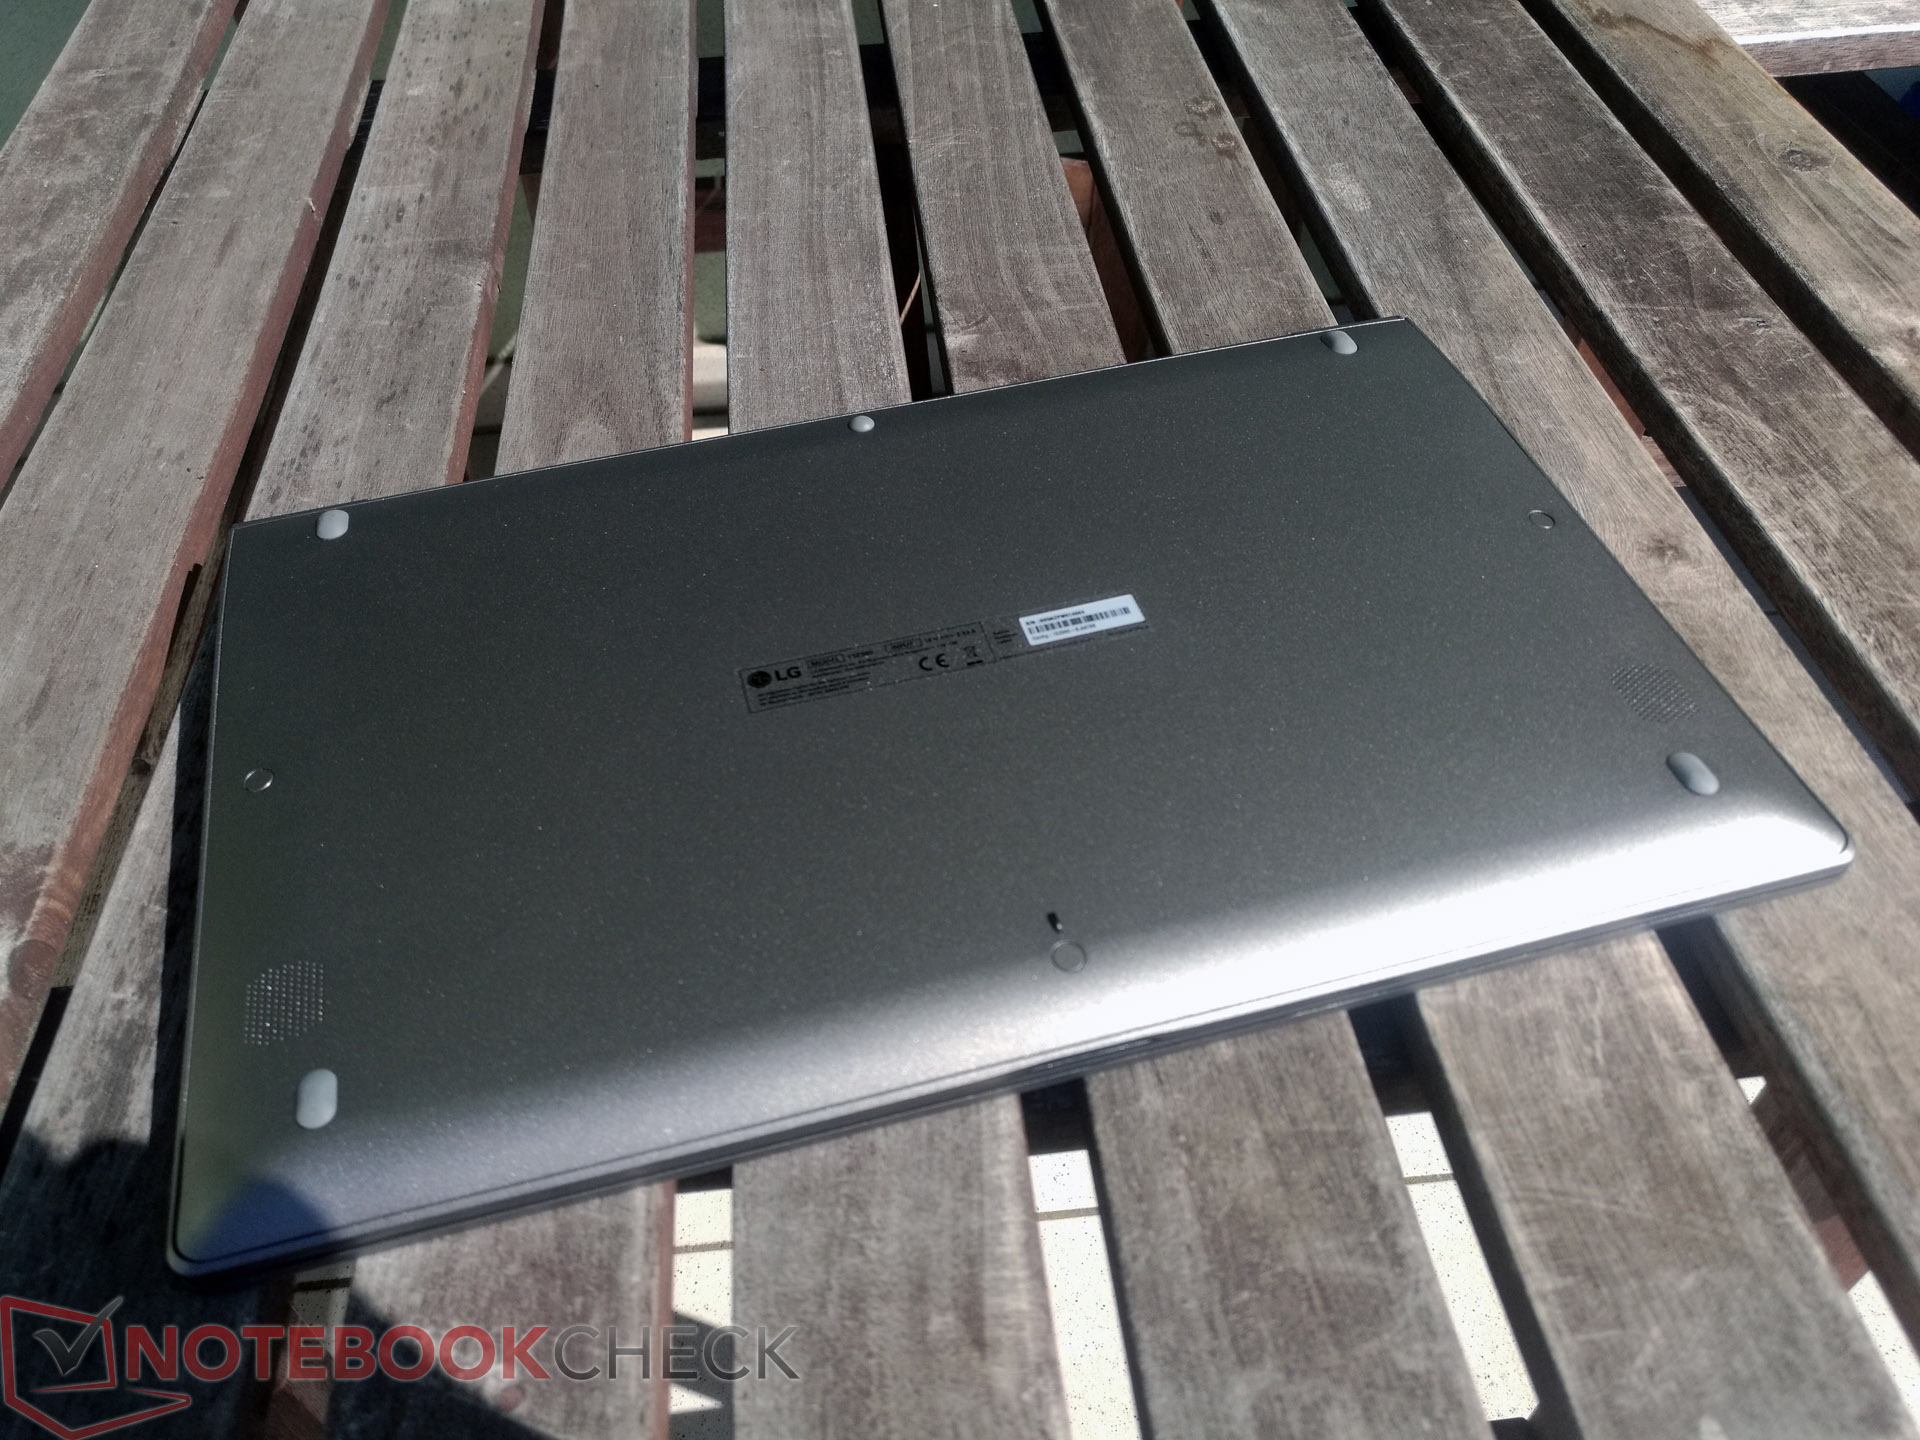
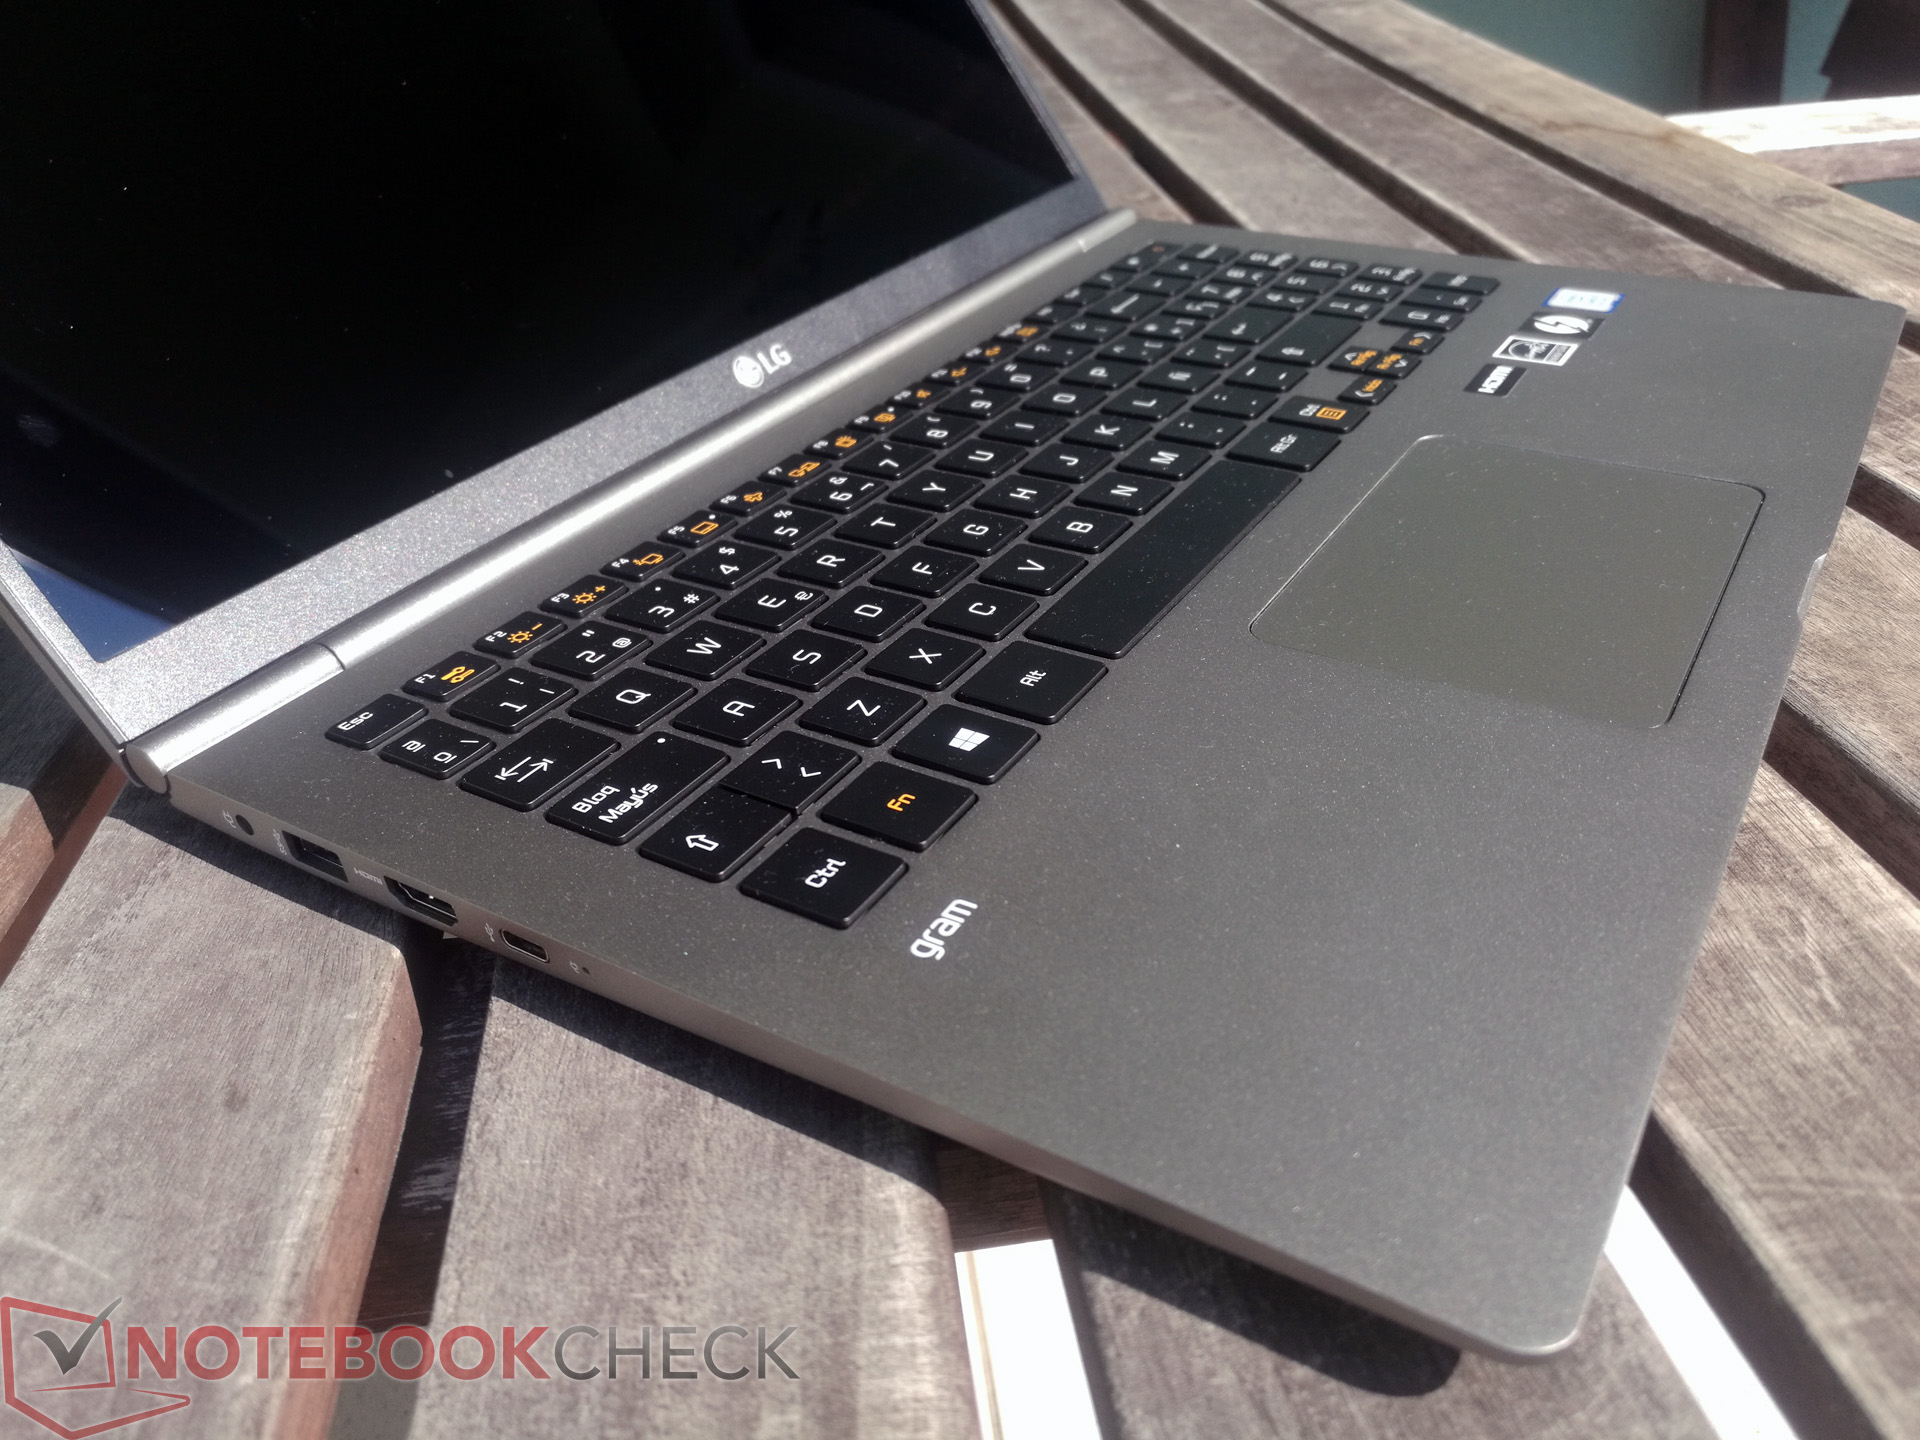
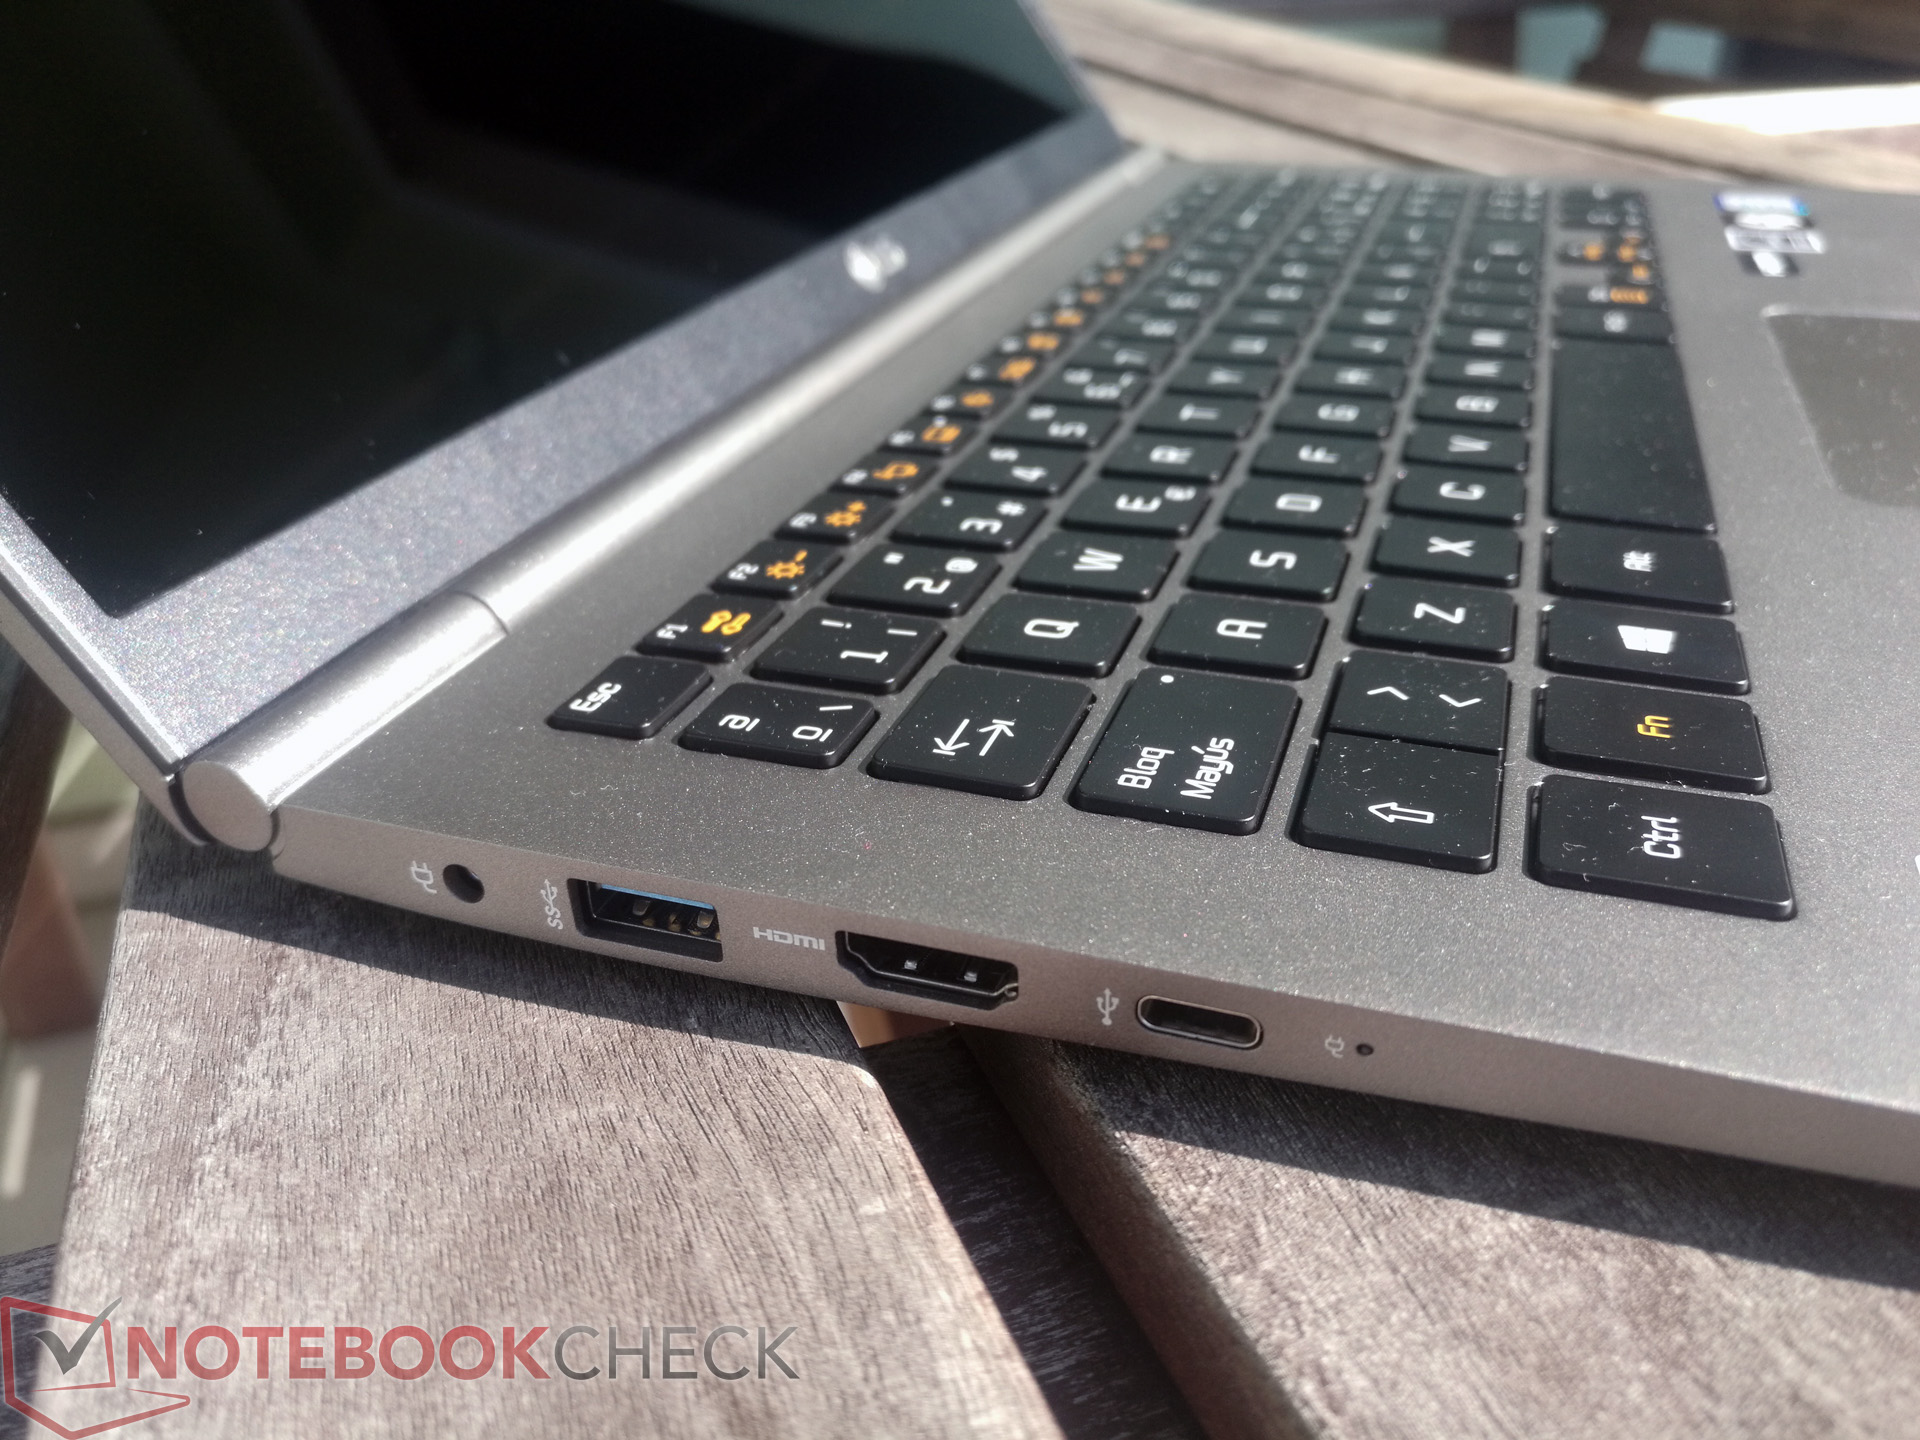
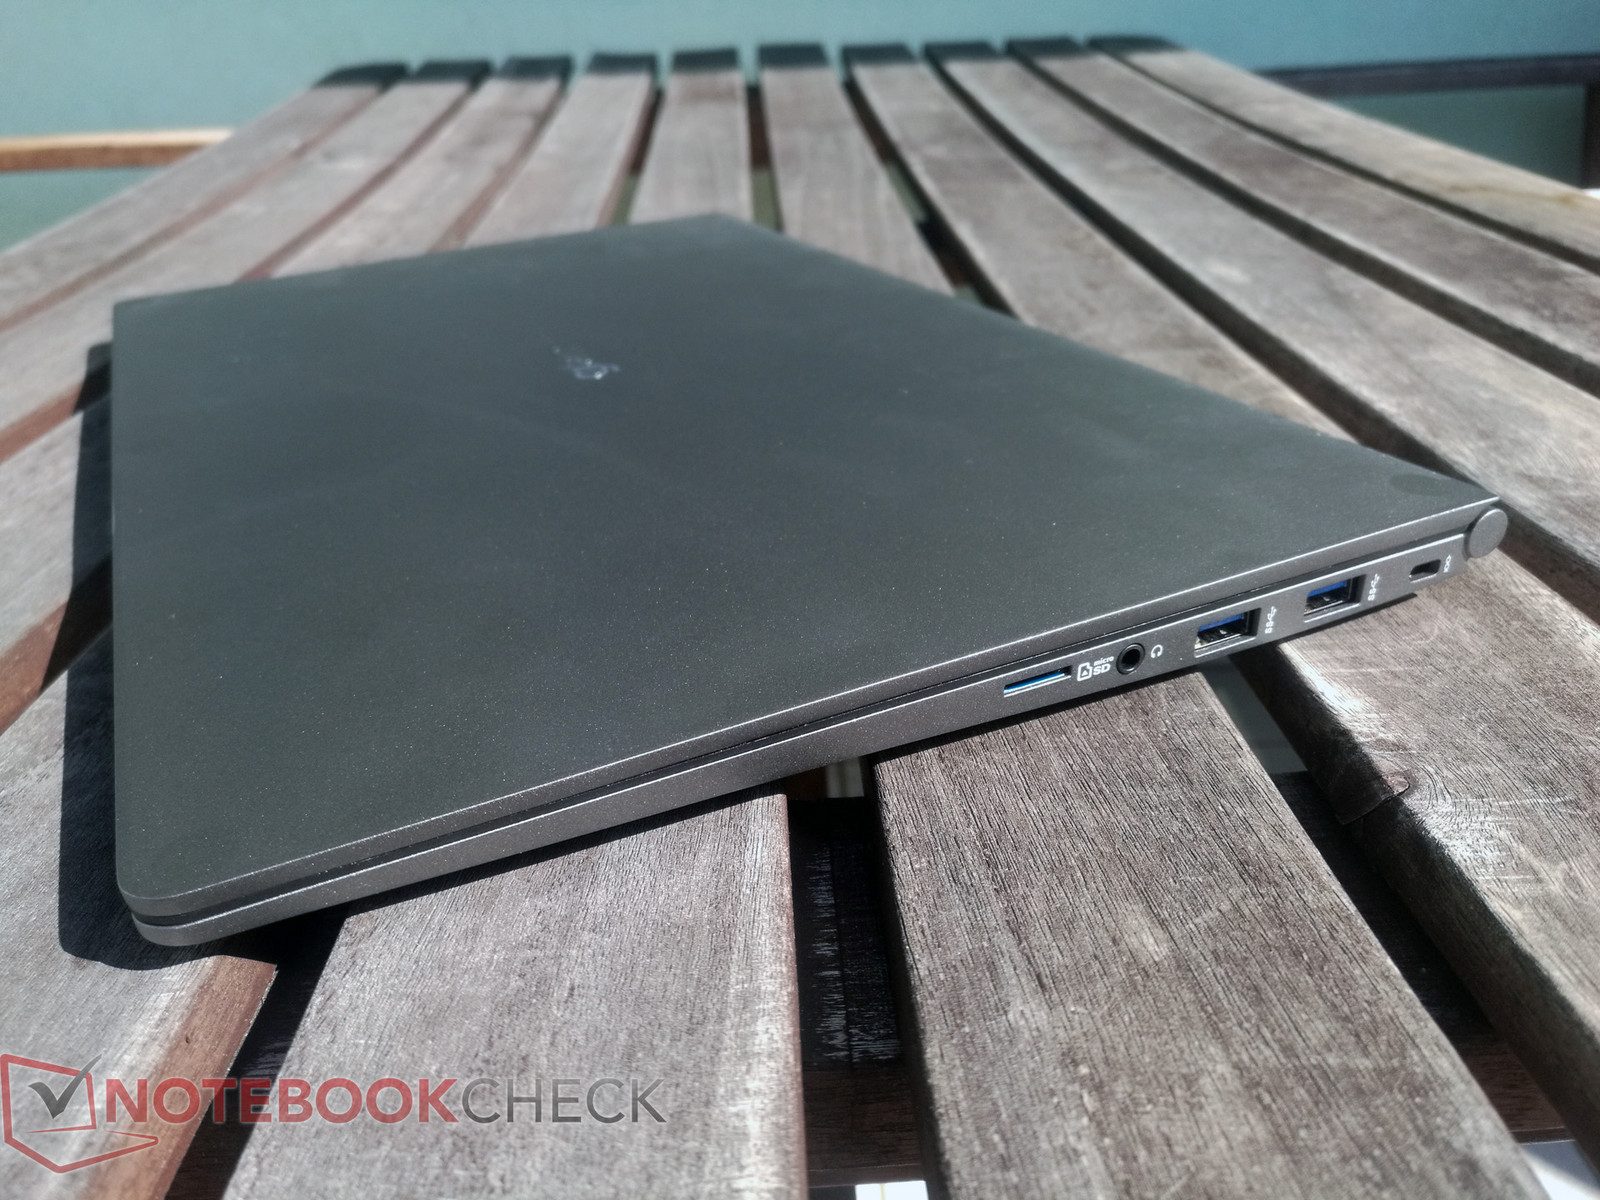
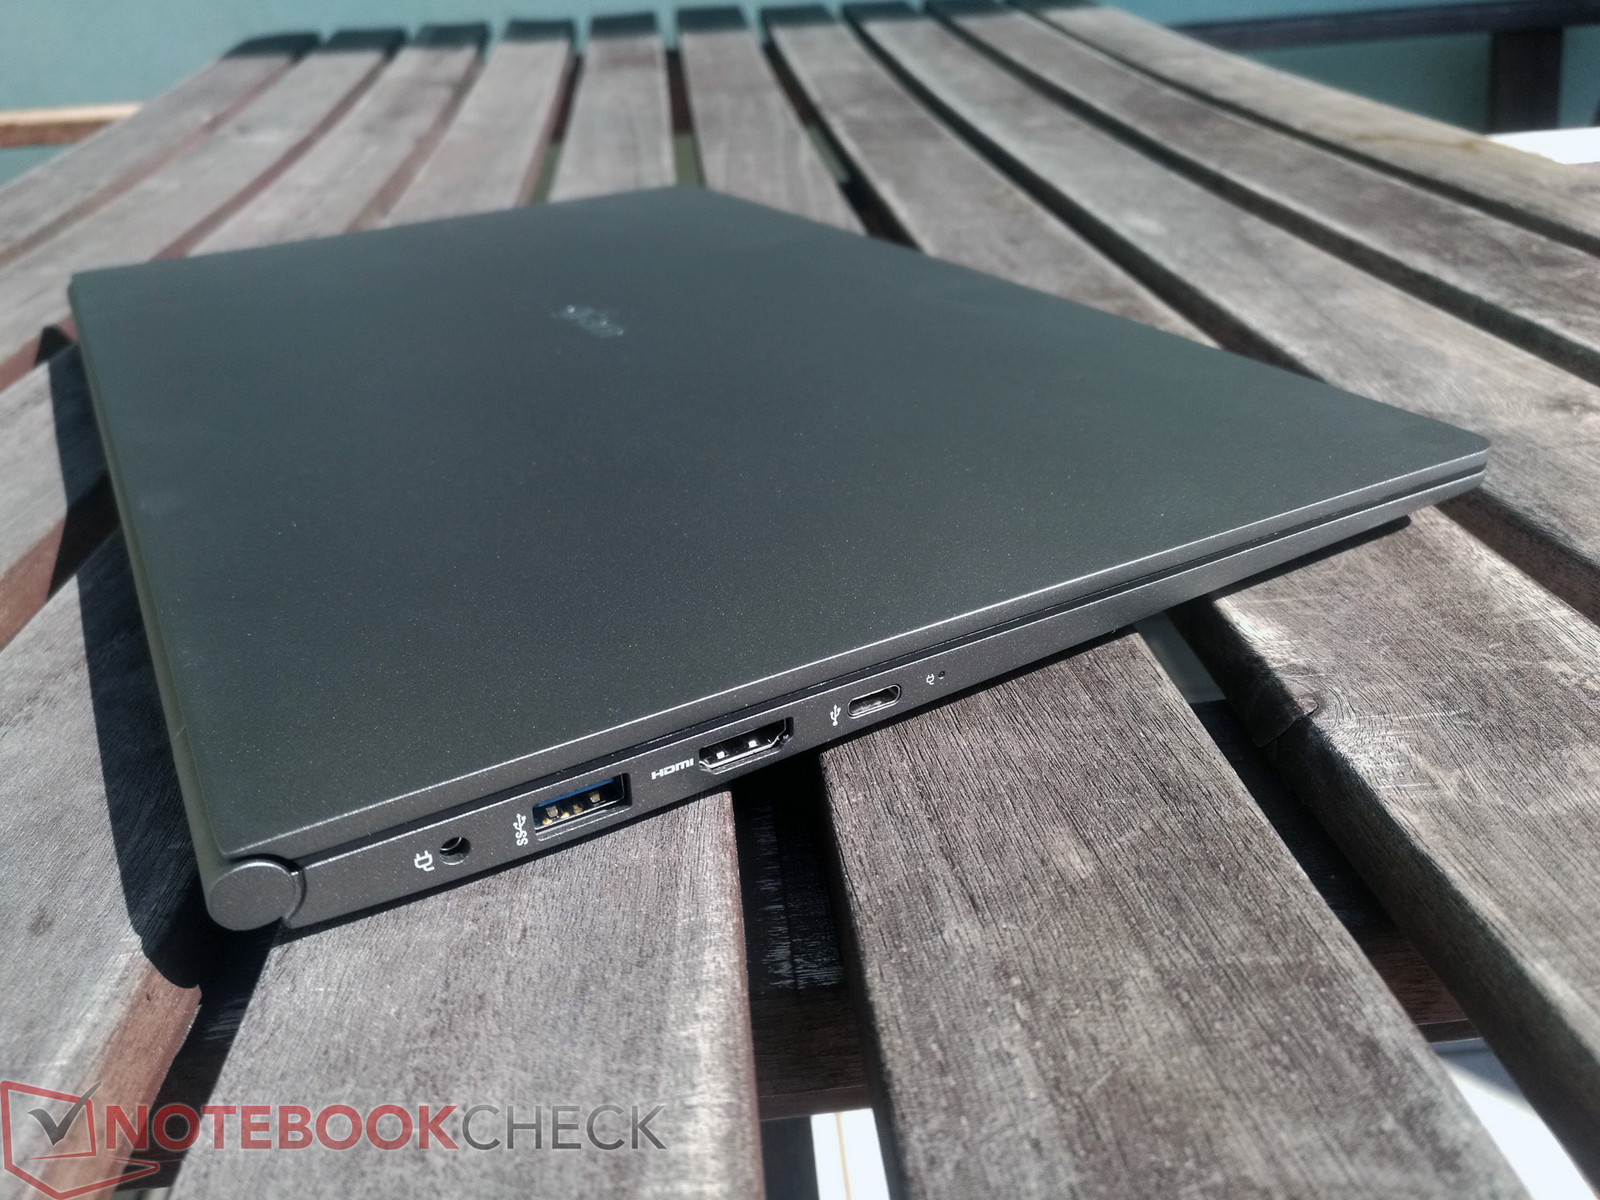
Há muitos outros aspectos positivos também. A RAM de 16 GB operando no modo de canal duplo ajuda a extrair o máximo da GPU integrada. O 15Z980 oferece também uma sólida seleção de portas, incluindo três portas USB 3.0 tipo A e uma porta Thunderbolt 3.
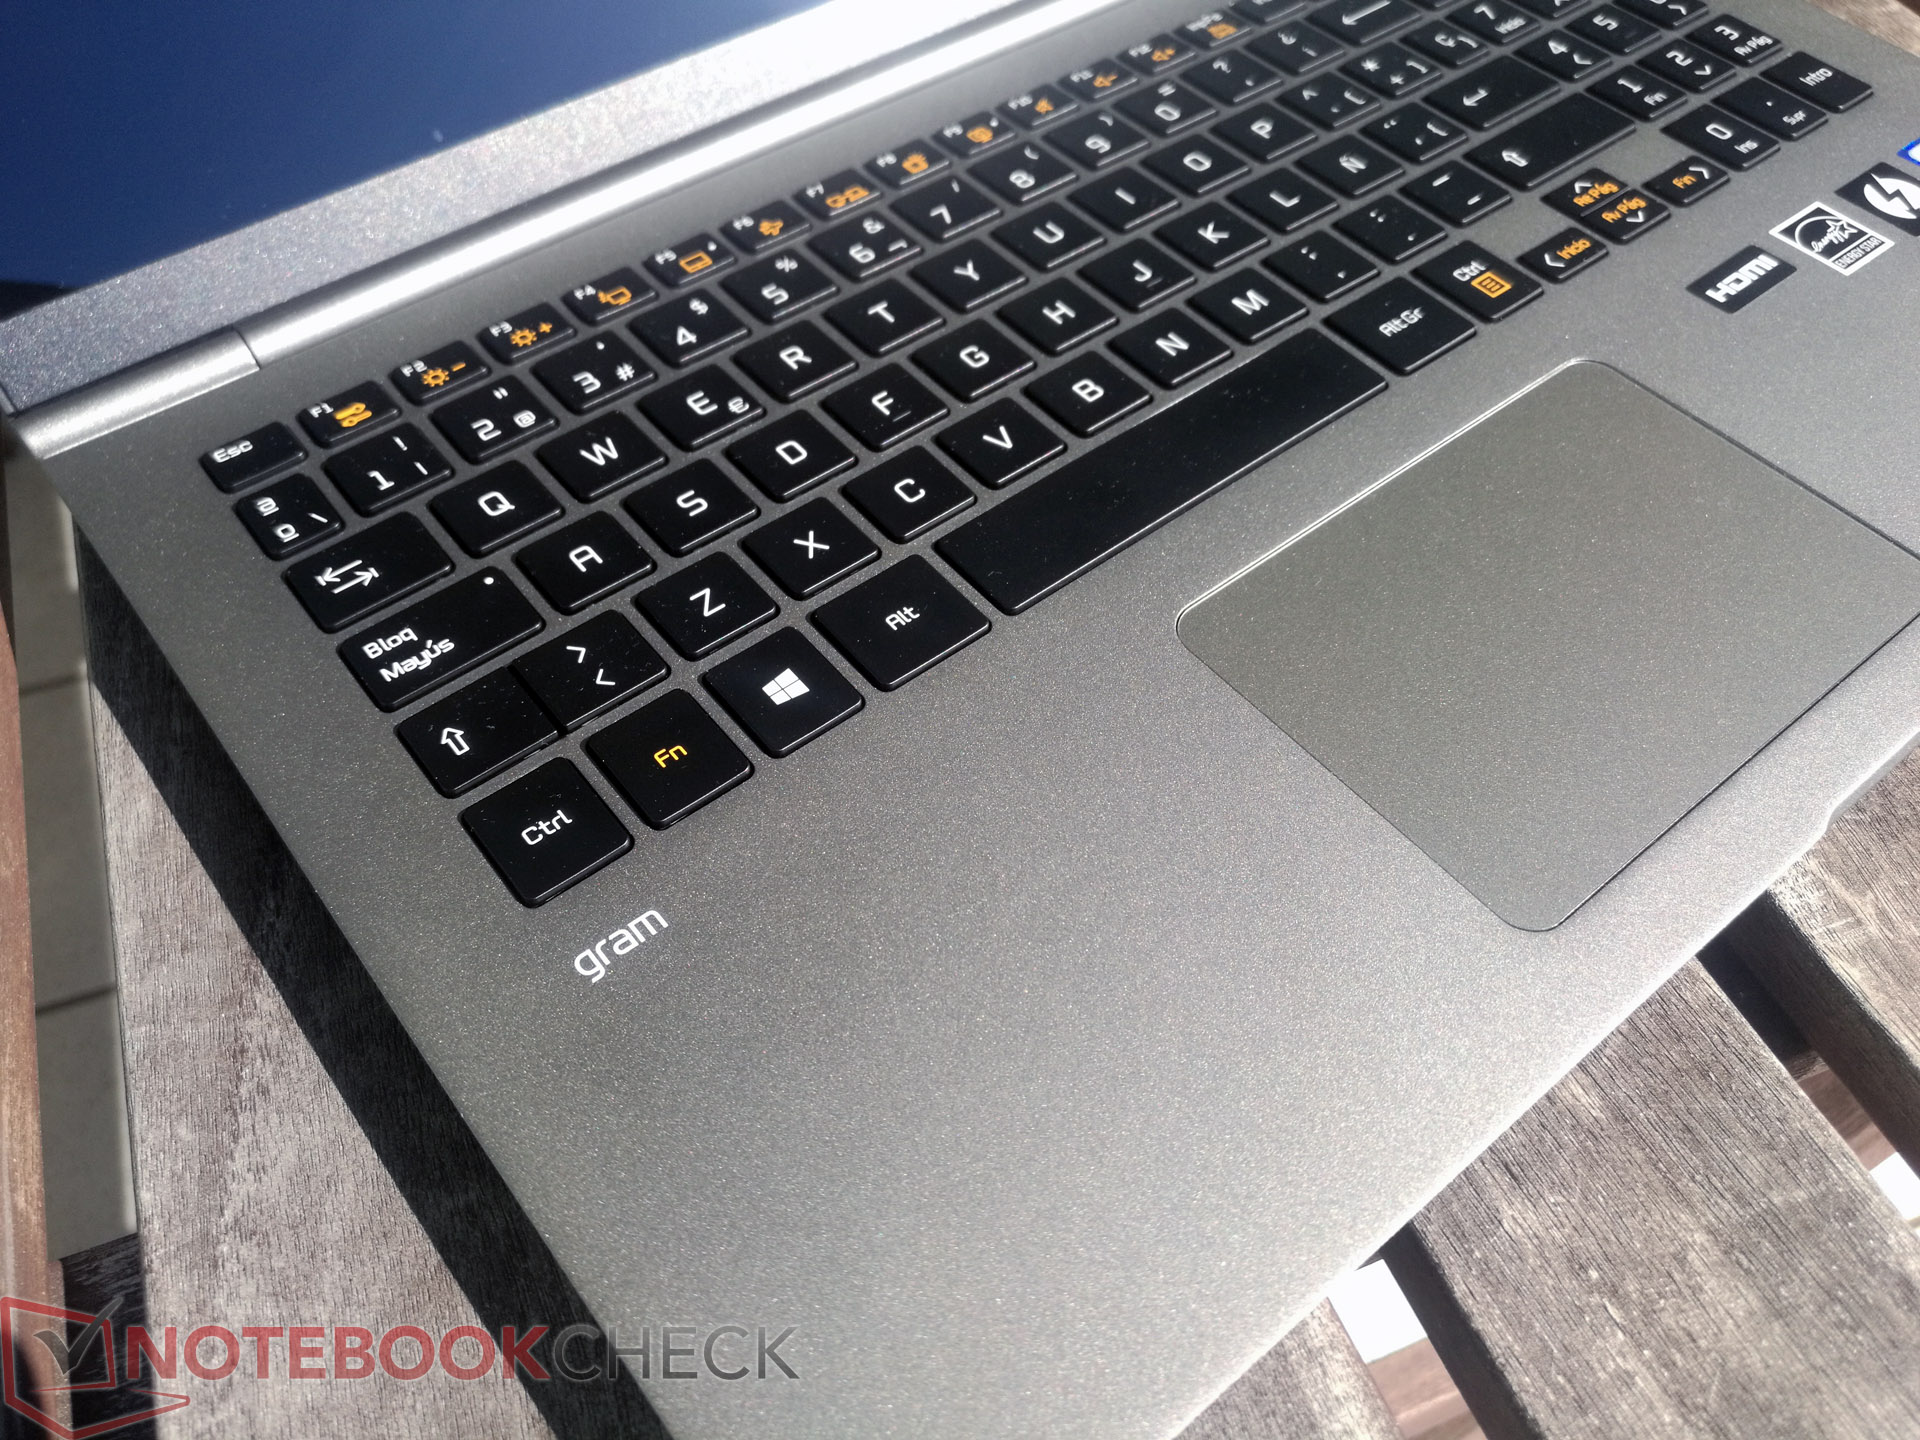
O teclado oferece uma boa experiência de digitação geral, mas levará algum tempo para se acostumar. Existem alguns tamanhos de teclas não padrão que parecerão estranhos no início. Além disso, só poderíamos escolher um teclado QWERTY em espanhol. No entanto, a inclusão de um teclado numérico é útil, especialmente porque nem todos os dispositivos de 15 polegadas incluem um.
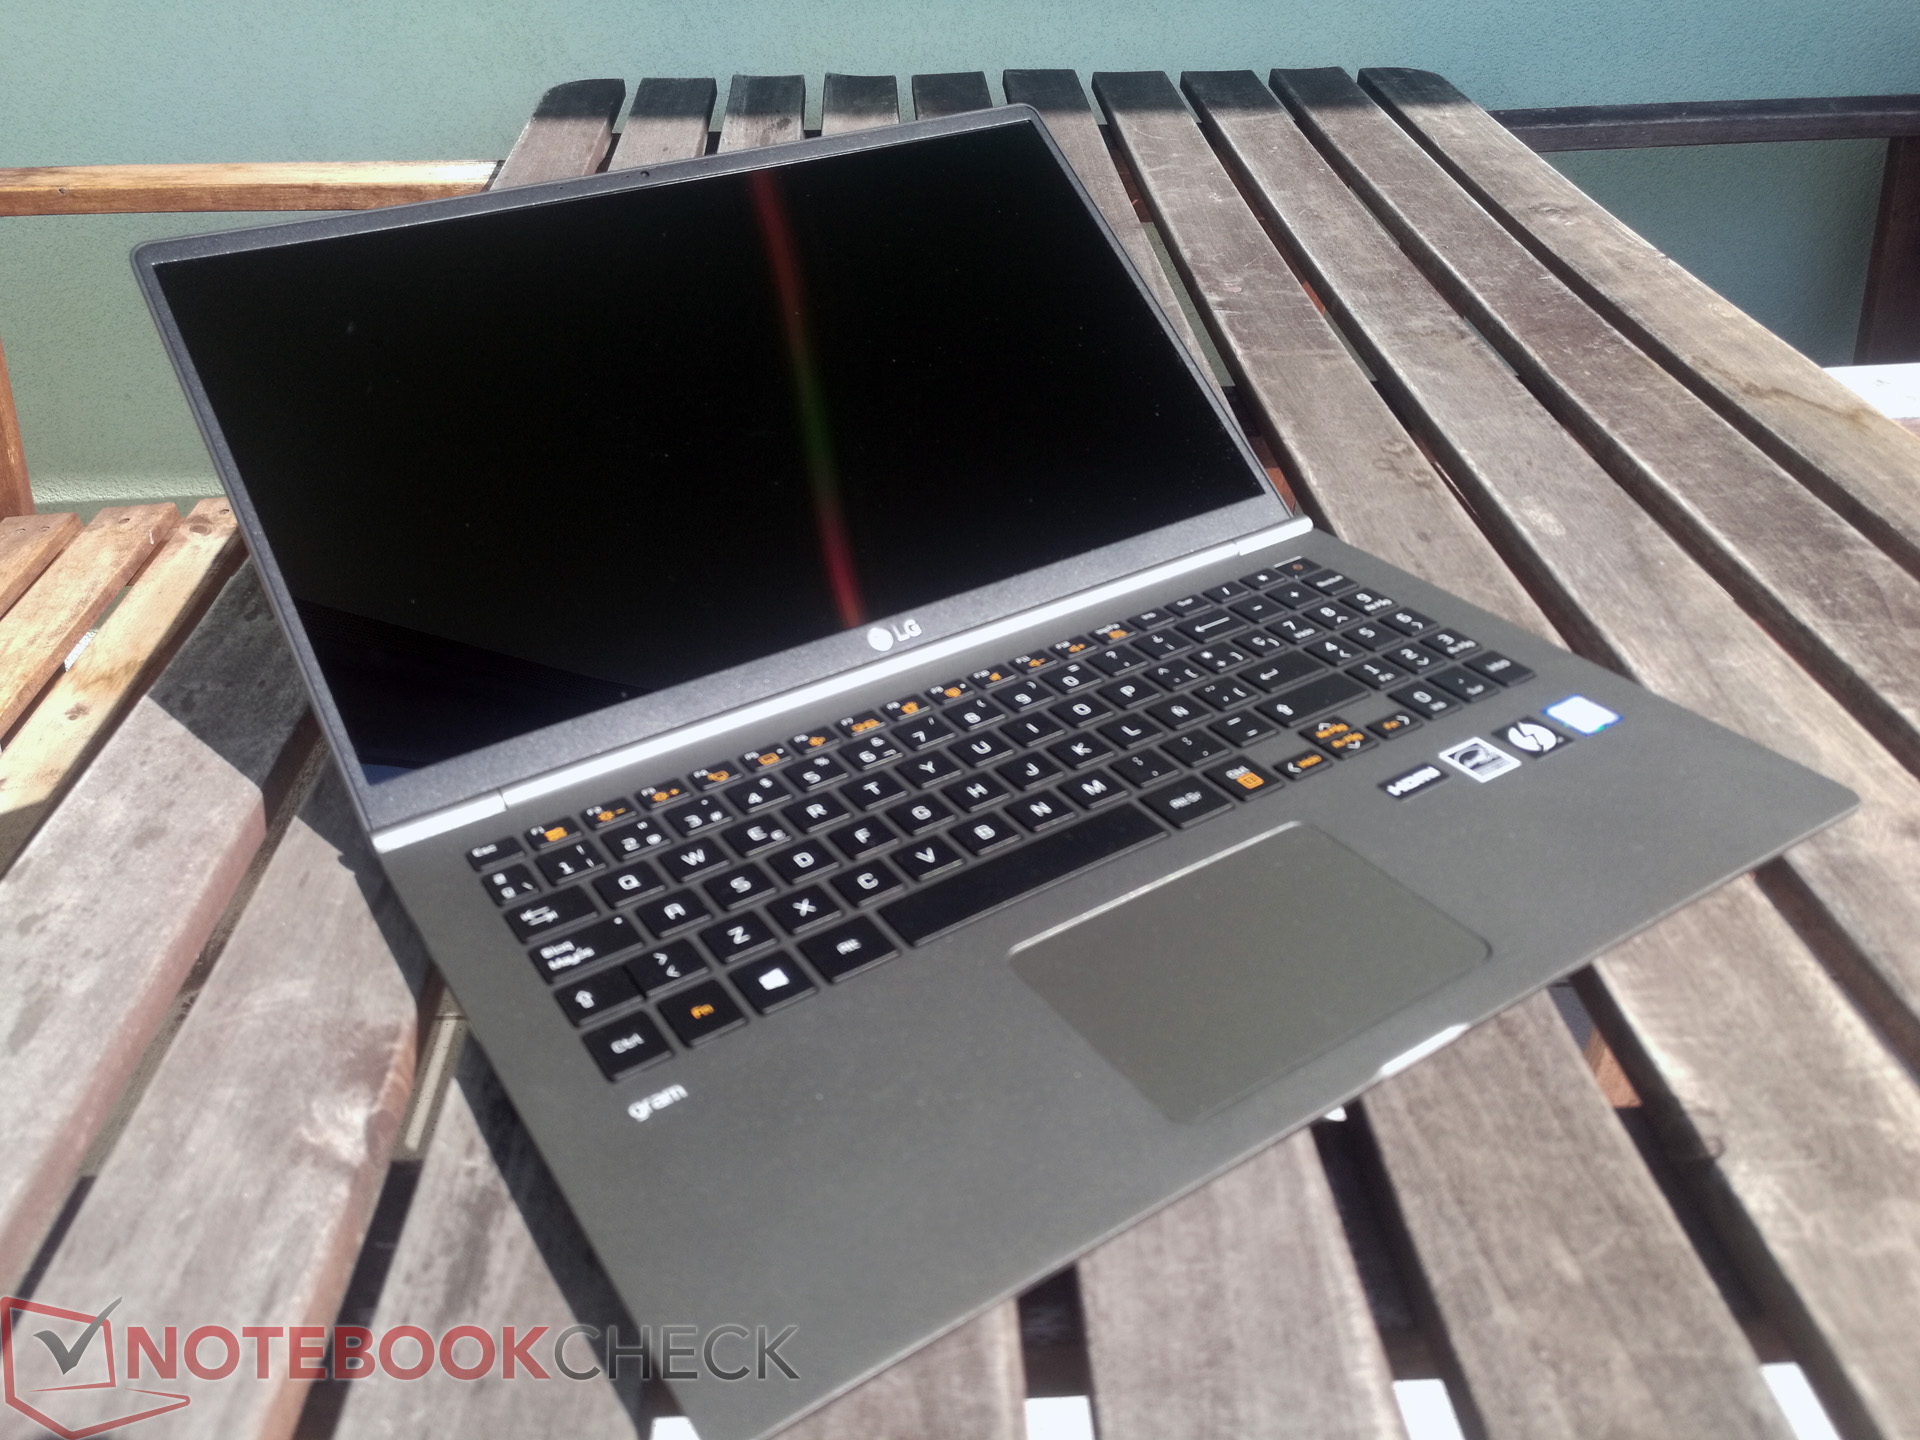
A tela Full HD é suficientemente brilhante com uma boa relação de contraste e precisão de cor decente. Frustrantemente, o brilho máximo é reduzido significativamente com a bateria. Poderia haver uma configuração em algum lugar para corrigir isso, mas não conseguimos encontrar durante o teste. Isto combinado com uma tela altamente refletiva, faz com que usar o 15Z980 em exteriores seja desconfortável.
Além disso, nosso dispositivo de teste permanece relativamente frio e silencioso, mesmo sob condições de uso intenso. Além disso, o 15Z980 possui uma duração de bateria excepcionalmente longa que derrota facilmente nossos dispositivos de comparação.
Curiosamente, o 15Z980 teria marcado 84% como um portátil de escritório, mas 86% como um sub-portátil. Decidimos classificar o dispositivo na última categoria por causa de sua mobilidade em comparação com outros dispositivos de 15 polegadas.
LG Gram 15Z980-B.AA78B
- 08/06/2018 v6 (old)
J. Simon Leitner, Alexander Fagot
Price comparison
