Breve Análise do Portátil Asus ZenBook 14 UX433F (i7-8565U)

| SD Card Reader | |
| average JPG Copy Test (av. of 3 runs) | |
| HP Spectre x360 13-ae048ng (Toshiba Exceria Pro M501 microSDXC 64GB) | |
| Dell XPS 13 9370 i7 UHD (Toshiba Exceria Pro UHS-II) | |
| Asus Zenbook UX430UN (Toshiba Exceria Pro SDXC 64 GB UHS-II) | |
| Asus ZenBook 14 UX433FA (Toshiba Exceria Pro M501 microSDXC) | |
| maximum AS SSD Seq Read Test (1GB) | |
| Dell XPS 13 9370 i7 UHD (Toshiba Exceria Pro UHS-II) | |
| HP Spectre x360 13-ae048ng (Toshiba Exceria Pro M501 microSDXC 64GB) | |
| Asus Zenbook UX430UN (Toshiba Exceria Pro SDXC 64 GB UHS-II) | |
| Asus ZenBook 14 UX433FA (Toshiba Exceria Pro M501 microSDXC) | |
| Networking | |
| iperf3 transmit AX12 | |
| Asus ZenBook 14 UX433FA | |
| Huawei Matebook X Pro i5 | |
| Dell XPS 13 9370 i7 UHD | |
| Asus Zenbook UX430UN | |
| iperf3 receive AX12 | |
| Dell XPS 13 9370 i7 UHD | |
| Huawei Matebook X Pro i5 | |
| Asus Zenbook UX430UN | |
| Asus ZenBook 14 UX433FA | |
| |||||||||||||||||||||||||
iluminação: 87 %
iluminação com acumulador: 332.8 cd/m²
Contraste: 1148:1 (Preto: 0.29 cd/m²)
ΔE ColorChecker Calman: 5.14 | ∀{0.5-29.43 Ø4.71}
calibrated: 3.61
ΔE Greyscale Calman: 8.8 | ∀{0.09-98 Ø4.96}
89.2% sRGB (Argyll 1.6.3 3D)
58.1% AdobeRGB 1998 (Argyll 1.6.3 3D)
65.1% AdobeRGB 1998 (Argyll 3D)
89.7% sRGB (Argyll 3D)
64.3% Display P3 (Argyll 3D)
Gamma: 2.33
CCT: 8227 K
| Asus ZenBook 14 UX433FA AU Optronics B140HAN03.2, IPS, 14", 1920x1080 | Apple MacBook Air 2018 APPA039, IPS, 13.3", 2560x1600 | Dell XPS 13 9370 i7 UHD ID: Sharp SHP148B, Name: LQ133D1, Dell P/N: 8XDHY, IPS, 13.3", 3840x2160 | Huawei Matebook X Pro i5 Tianma XM, IPS, 13.9", 3000x2000 | Lenovo Yoga C930-13IKB 81C4 AUO B139HAN03_0, IPS, 13.9", 1920x1080 | Asus Zenbook UX430UN NV140FHM-N62, BOE0718, IPS, 14", 1920x1080 | |
|---|---|---|---|---|---|---|
| Display | 6% | 8% | 4% | 0% | -3% | |
| Display P3 Coverage (%) | 64.3 | 67.8 5% | 68.9 7% | 65.9 2% | 62.7 -2% | 64.6 0% |
| sRGB Coverage (%) | 89.7 | 96.1 7% | 98.4 10% | 95.2 6% | 92.6 3% | 84.8 -5% |
| AdobeRGB 1998 Coverage (%) | 65.1 | 69.8 7% | 69.5 7% | 67.6 4% | 64.7 -1% | 62 -5% |
| Response Times | -9% | -80% | -5% | 3% | -37% | |
| Response Time Grey 50% / Grey 80% * (ms) | 39.6 ? | 39.6 ? -0% | 69.6 ? -76% | 40.4 ? -2% | 34.4 ? 13% | 43.6 ? -10% |
| Response Time Black / White * (ms) | 24 ? | 28 ? -17% | 44 ? -83% | 25.6 ? -7% | 25.6 ? -7% | 39.2 ? -63% |
| PWM Frequency (Hz) | 113600 ? | 3759 ? | 200 ? | |||
| Screen | 31% | 25% | 23% | -11% | 6% | |
| Brightness middle (cd/m²) | 332.8 | 320 -4% | 478.5 44% | 442.7 33% | 312 -6% | 310.4 -7% |
| Brightness (cd/m²) | 310 | 315 2% | 466 50% | 428 38% | 295 -5% | 303 -2% |
| Brightness Distribution (%) | 87 | 95 9% | 86 -1% | 84 -3% | 87 0% | 89 2% |
| Black Level * (cd/m²) | 0.29 | 0.29 -0% | 0.43 -48% | 0.31 -7% | 0.43 -48% | 0.31 -7% |
| Contrast (:1) | 1148 | 1103 -4% | 1113 -3% | 1428 24% | 726 -37% | 1001 -13% |
| Colorchecker dE 2000 * | 5.14 | 1.2 77% | 3.09 40% | 2.24 56% | 7.6 -48% | 4.07 21% |
| Colorchecker dE 2000 max. * | 11.88 | 3.2 73% | 5.94 50% | 7.19 39% | 15.06 -27% | 8.33 30% |
| Colorchecker dE 2000 calibrated * | 3.61 | 0.5 86% | 2.06 43% | 1.11 69% | 1.96 46% | 4.07 -13% |
| Greyscale dE 2000 * | 8.8 | 0.8 91% | 2.4 73% | 9.7 -10% | 8.8 -0% | 2.8 68% |
| Gamma | 2.33 94% | 2.2 100% | 2.063 107% | 1.42 155% | 2.01 109% | 2.217 99% |
| CCT | 8227 79% | 6548 99% | 6883 94% | 6227 104% | 6874 95% | 7033 92% |
| Color Space (Percent of AdobeRGB 1998) (%) | 58.1 | 62.1 7% | 69.47 20% | 61.6 6% | 59.1 2% | 55.3 -5% |
| Color Space (Percent of sRGB) (%) | 89.2 | 96 8% | 98.36 10% | 95 7% | 92.3 3% | 84.6 -5% |
| Média Total (Programa/Configurações) | 9% /
22% | -16% /
9% | 7% /
16% | -3% /
-7% | -11% /
-1% |
* ... menor é melhor
Exibir tempos de resposta
| ↔ Tempo de resposta preto para branco | ||
|---|---|---|
| 24 ms ... ascensão ↗ e queda ↘ combinadas | ↗ 14.4 ms ascensão | 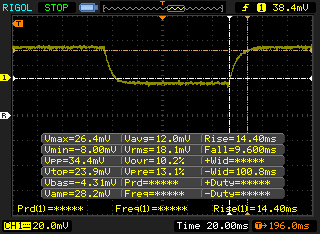 |
| ↘ 9.6 ms queda | ||
| A tela mostra boas taxas de resposta em nossos testes, mas pode ser muito lenta para jogadores competitivos. Em comparação, todos os dispositivos testados variam de 0.1 (mínimo) a 240 (máximo) ms. » 54 % de todos os dispositivos são melhores. Isso significa que o tempo de resposta medido é pior que a média de todos os dispositivos testados (19.8 ms). | ||
| ↔ Tempo de resposta 50% cinza a 80% cinza | ||
| 39.6 ms ... ascensão ↗ e queda ↘ combinadas | ↗ 21.2 ms ascensão | 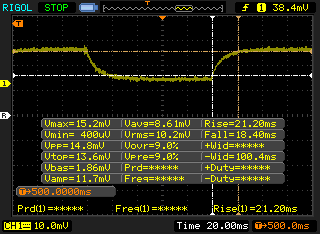 |
| ↘ 18.4 ms queda | ||
| A tela mostra taxas de resposta lentas em nossos testes e será insatisfatória para os jogadores. Em comparação, todos os dispositivos testados variam de 0.165 (mínimo) a 636 (máximo) ms. » 61 % de todos os dispositivos são melhores. Isso significa que o tempo de resposta medido é pior que a média de todos os dispositivos testados (31 ms). | ||
Cintilação da tela / PWM (modulação por largura de pulso)
| Tela tremeluzindo / PWM não detectado | 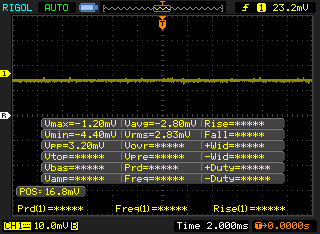 | ||
[pwm_comparison] Em comparação: 52 % de todos os dispositivos testados não usam PWM para escurecer a tela. Se PWM foi detectado, uma média de 7754 (mínimo: 5 - máximo: 343500) Hz foi medida. | |||
| Cinebench R11.5 | |
| CPU Single 64Bit | |
| Asus ZenBook 14 UX433FA | |
| Dell XPS 15 9575 i7-8705G | |
| Asus FX504GD | |
| Asus Zenbook UX430UN | |
| CPU Multi 64Bit | |
| Dell XPS 15 9575 i7-8705G | |
| Asus ZenBook 14 UX433FA | |
| Asus Zenbook UX430UN | |
| Asus FX504GD | |
| Cinebench R10 | |
| Rendering Multiple CPUs 32Bit | |
| Dell XPS 15 9575 i7-8705G | |
| Asus FX504GD | |
| Asus ZenBook 14 UX433FA | |
| Asus Zenbook UX430UN | |
| Lenovo Ideapad 720S-13ARR | |
| Rendering Single 32Bit | |
| Asus ZenBook 14 UX433FA | |
| Asus FX504GD | |
| Asus Zenbook UX430UN | |
| Dell XPS 15 9575 i7-8705G | |
| Lenovo Ideapad 720S-13ARR | |
| wPrime 2.10 - 1024m | |
| Asus Zenbook UX430UN | |
| Asus ZenBook 14 UX433FA | |
| Asus FX504GD | |
| Dell XPS 15 9575 i7-8705G | |
* ... menor é melhor
| PCMark 8 Home Score Accelerated v2 | 3285 pontos | |
| PCMark 8 Work Score Accelerated v2 | 4851 pontos | |
| PCMark 10 Score | 3736 pontos | |
Ajuda | ||
| Asus ZenBook 14 UX433FA WDC PC SN520 SDAPNUW-512G | Dell XPS 13 9370 i7 UHD Toshiba XG5 KXG50ZNV512G | Huawei Matebook X Pro i5 Samsung PM961 MZVLW256HEHP | Lenovo Yoga C930-13IKB 81C4 SK hynix PC401 HFS256GD9TNG | Asus Zenbook UX430UN SanDisk SD8SN8U512G1002 | HP Spectre x360 13-ae048ng Toshiba NVMe THNSN51T02DUK | |
|---|---|---|---|---|---|---|
| AS SSD | -22% | -4% | -192% | -70% | -570% | |
| Seq Read (MB/s) | 1201 | 2205 84% | 2416 101% | 1228 2% | 494.4 -59% | 1574 31% |
| Seq Write (MB/s) | 931 | 435.8 -53% | 1170 26% | 544 -42% | 300.3 -68% | 377.1 -59% |
| 4K Read (MB/s) | 40.25 | 29.36 -27% | 48.33 20% | 39.16 -3% | 25.39 -37% | 31.73 -21% |
| 4K Write (MB/s) | 111.5 | 107.4 -4% | 103.1 -8% | 106.5 -4% | 47.88 -57% | 1.73 -98% |
| 4K-64 Read (MB/s) | 916 | 678 -26% | 1039 13% | 466.4 -49% | 366 -60% | 115.6 -87% |
| 4K-64 Write (MB/s) | 871 | 444.8 -49% | 399.6 -54% | 305.1 -65% | 183.5 -79% | 2.09 -100% |
| Access Time Read * (ms) | 0.05 | 0.059 -18% | 0.058 -16% | 0.46 -820% | 0.089 -78% | 0.044 12% |
| Access Time Write * (ms) | 0.032 | 0.055 -72% | 0.036 -13% | 0.51 -1494% | 0.088 -175% | 2.391 -7372% |
| Score Read (Points) | 1076 | 926 -14% | 1329 24% | 628 -42% | 441 -59% | 305 -72% |
| Score Write (Points) | 1075 | 596 -45% | 620 -42% | 466 -57% | 261 -76% | 42 -96% |
| Score Total (Points) | 2696 | 1911 -29% | 2575 -4% | 1394 -48% | 926 -66% | 455 -83% |
| Copy ISO MB/s (MB/s) | 1153 | 585 -49% | 739 -36% | 628 -46% | 467.6 -59% | 1205 5% |
| Copy Program MB/s (MB/s) | 415.1 | 570 37% | 312.3 -25% | 540 30% | 270.5 -35% | 281.8 -32% |
| Copy Game MB/s (MB/s) | 930 | 503 -46% | 486.3 -48% | 533 -43% | 225.1 -76% | 856 -8% |
* ... menor é melhor

| 3DMark 06 Standard Score | 11207 pontos | |
| 3DMark Vantage P Result | 7761 pontos | |
| 3DMark 11 Performance | 2201 pontos | |
| 3DMark Ice Storm Standard Score | 64710 pontos | |
| 3DMark Cloud Gate Standard Score | 9469 pontos | |
| 3DMark Time Spy Score | 461 pontos | |
Ajuda | ||
| baixo | média | alto | ultra | |
|---|---|---|---|---|
| BioShock Infinite (2013) | 78.5 | 38.1 | 31.8 | 9.7 |
| Rise of the Tomb Raider (2016) | 22.8 | 13.7 | 7.2 | 5.7 |
| Rocket League (2017) | 71.4 | 32.9 | 21.1 |
| Asus ZenBook 14 UX433FA UHD Graphics 620, i7-8565U, WDC PC SN520 SDAPNUW-512G | Dell XPS 13 9370 i7 UHD UHD Graphics 620, i5-8550U, Toshiba XG5 KXG50ZNV512G | Huawei Matebook X Pro i5 GeForce MX150, i5-8250U, Samsung PM961 MZVLW256HEHP | Asus Zenbook UX430UN GeForce MX150, i5-8550U, SanDisk SD8SN8U512G1002 | Lenovo Yoga C930-13IKB 81C4 UHD Graphics 620, i5-8550U, SK hynix PC401 HFS256GD9TNG | HP Spectre x360 13-ae048ng UHD Graphics 620, i5-8550U, Toshiba NVMe THNSN51T02DUK | |
|---|---|---|---|---|---|---|
| Noise | 4% | 1% | -4% | 4% | 2% | |
| desligado / ambiente * (dB) | 28.8 | 28 3% | 27.9 3% | 28.3 2% | 27.9 3% | 30.13 -5% |
| Idle Minimum * (dB) | 28.8 | 28 3% | 27.9 3% | 28.9 -0% | 27.9 3% | 30.13 -5% |
| Idle Average * (dB) | 28.8 | 28 3% | 27.9 3% | 30 -4% | 27.9 3% | 30 -4% |
| Idle Maximum * (dB) | 29.1 | 28 4% | 27.9 4% | 30.2 -4% | 29.3 -1% | 30.13 -4% |
| Load Average * (dB) | 36.1 | 32.5 10% | 36.2 -0% | 41.8 -16% | 32 11% | 33.4 7% |
| Load Maximum * (dB) | 41.2 | 42.2 -2% | 45.2 -10% | 42 -2% | 39.3 5% | 33 20% |
| Witcher 3 ultra * (dB) | 45 | 42 |
* ... menor é melhor
Barulho
| Ocioso |
| 28.8 / 28.8 / 29.1 dB |
| Carga |
| 36.1 / 41.2 dB |
 | ||
30 dB silencioso 40 dB(A) audível 50 dB(A) ruidosamente alto |
||
min: | ||
(±) A temperatura máxima no lado superior é 42.4 °C / 108 F, em comparação com a média de 35.9 °C / 97 F , variando de 21.4 a 59 °C para a classe Subnotebook.
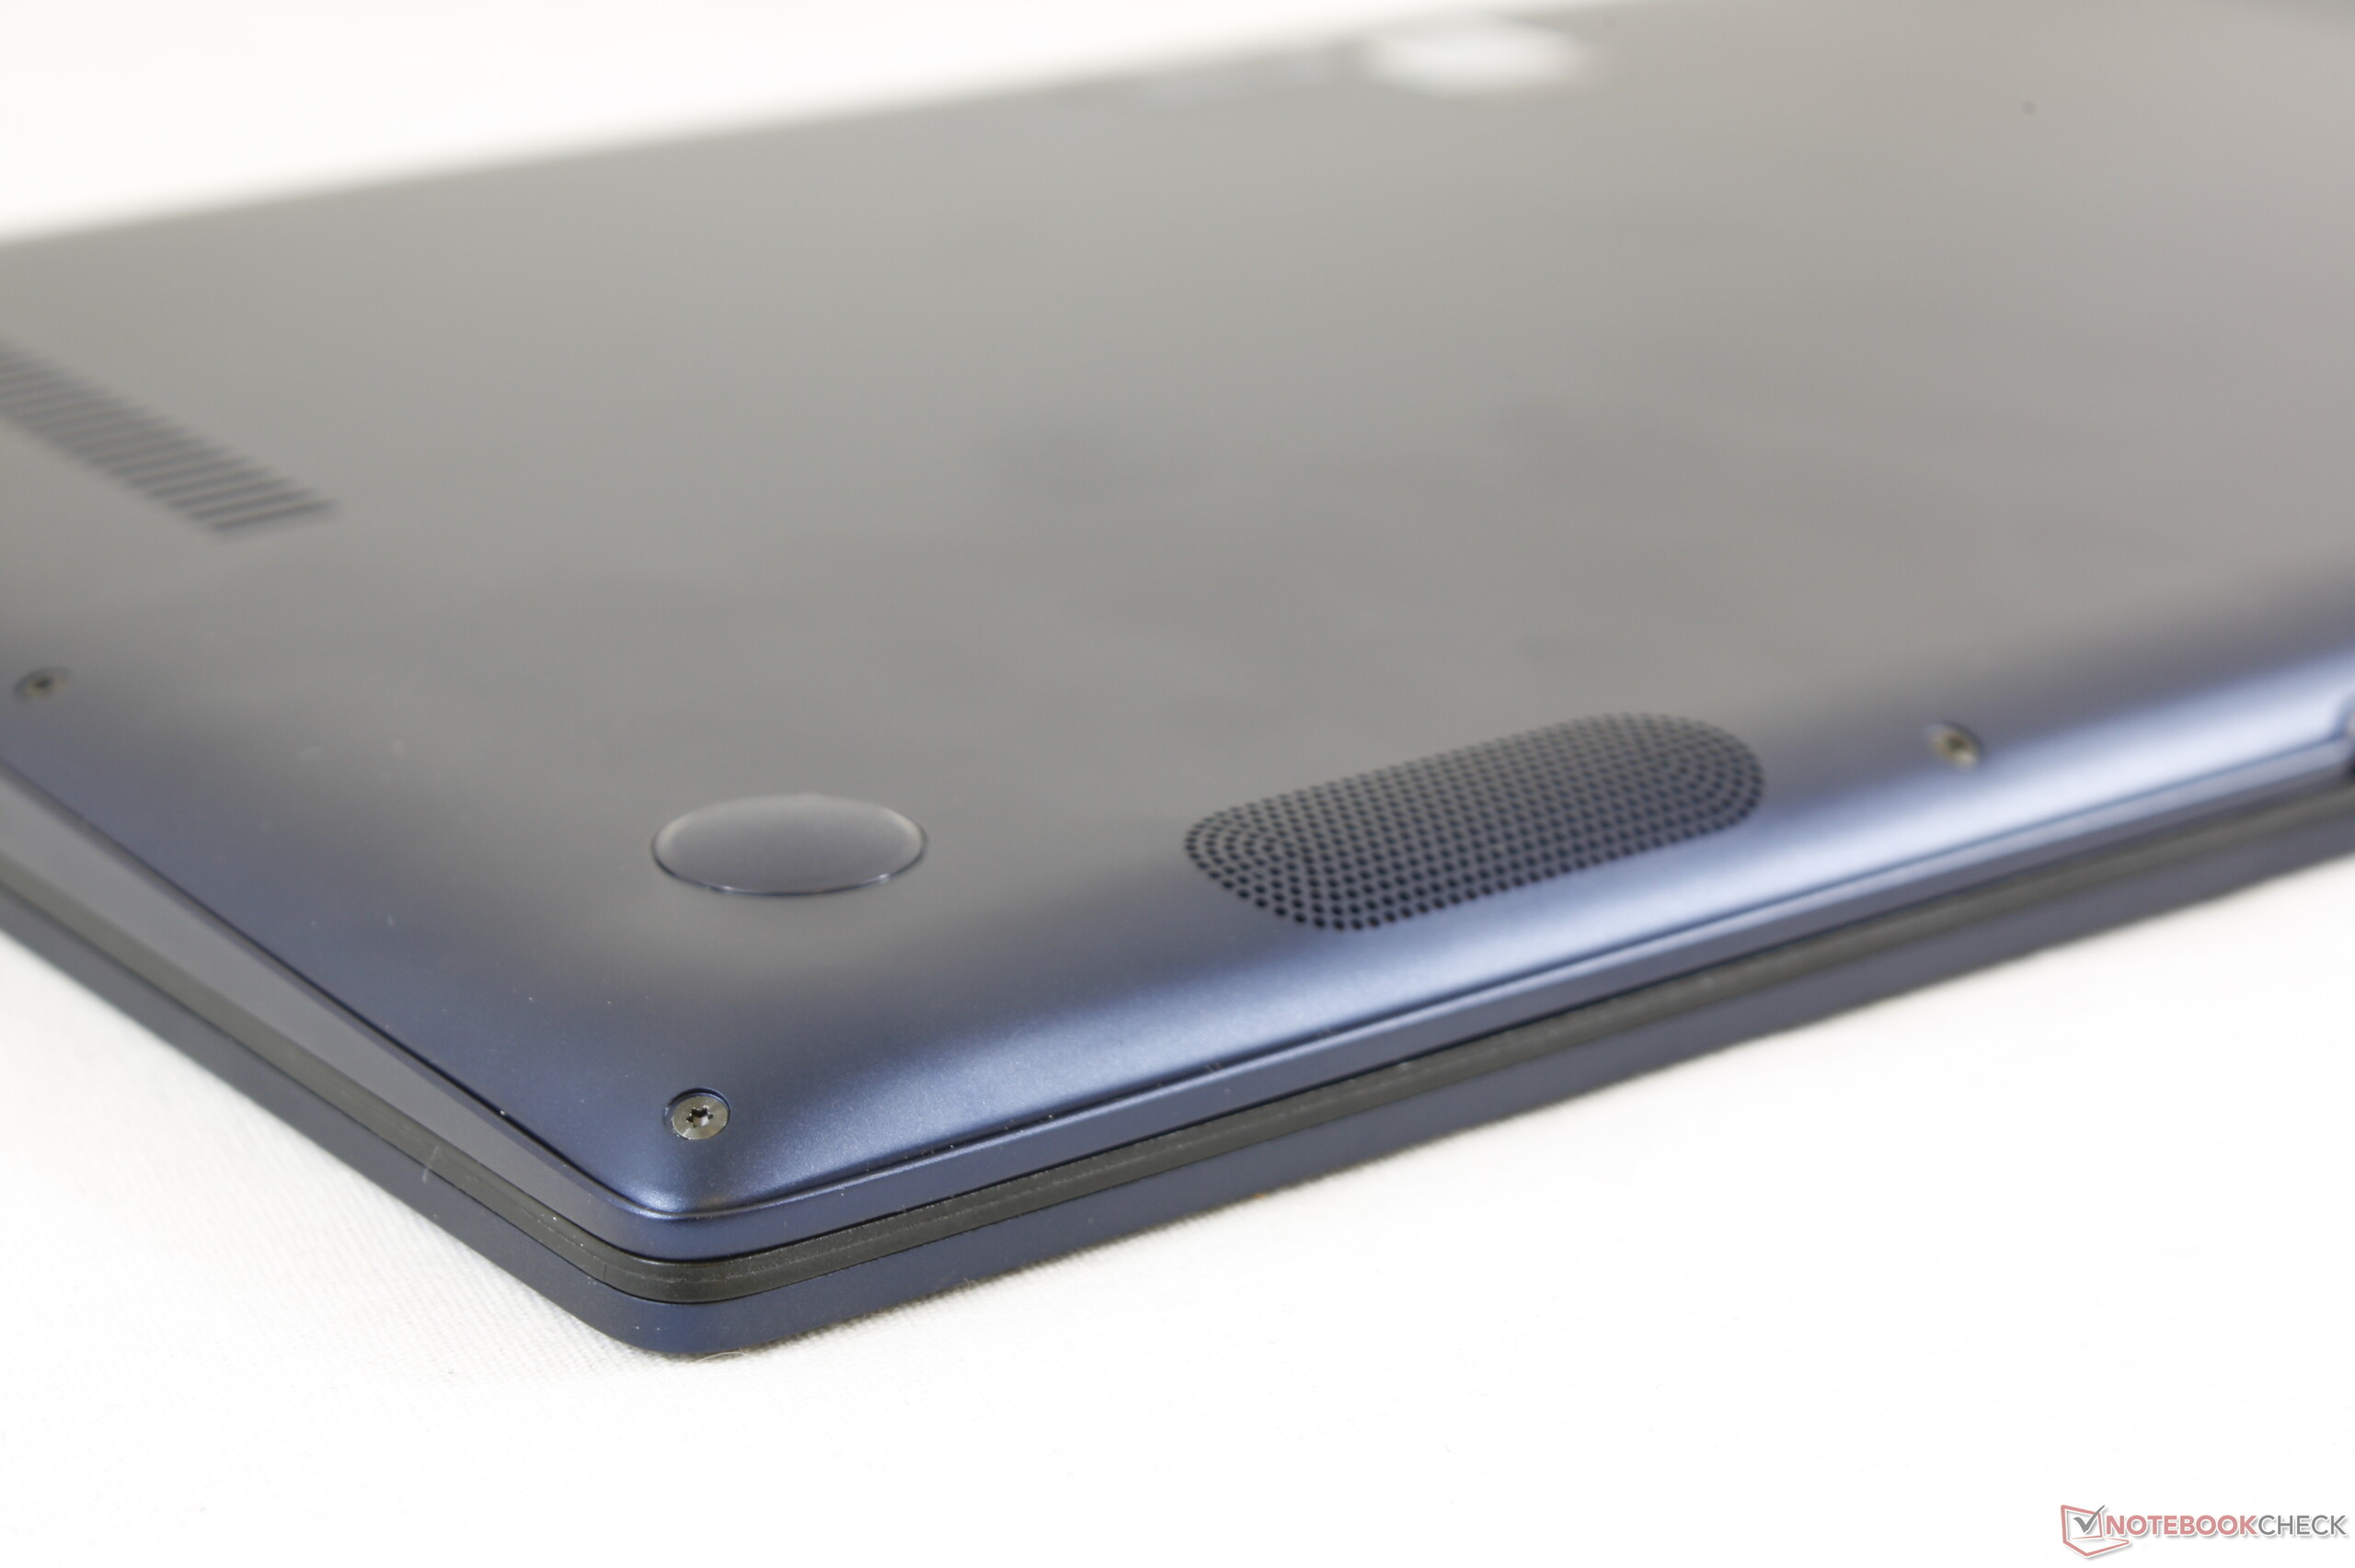
(±) A parte inferior aquece até um máximo de 45 °C / 113 F, em comparação com a média de 39.2 °C / 103 F
(+) Em uso inativo, a temperatura média para o lado superior é 28.5 °C / 83 F, em comparação com a média do dispositivo de 30.8 °C / ### class_avg_f### F.
(+) Os apoios para as mãos e o touchpad são mais frios que a temperatura da pele, com um máximo de 31 °C / 87.8 F e, portanto, são frios ao toque.
(-) A temperatura média da área do apoio para as mãos de dispositivos semelhantes foi 28.2 °C / 82.8 F (-2.8 °C / -5 F).
Asus ZenBook 14 UX433FA análise de áudio
(±) | o volume do alto-falante é médio, mas bom (###valor### dB)
Graves 100 - 315Hz
(±) | graves reduzidos - em média 13.8% menor que a mediana
(±) | a linearidade dos graves é média (10.6% delta para a frequência anterior)
Médios 400 - 2.000 Hz
(+) | médios equilibrados - apenas 3.4% longe da mediana
(+) | médios são lineares (4.8% delta para frequência anterior)
Altos 2 - 16 kHz
(±) | máximos mais altos - em média 5.2% maior que a mediana
(+) | os máximos são lineares (6.1% delta da frequência anterior)
Geral 100 - 16.000 Hz
(±) | a linearidade do som geral é média (16.1% diferença em relação à mediana)
Comparado com a mesma classe
» 39% de todos os dispositivos testados nesta classe foram melhores, 4% semelhantes, 56% piores
» O melhor teve um delta de 5%, a média foi 18%, o pior foi 53%
Comparado com todos os dispositivos testados
» 26% de todos os dispositivos testados foram melhores, 5% semelhantes, 69% piores
» O melhor teve um delta de 4%, a média foi 23%, o pior foi 134%
Apple MacBook 12 (Early 2016) 1.1 GHz análise de áudio
(+) | os alto-falantes podem tocar relativamente alto (###valor### dB)
Graves 100 - 315Hz
(±) | graves reduzidos - em média 11.3% menor que a mediana
(±) | a linearidade dos graves é média (14.2% delta para a frequência anterior)
Médios 400 - 2.000 Hz
(+) | médios equilibrados - apenas 2.4% longe da mediana
(+) | médios são lineares (5.5% delta para frequência anterior)
Altos 2 - 16 kHz
(+) | agudos equilibrados - apenas 2% longe da mediana
(+) | os máximos são lineares (4.5% delta da frequência anterior)
Geral 100 - 16.000 Hz
(+) | o som geral é linear (10.2% diferença em relação à mediana)
Comparado com a mesma classe
» 7% de todos os dispositivos testados nesta classe foram melhores, 2% semelhantes, 90% piores
» O melhor teve um delta de 5%, a média foi 18%, o pior foi 53%
Comparado com todos os dispositivos testados
» 5% de todos os dispositivos testados foram melhores, 1% semelhantes, 94% piores
» O melhor teve um delta de 4%, a média foi 23%, o pior foi 134%
| desligado | |
| Ocioso | |
| Carga |
|
Key:
min: | |
| Asus ZenBook 14 UX433FA i7-8565U, UHD Graphics 620, WDC PC SN520 SDAPNUW-512G, IPS, 1920x1080, 14" | Dell XPS 13 9370 i7 UHD i5-8550U, UHD Graphics 620, Toshiba XG5 KXG50ZNV512G, IPS, 3840x2160, 13.3" | Huawei Matebook X Pro i5 i5-8250U, GeForce MX150, Samsung PM961 MZVLW256HEHP, IPS, 3000x2000, 13.9" | Lenovo Yoga C930-13IKB 81C4 i5-8550U, UHD Graphics 620, SK hynix PC401 HFS256GD9TNG, IPS, 1920x1080, 13.9" | Asus Zenbook UX430UN i5-8550U, GeForce MX150, SanDisk SD8SN8U512G1002, IPS, 1920x1080, 14" | HP Spectre x360 13-ae048ng i5-8550U, UHD Graphics 620, Toshiba NVMe THNSN51T02DUK, IPS, 1920x1080, 13.3" | |
|---|---|---|---|---|---|---|
| Power Consumption | -18% | -26% | -21% | -1% | 12% | |
| Idle Minimum * (Watt) | 3.9 | 5 -28% | 3.5 10% | 3.4 13% | 3 23% | 3.2 18% |
| Idle Average * (Watt) | 5.9 | 8.3 -41% | 8.9 -51% | 7.5 -27% | 5.8 2% | 6 -2% |
| Idle Maximum * (Watt) | 8.8 | 8.8 -0% | 12.3 -40% | 11.8 -34% | 6.2 30% | 9.2 -5% |
| Load Average * (Watt) | 41.7 | 46.4 -11% | 54.2 -30% | 47.7 -14% | 54.1 -30% | 29.5 29% |
| Load Maximum * (Watt) | 44 | 48.6 -10% | 52.1 -18% | 63.2 -44% | 56.4 -28% | 35.6 19% |
| Witcher 3 ultra * (Watt) | 42.4 | 45.9 |
* ... menor é melhor
| Asus ZenBook 14 UX433FA i7-8565U, UHD Graphics 620, 50 Wh | Apple MacBook Air 2018 i5-8210Y, UHD Graphics 617, 50.3 Wh | Dell XPS 13 9370 i7 UHD i5-8550U, UHD Graphics 620, 52 Wh | Huawei Matebook X Pro i5 i5-8250U, GeForce MX150, 57.4 Wh | Lenovo Yoga C930-13IKB 81C4 i5-8550U, UHD Graphics 620, 60 Wh | Asus Zenbook UX430UN i5-8550U, GeForce MX150, 50 Wh | HP Spectre x360 13-ae048ng i5-8550U, UHD Graphics 620, 60 Wh | |
|---|---|---|---|---|---|---|---|
| Duração da bateria | -14% | -33% | -12% | 6% | -24% | -16% | |
| Reader / Idle (h) | 19.1 | 13.7 -28% | 20.7 8% | 17.3 -9% | |||
| WiFi v1.3 (h) | 10.5 | 11.1 6% | 7.8 -26% | 9.3 -11% | 11.1 6% | 9.3 -11% | 8.8 -16% |
| Load (h) | 3.3 | 2.2 -33% | 1.8 -45% | 2.2 -33% | 1.6 -52% | 2.8 -15% |
Pro
Contra
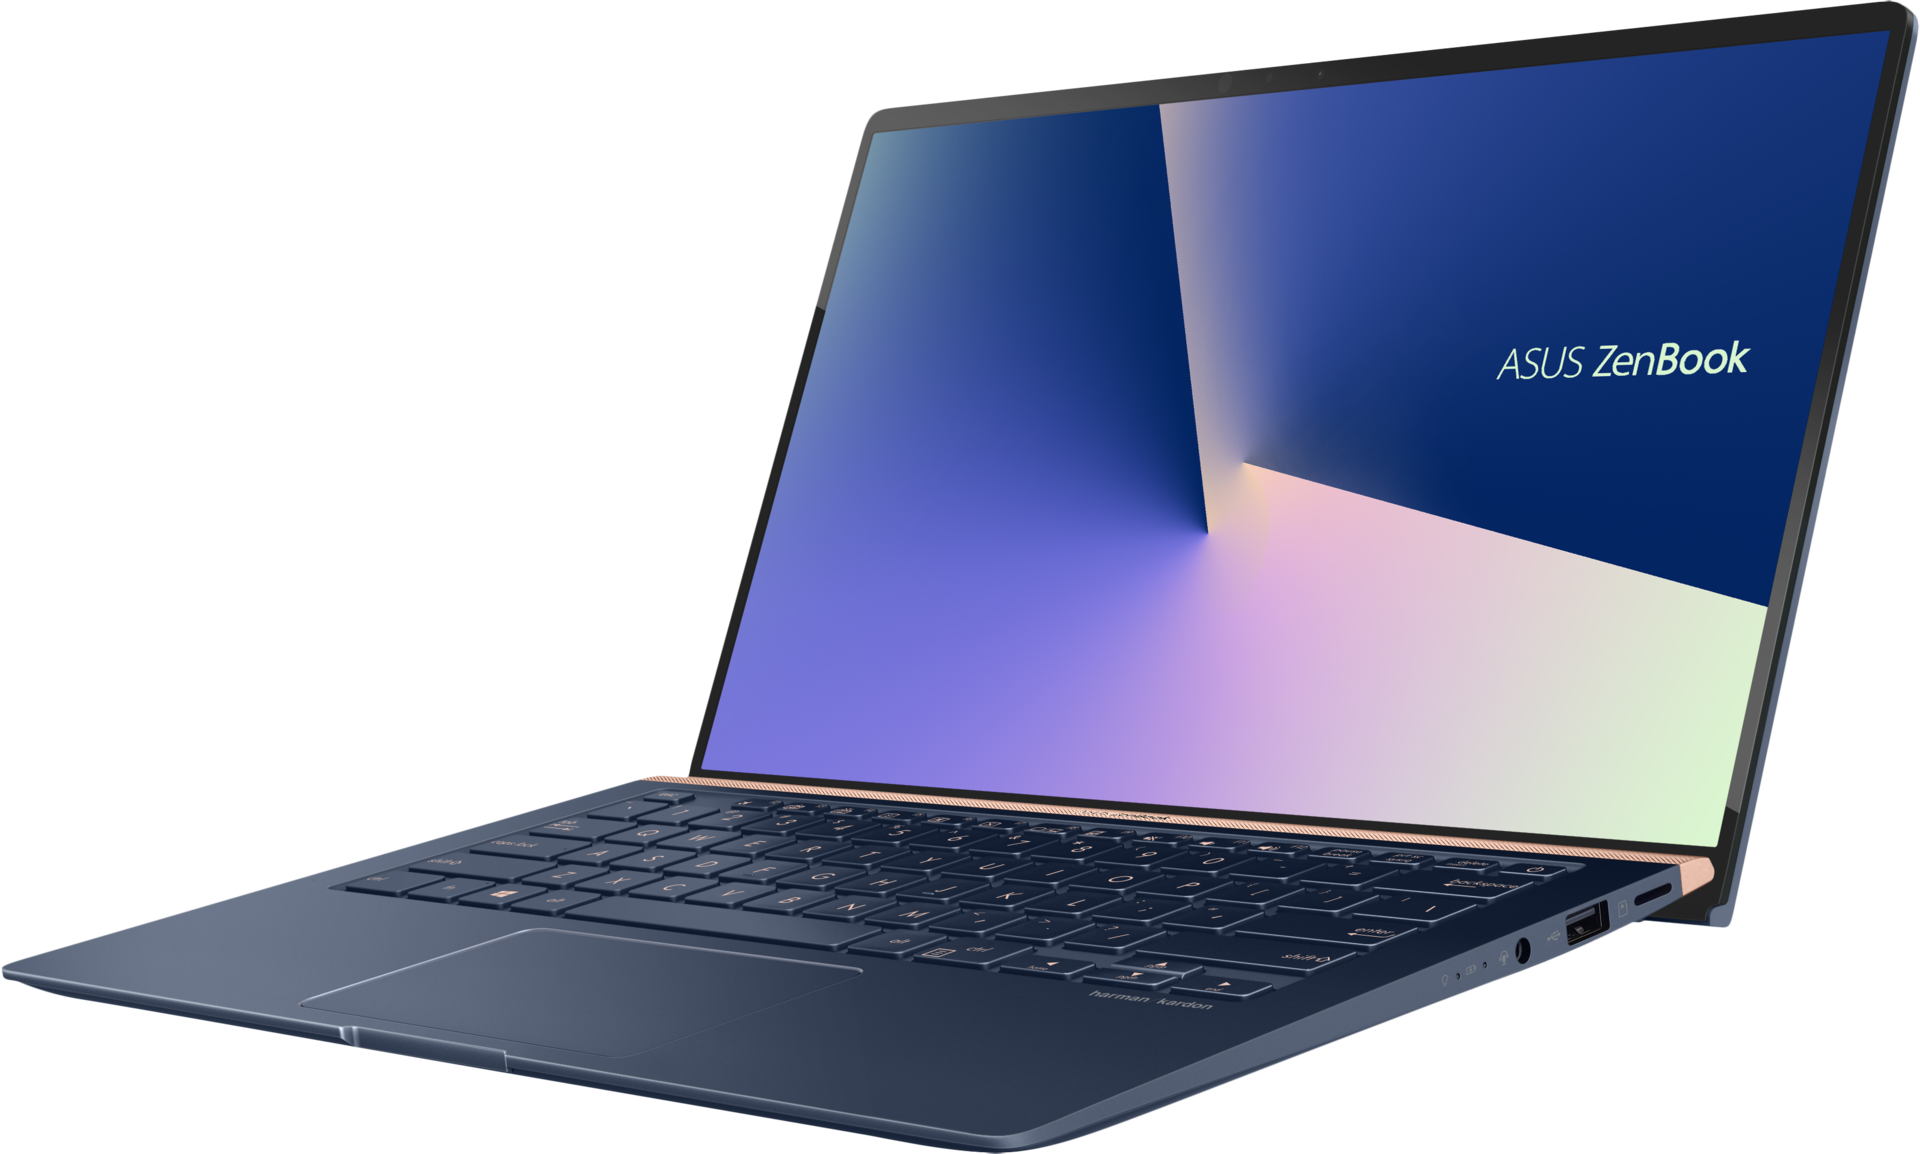
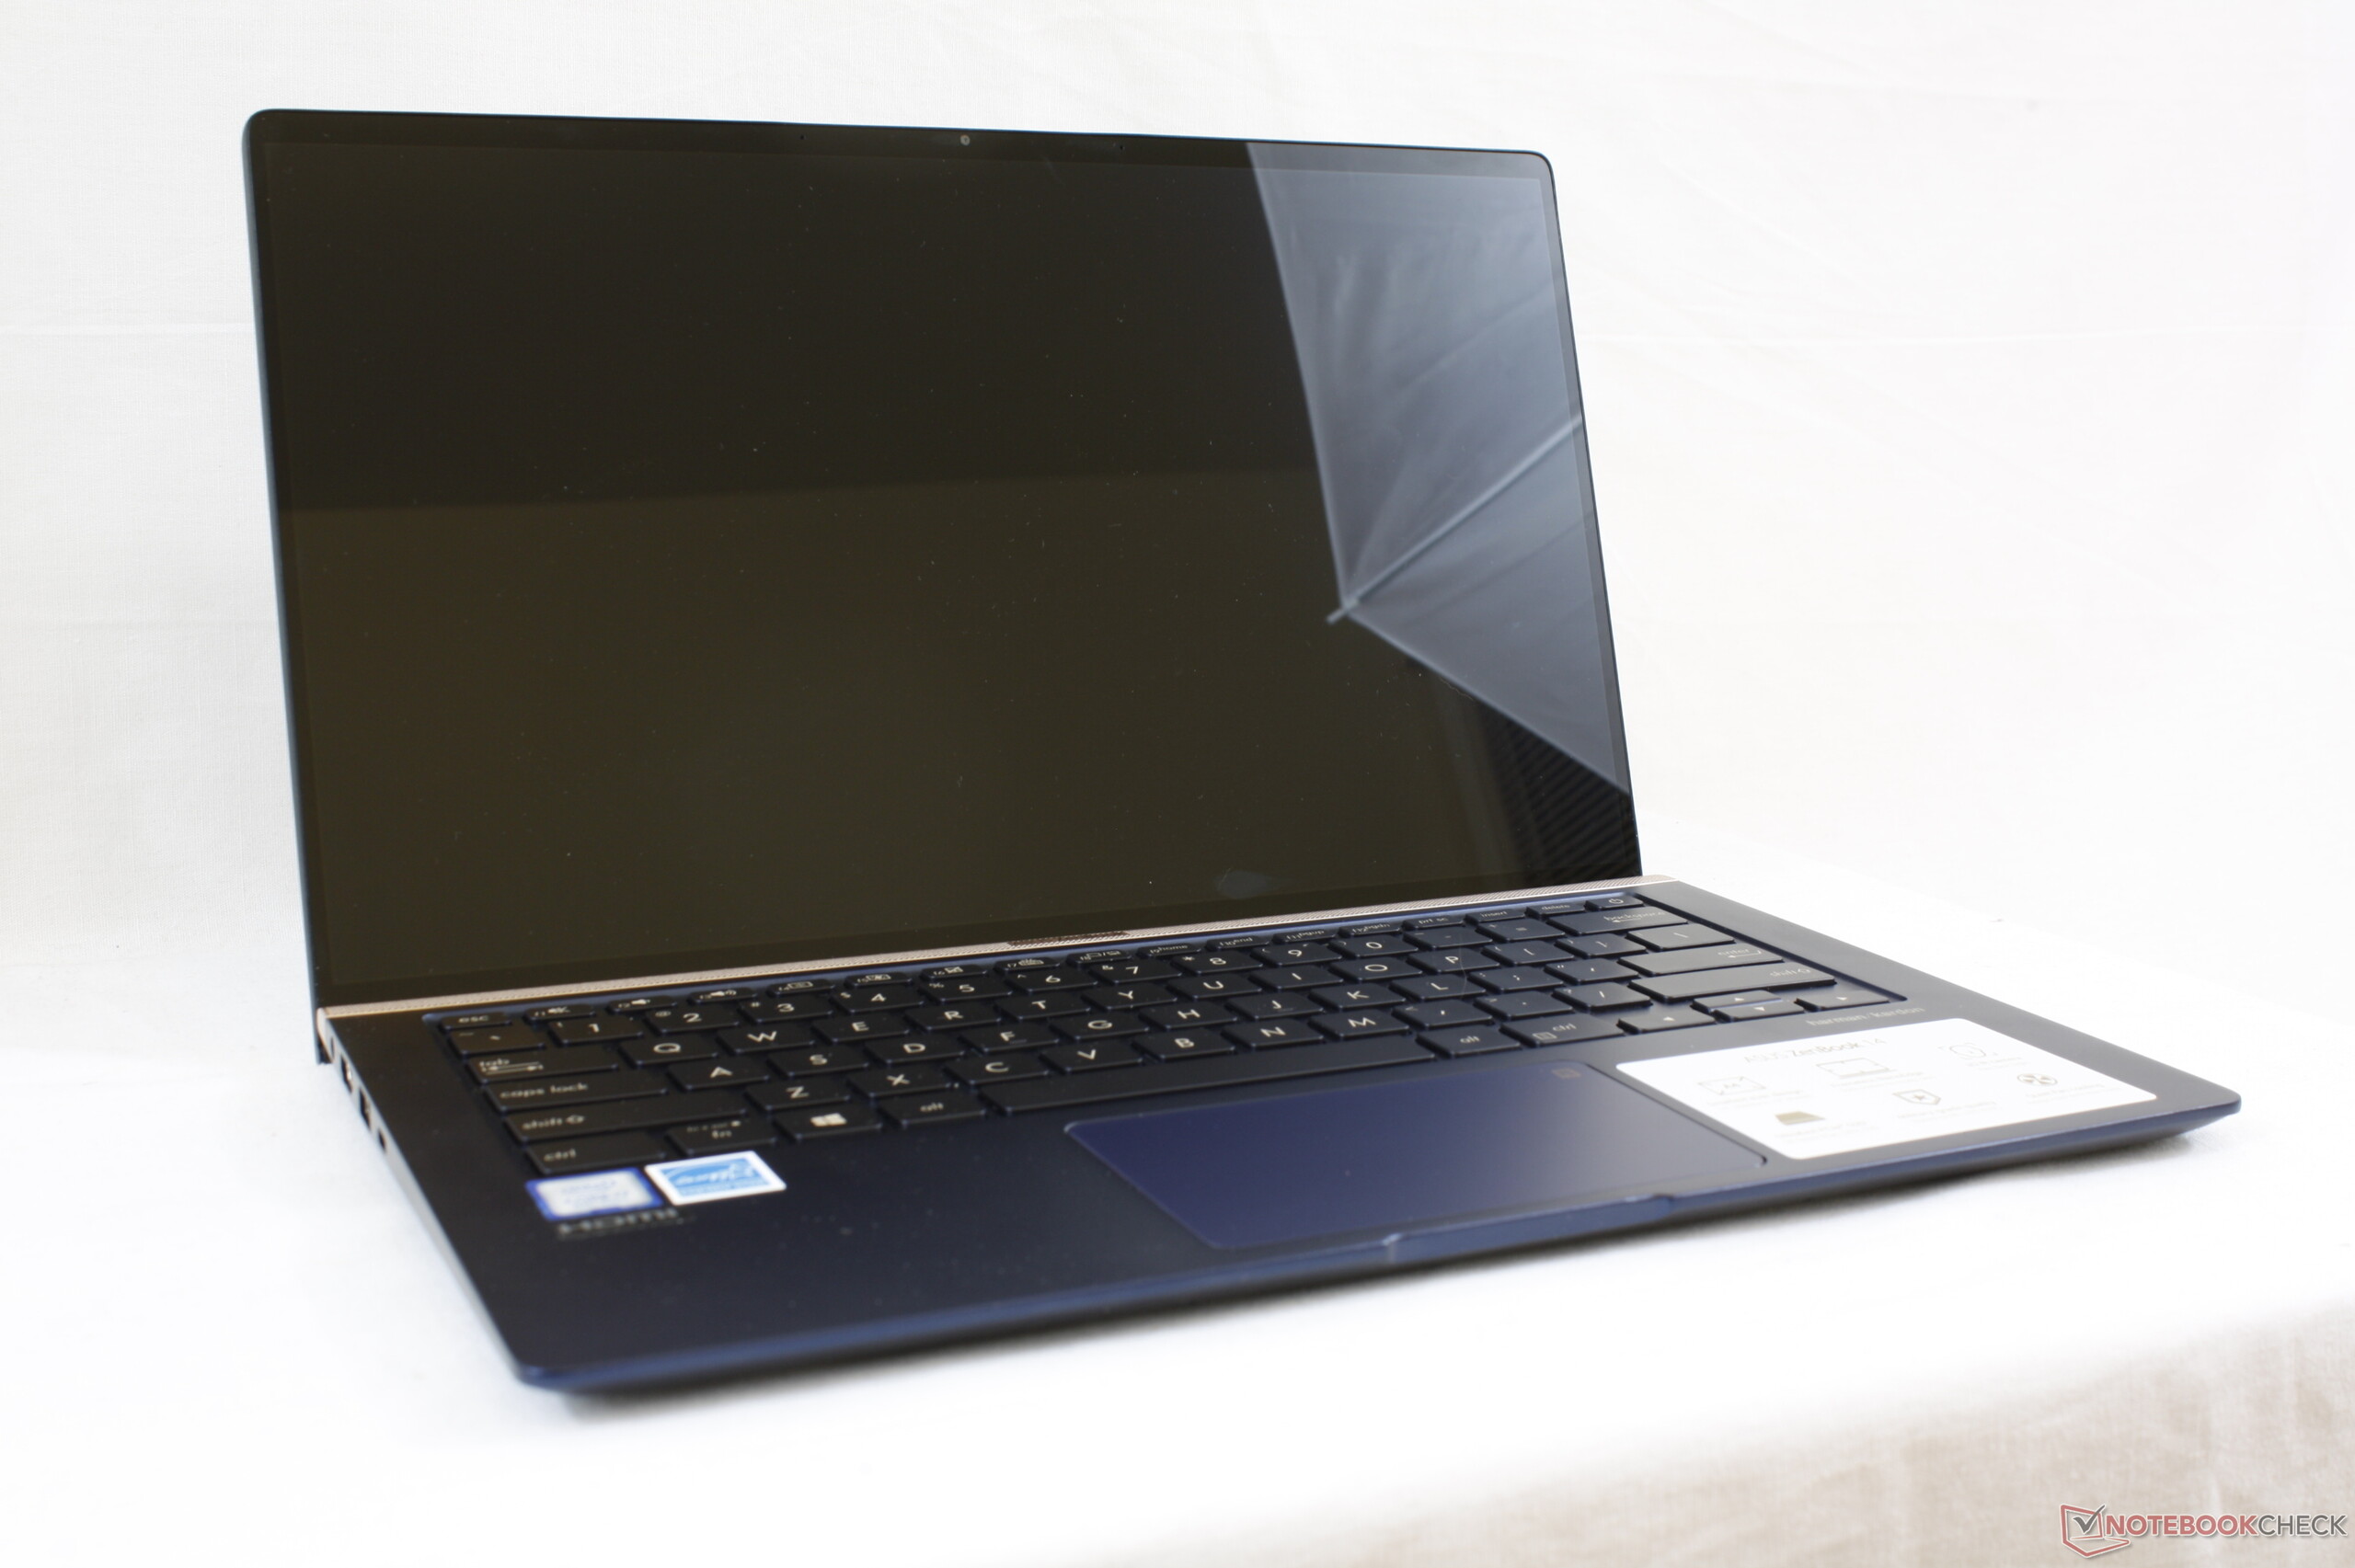
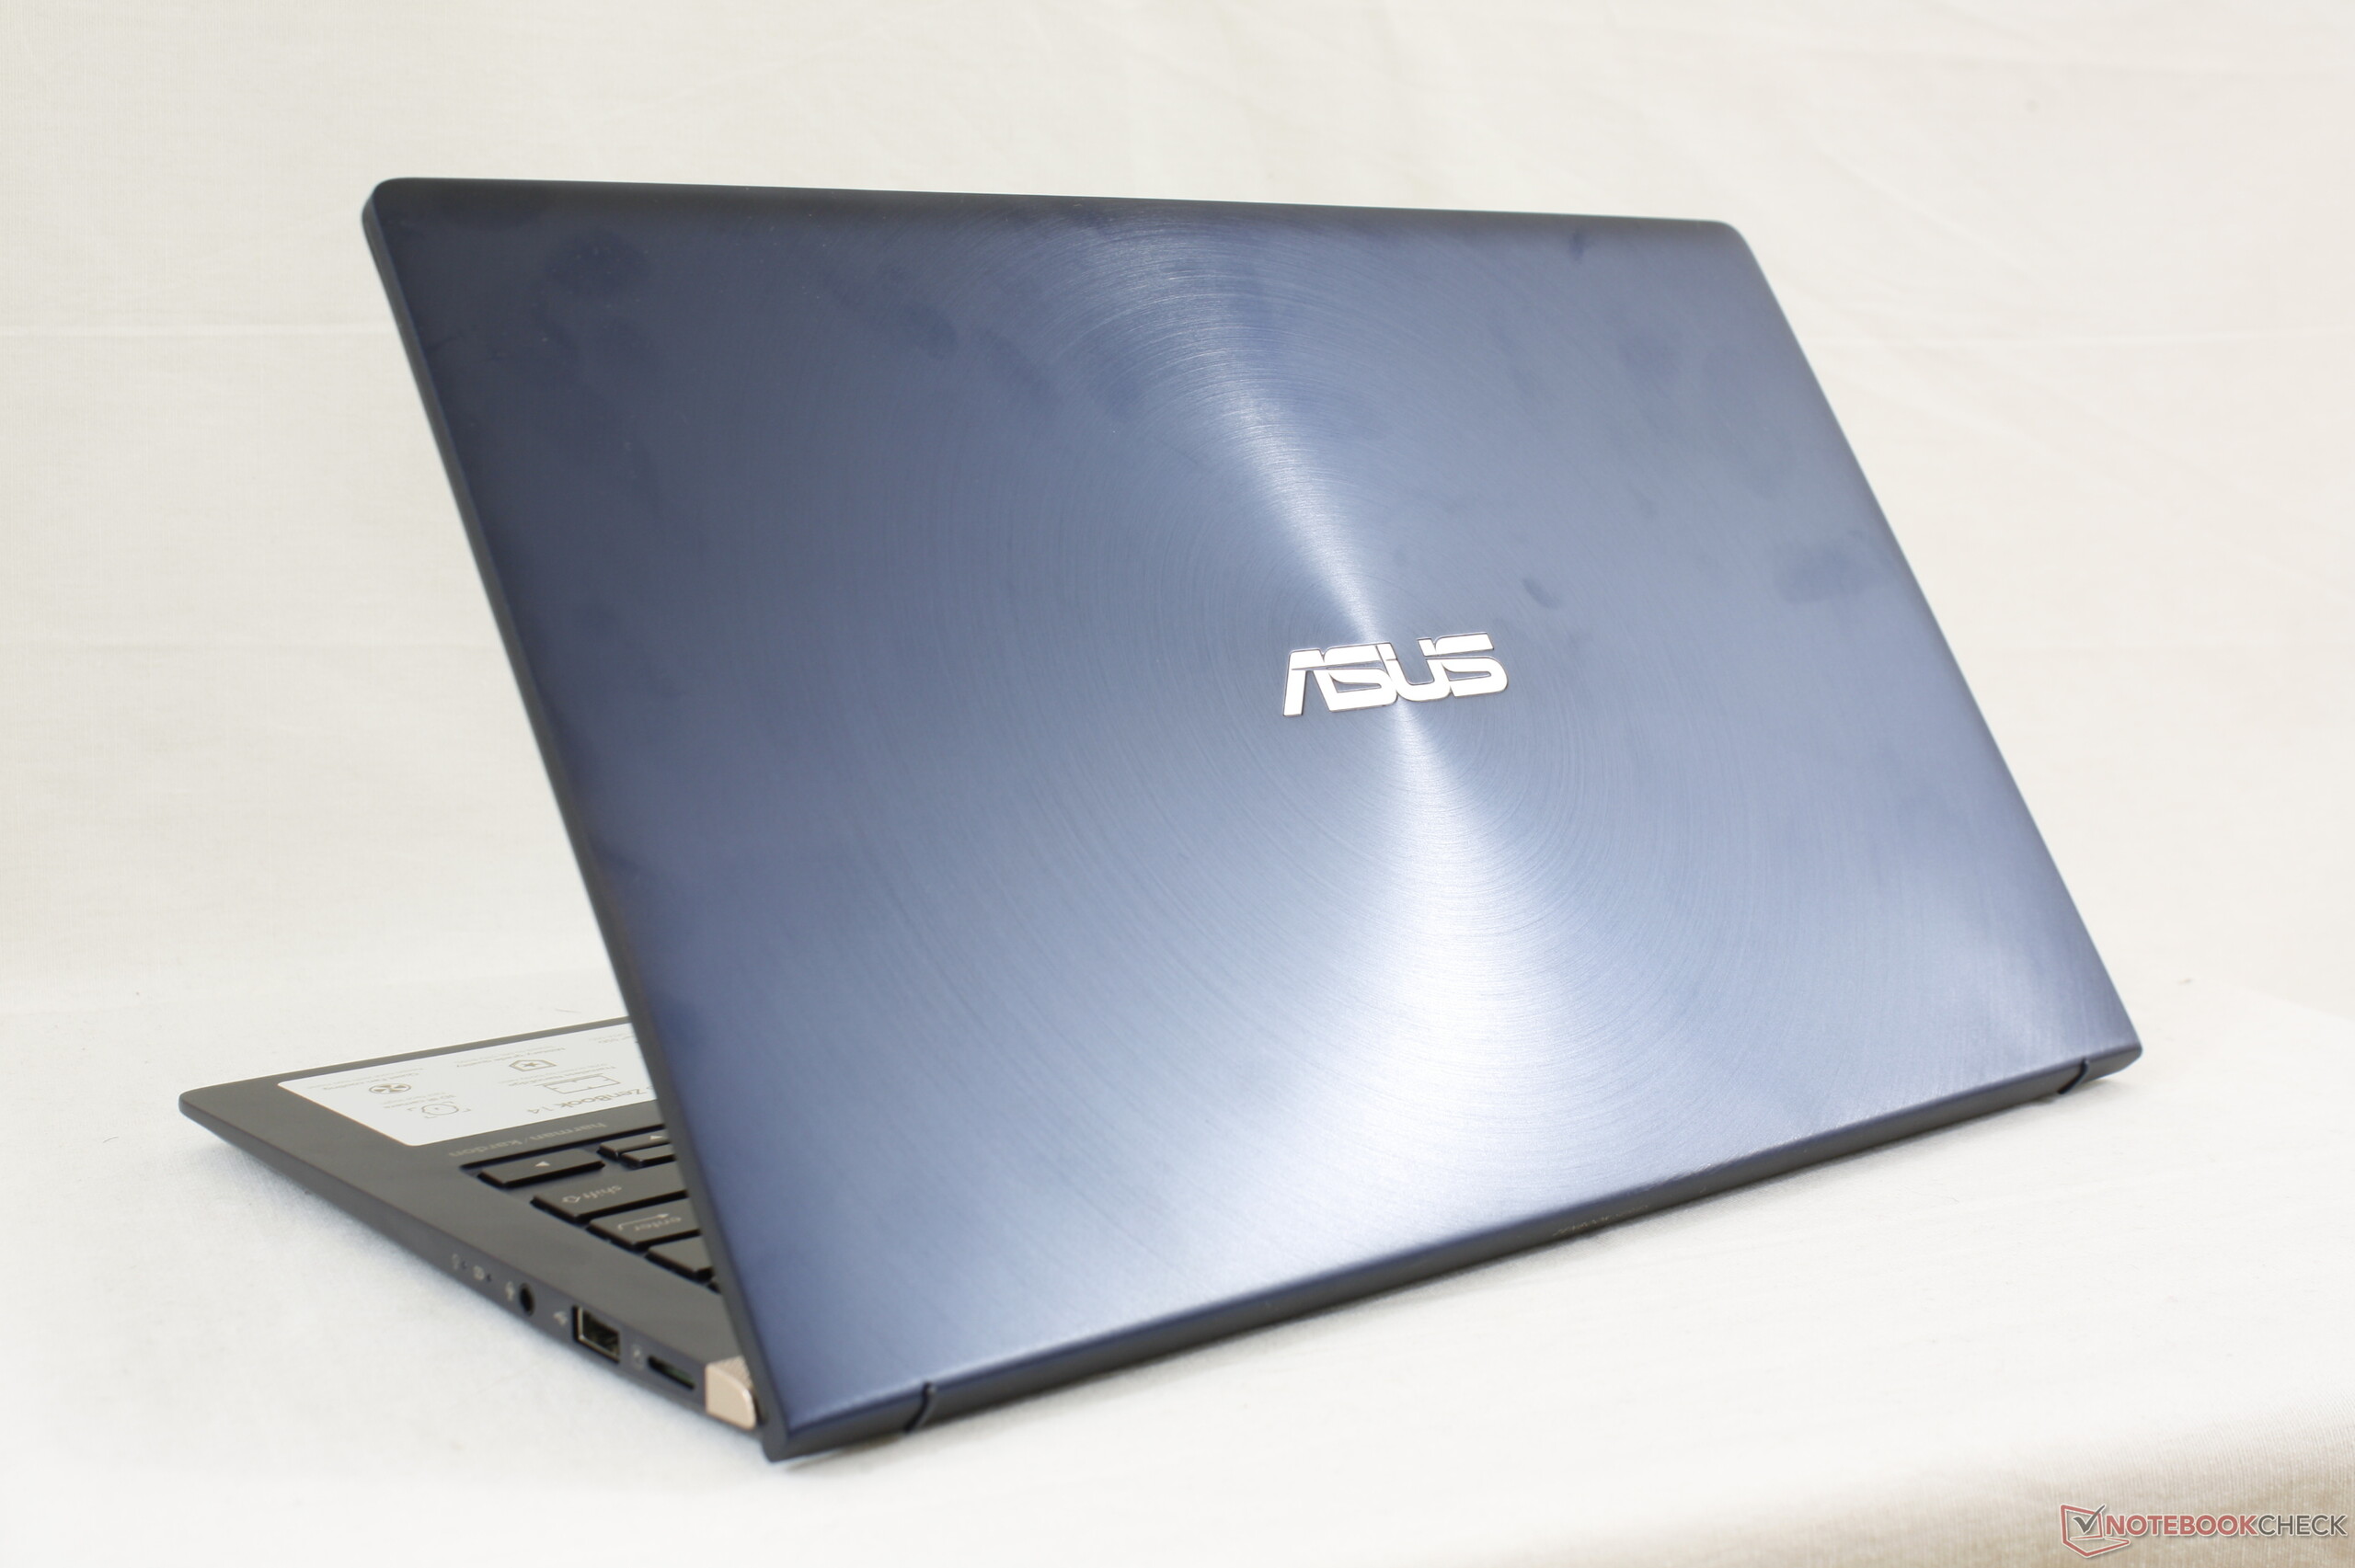
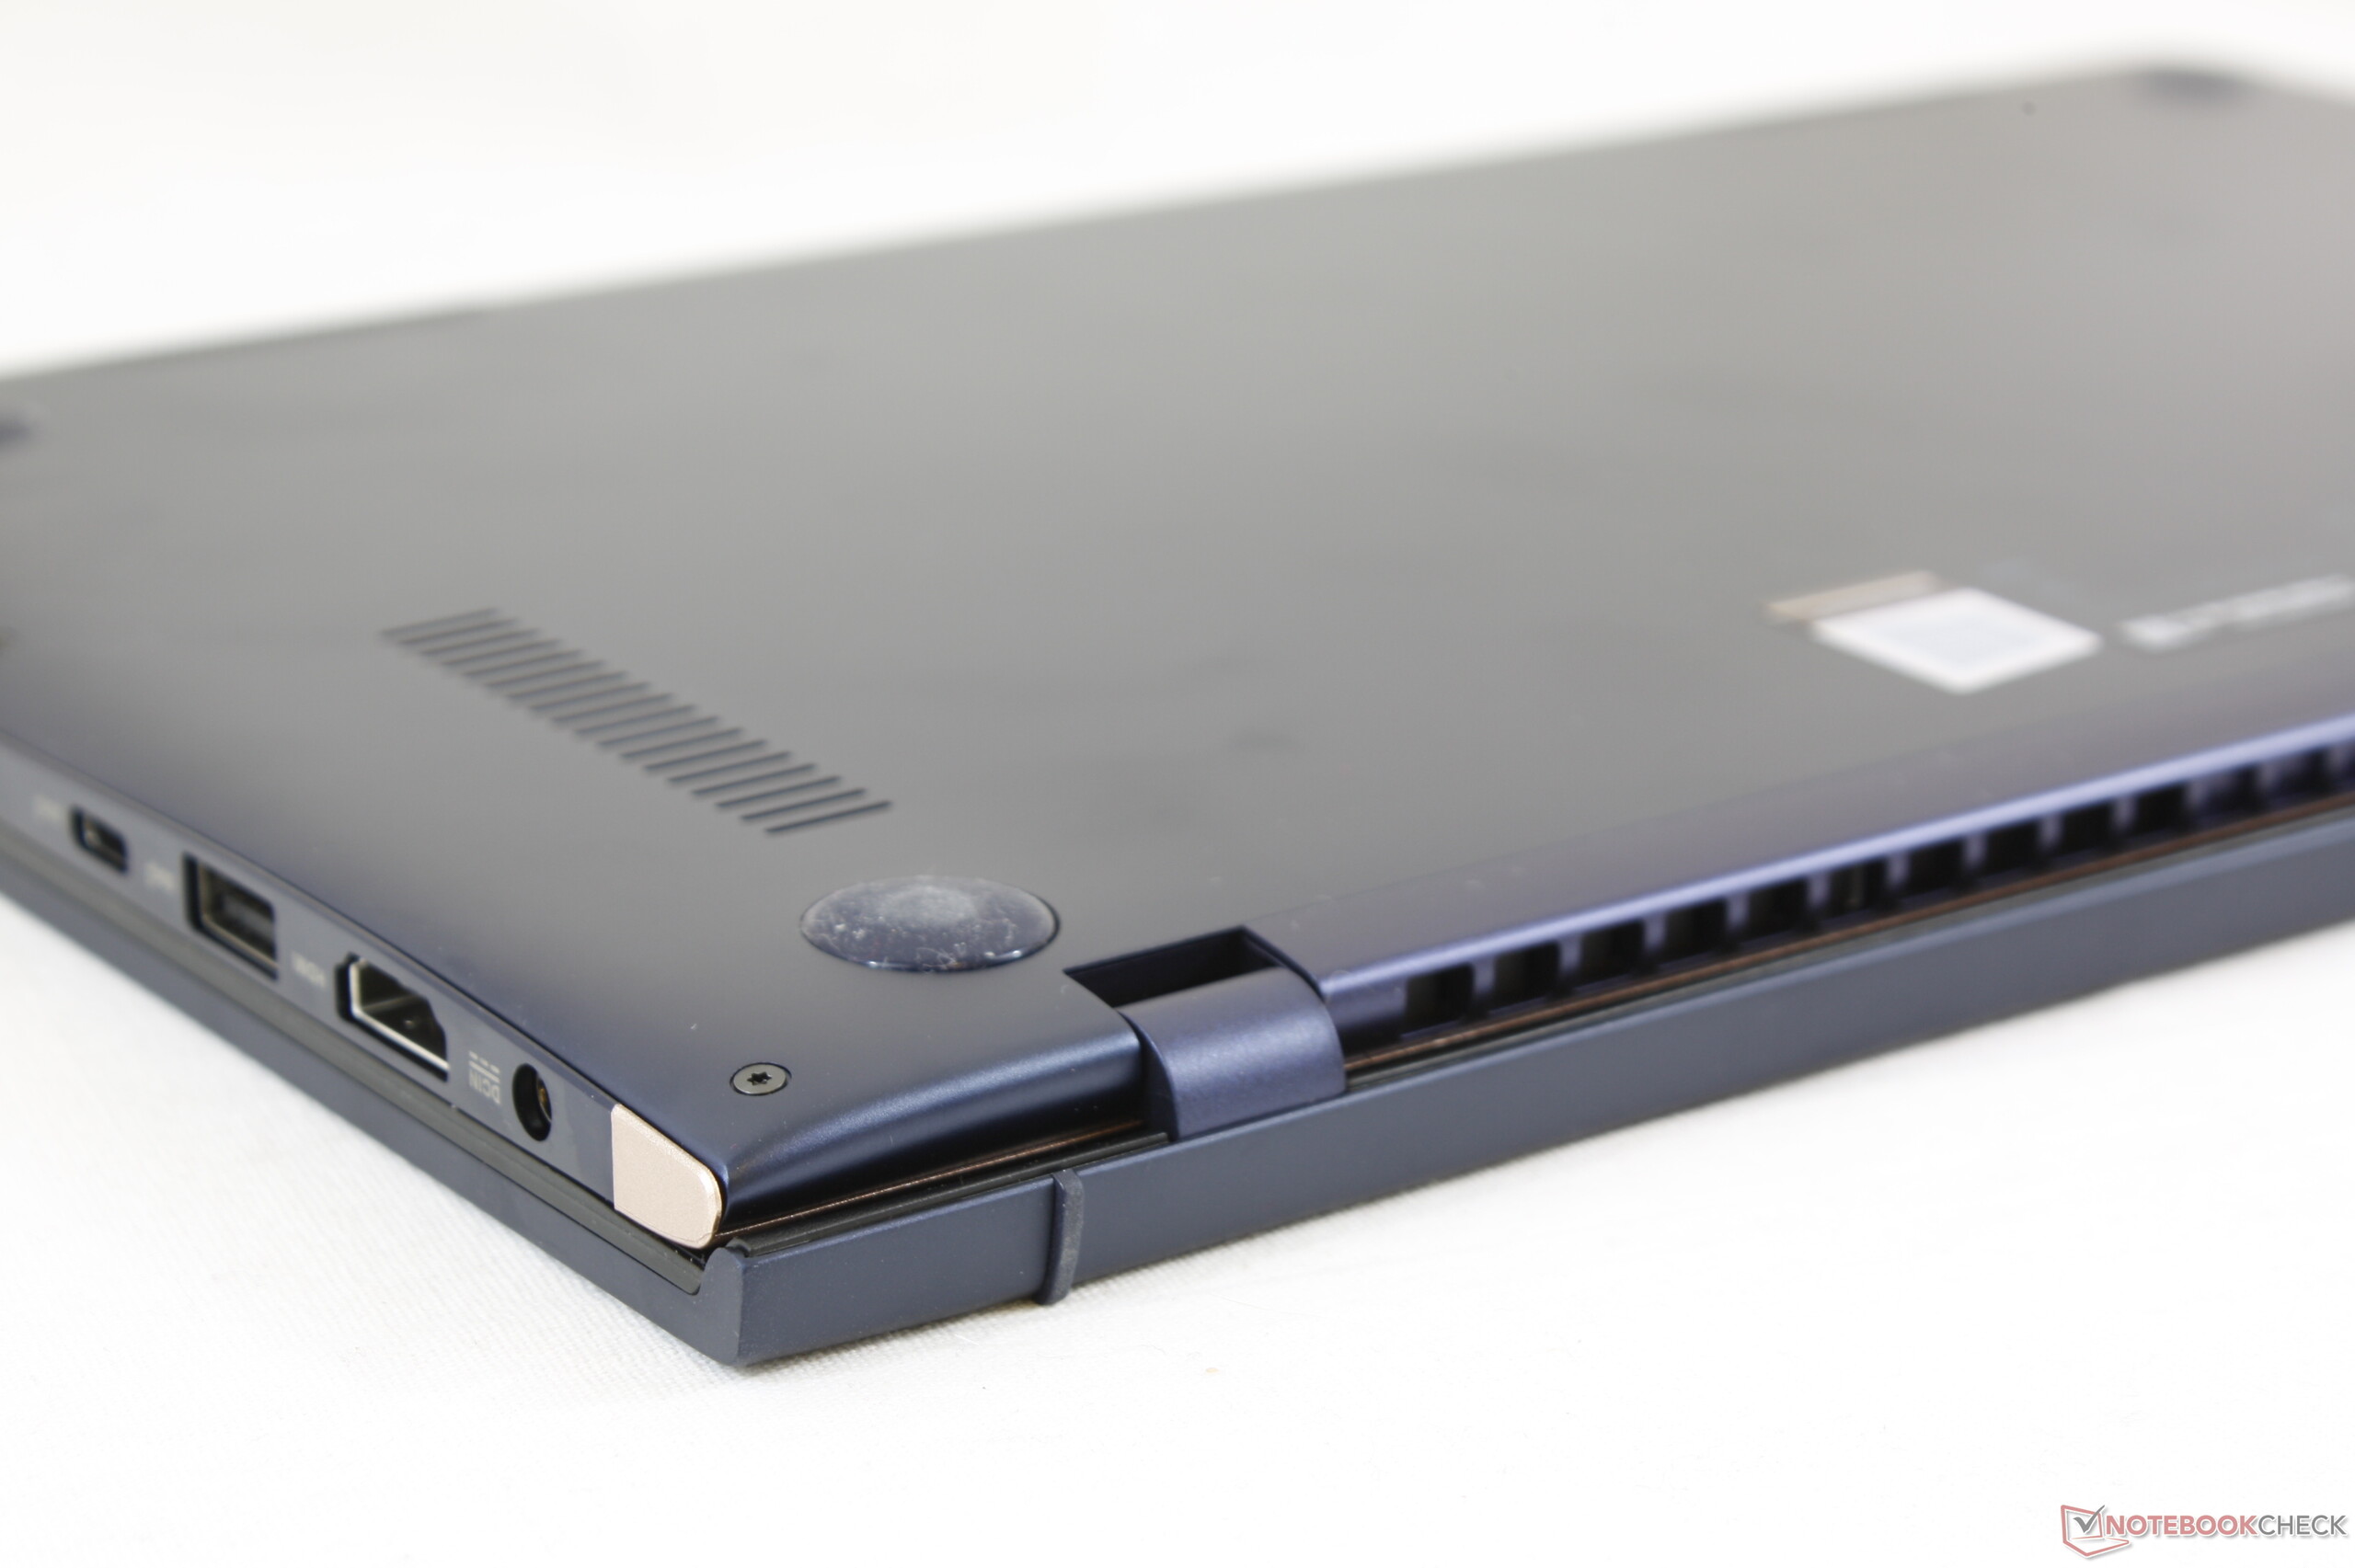
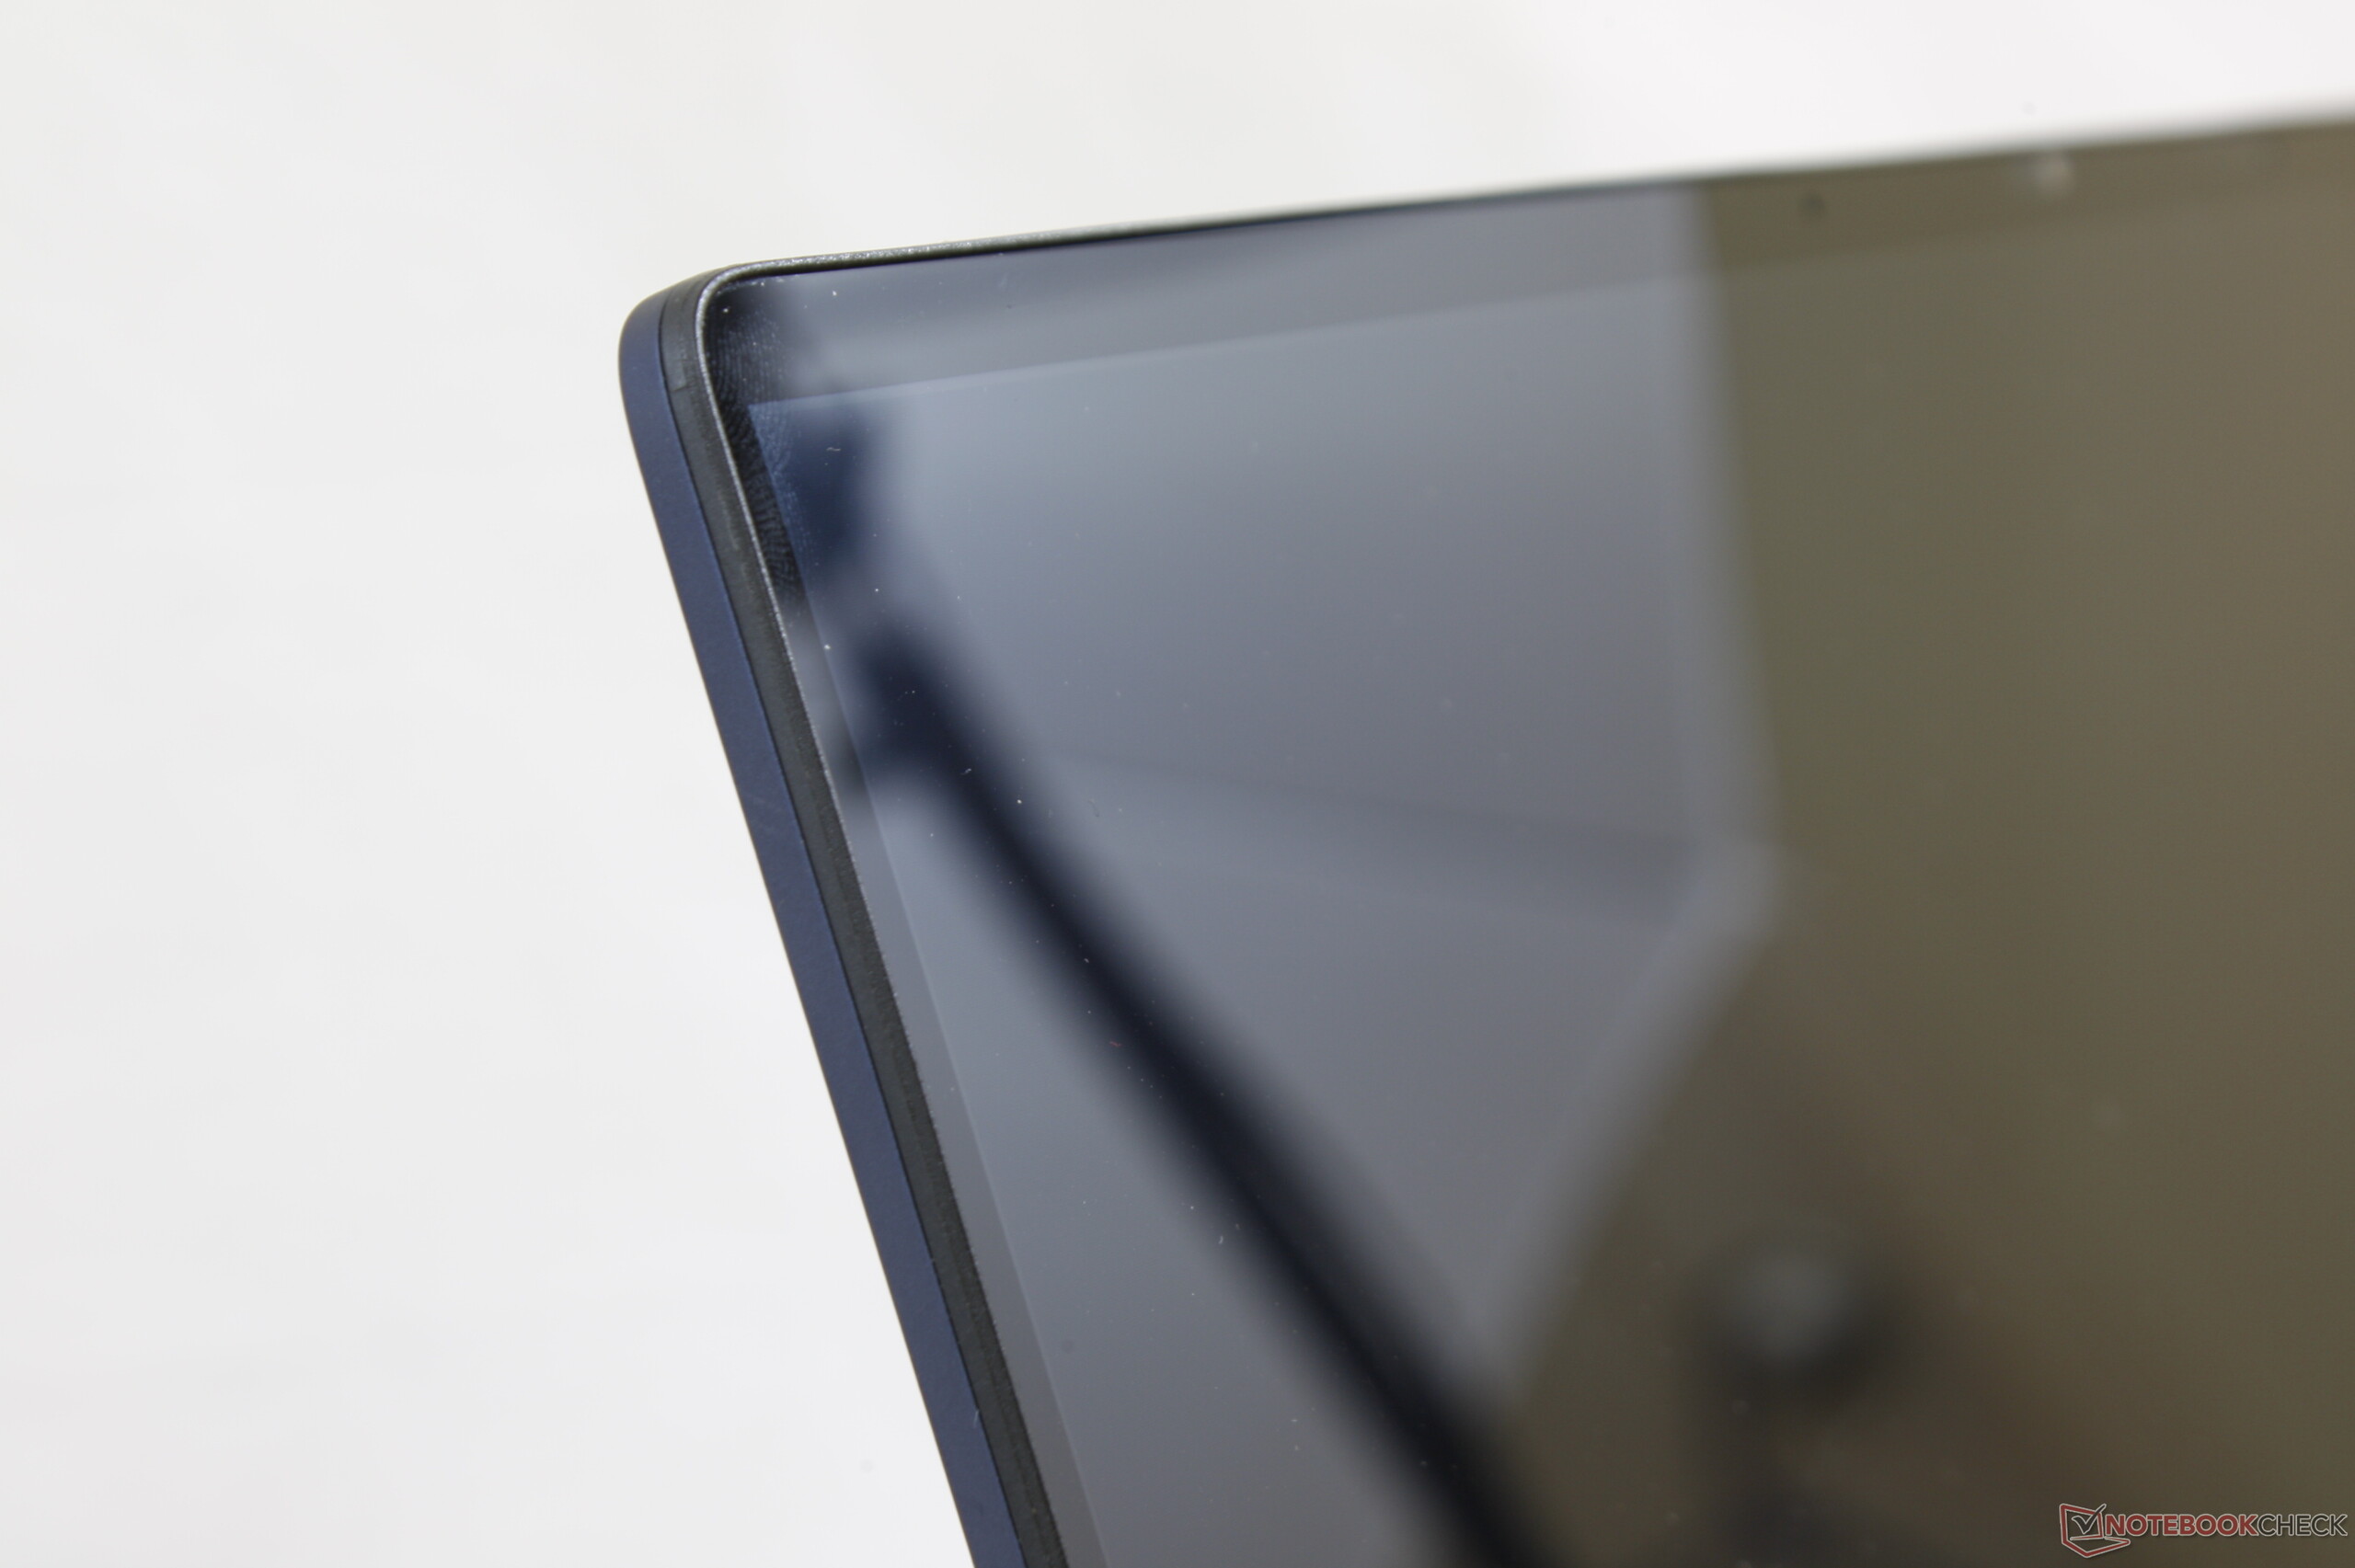
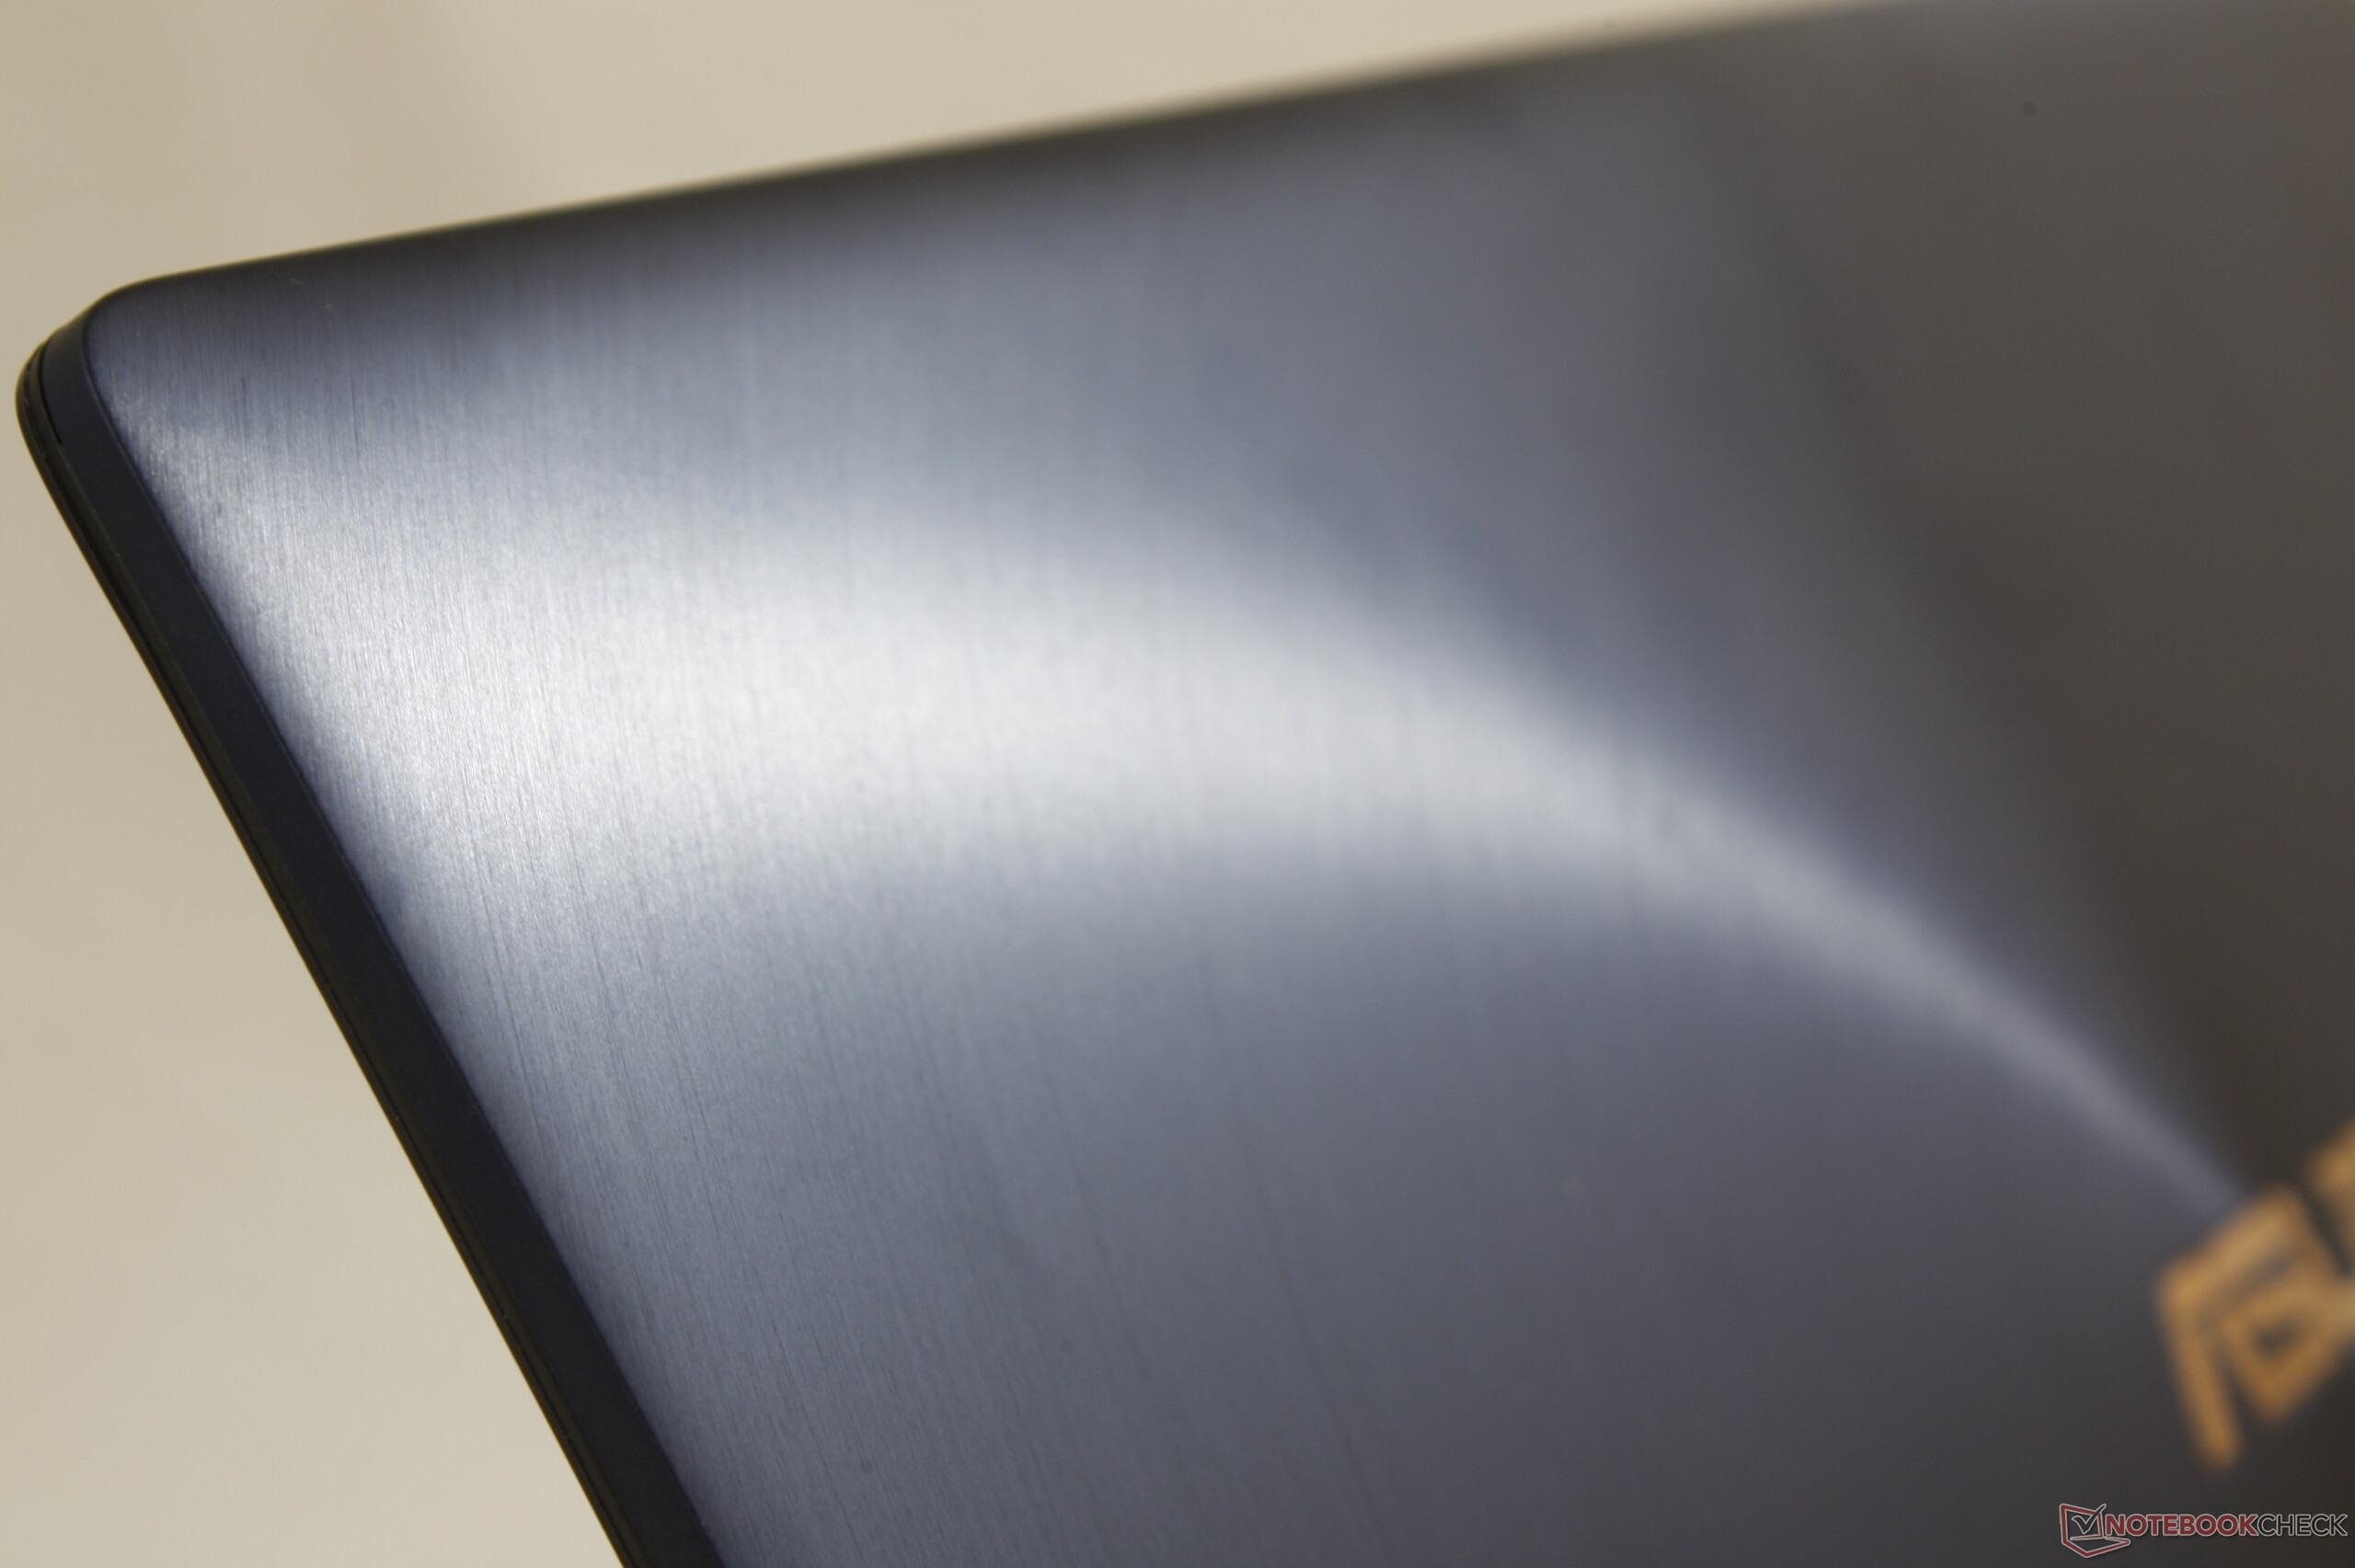
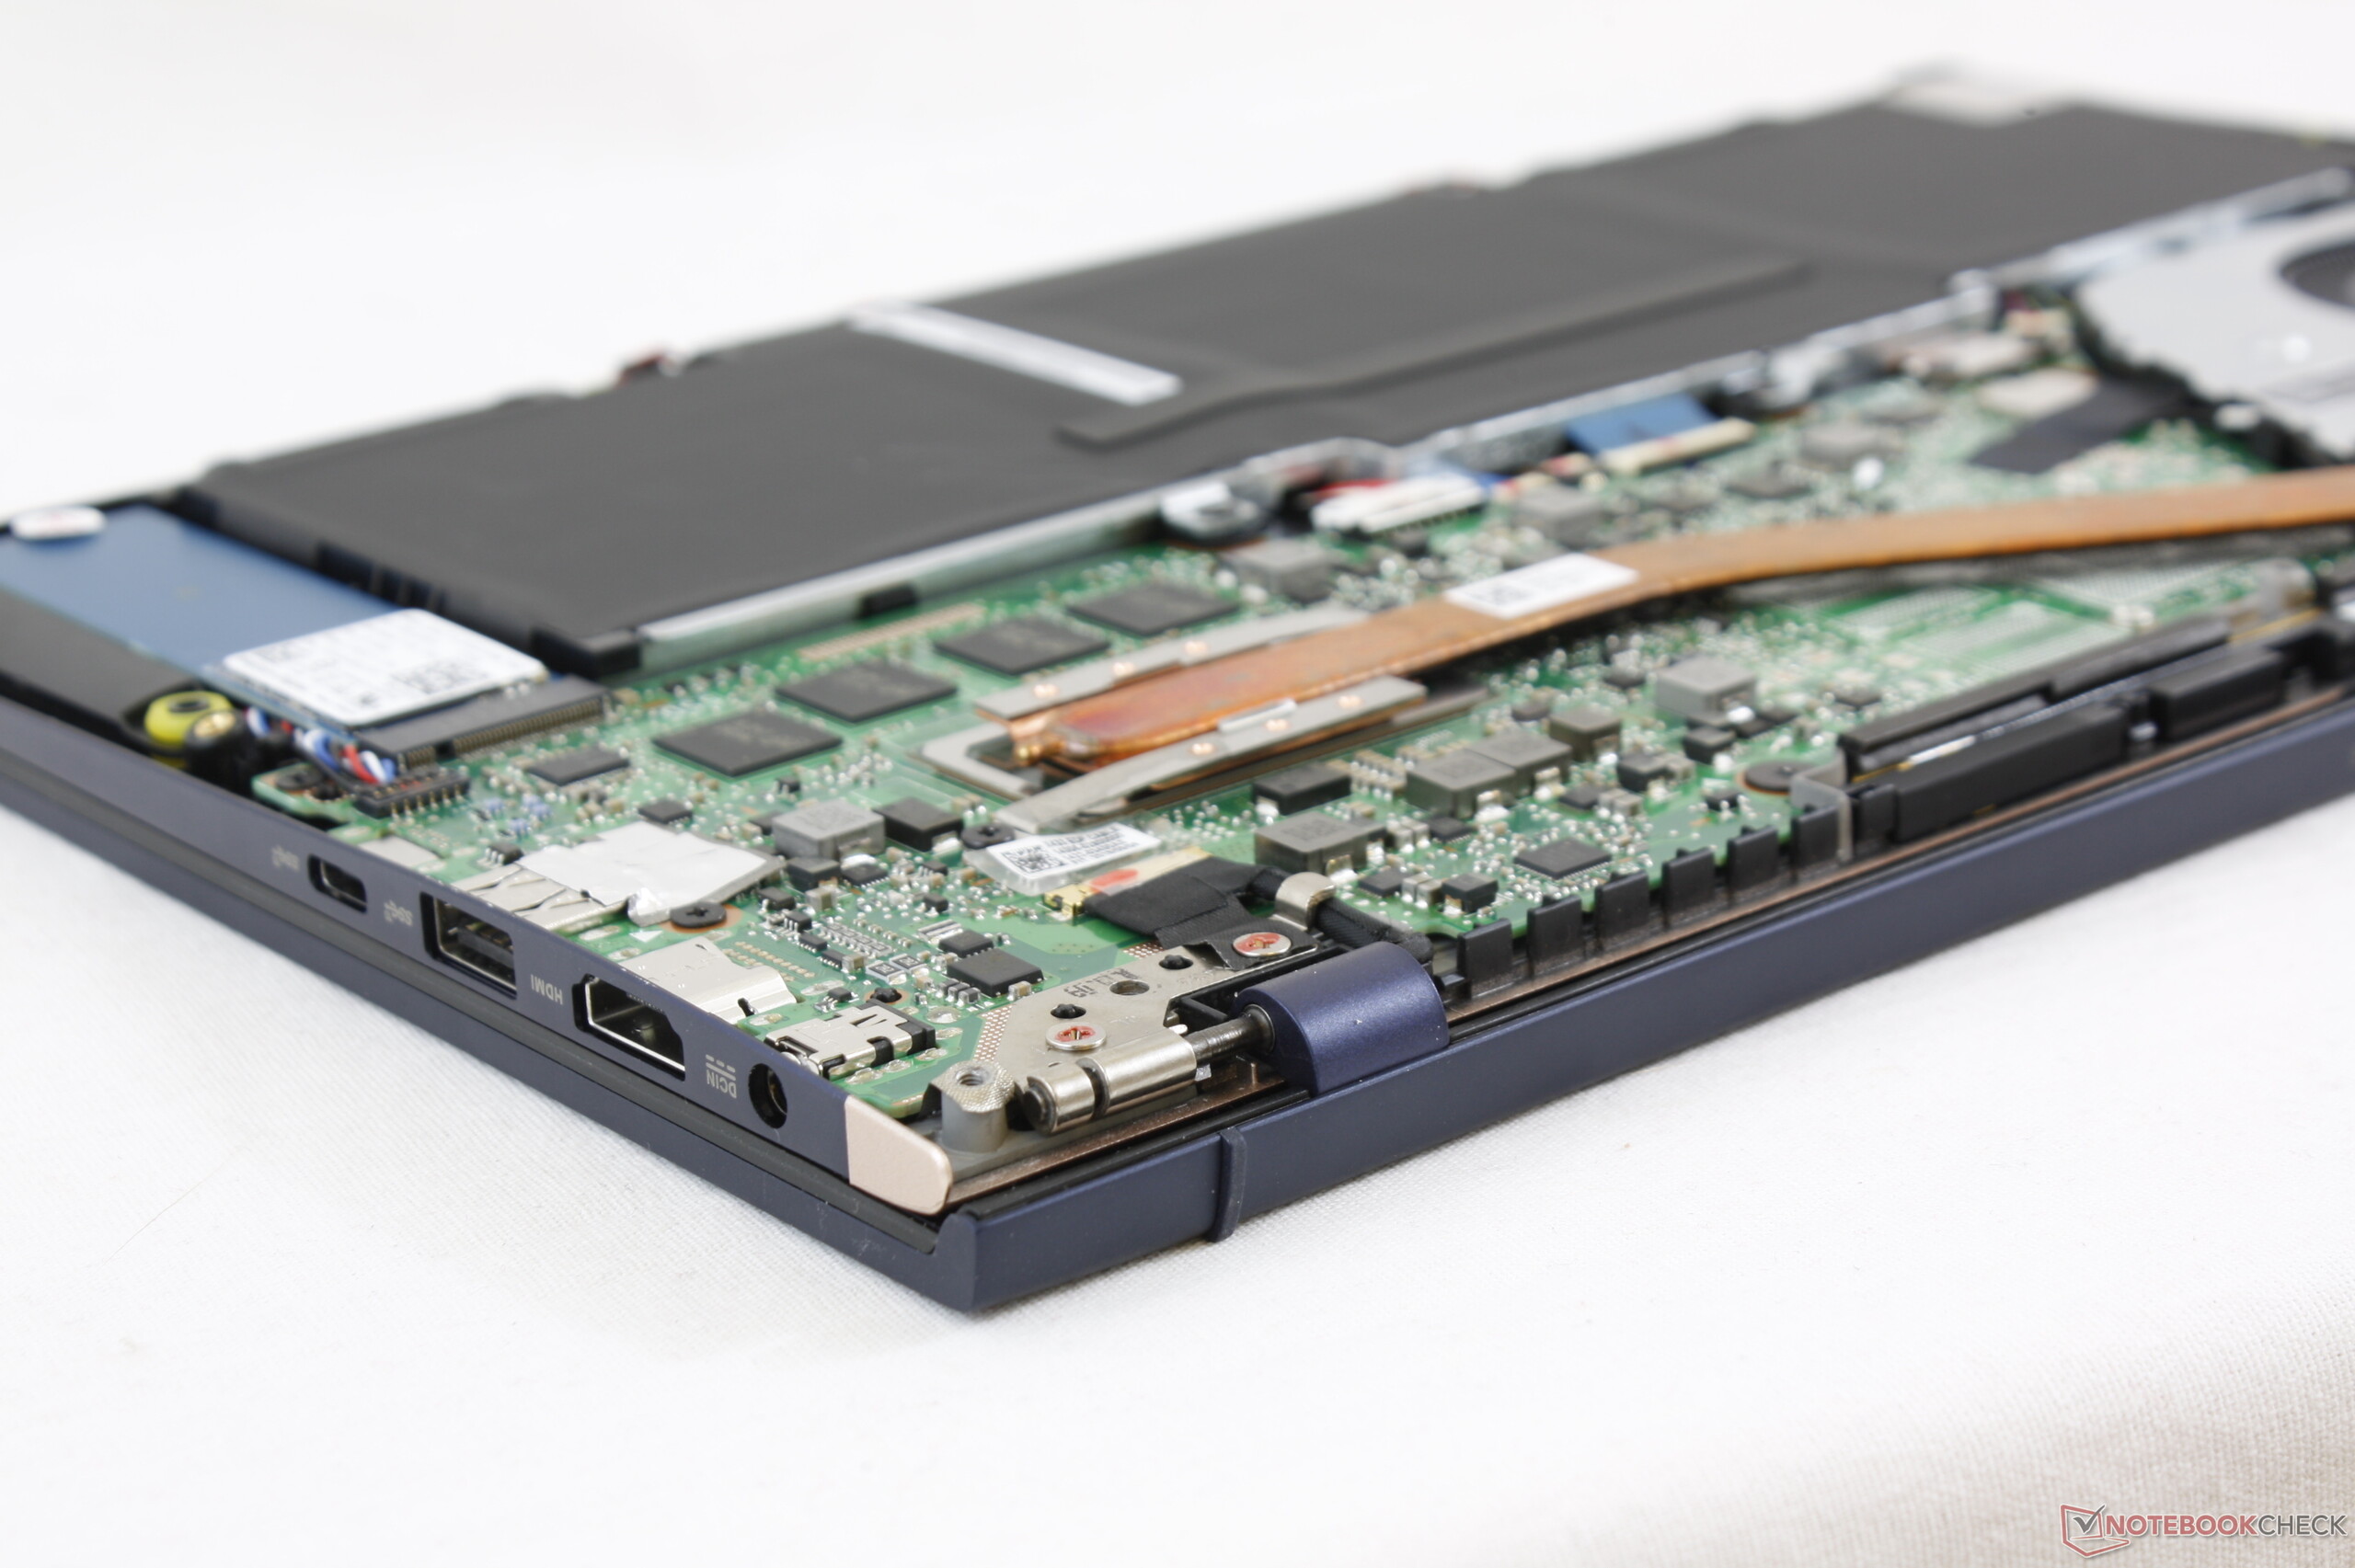
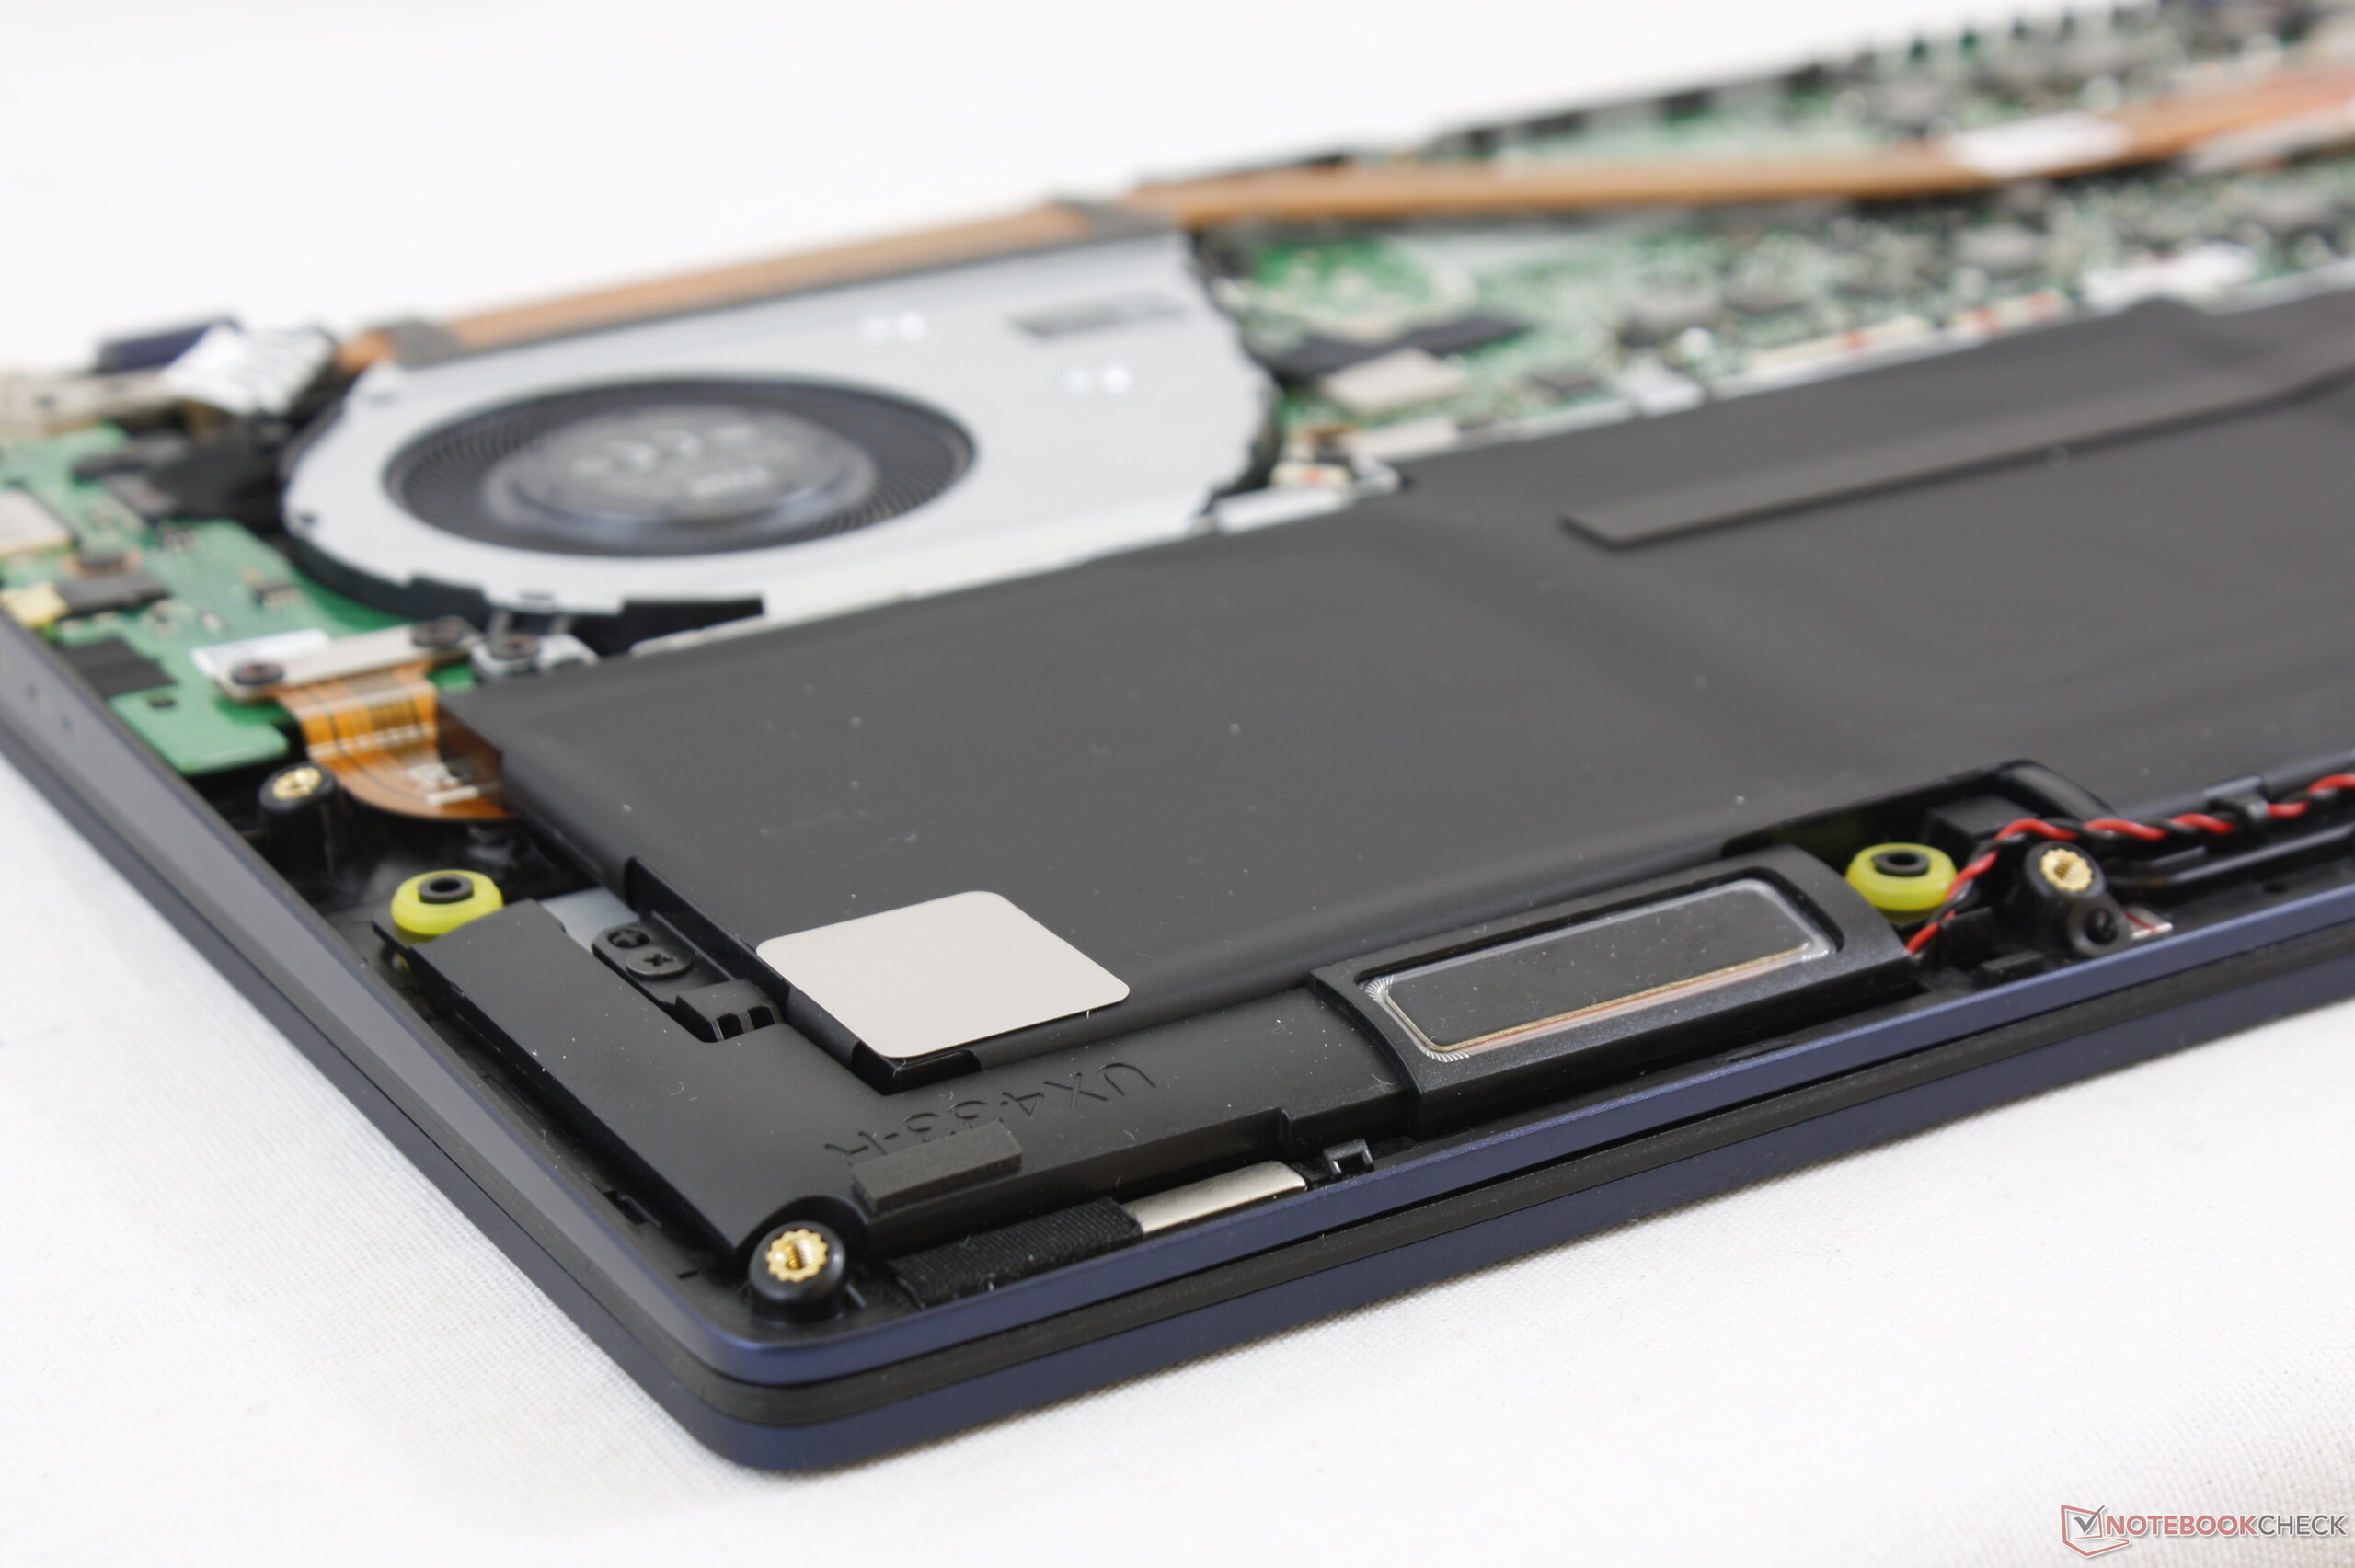
O mercado de Ultrabooks tem crescido constantemente em termos de opções e está se tornando mais desafiador para os OEMs se diferenciarem uns dos outros. Mesmo assim, a Asus ainda consegue nos surpreender com recursos exclusivos como o UX580 ScreenPad e agora os marcos NanoEdge de quatro lados que dão ao UX433 um formato muito pequeno para o tamanho de tela de 14 polegadas. O novo design é visualmente distinto e exclusivo Zenbook, melhorando a rigidez e conectividade da última geração. É uma atualização evolutiva que passamos a esperar, mas com uma característica que é visualmente impressionante e ergonômica.
Nós apreciamos especialmente que o UX433 inclua opções mate anti refletivas e refletivas, e um eventual SKU GeForce MX150. A maioria dos Ultrabooks possui apenas telas refletivas e se limita a gráficos Intel integrados, mais lentos.
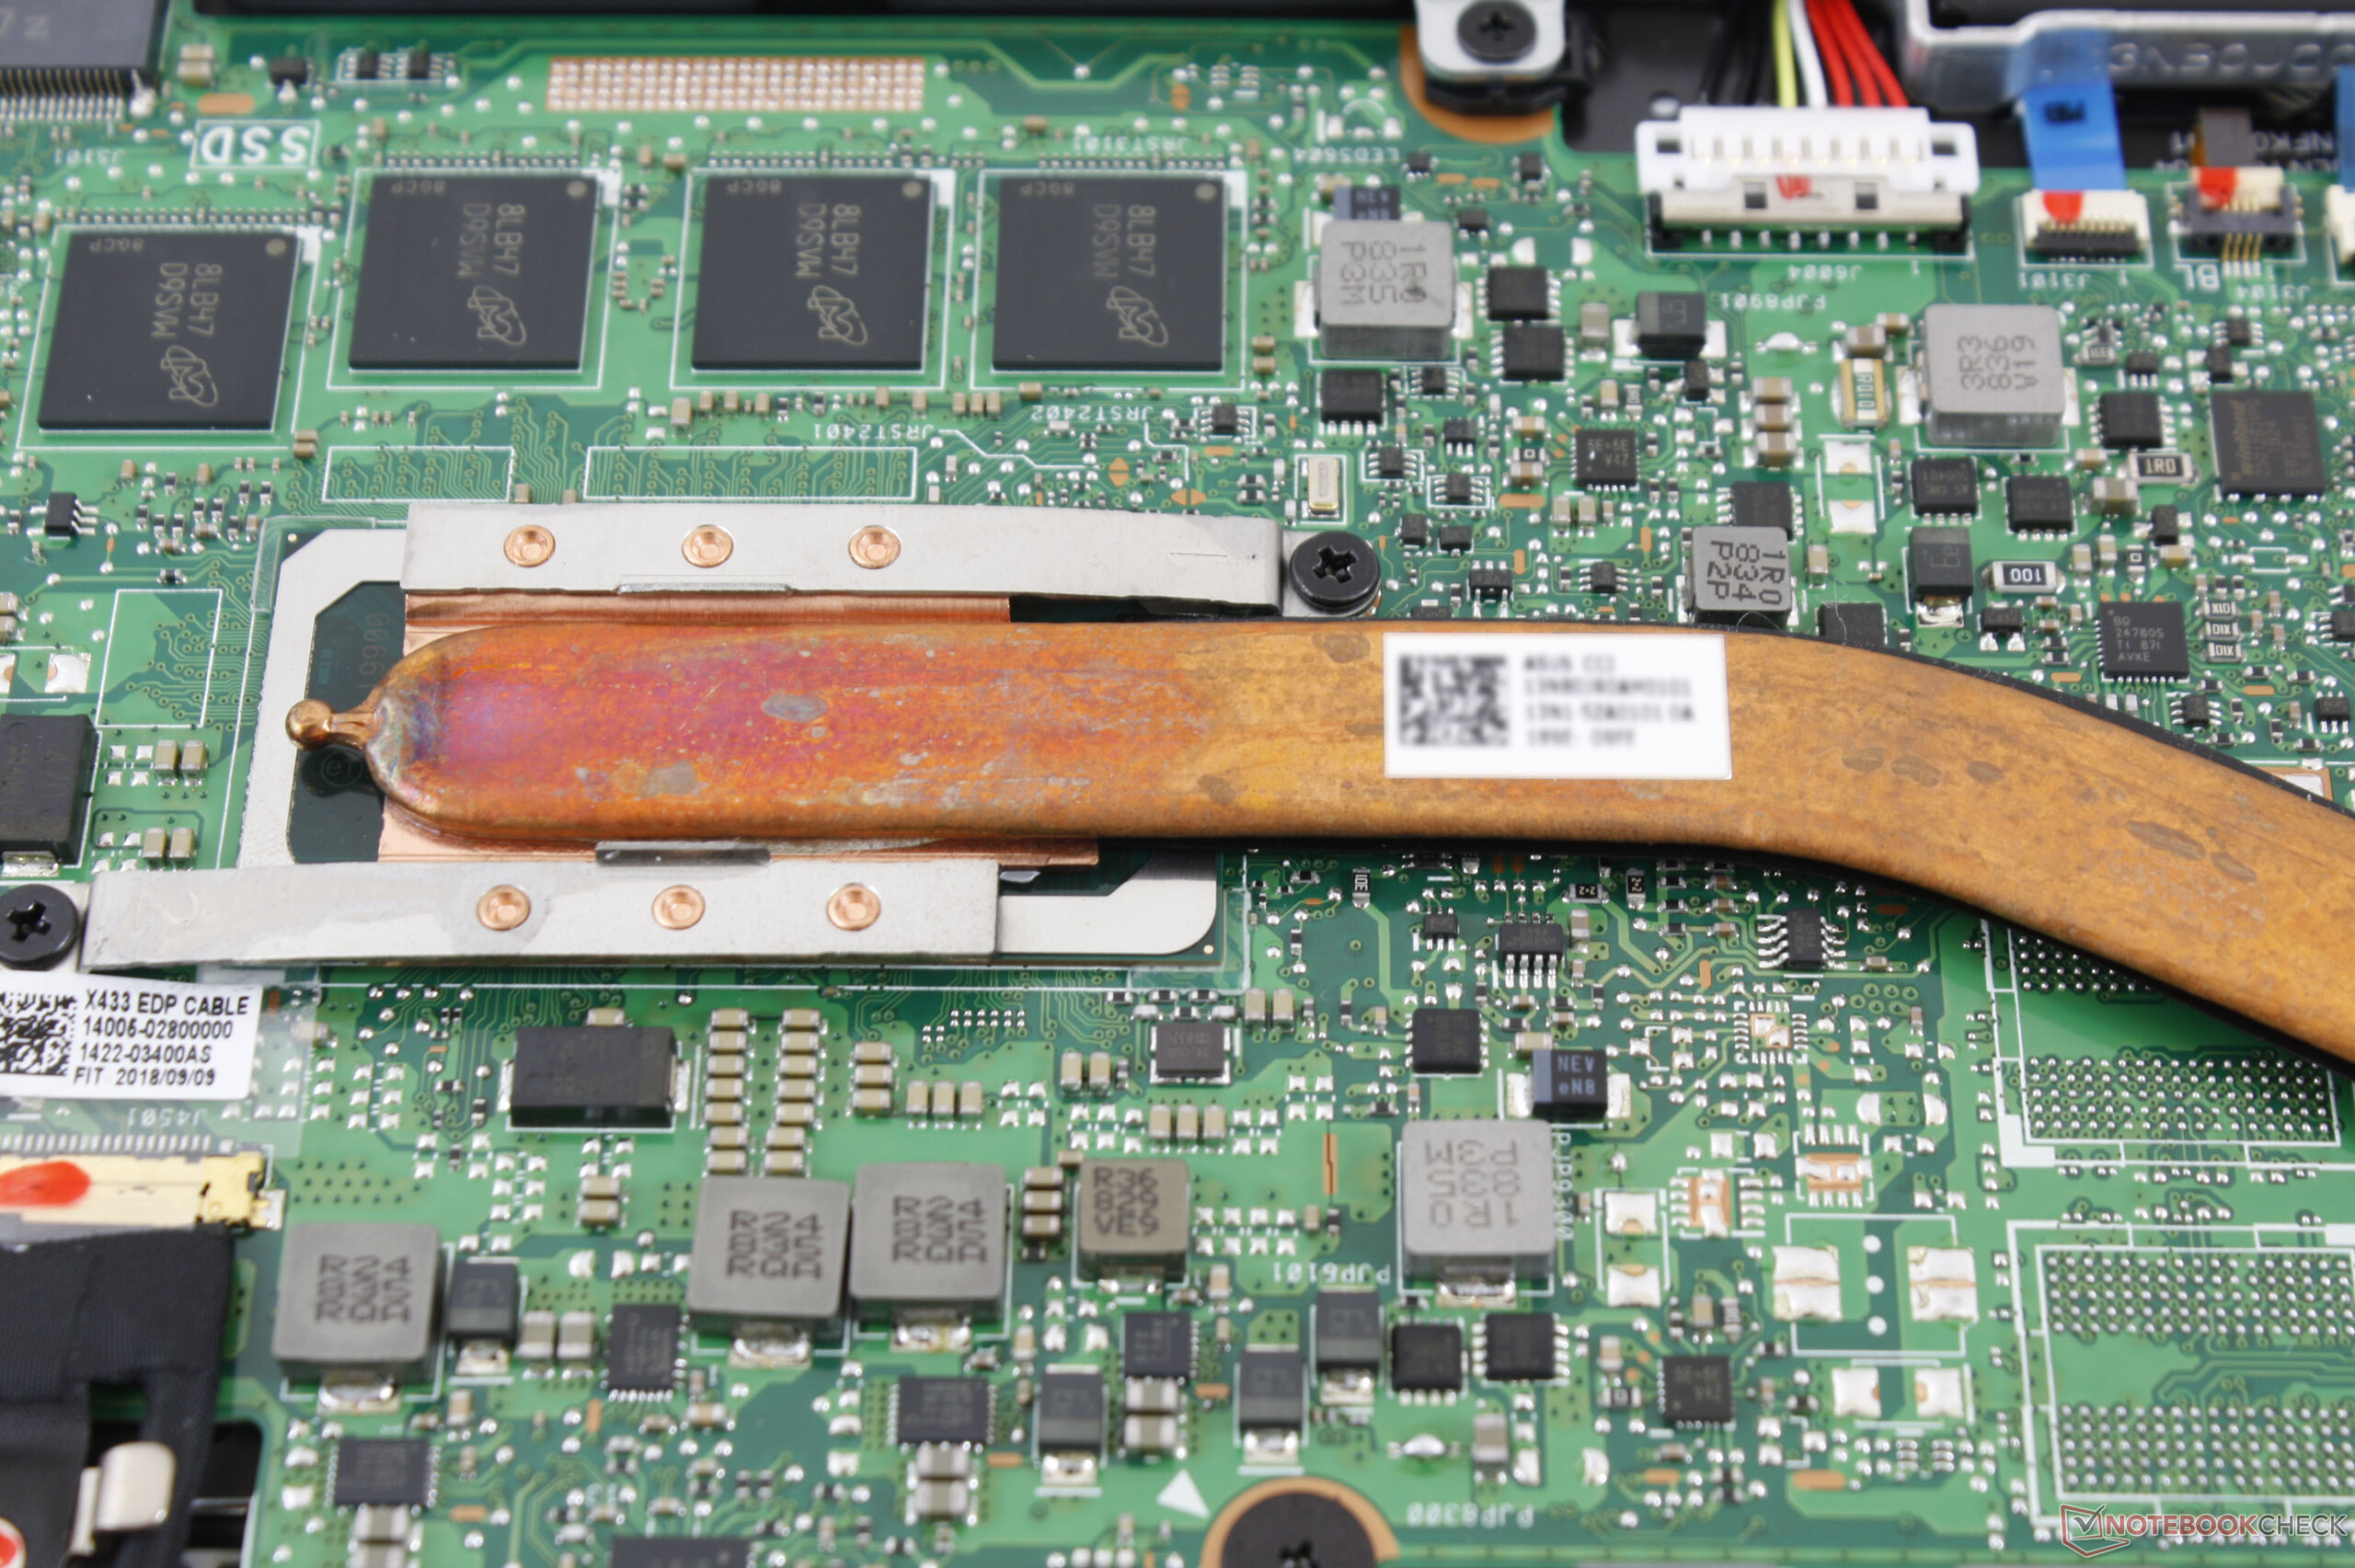
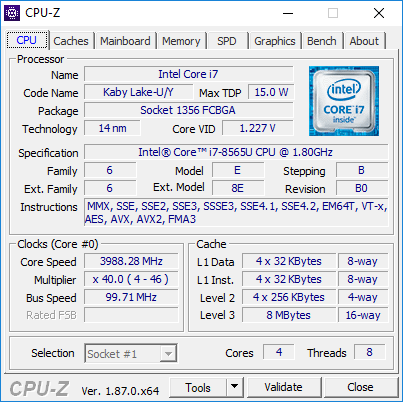
O recurso mais fraco do UX433 é o desempenho da CPU. Não é a velocidade que é decepcionante, mas é o quão marginal é a aceleração que o Whiskey Lake-U fornece sobre a 8ª geração do Kaby Lake-R, a ponto de os usuários provavelmente não perceberão nenhum ganho de desempenho. Até mesmo a Asus sabe disso, pois a página oficial do produto UX433 está comparando o Whiskey Lake-U com o Kaby Lake de 7ma ger. em vez do Kaby Lake-R de 8va ger., a fim de anunciar um salto maior no poder da CPU. Não podemos deixar de sentir que o sistema poderia ter sido mais barato e tão rápido quanto o i7-8550U ou o i5-8250U.
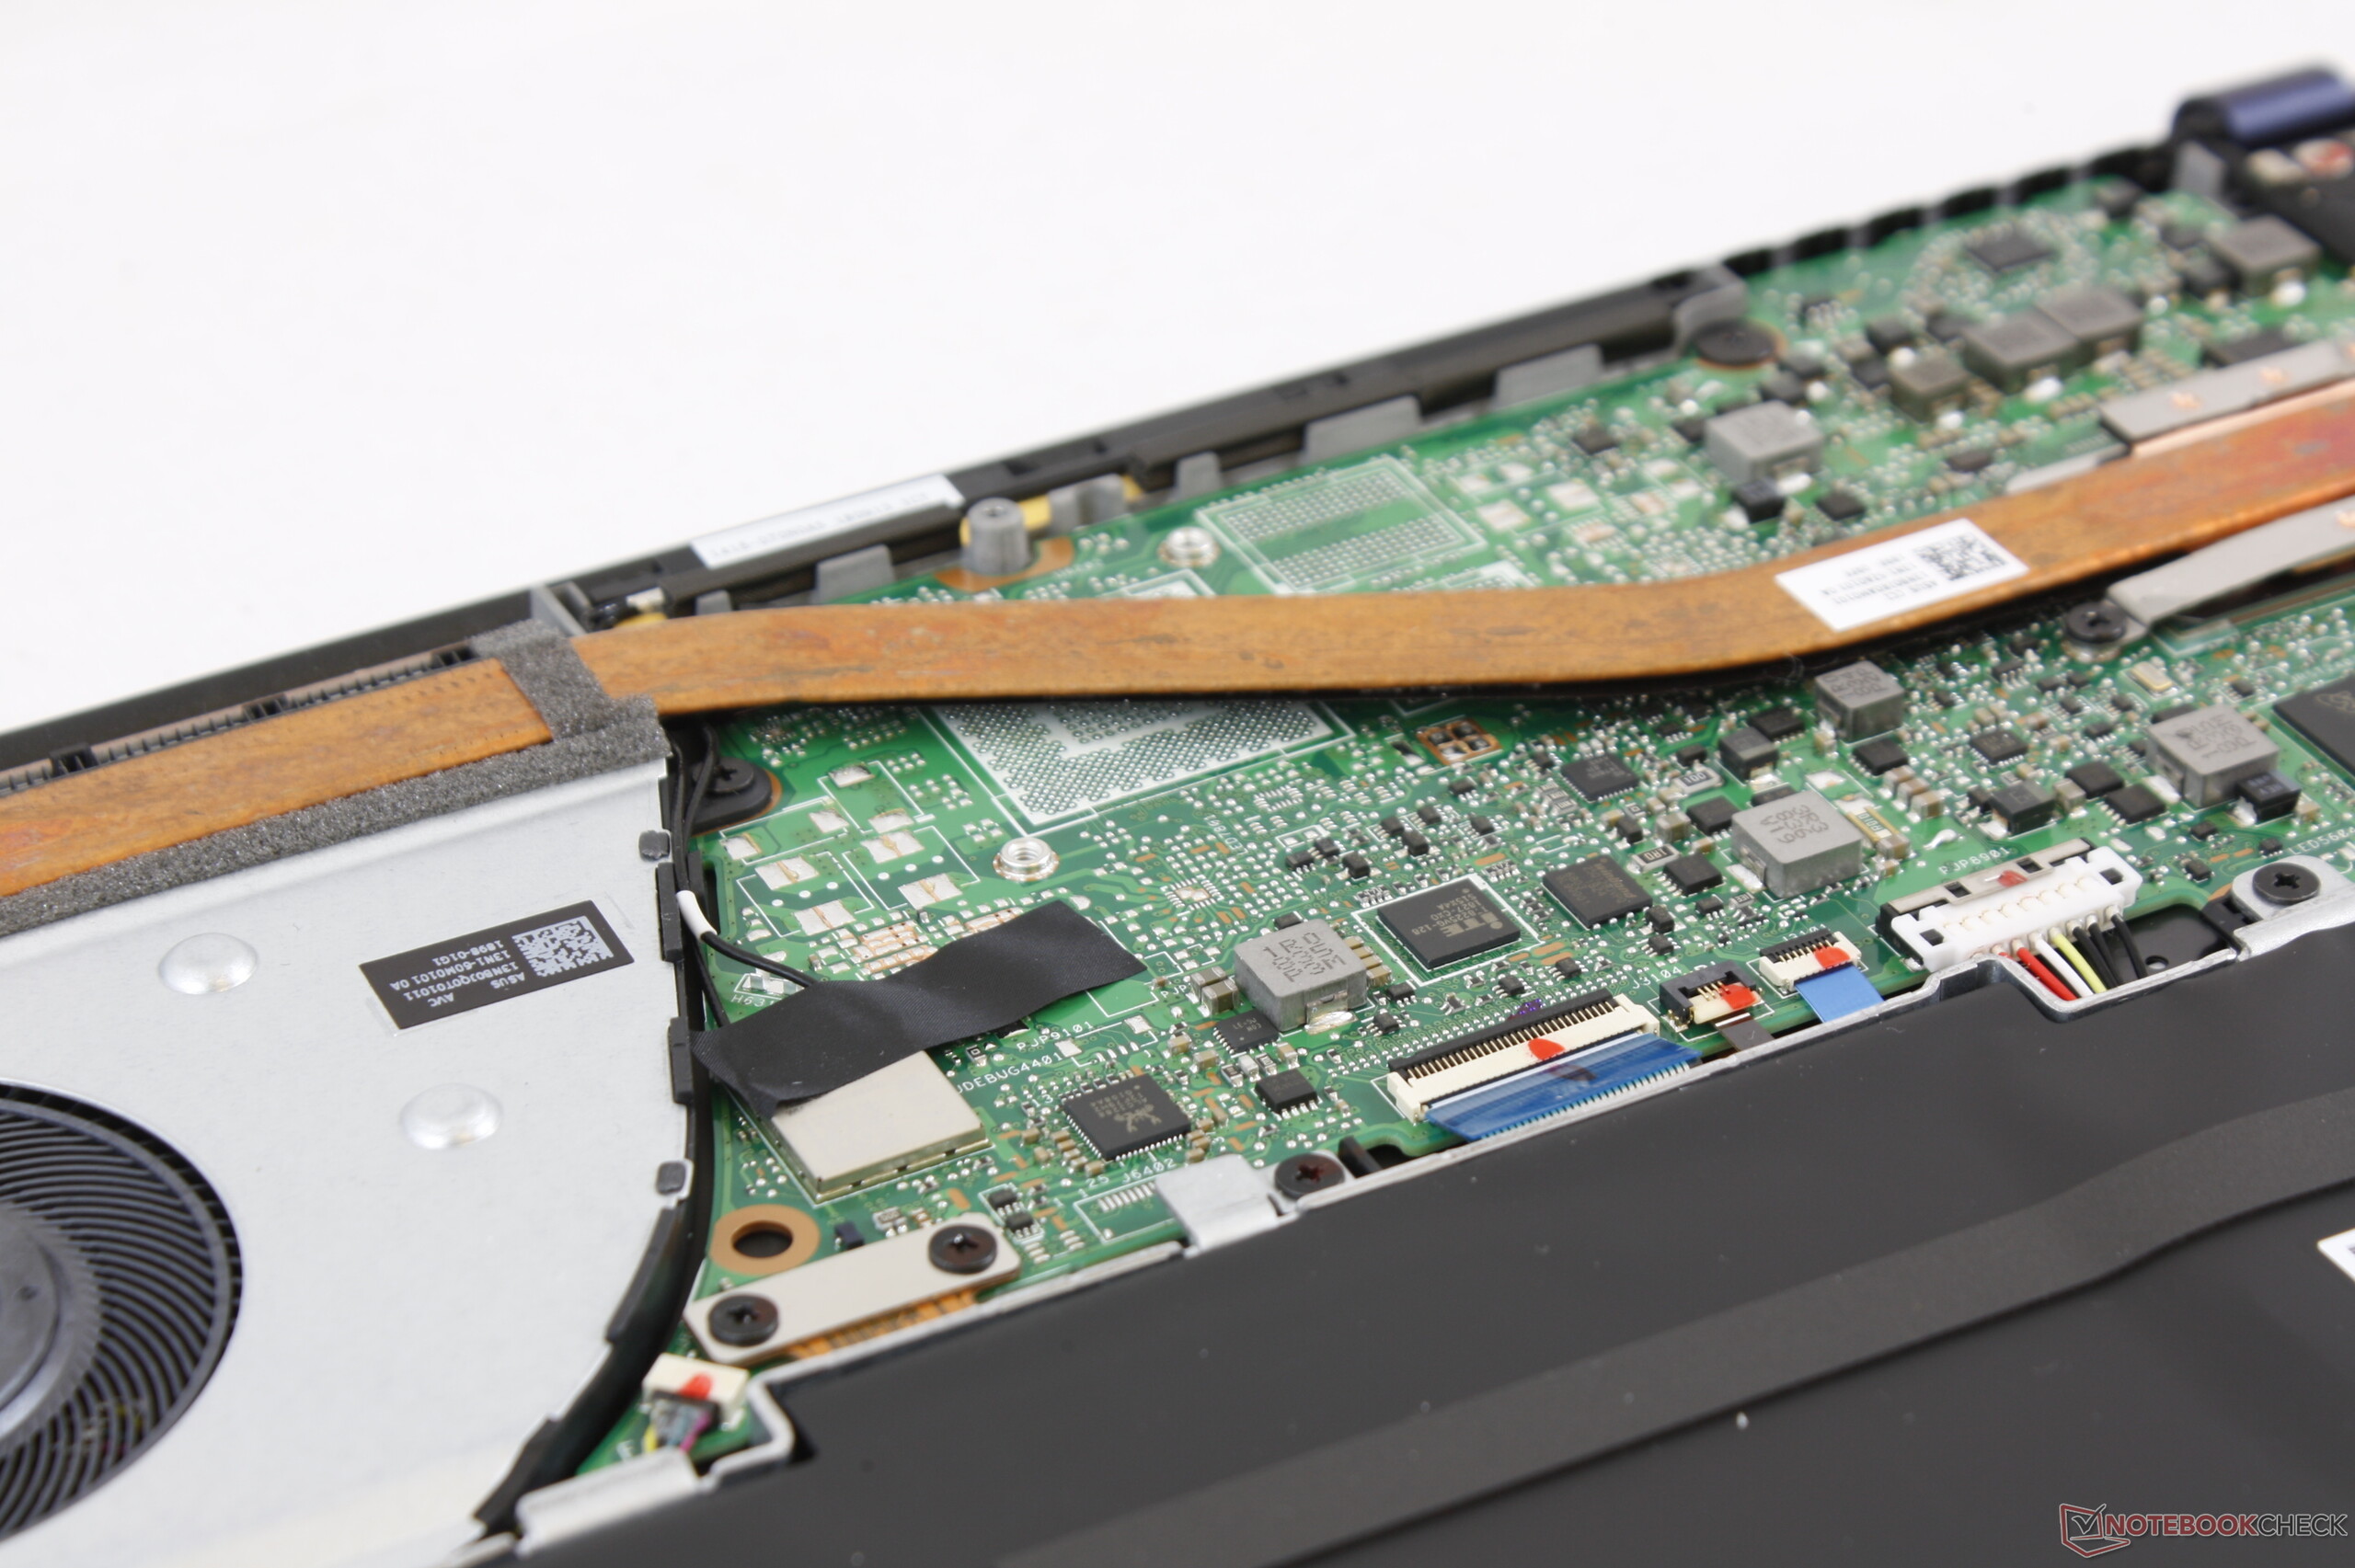
Para futuras iterações, gostaríamos de ver Thunderbolt 3 e uma tela mais brilhante para competir melhor contra alternativas populares como o XPS 13, MateBook X Pro, MacBook Pro 13, Samsung NP900, e outros que podem ser mais fáceis de ver em exteriores. A Asus deve abandonar a porta proprietária do adaptador de CA e adotar o mais versátil carregamento USB Type-C também. A resposta táctil para o Teclado Numérico virtual, um leitor de digitais e um teclado à prova de vazamentos são apenas alguns recursos que o fabricante poderia considerar para fornecer ao UX433 um valor ainda melhor.
Uma atualização visual e de qualidade da última geração do UX430. O sistema se sente potente para o tamanho, apesar de omitir alguns recursos comumente encontrados em outros ultrabooks em sua faixa de preços. O aumento na potência da CPU do Whiskey Lake-U será muito maior se os usuários estiverem atualizando de portáteis com pelo menos dois ou três anos de idade.
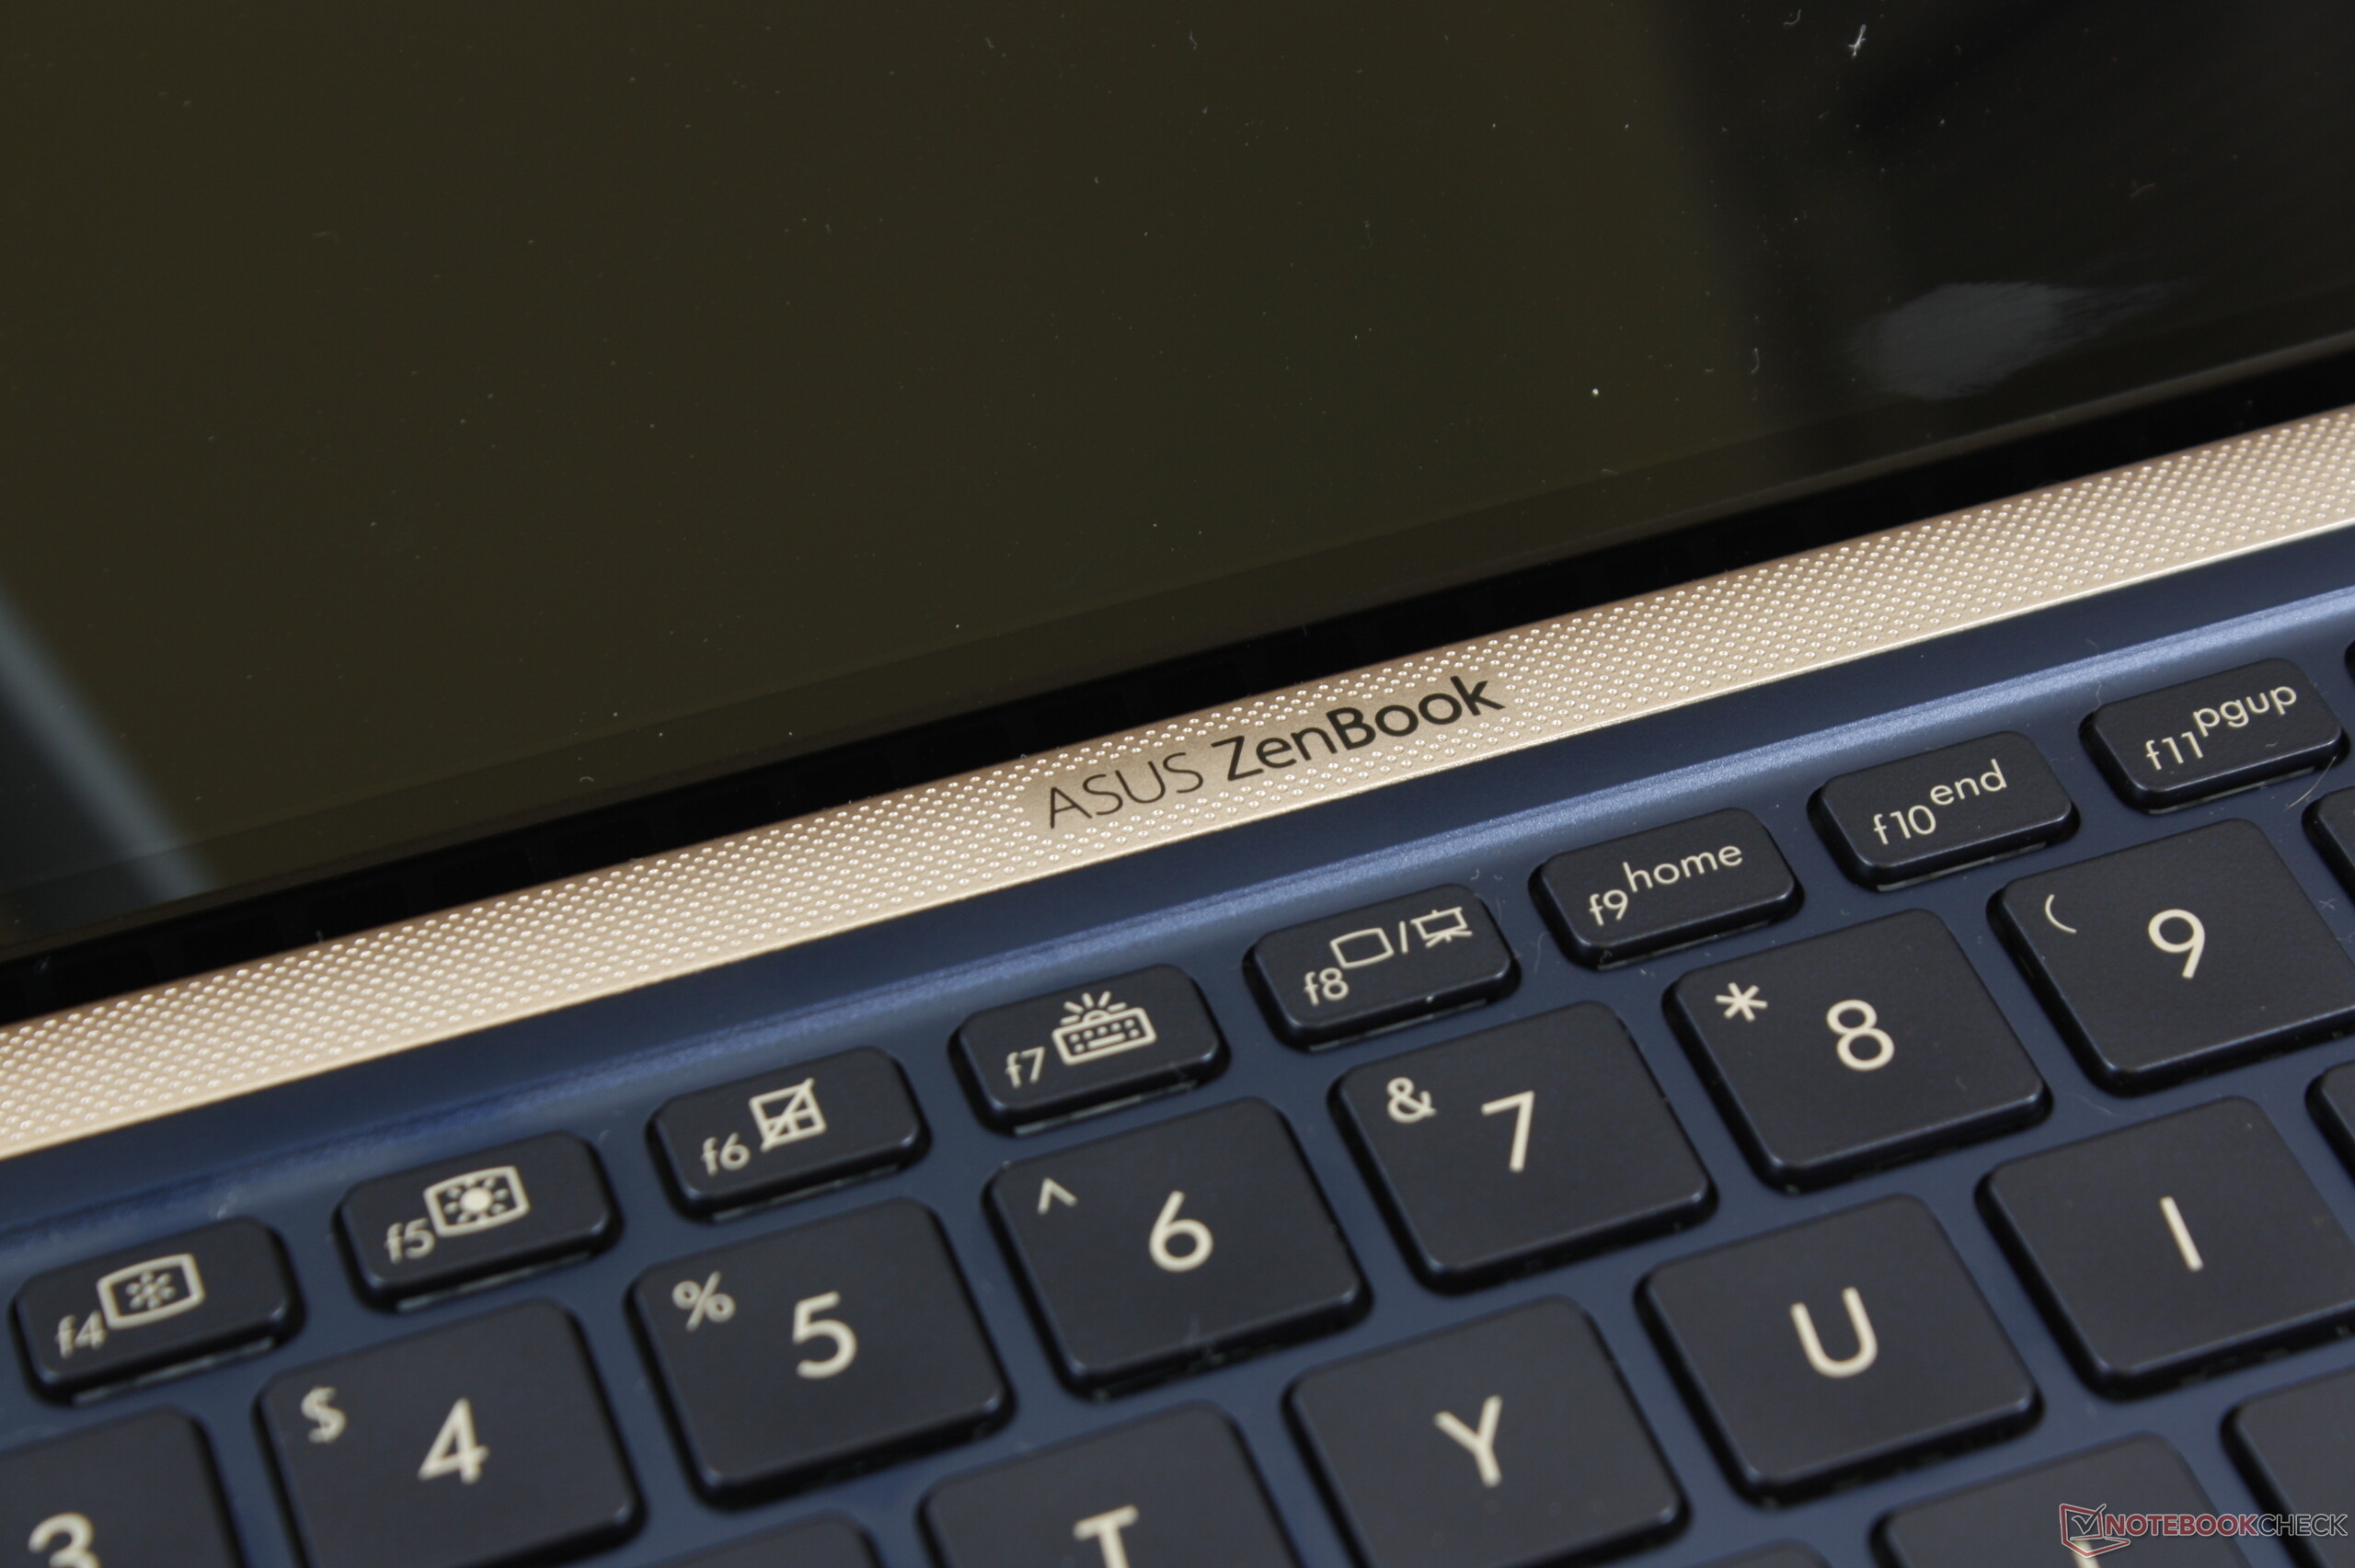
Asus ZenBook 14 UX433FA
- 11/20/2018 v6 (old)
Allen Ngo
Price comparison
