Breve Análise do Portátil Alienware 13 R3
| Networking | |
| iperf3 transmit AX12 | |
| Razer Blade (2016) | |
| Alienware 13 R3 | |
| iperf3 receive AX12 | |
| Alienware 13 R3 | |
| Razer Blade (2016) | |
| |||||||||||||||||||||||||
iluminação: 87 %
iluminação com acumulador: 313 cd/m²
Contraste: ∞:1 (Preto: 0 cd/m²)
ΔE ColorChecker Calman: 2.54 | ∀{0.5-29.43 Ø4.71}
ΔE Greyscale Calman: 1.43 | ∀{0.09-98 Ø4.96}
97% sRGB (Argyll 1.6.3 3D)
78% AdobeRGB 1998 (Argyll 1.6.3 3D)
Gamma: 2.3
CCT: 6337 K
| Alienware 13 R3 JJT6C_133KL05 (SDCA029), 2560x1440, 13.3" | Razer Blade (2016) Sharp LQ140Z1JW01 (SHP1401), 3200x1800, 14" | MSI GS43VR 6RE-006US Name: LG Philips LP140WF3-SPD1, ID: LGD046D, 1920x1080, 14" | Schenker XMG P406 LG Philips 140WF1 (LGD040A), 1920x1080, 14" | Aorus X3 Plus v5 3200x1800, 13.9" | |
|---|---|---|---|---|---|
| Display | |||||
| Display P3 Coverage (%) | 66.9 | 65.5 | 66.2 | 67.9 | |
| sRGB Coverage (%) | 96.8 | 86.4 | 82.8 | 98.2 | |
| AdobeRGB 1998 Coverage (%) | 68.2 | 63.1 | 60.5 | 69.2 | |
| Response Times | -1221% | -771% | -971% | -1586% | |
| Response Time Grey 50% / Grey 80% * (ms) | 41 ? | 31.6 ? | 56 ? | 52.4 ? | |
| Response Time Black / White * (ms) | 2.8 ? | 37 ? -1221% | 24.4 ? -771% | 30 ? -971% | 47.2 ? -1586% |
| PWM Frequency (Hz) | 240 ? | 200 ? | 198 ? | ||
| Screen | -1% | -17% | -65% | -46% | |
| Brightness middle (cd/m²) | 313 | 328 5% | 288.4 -8% | 282 -10% | 394.8 26% |
| Brightness (cd/m²) | 310 | 328 6% | 282 -9% | 266 -14% | 370 19% |
| Brightness Distribution (%) | 87 | 69 -21% | 83 -5% | 81 -7% | 79 -9% |
| Black Level * (cd/m²) | 0.22 | 0.35 | 0.22 | 0.293 | |
| Colorchecker dE 2000 * | 2.54 | 1.91 25% | 2.61 -3% | 4.98 -96% | 4.8 -89% |
| Colorchecker dE 2000 max. * | 3.94 | 3.23 18% | 7.34 -86% | 10.2 -159% | |
| Greyscale dE 2000 * | 1.43 | 1.69 -18% | 1.18 17% | 4.08 -185% | 5.04 -252% |
| Gamma | 2.3 96% | 2.3 96% | 2.24 98% | 2.51 88% | 2.26 97% |
| CCT | 6337 103% | 6418 101% | 6506 100% | 5877 111% | 7343 89% |
| Color Space (Percent of AdobeRGB 1998) (%) | 78 | 63 -19% | 56.4 -28% | 54 -31% | 63.4 -19% |
| Color Space (Percent of sRGB) (%) | 97 | 97 0% | 86.4 -11% | 83 -14% | 98.1 1% |
| Contrast (:1) | 1491 | 824 | 1282 | 1347 | |
| Média Total (Programa/Configurações) | -611% /
-136% | -394% /
-100% | -518% /
-165% | -816% /
-239% |
* ... menor é melhor
Exibir tempos de resposta
| ↔ Tempo de resposta preto para branco | ||
|---|---|---|
| 2.8 ms ... ascensão ↗ e queda ↘ combinadas | ↗ 1.2 ms ascensão | 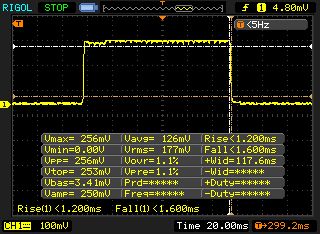 |
| ↘ 1.6 ms queda | ||
| A tela mostra taxas de resposta muito rápidas em nossos testes e deve ser muito adequada para jogos em ritmo acelerado. Em comparação, todos os dispositivos testados variam de 0.1 (mínimo) a 240 (máximo) ms. » 14 % de todos os dispositivos são melhores. Isso significa que o tempo de resposta medido é melhor que a média de todos os dispositivos testados (19.8 ms). | ||
Cintilação da tela / PWM (modulação por largura de pulso)
| Tela tremeluzindo/PWM detectado | 240 Hz | ≤ 100 % configuração de brilho | 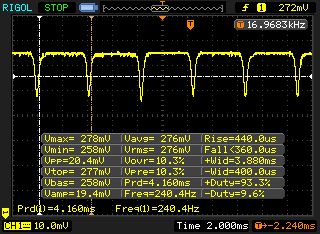 |
A luz de fundo da tela pisca em 240 Hz (pior caso, por exemplo, utilizando PWM) Cintilação detectada em uma configuração de brilho de 100 % e abaixo. Não deve haver cintilação ou PWM acima desta configuração de brilho. A frequência de 240 Hz é relativamente baixa, portanto, usuários sensíveis provavelmente notarão cintilação e sentirão fadiga ocular na configuração de brilho indicada e abaixo. [pwm_comparison] Em comparação: 52 % de todos os dispositivos testados não usam PWM para escurecer a tela. Se PWM foi detectado, uma média de 7757 (mínimo: 5 - máximo: 343500) Hz foi medida. | |||
| Cinebench R15 | |
| CPU Single 64Bit | |
| Alienware 13 R3 | |
| Razer Blade (2016) | |
| Schenker XMG P406 | |
| Aorus X3 Plus v5 | |
| MSI GS43VR 6RE-006US | |
| CPU Multi 64Bit | |
| Alienware 13 R3 | |
| Aorus X3 Plus v5 | |
| Schenker XMG P406 | |
| MSI GS43VR 6RE-006US | |
| Razer Blade (2016) | |
| Cinebench R11.5 | |
| CPU Single 64Bit | |
| Alienware 13 R3 | |
| Aorus X3 Plus v5 | |
| Schenker XMG P406 | |
| MSI GS43VR 6RE-006US | |
| CPU Multi 64Bit | |
| Alienware 13 R3 | |
| Aorus X3 Plus v5 | |
| Schenker XMG P406 | |
| MSI GS43VR 6RE-006US | |
| PCMark 8 | |
| Home Score Accelerated v2 | |
| Aorus X3 Plus v5 | |
| MSI GS43VR 6RE-006US | |
| Alienware 13 R3 | |
| Razer Blade (2016) | |
| Schenker XMG P406 | |
| Work Score Accelerated v2 | |
| Schenker XMG P406 | |
| Alienware 13 R3 | |
| MSI GS43VR 6RE-006US | |
| Aorus X3 Plus v5 | |
| Razer Blade (2016) | |
| PCMark 7 - Score | |
| Schenker XMG P406 | |
| Alienware 13 R3 | |
| Aorus X3 Plus v5 | |
| PCMark 7 Score | 5482 pontos | |
| PCMark 8 Home Score Accelerated v2 | 3894 pontos | |
| PCMark 8 Creative Score Accelerated v2 | 5200 pontos | |
| PCMark 8 Work Score Accelerated v2 | 4799 pontos | |
Ajuda | ||
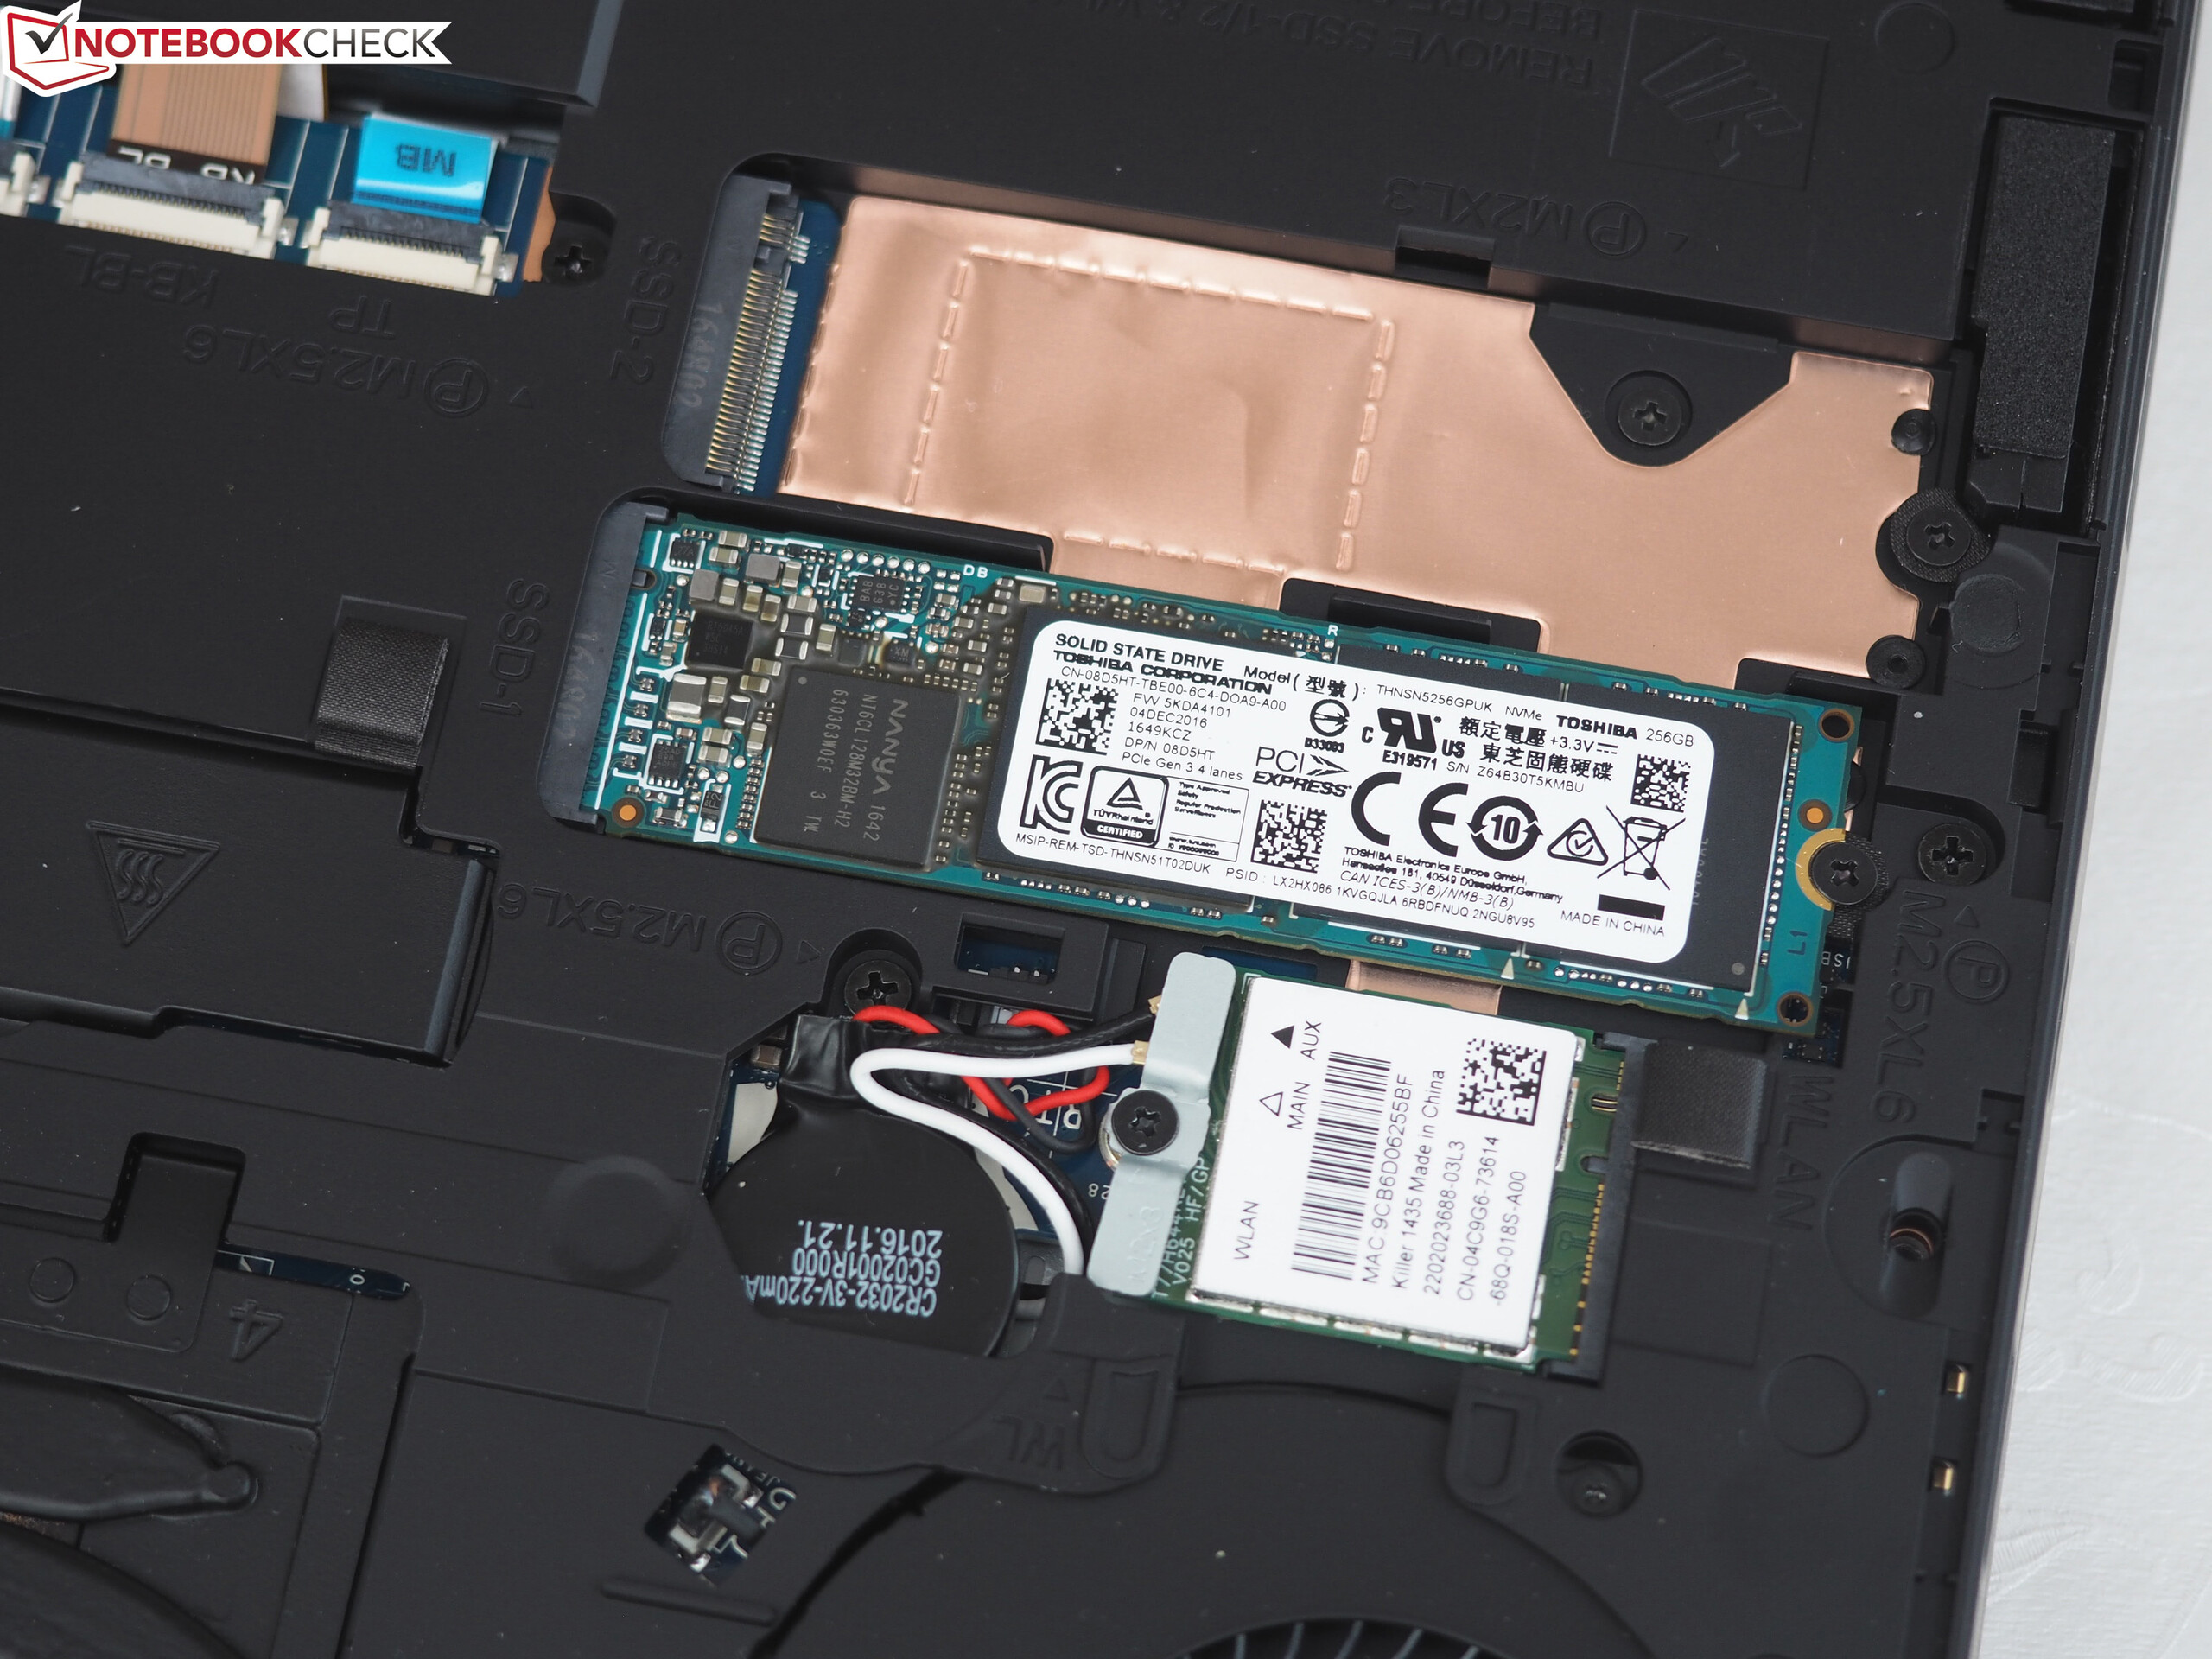
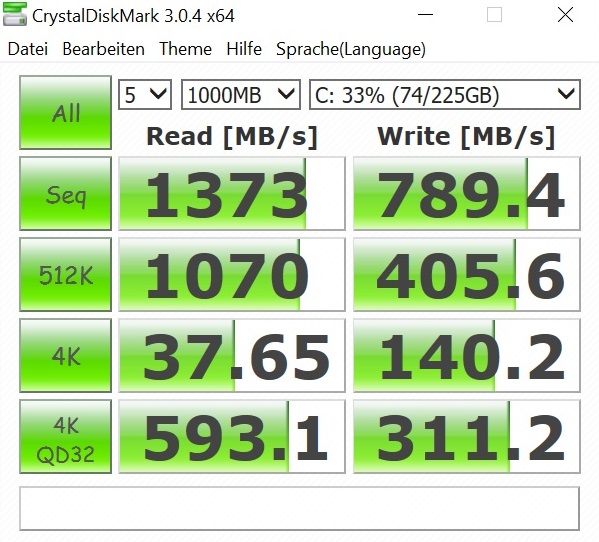
| Alienware 13 R3 Toshiba NVMe THNSN5256GPUK | Razer Blade (2016) Samsung PM951 NVMe MZVLV512 | MSI GS43VR 6RE-006US SanDisk SD8SN8U1T001122 | Schenker XMG P406 Samsung SM951 MZHPV256HDGL m.2 PCI-e | Aorus X3 Plus v5 Samsung SM951 MZVPV512HDGL m.2 PCI-e | |
|---|---|---|---|---|---|
| CrystalDiskMark 3.0 | 5% | -62% | 31% | 57% | |
| Read Seq (MB/s) | 1373 | 1296 -6% | 335.3 -76% | 1634 19% | 1529 11% |
| Write Seq (MB/s) | 789 | 603 -24% | 299 -62% | 1290 63% | 1565 98% |
| Read 512 (MB/s) | 1070 | 655 -39% | 223 -79% | 1149 7% | 929 -13% |
| Write 512 (MB/s) | 405.6 | 604 49% | 246.7 -39% | 1285 217% | 1536 279% |
| Read 4k (MB/s) | 37.65 | 42.22 12% | 17.68 -53% | 43.82 16% | 51.7 37% |
| Write 4k (MB/s) | 140.2 | 139.6 0% | 35.31 -75% | 110.3 -21% | 147.2 5% |
| Read 4k QD32 (MB/s) | 593 | 573 -3% | 247.4 -58% | 320.5 -46% | 636 7% |
| Write 4k QD32 (MB/s) | 311.2 | 480 54% | 156.3 -50% | 287.3 -8% | 421.4 35% |

| 3DMark | |
| 2560x1440 Time Spy Graphics | |
| Alienware 13 R3 | |
| 1920x1080 Fire Strike Graphics | |
| MSI GS43VR 6RE-006US | |
| Alienware 13 R3 | |
| Razer Blade (2016) | |
| Schenker XMG P406 | |
| Aorus X3 Plus v5 | |
| 3DMark 11 - 1280x720 Performance GPU | |
| MSI GS43VR 6RE-006US | |
| Alienware 13 R3 | |
| Razer Blade (2016) | |
| Schenker XMG P406 | |
| Aorus X3 Plus v5 | |
| Unigine Heaven 4.0 - Extreme Preset DX11 | |
| Alienware 13 R3 | |
| 3DMark 11 Performance | 12319 pontos | |
| 3DMark Cloud Gate Standard Score | 21924 pontos | |
| 3DMark Fire Strike Score | 9584 pontos | |
| 3DMark Time Spy Score | 3630 pontos | |
Ajuda | ||
| The Division | |
| 1920x1080 Ultra Preset AF:16x | |
| Alienware 13 R3 | |
| Razer Blade (2016) FHD | |
| 1920x1080 High Preset AF:8x | |
| Alienware 13 R3 | |
| Razer Blade (2016) FHD | |
| XCOM 2 | |
| 1920x1080 Maximum Preset (8xMSAA instead of FXAA) AA:8xMS AF:16x | |
| Alienware 13 R3 | |
| Razer Blade (2016) FHD | |
| 1920x1080 High Preset AA:FX AF:8x | |
| Alienware 13 R3 | |
| Razer Blade (2016) FHD | |
| Battlefield 1 | |
| 1920x1080 Ultra Preset AA:T | |
| Alienware 13 R3 | |
| 1920x1080 High Preset AA:T | |
| Alienware 13 R3 | |
| Mirror's Edge Catalyst | |
| 1920x1080 Ultra Preset AF:16x | |
| Alienware 13 R3 | |
| 1920x1080 High Preset AF:16x | |
| Alienware 13 R3 | |
| Resident Evil 7 | |
| 1920x1080 Very High / On AA:FXAA+T | |
| Alienware 13 R3 | |
| 1920x1080 High / On AA:FXAA+T | |
| Alienware 13 R3 | |
| Watch Dogs 2 | |
| 1920x1080 Ultra Preset | |
| Alienware 13 R3 | |
| 1920x1080 High Preset | |
| Alienware 13 R3 | |
| Call of Duty Infinite Warfare | |
| 1920x1080 Ultra / On AA:T2X SM | |
| Alienware 13 R3 | |
| 1920x1080 High / On AA:FX | |
| Alienware 13 R3 | |
| Mafia 3 - 1920x1080 High Preset | |
| Alienware 13 R3 | |
| baixo | média | alto | ultra | |
|---|---|---|---|---|
| XCOM 2 (2016) | 56.8 | 29.1 | ||
| The Division (2016) | 67.4 | 52.2 | ||
| Need for Speed 2016 (2016) | 80 | 63.1 | ||
| Mirror's Edge Catalyst (2016) | 69.7 | 63.9 | ||
| Mafia 3 (2016) | 40.1 | |||
| Battlefield 1 (2016) | 77.7 | 72.9 | ||
| Farming Simulator 17 (2016) | 144 | 139 | ||
| Call of Duty Infinite Warfare (2016) | 94.7 | 84.4 | ||
| Watch Dogs 2 (2016) | 58.1 | 41.7 | ||
| Resident Evil 7 (2017) | 101 | 82 |
Barulho
| Ocioso |
| 29 / 30 / 31 dB |
| Carga |
| 36 / 49 dB |
 | ||
30 dB silencioso 40 dB(A) audível 50 dB(A) ruidosamente alto |
||
min: | ||
| Alienware 13 R3 GeForce GTX 1060 Mobile, i7-7700HQ | Razer Blade (2016) GeForce GTX 1060 Mobile, 6700HQ | MSI GS43VR 6RE-006US GeForce GTX 1060 Mobile, 6700HQ | Schenker XMG P406 GeForce GTX 970M, 6700HQ | Aorus X3 Plus v5 GeForce GTX 970M, 6700HQ | |
|---|---|---|---|---|---|
| Noise | -8% | -12% | -15% | -9% | |
| desligado / ambiente * (dB) | 29 | 30 -3% | 29.1 -0% | ||
| Idle Minimum * (dB) | 29 | 31 -7% | 32 -10% | 30 -3% | 32.1 -11% |
| Idle Average * (dB) | 30 | 33 -10% | 32 -7% | 32 -7% | 32.4 -8% |
| Idle Maximum * (dB) | 31 | 35 -13% | 33.5 -8% | 40 -29% | 32.5 -5% |
| Load Average * (dB) | 36 | 39 -8% | 50 -39% | 47 -31% | 40.1 -11% |
| Load Maximum * (dB) | 49 | 51 -4% | 51.5 -5% | 51 -4% | 54.6 -11% |
* ... menor é melhor
(-) A temperatura máxima no lado superior é 48.8 °C / 120 F, em comparação com a média de 40.4 °C / 105 F , variando de 21.2 a 68.8 °C para a classe Gaming.
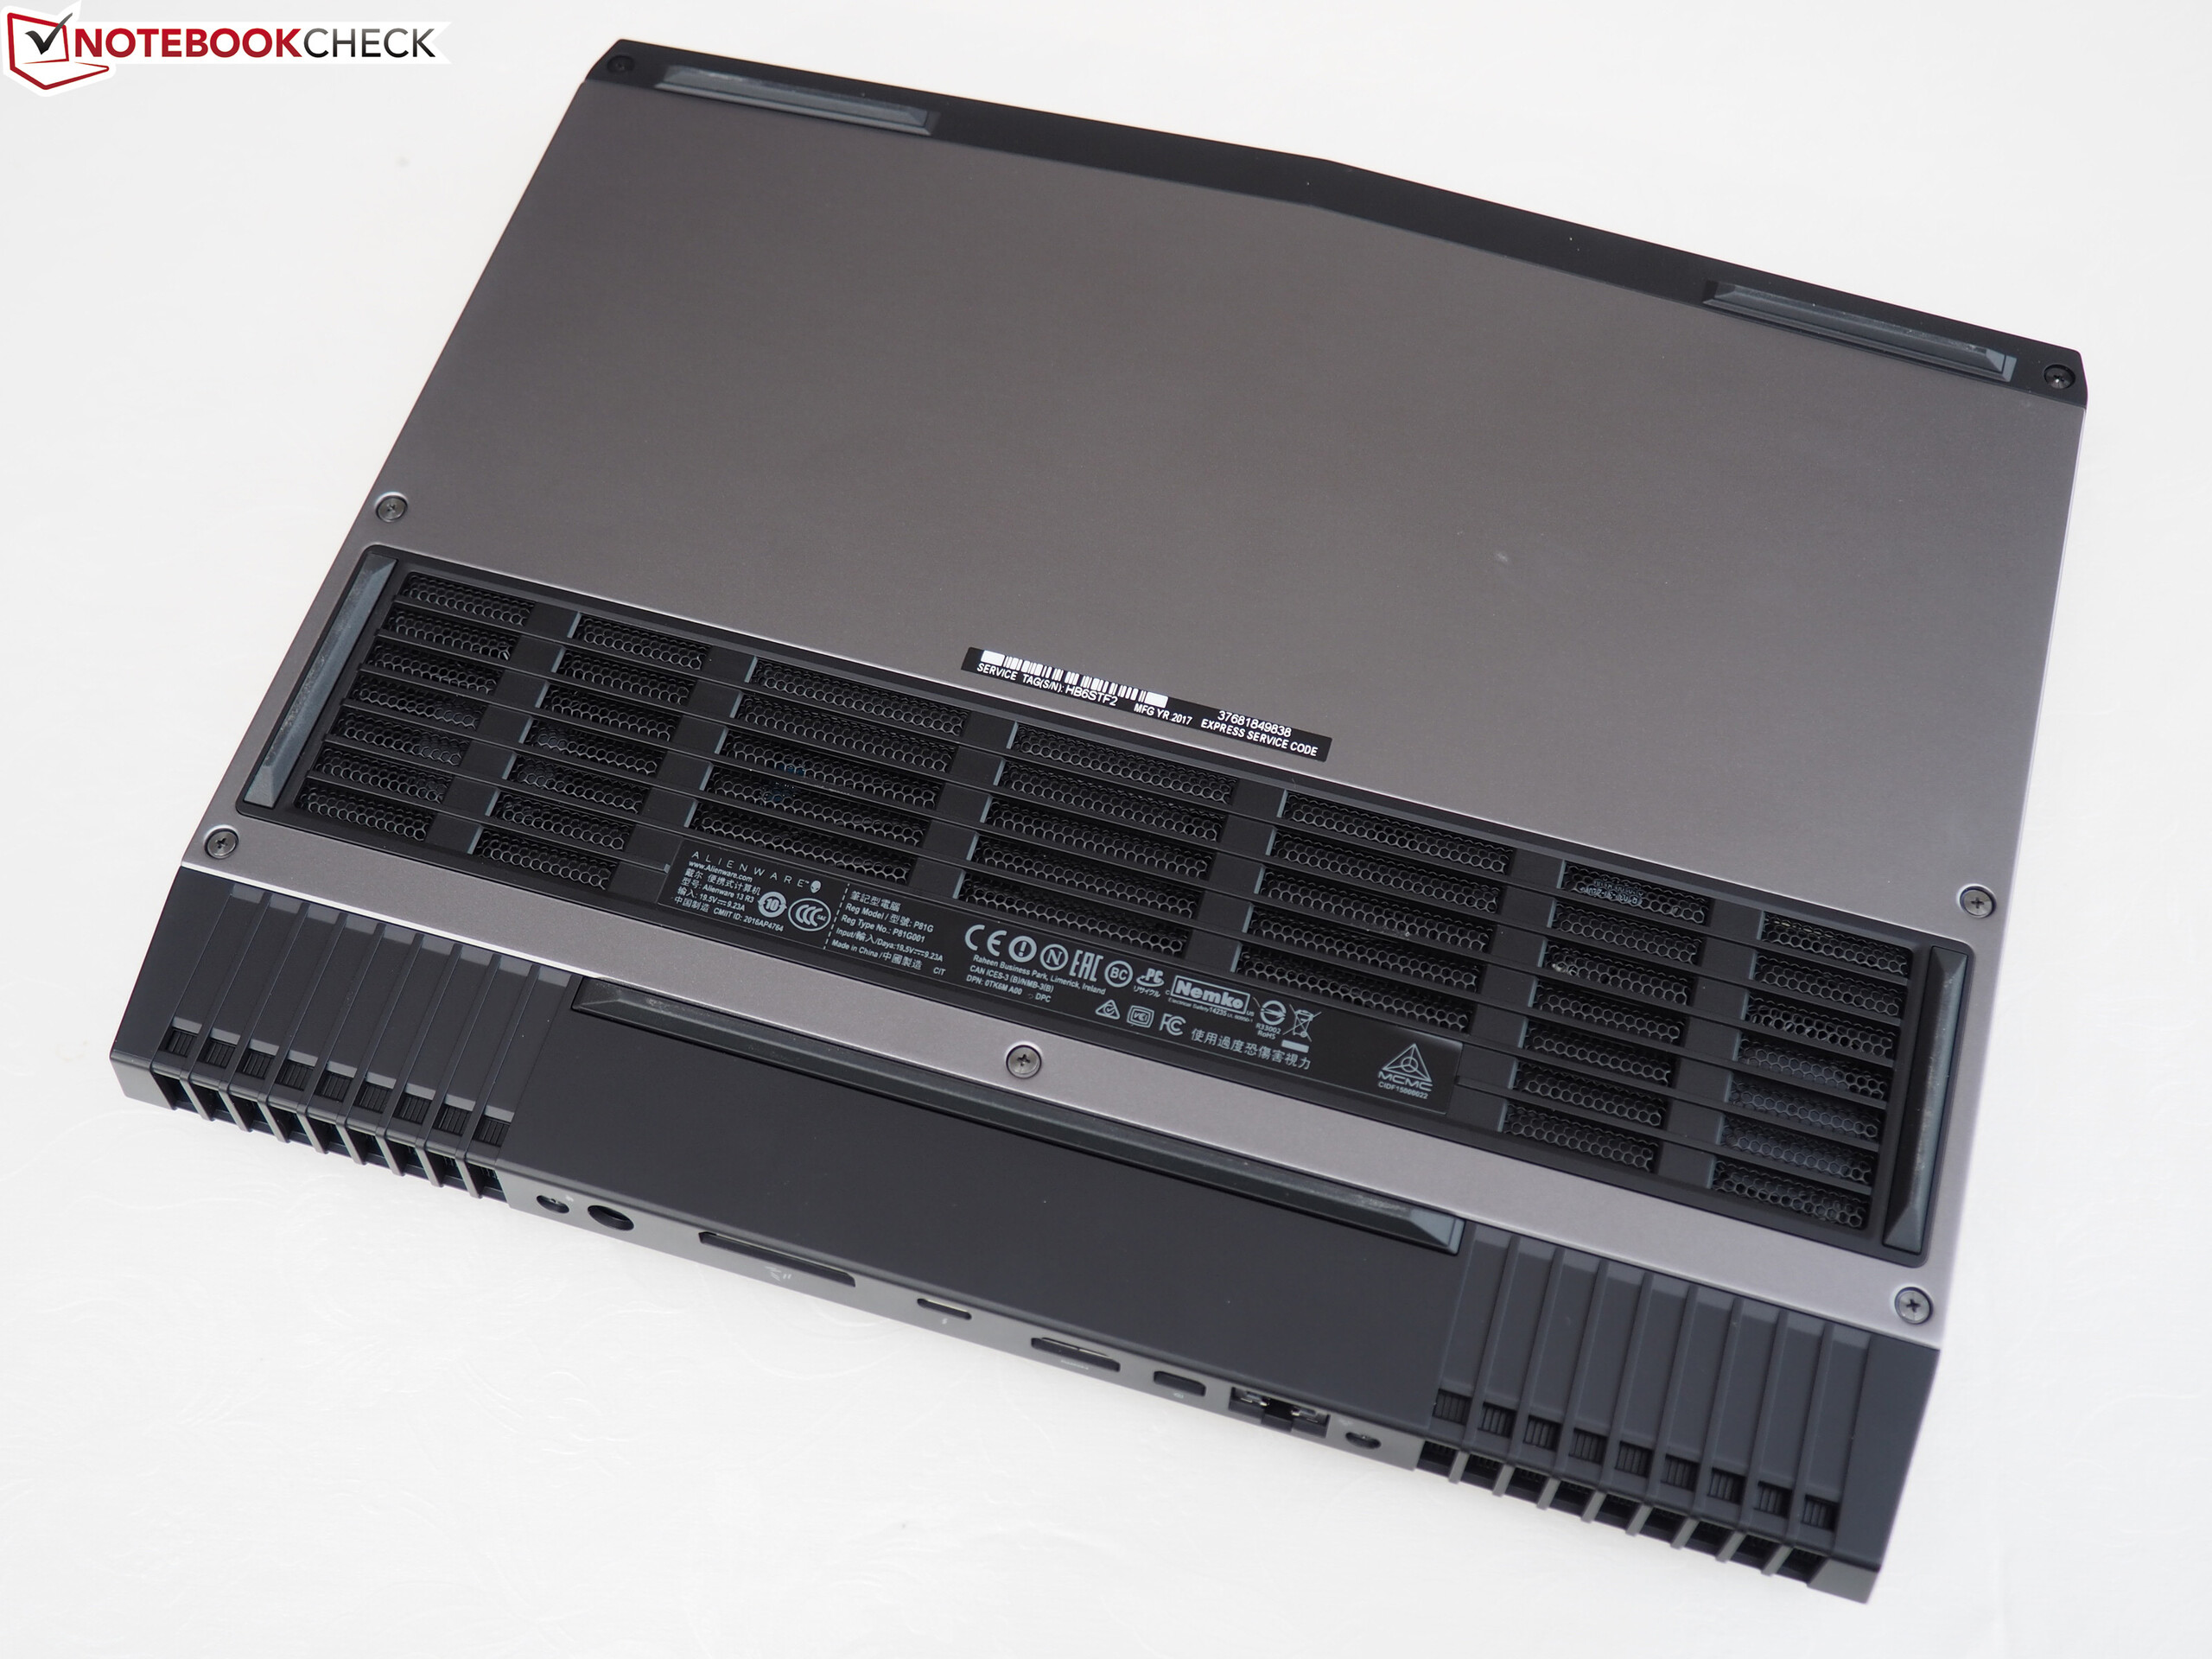
(-) A parte inferior aquece até um máximo de 60.4 °C / 141 F, em comparação com a média de 43.2 °C / 110 F
(+) Em uso inativo, a temperatura média para o lado superior é 28.2 °C / 83 F, em comparação com a média do dispositivo de 33.9 °C / ### class_avg_f### F.
(+) Os apoios para as mãos e o touchpad estão atingindo a temperatura máxima da pele (34.5 °C / 94.1 F) e, portanto, não estão quentes.
(-) A temperatura média da área do apoio para as mãos de dispositivos semelhantes foi 28.8 °C / 83.8 F (-5.7 °C / -10.3 F).
| Alienware 13 R3 GeForce GTX 1060 Mobile, i7-7700HQ | Razer Blade (2016) GeForce GTX 1060 Mobile, 6700HQ | MSI GS43VR 6RE-006US GeForce GTX 1060 Mobile, 6700HQ | Schenker XMG P406 GeForce GTX 970M, 6700HQ | Aorus X3 Plus v5 GeForce GTX 970M, 6700HQ | |
|---|---|---|---|---|---|
| Heat | 7% | -10% | -15% | 18% | |
| Maximum Upper Side * (°C) | 48.8 | 52.7 -8% | 55.6 -14% | 55 -13% | 44.6 9% |
| Maximum Bottom * (°C) | 60.4 | 48.4 20% | 62.4 -3% | 58.7 3% | 49.8 18% |
| Idle Upper Side * (°C) | 33.1 | 29.3 11% | 33.2 -0% | 36.9 -11% | 24.8 25% |
| Idle Bottom * (°C) | 30.1 | 28.4 6% | 37.2 -24% | 41.7 -39% | 24.8 18% |
* ... menor é melhor
Alienware 13 R3 análise de áudio
(±) | o volume do alto-falante é médio, mas bom (###valor### dB)
Graves 100 - 315Hz
(±) | graves reduzidos - em média 14.8% menor que a mediana
(±) | a linearidade dos graves é média (10% delta para a frequência anterior)
Médios 400 - 2.000 Hz
(+) | médios equilibrados - apenas 3.8% longe da mediana
(+) | médios são lineares (6.2% delta para frequência anterior)
Altos 2 - 16 kHz
(+) | agudos equilibrados - apenas 3.6% longe da mediana
(+) | os máximos são lineares (6.9% delta da frequência anterior)
Geral 100 - 16.000 Hz
(±) | a linearidade do som geral é média (18.4% diferença em relação à mediana)
Comparado com a mesma classe
» 59% de todos os dispositivos testados nesta classe foram melhores, 9% semelhantes, 32% piores
» O melhor teve um delta de 6%, a média foi 18%, o pior foi 132%
Comparado com todos os dispositivos testados
» 41% de todos os dispositivos testados foram melhores, 8% semelhantes, 51% piores
» O melhor teve um delta de 4%, a média foi 23%, o pior foi 134%
Razer Blade (2016) análise de áudio
(±) | o volume do alto-falante é médio, mas bom (###valor### dB)
Graves 100 - 315Hz
(±) | graves reduzidos - em média 8.4% menor que a mediana
(±) | a linearidade dos graves é média (11.2% delta para a frequência anterior)
Médios 400 - 2.000 Hz
(+) | médios equilibrados - apenas 4.6% longe da mediana
(+) | médios são lineares (4.3% delta para frequência anterior)
Altos 2 - 16 kHz
(+) | agudos equilibrados - apenas 4.3% longe da mediana
(+) | os máximos são lineares (5.5% delta da frequência anterior)
Geral 100 - 16.000 Hz
(±) | a linearidade do som geral é média (17.1% diferença em relação à mediana)
Comparado com a mesma classe
» 46% de todos os dispositivos testados nesta classe foram melhores, 12% semelhantes, 43% piores
» O melhor teve um delta de 6%, a média foi 18%, o pior foi 132%
Comparado com todos os dispositivos testados
» 31% de todos os dispositivos testados foram melhores, 8% semelhantes, 61% piores
» O melhor teve um delta de 4%, a média foi 23%, o pior foi 134%
| desligado | |
| Ocioso | |
| Carga |
|
Key:
min: | |
| Alienware 13 R3 GeForce GTX 1060 Mobile, i7-7700HQ | Razer Blade (2016) GeForce GTX 1060 Mobile, 6700HQ | MSI GS43VR 6RE-006US GeForce GTX 1060 Mobile, 6700HQ | Schenker XMG P406 GeForce GTX 970M, 6700HQ | Aorus X3 Plus v5 GeForce GTX 970M, 6700HQ | |
|---|---|---|---|---|---|
| Power Consumption | -8% | -36% | -30% | ||
| Idle Minimum * (Watt) | 7 | 9 -29% | 12.1 -73% | 12 -71% | |
| Idle Average * (Watt) | 12 | 14 -17% | 19 -58% | 16 -33% | |
| Idle Maximum * (Watt) | 18 | 22 -22% | 19.5 -8% | 22 -22% | |
| Load Average * (Watt) | 76 | 72 5% | 106.7 -40% | 90 -18% | |
| Load Maximum * (Watt) | 161 | 124 23% | 159 1% | 170 -6% |
* ... menor é melhor
| Alienware 13 R3 GeForce GTX 1060 Mobile, i7-7700HQ, 76 Wh | Razer Blade (2016) GeForce GTX 1060 Mobile, 6700HQ, 70 Wh | MSI GS43VR 6RE-006US GeForce GTX 1060 Mobile, 6700HQ, 61 Wh | Schenker XMG P406 GeForce GTX 970M, 6700HQ, 45 Wh | Aorus X3 Plus v5 GeForce GTX 970M, 6700HQ, 73 Wh | |
|---|---|---|---|---|---|
| Duração da bateria | -23% | -7% | -35% | -17% | |
| Reader / Idle (h) | 8.7 | 9.6 10% | 4.6 -47% | 8 -8% | |
| H.264 (h) | 6 | ||||
| WiFi v1.3 (h) | 5.3 | 4.1 -23% | 4.4 -17% | 3.3 -38% | 5.1 -4% |
| Load (h) | 1.5 | 1.3 -13% | 1.2 -20% | 0.9 -40% |
Pro
Contra
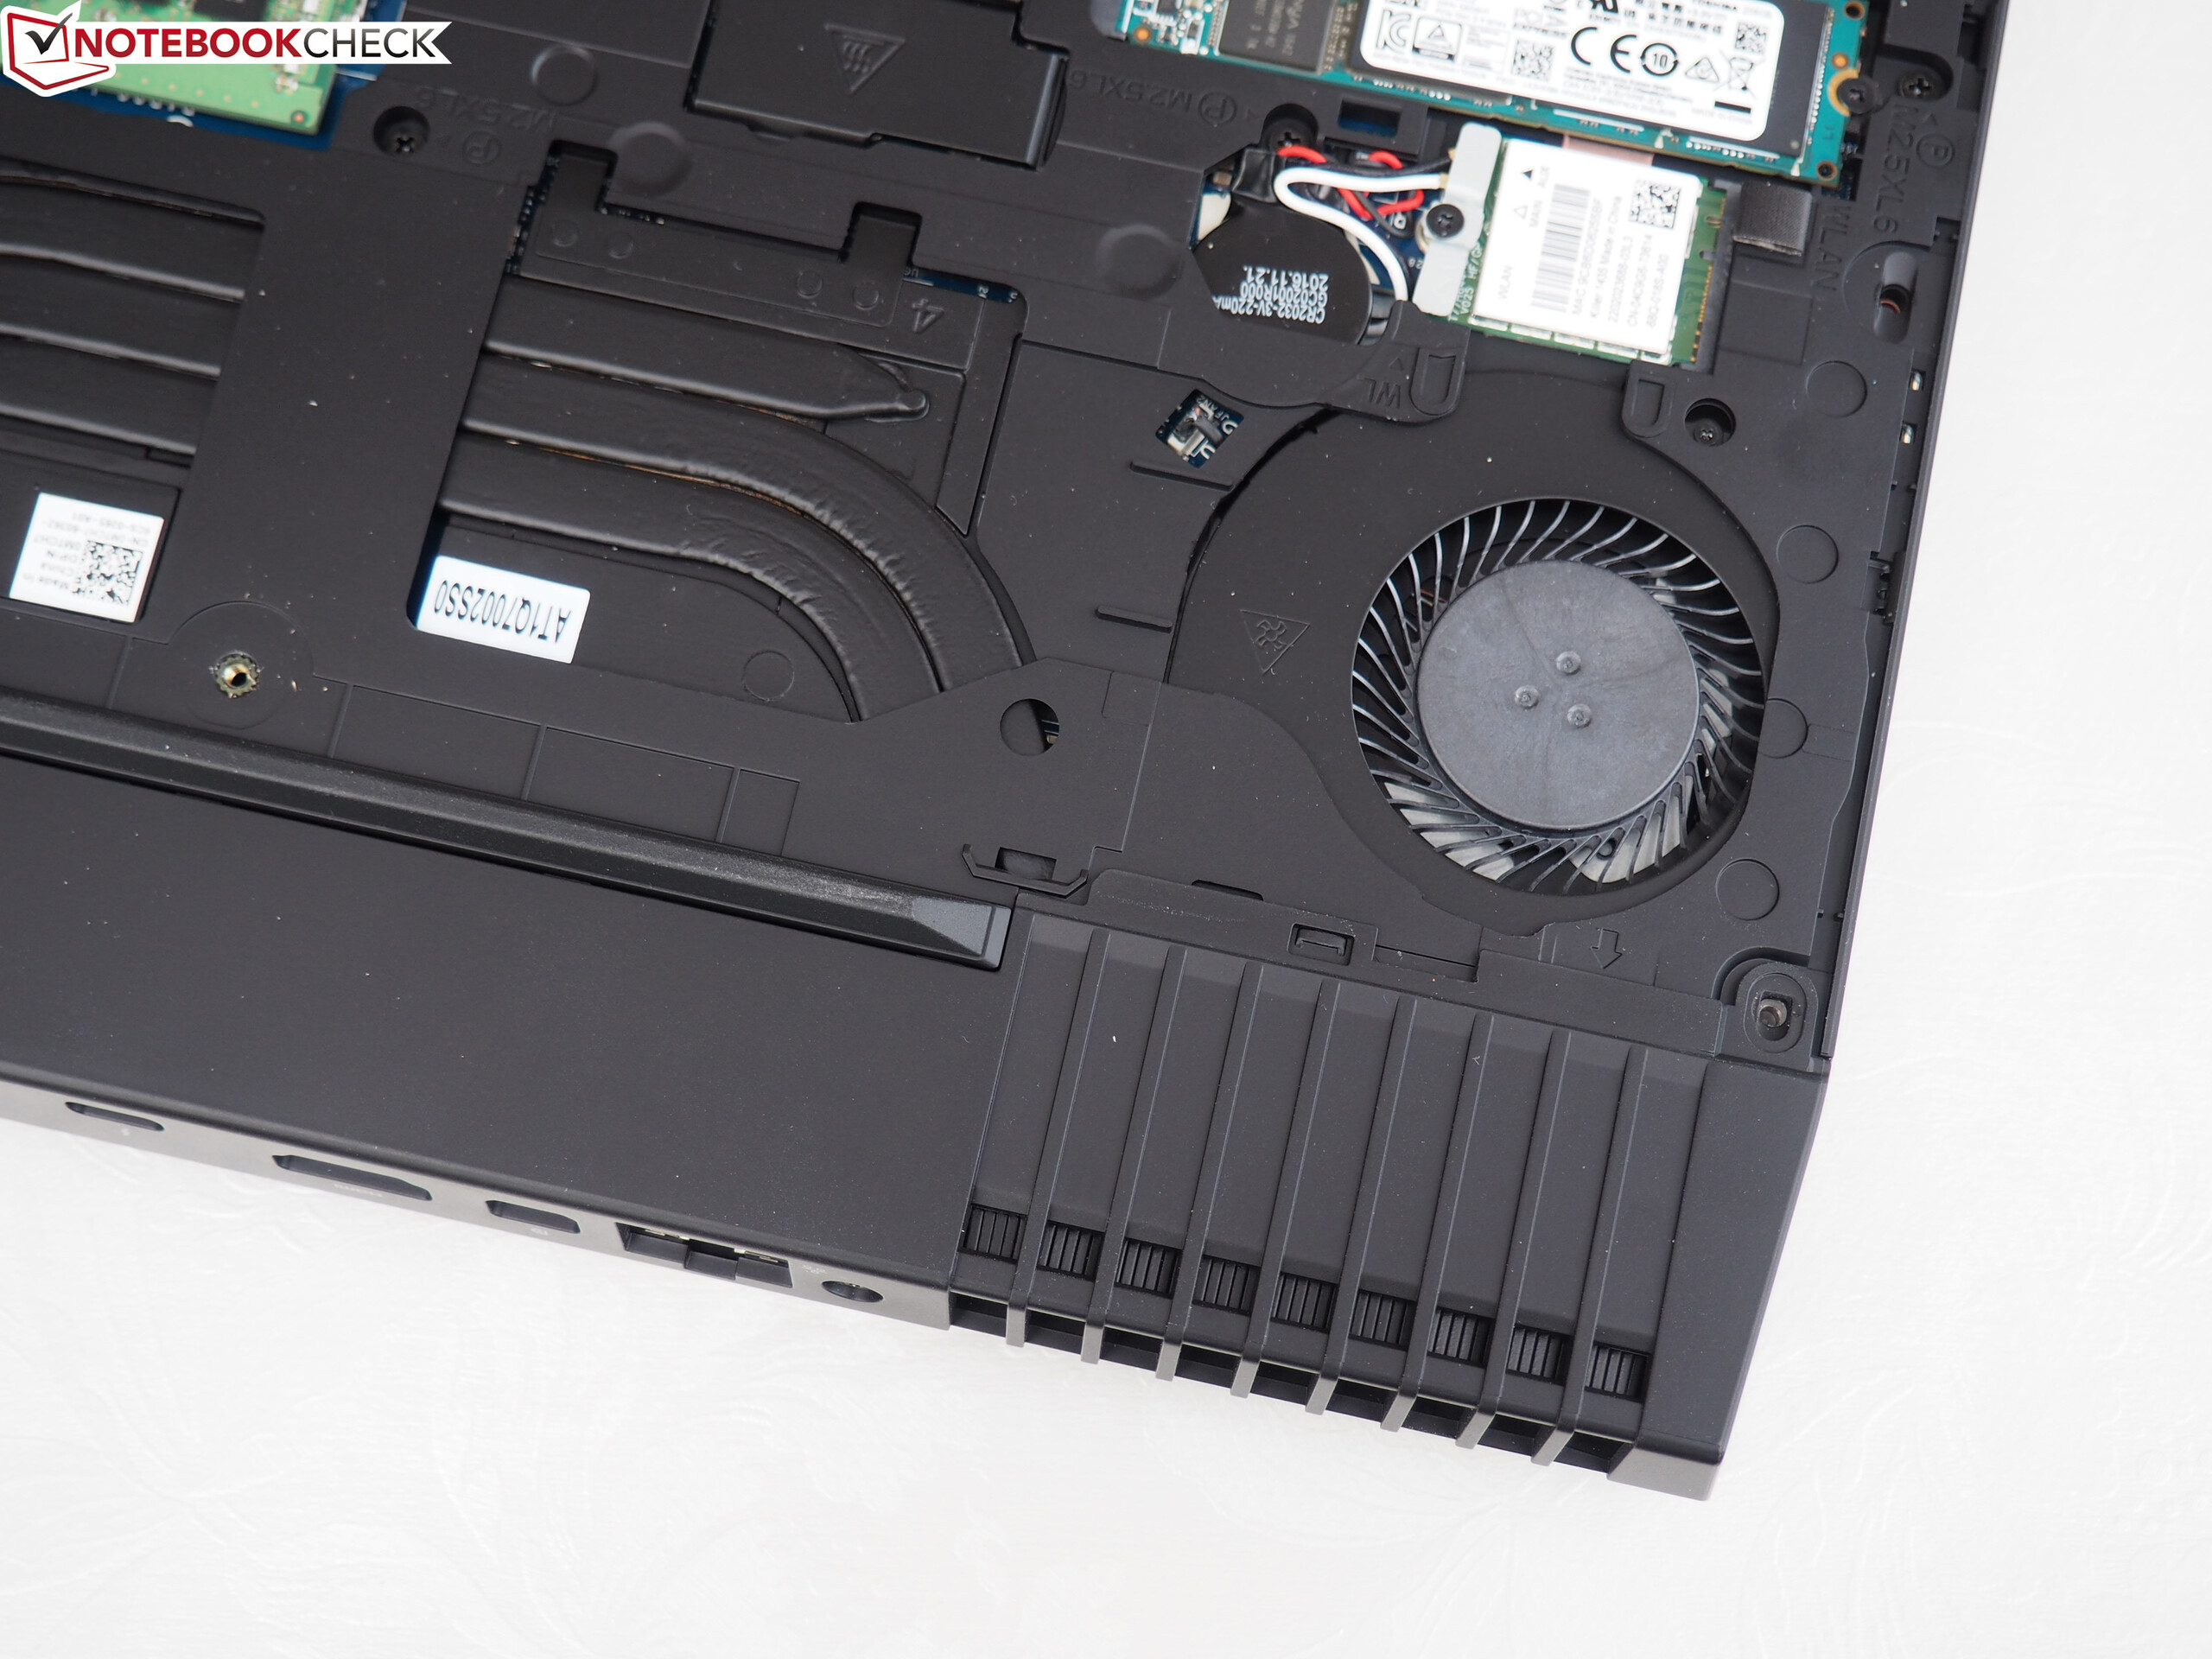
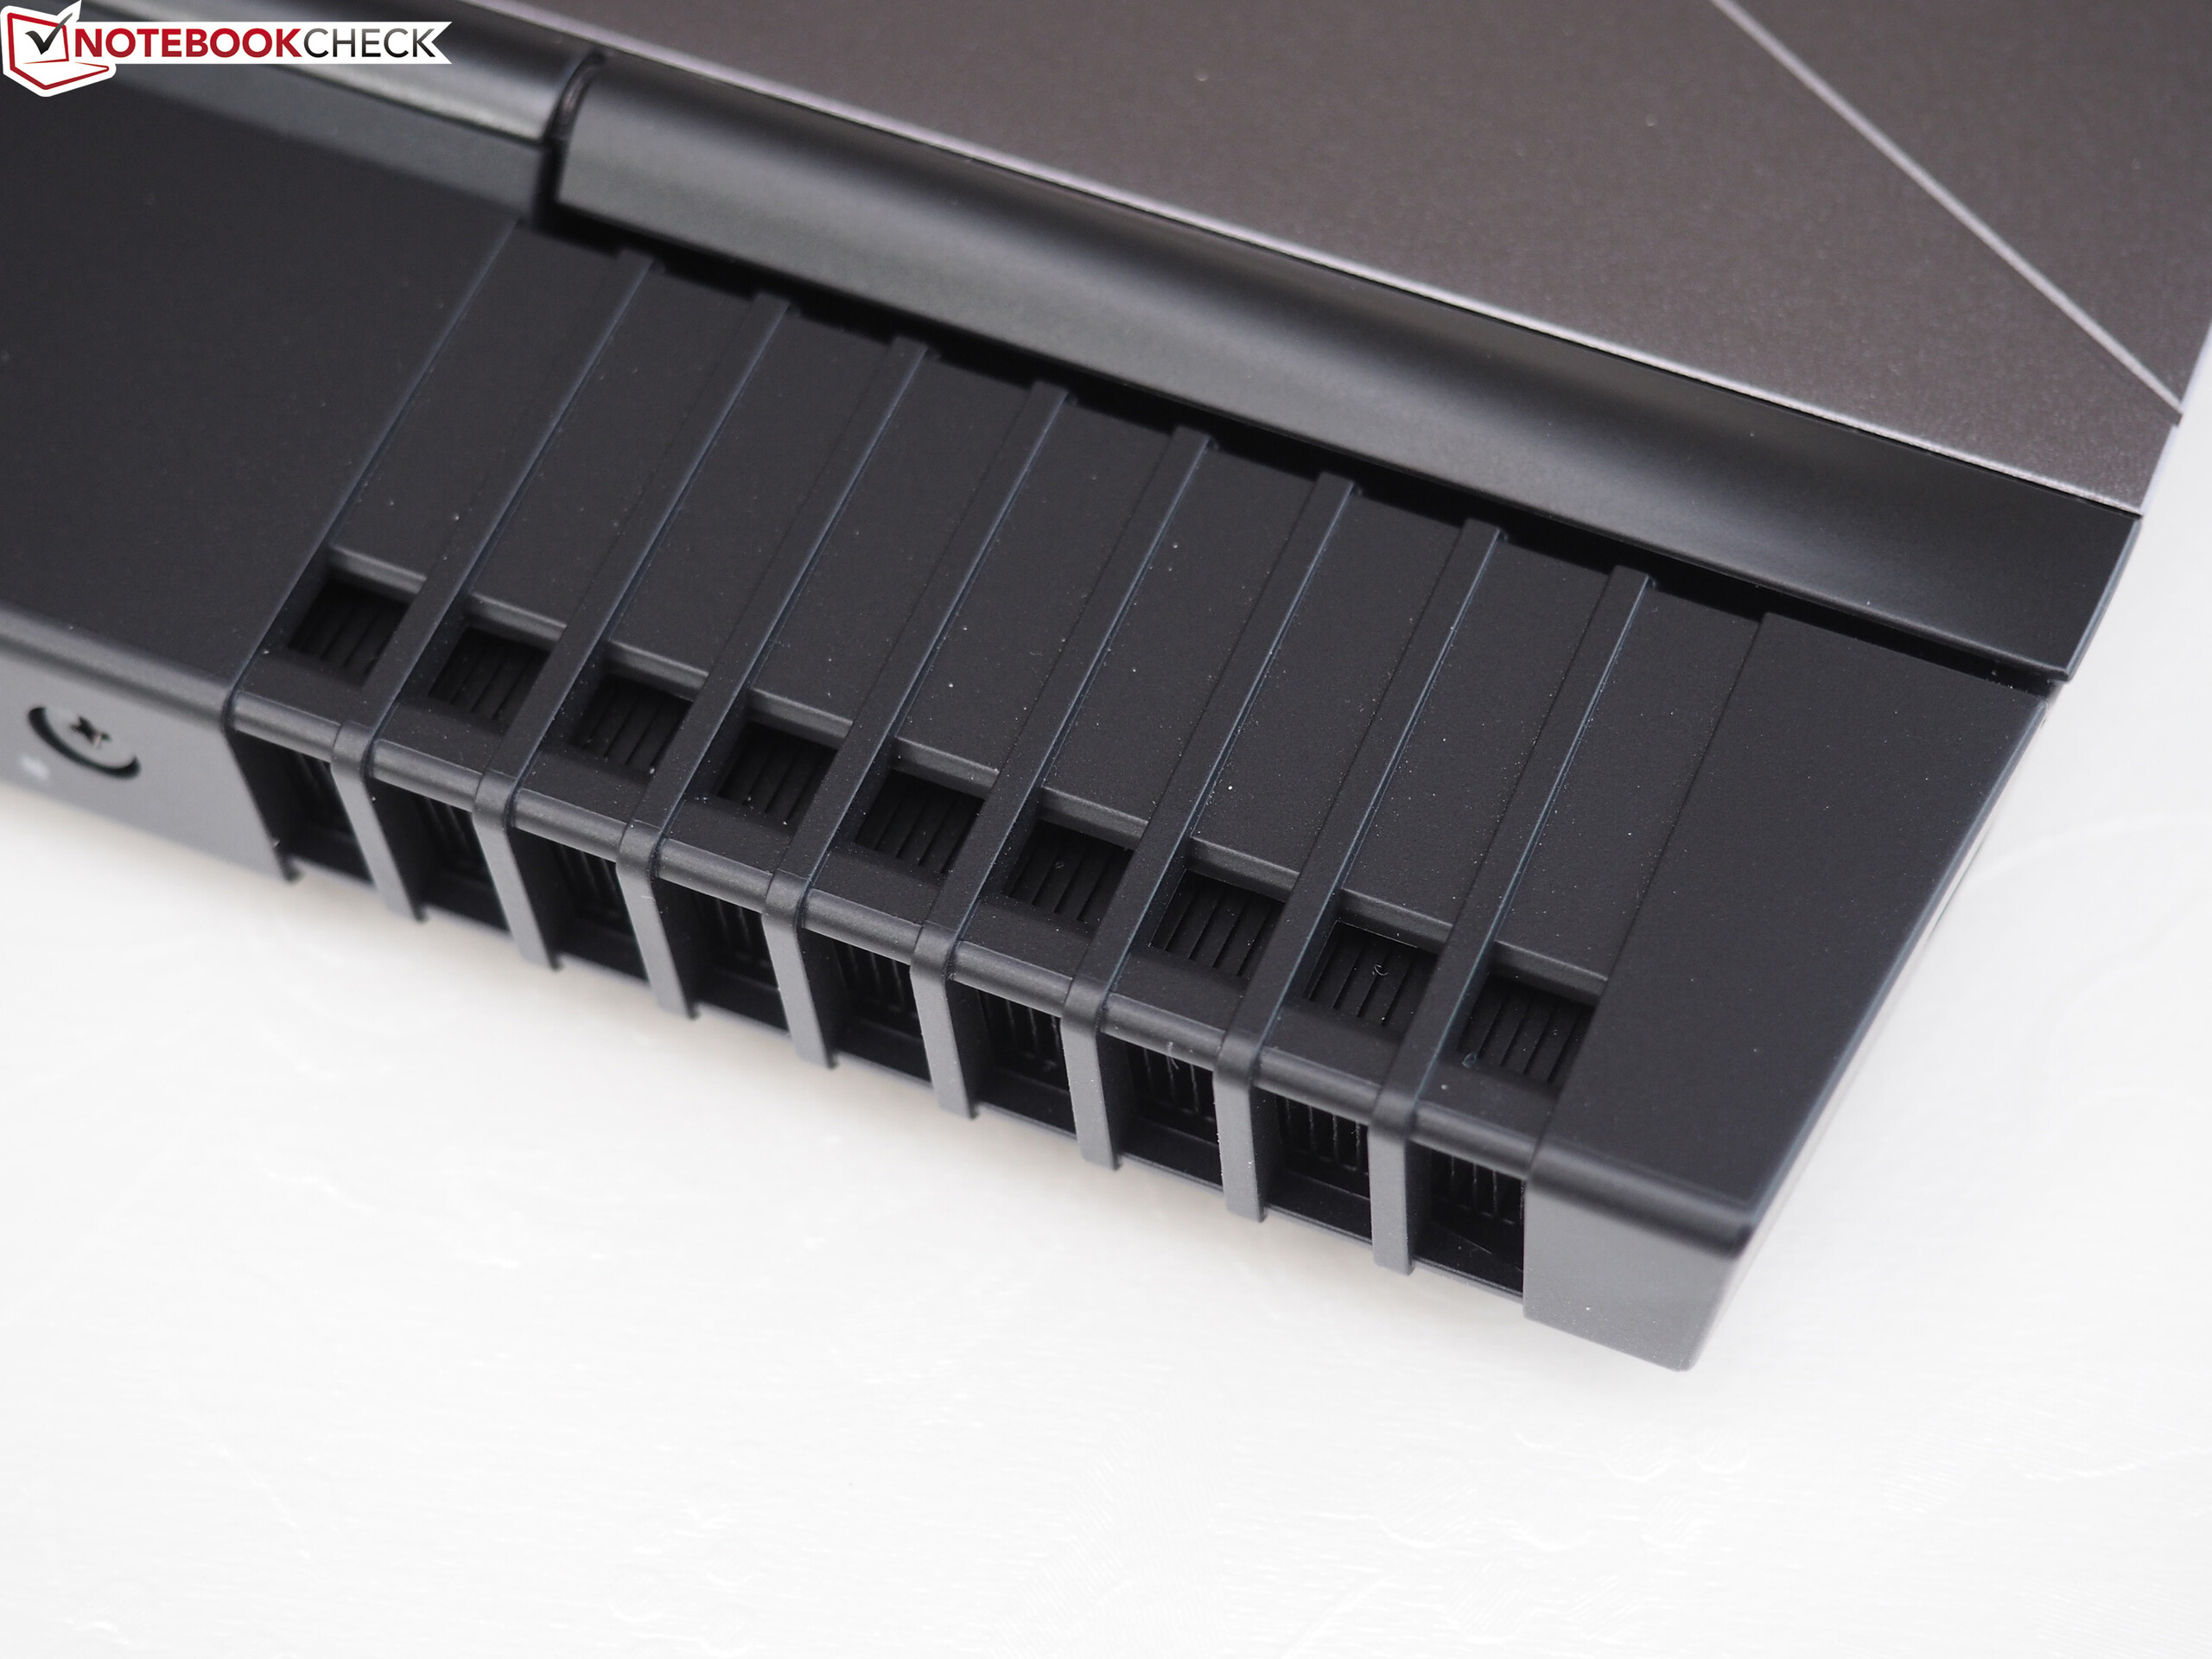
Embora o modelo de teste do maior Alienware 15 R3 teve problemas com o desempenho do resfriamento (flutuante e temperaturas da CPU muito altas, ventoinha desnecessariamente pulsante durante o modo inativo, alta emissão de ruído sob uso intenso), o modelo de teste do sistema mais compacto de 13 polegadas não teve problemas. Com certeza o Alienware 13 R3 também pode esquentar muito e se tornar muito barulhento em cenários extremos, mas o sistema, de outra maneira é convenientemente silencioso e frio.
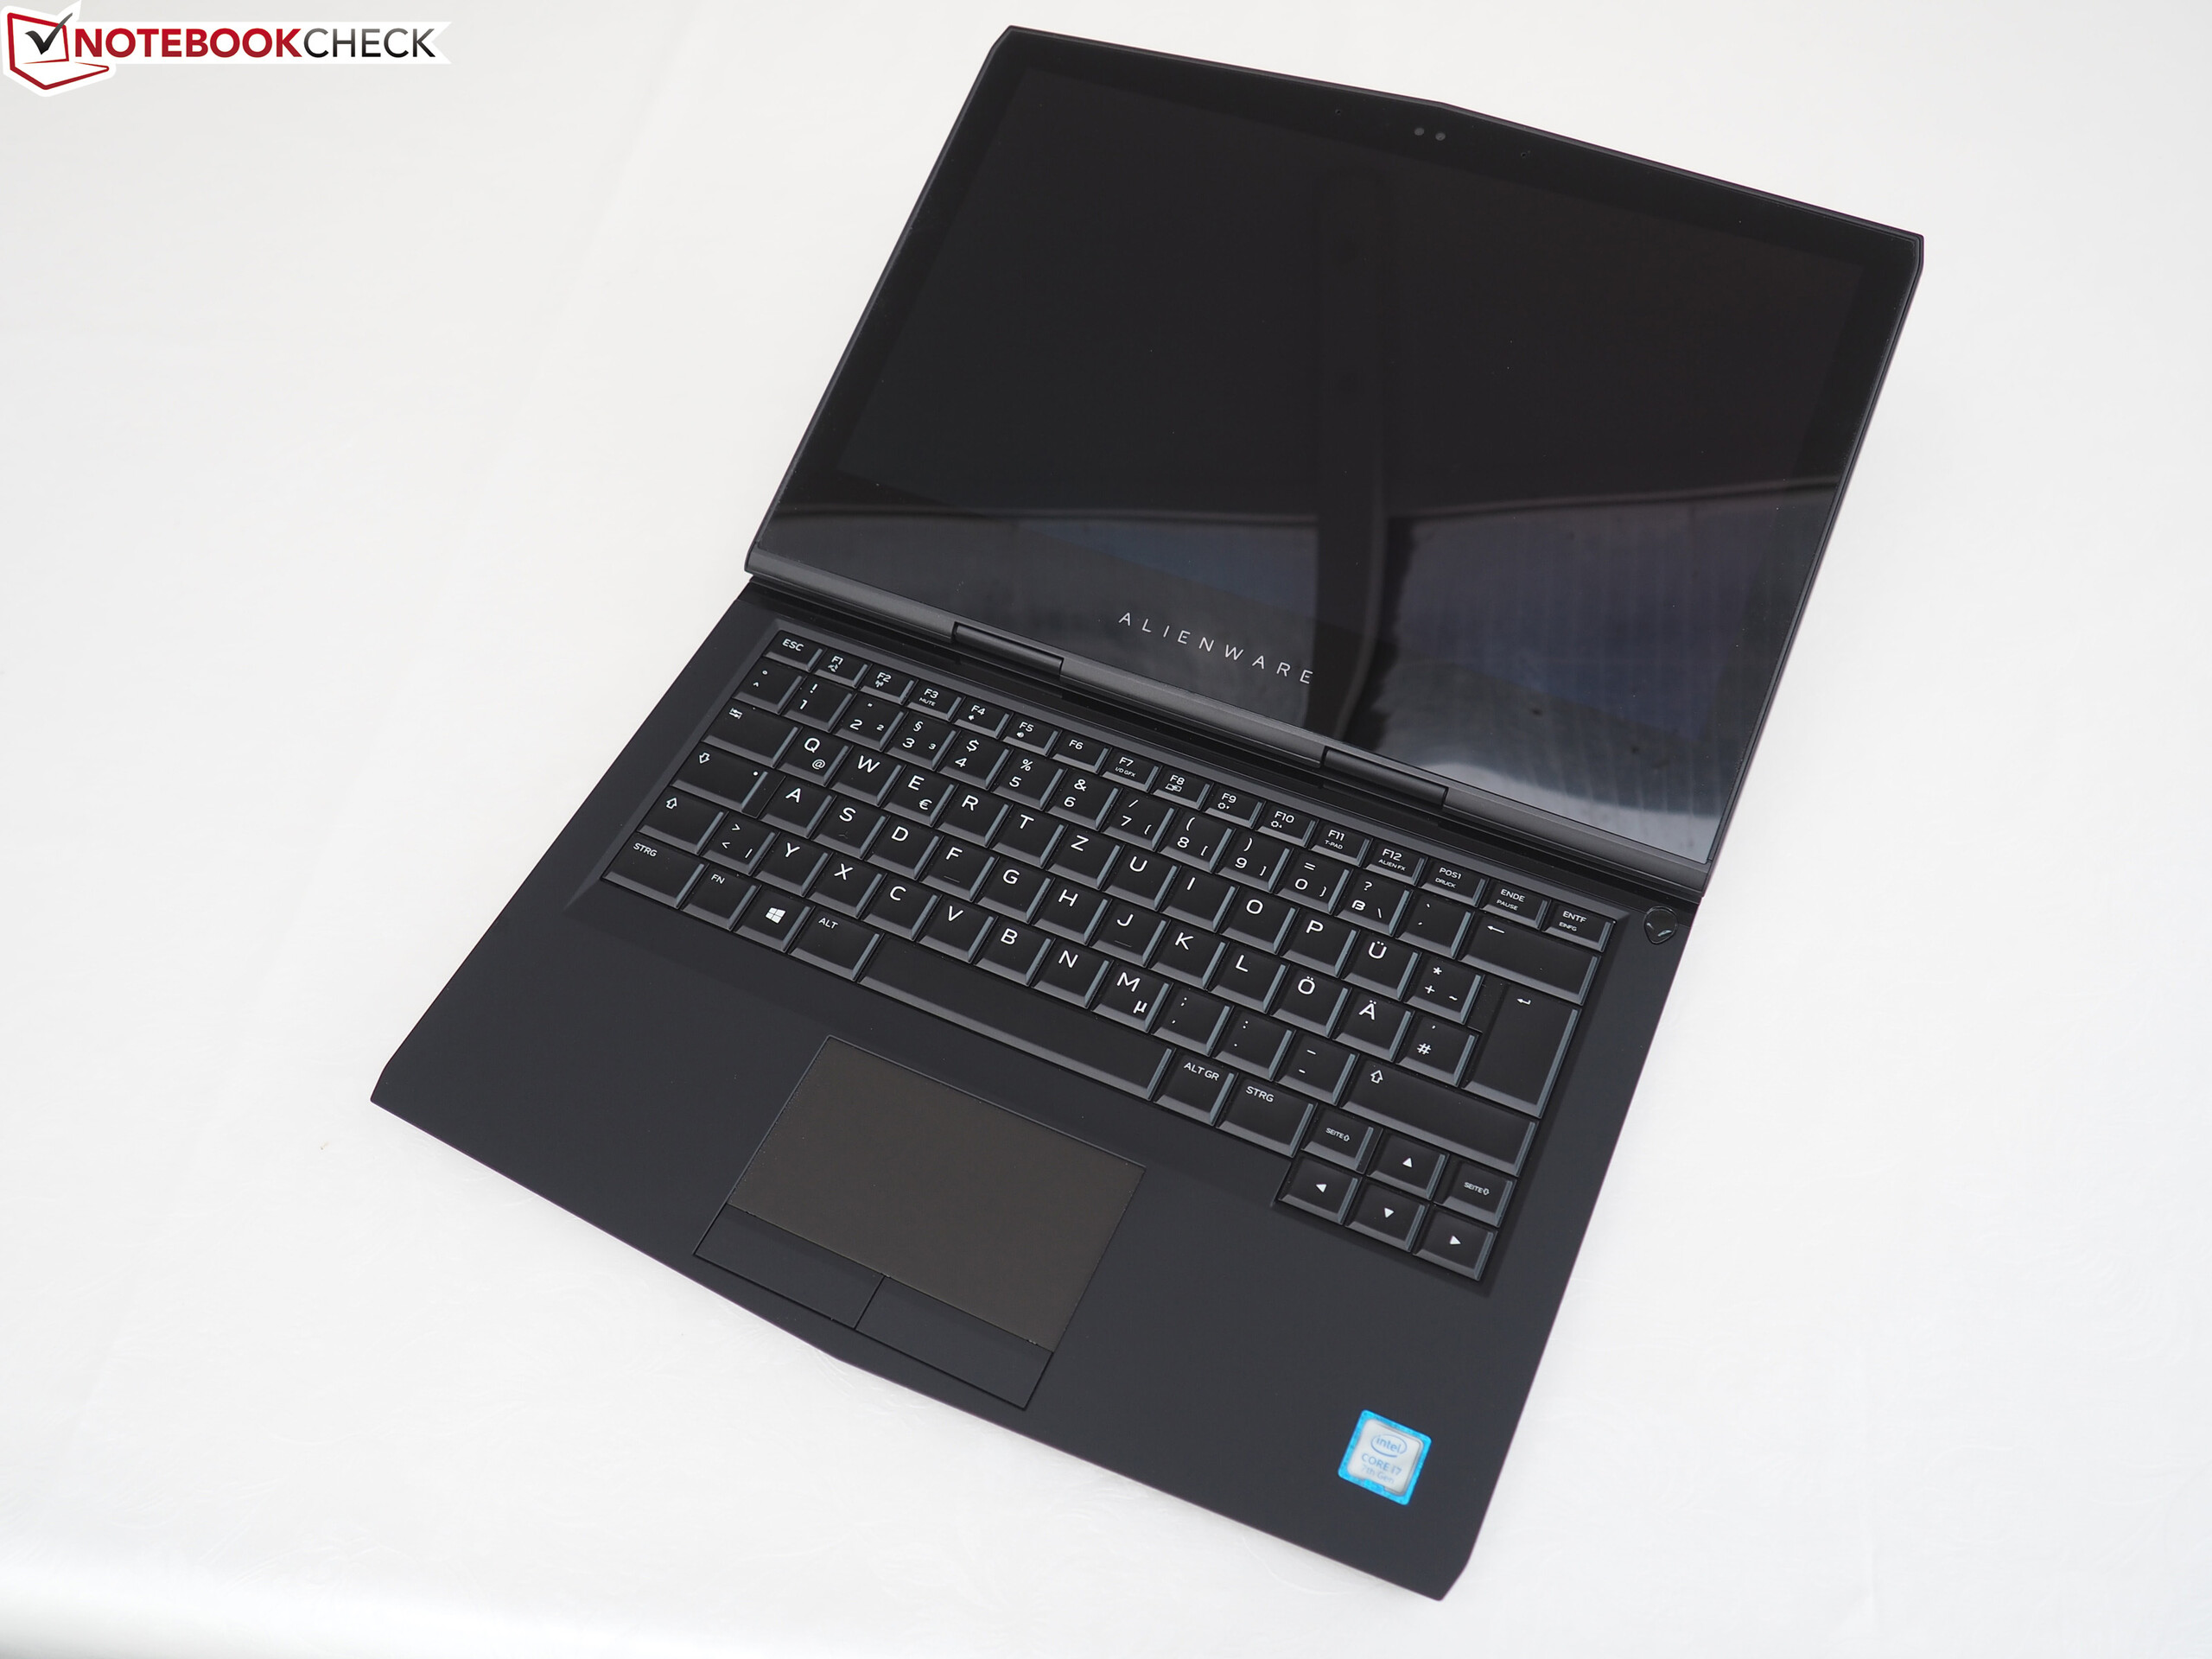
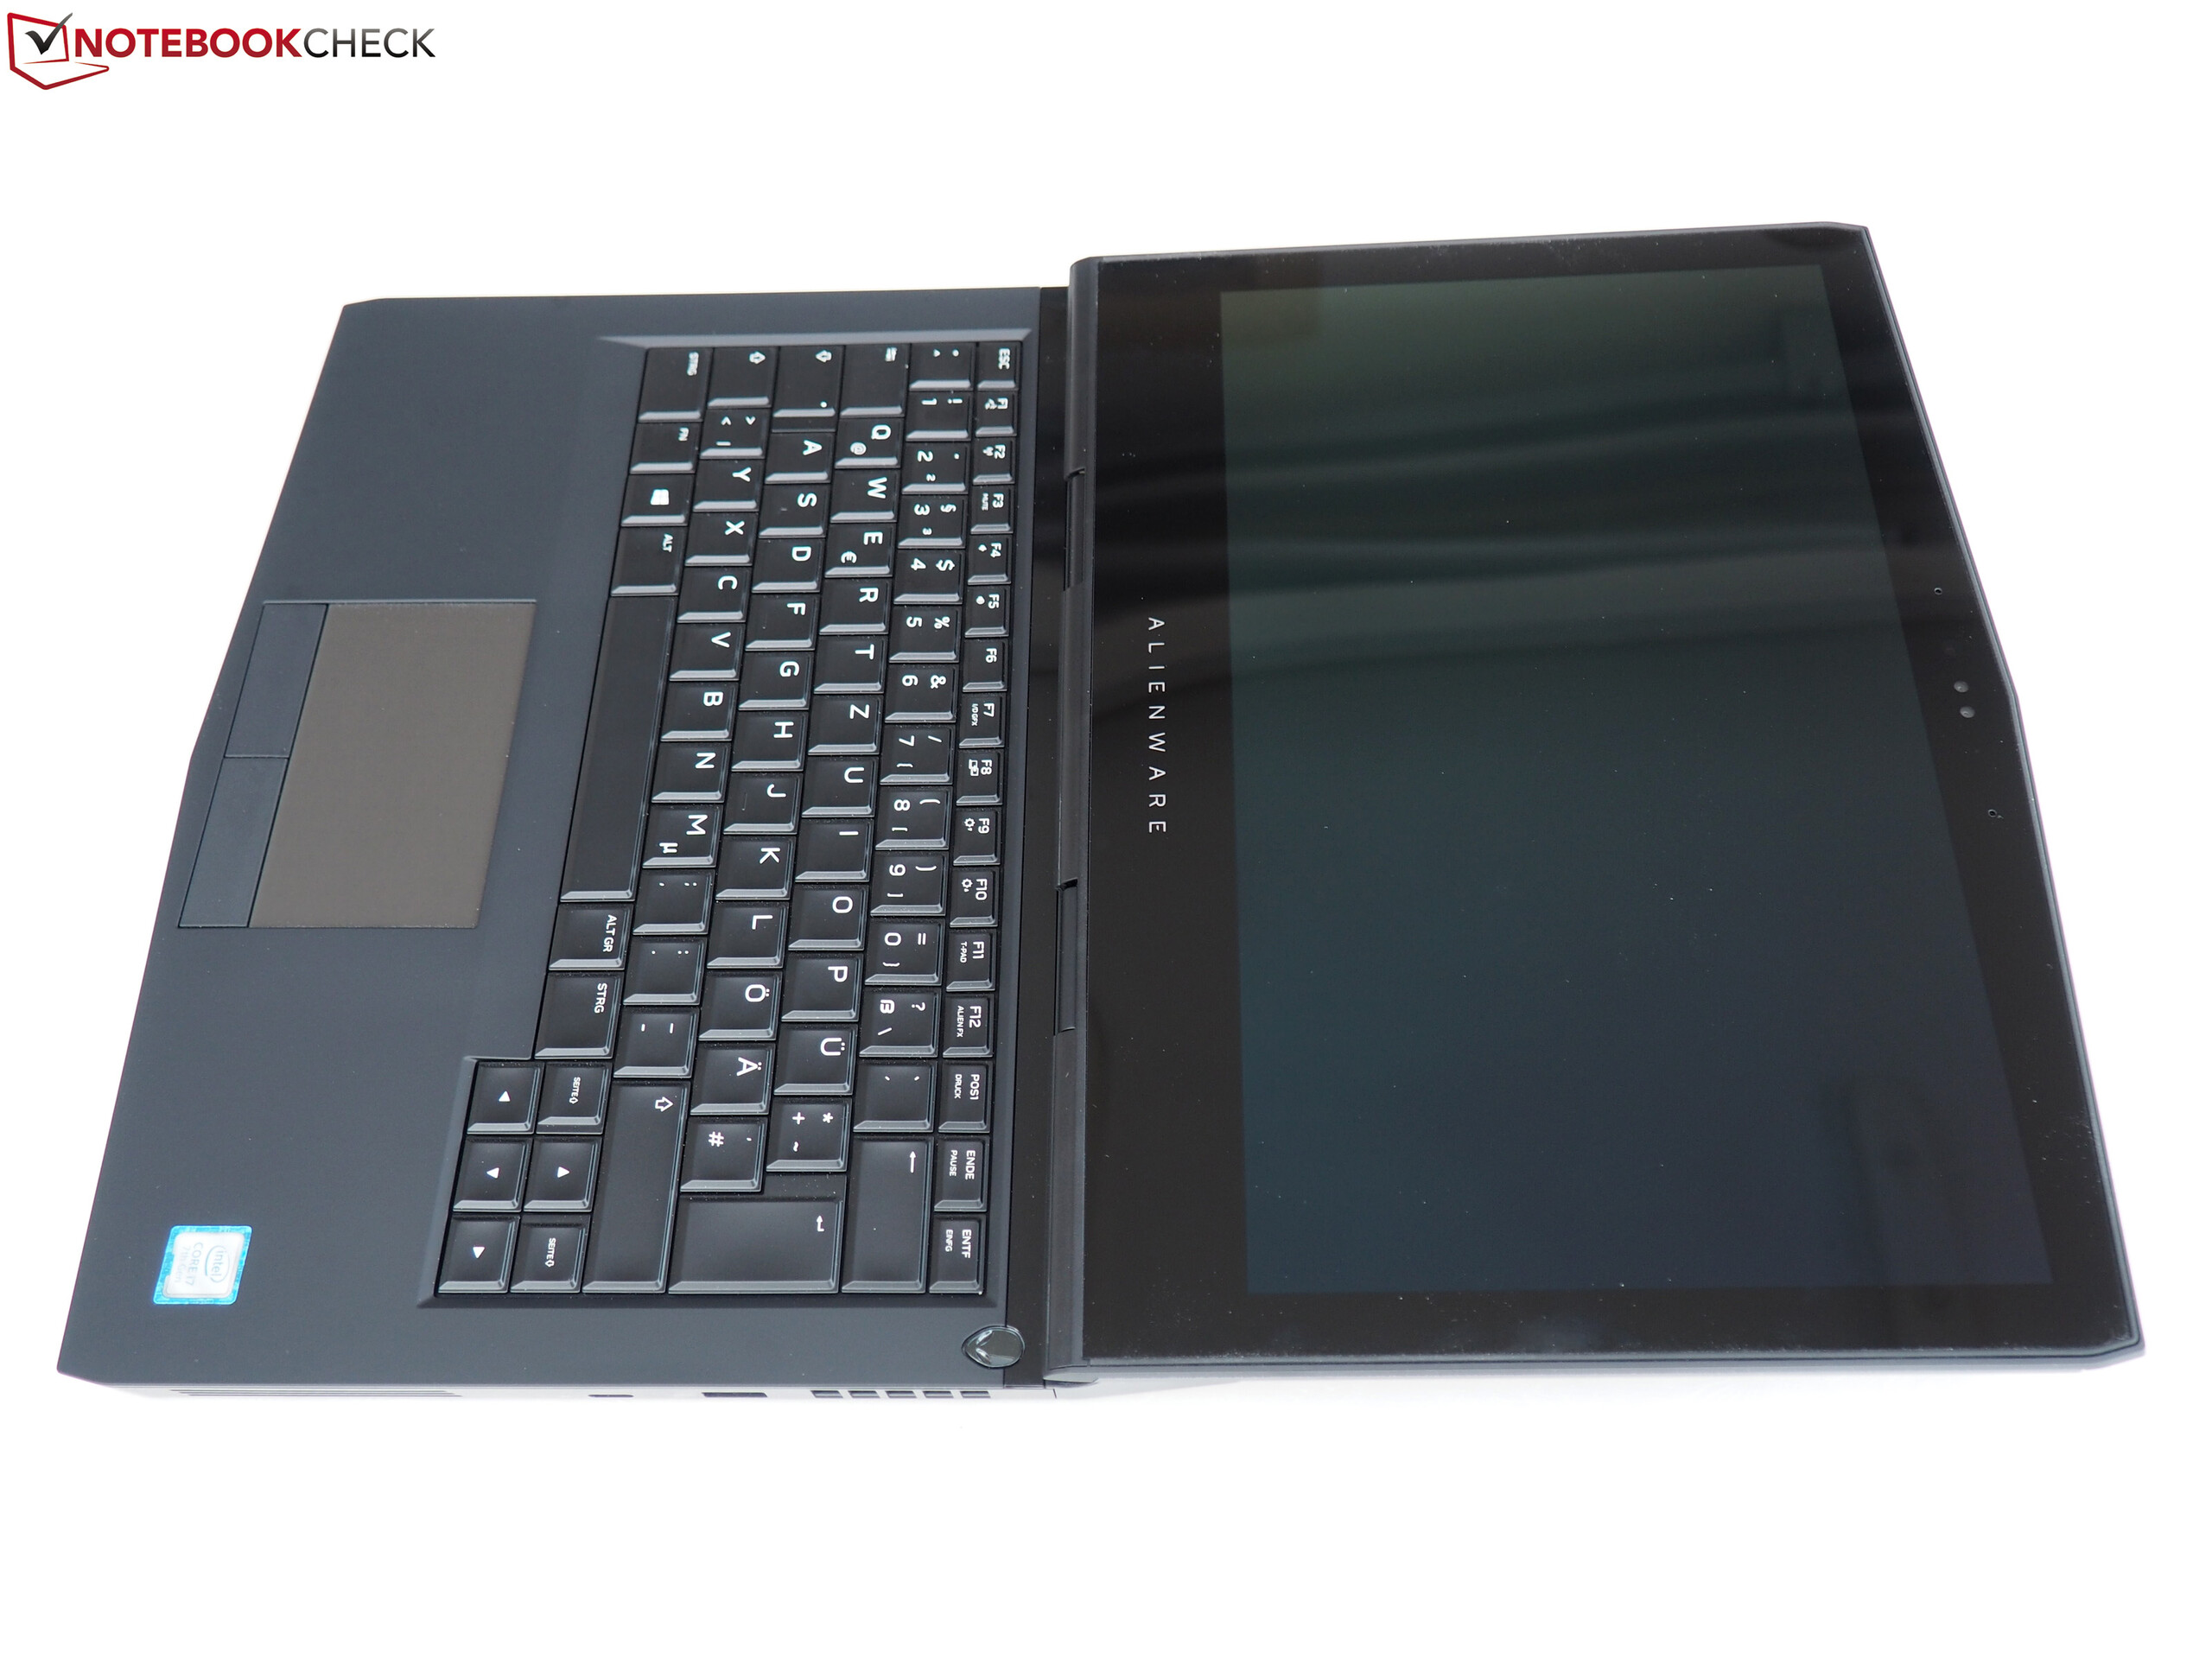
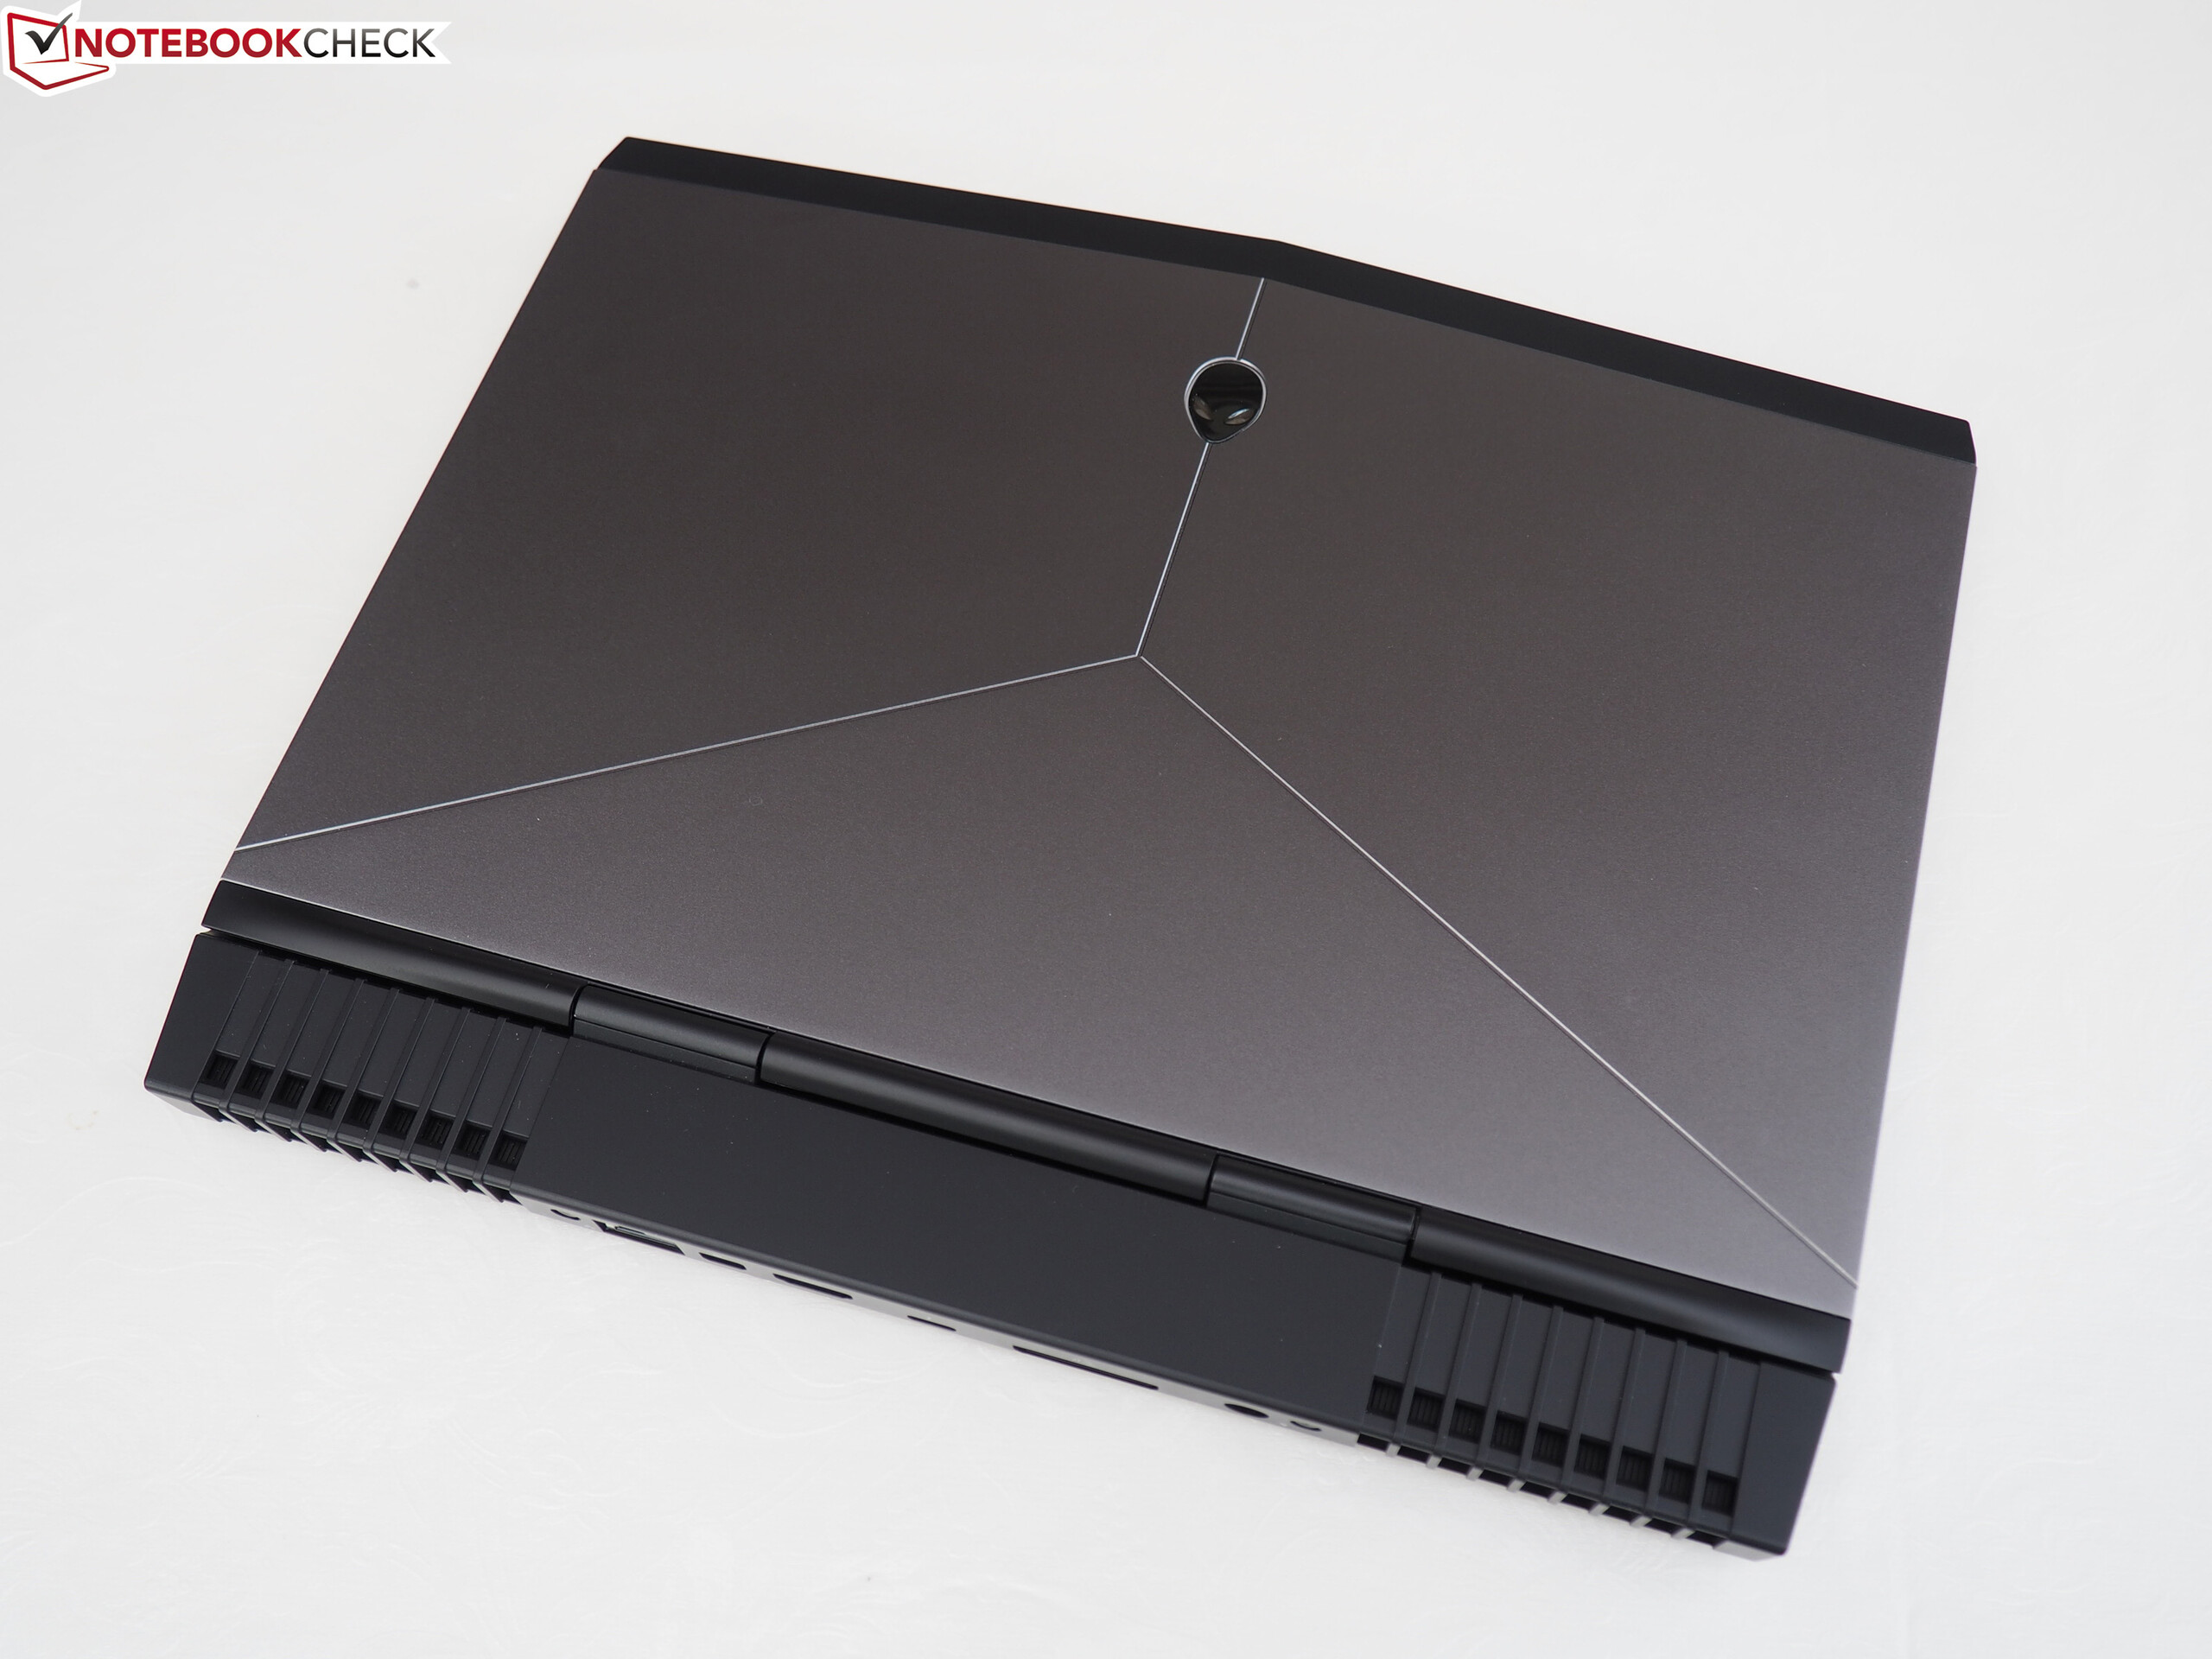
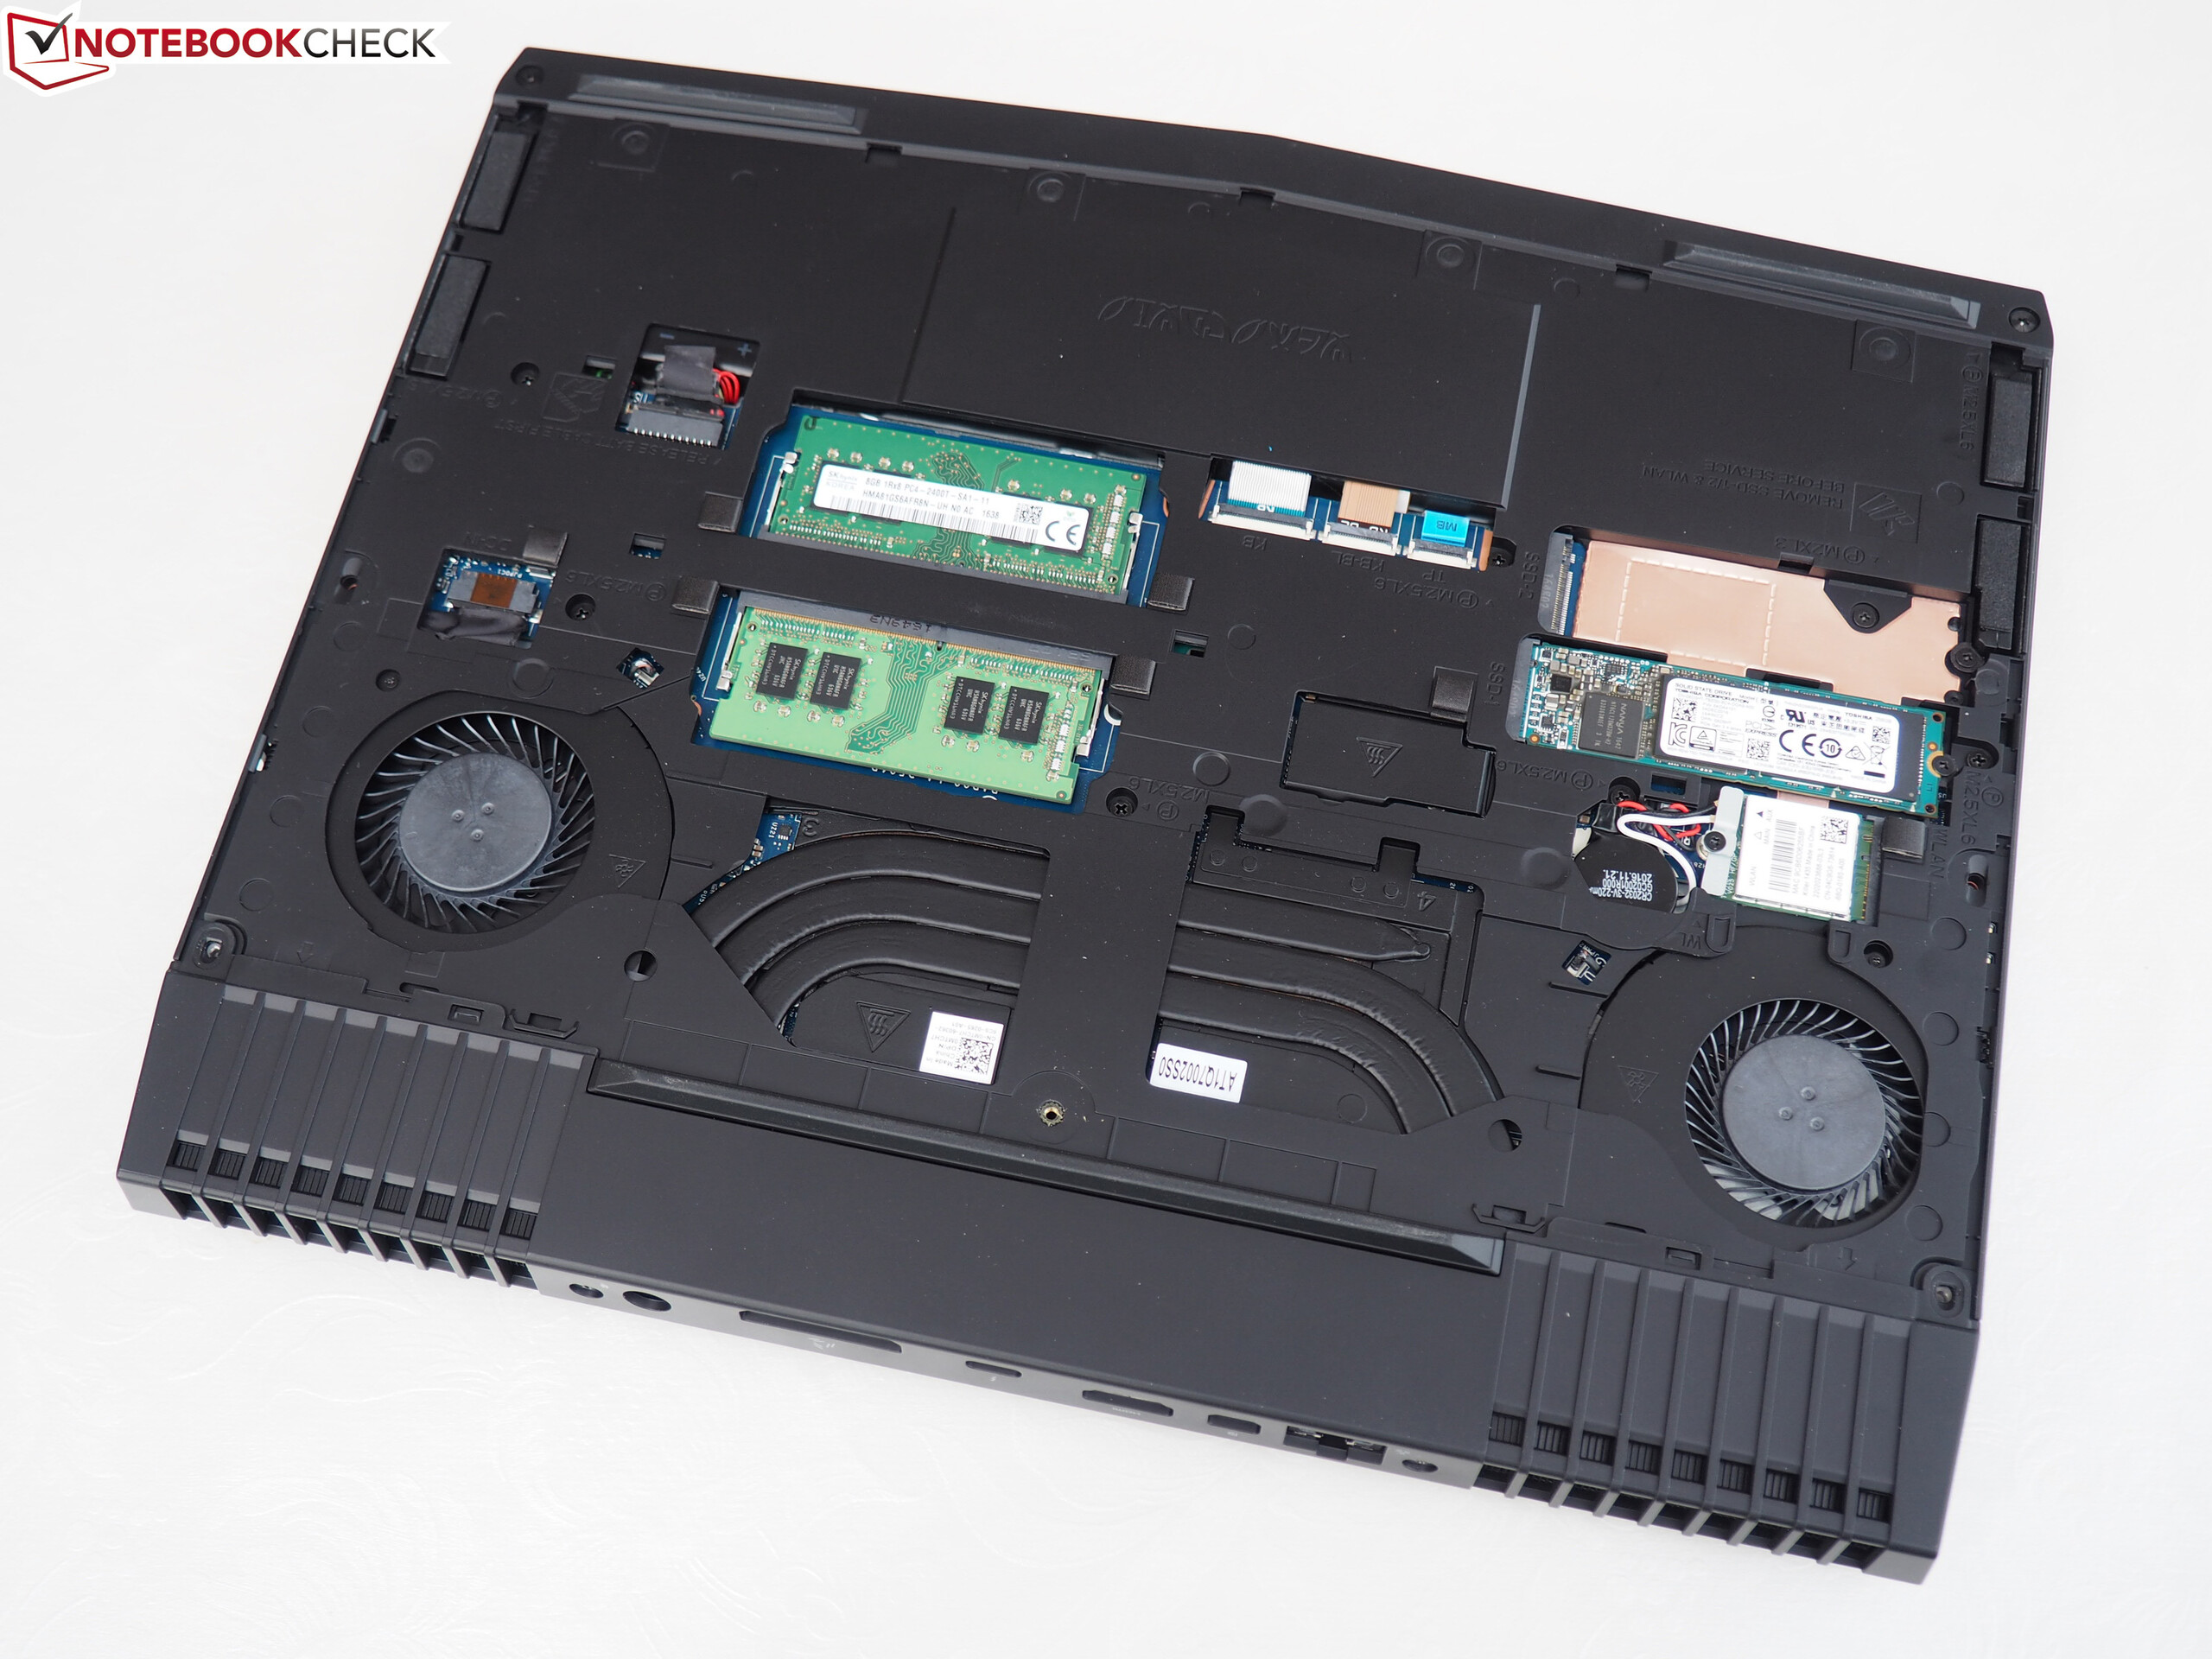
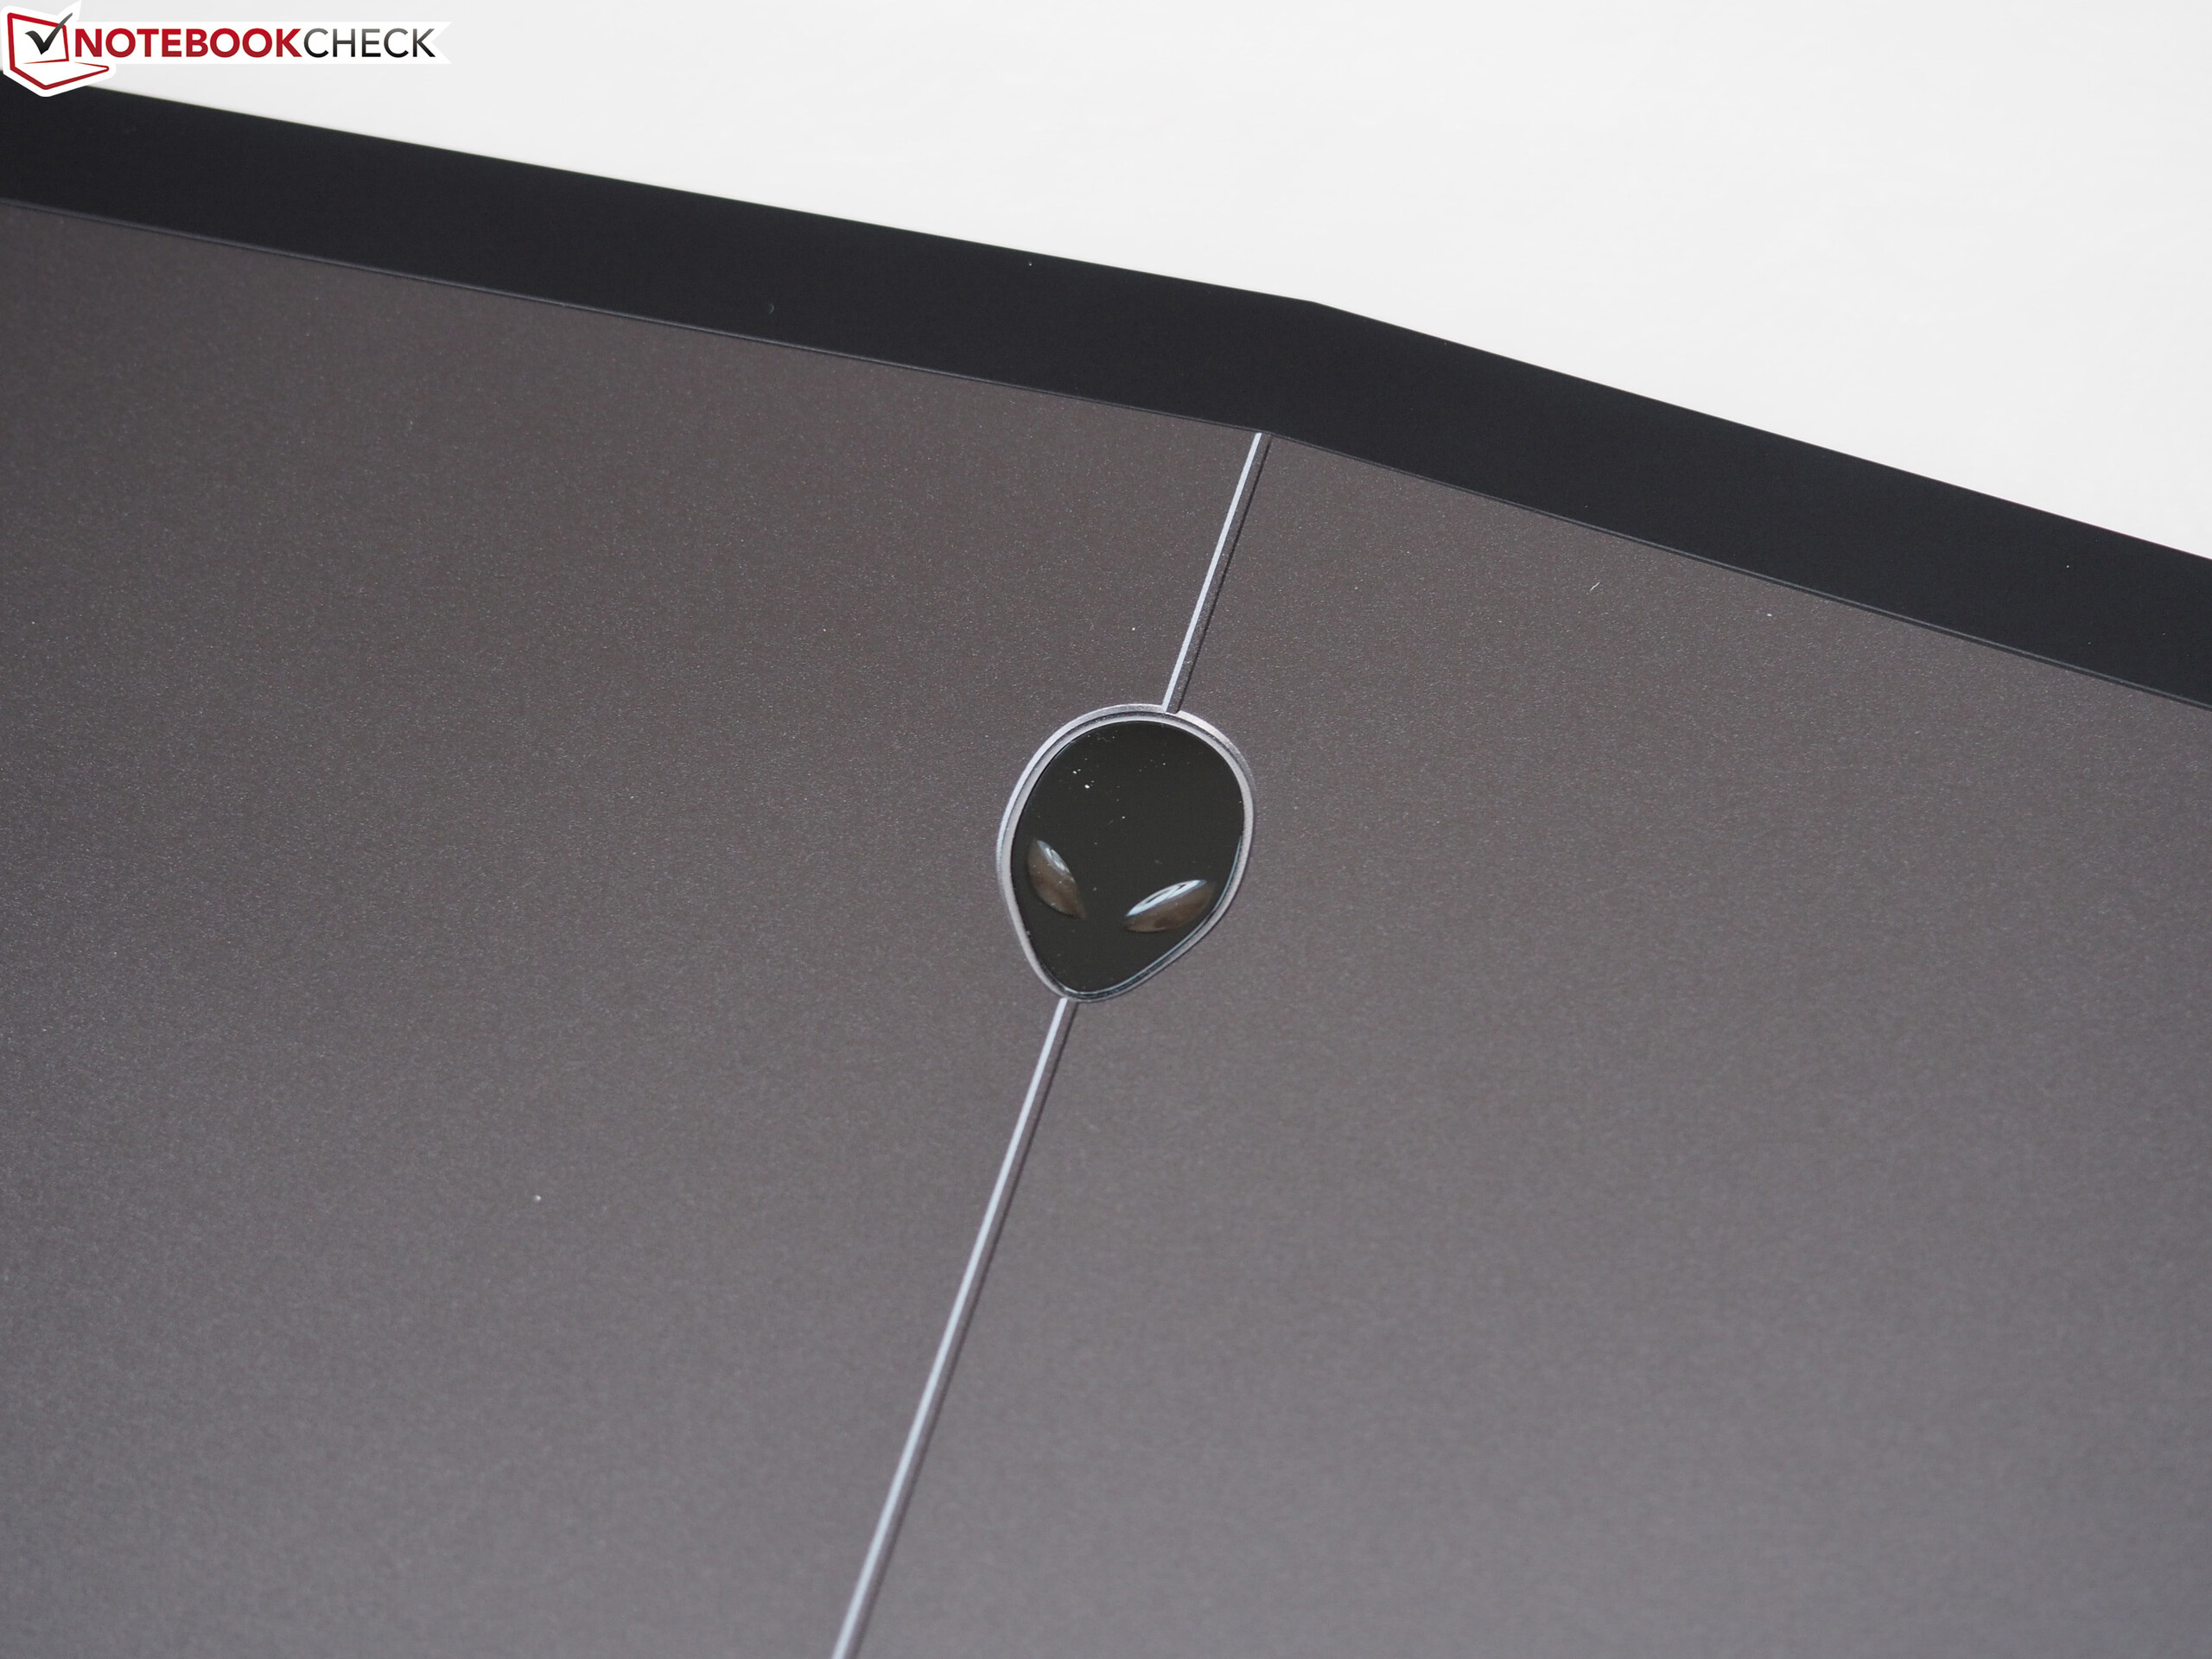
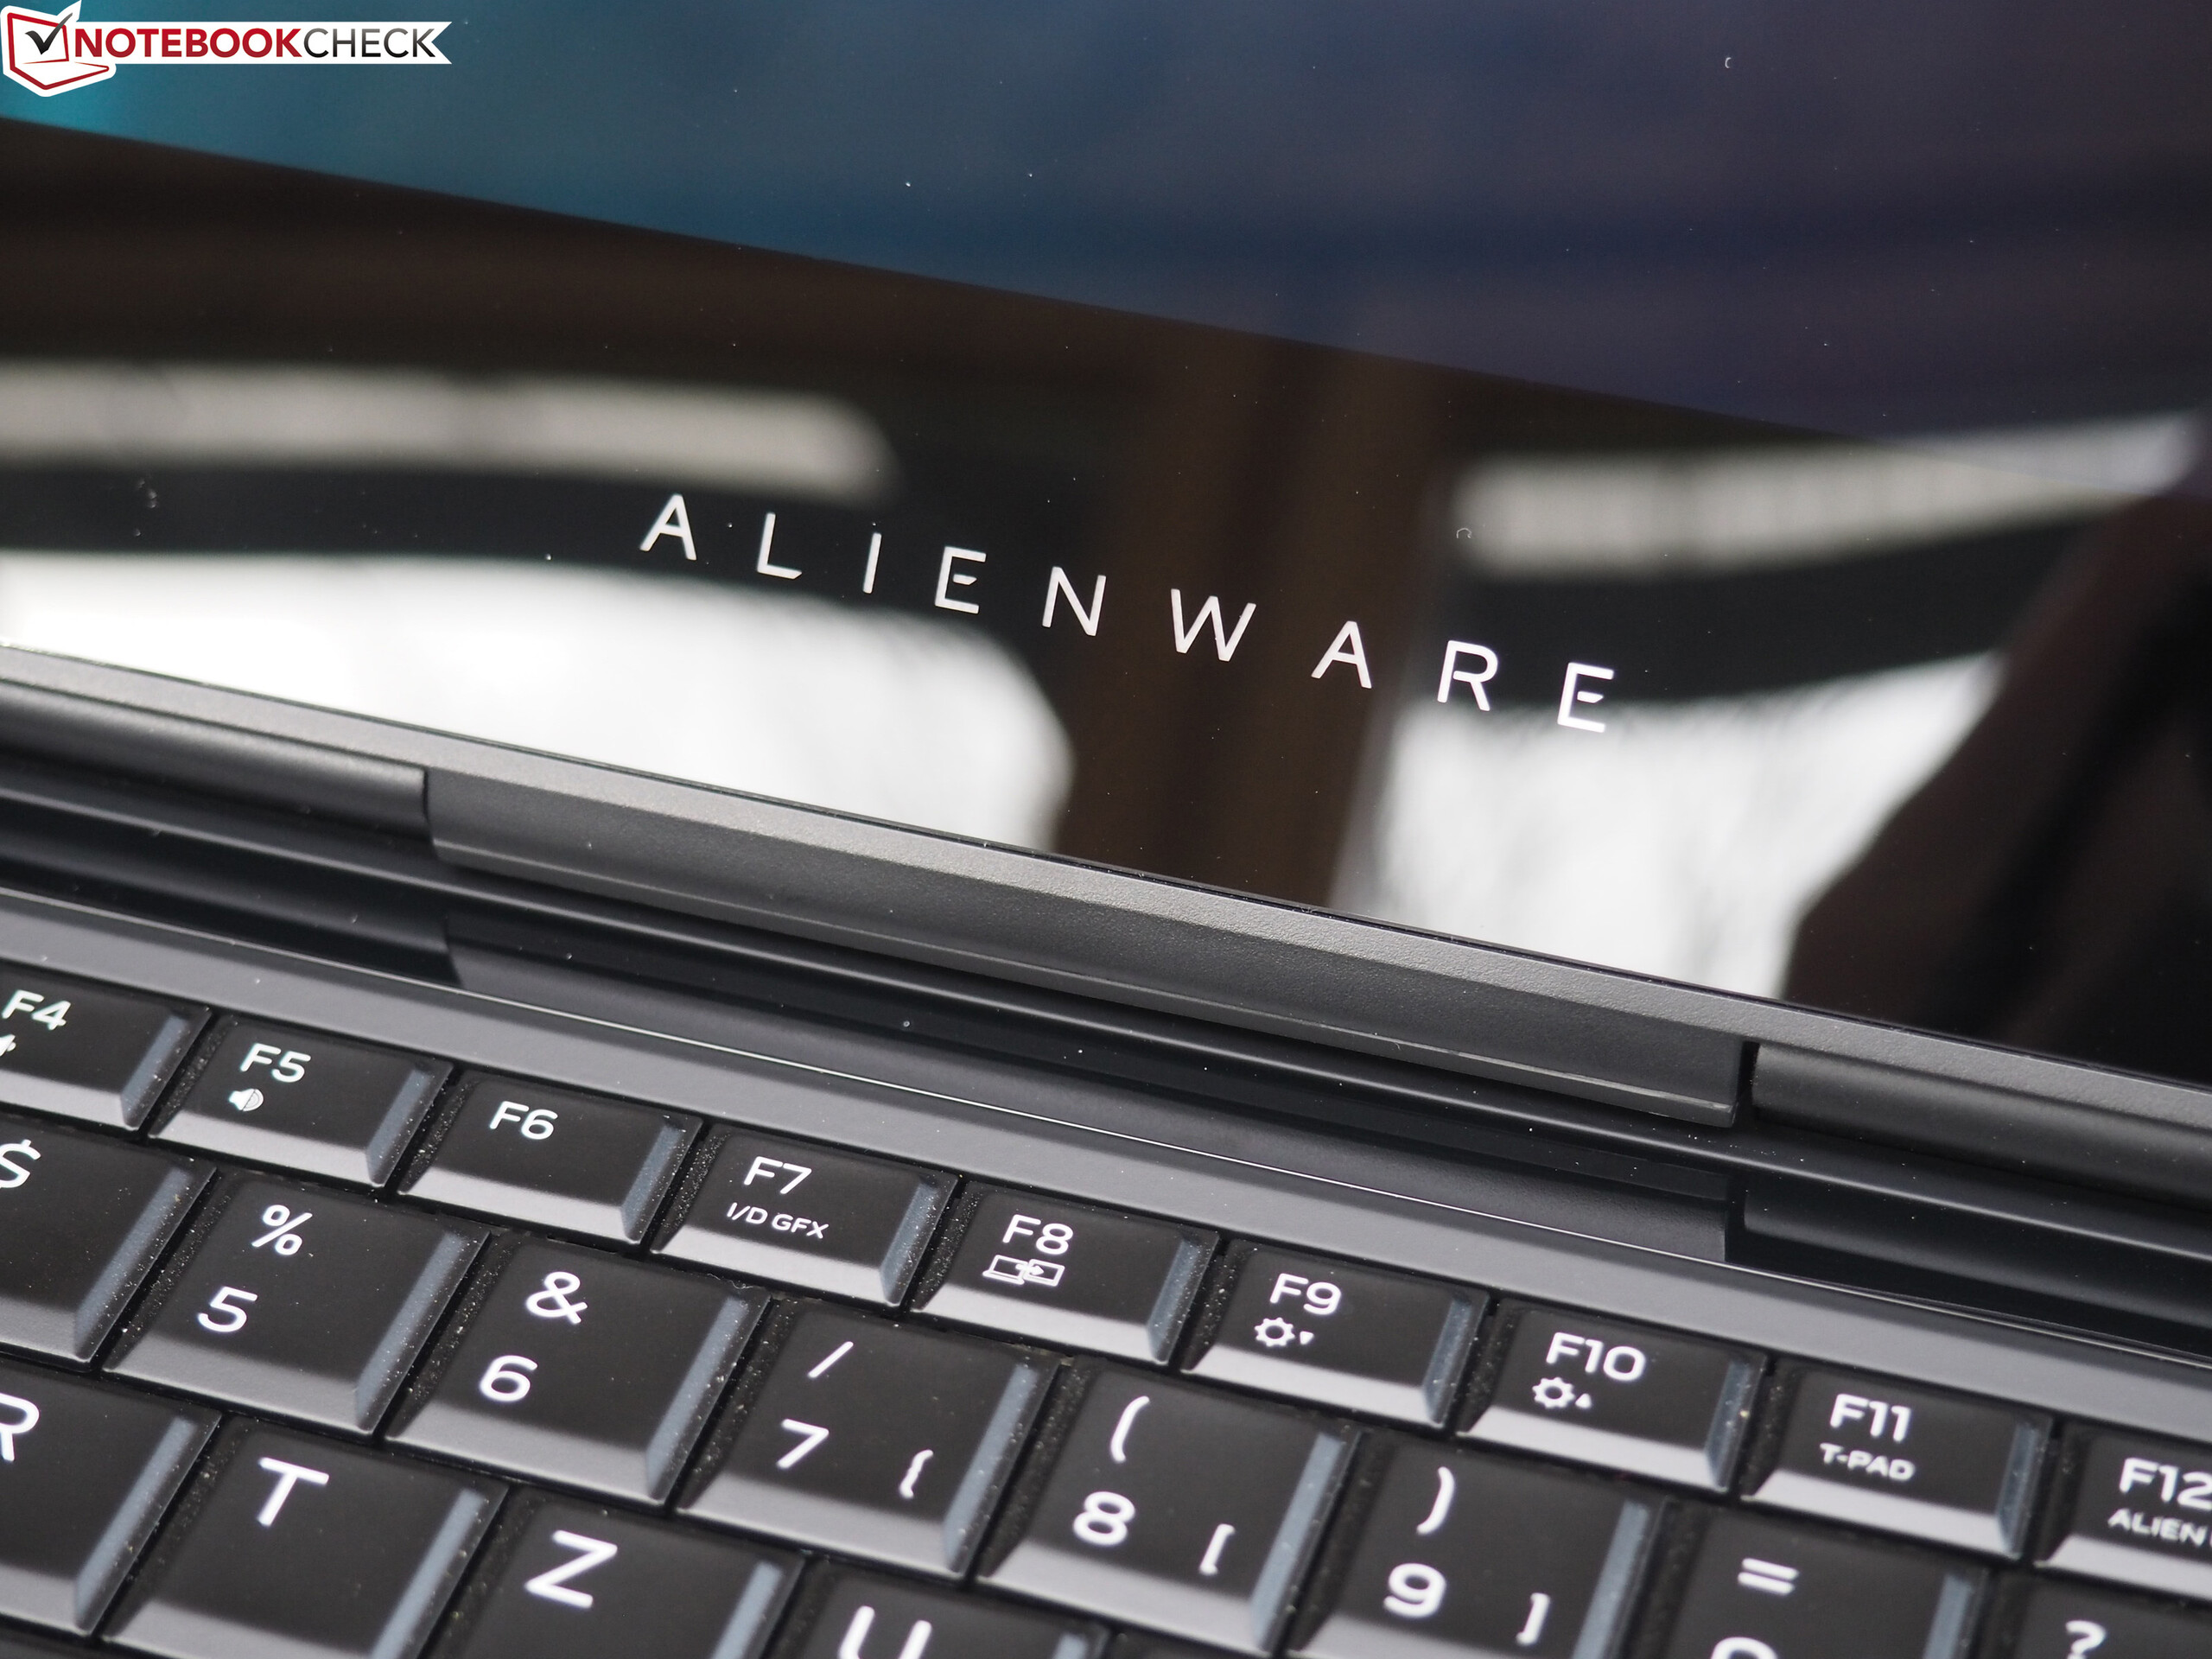
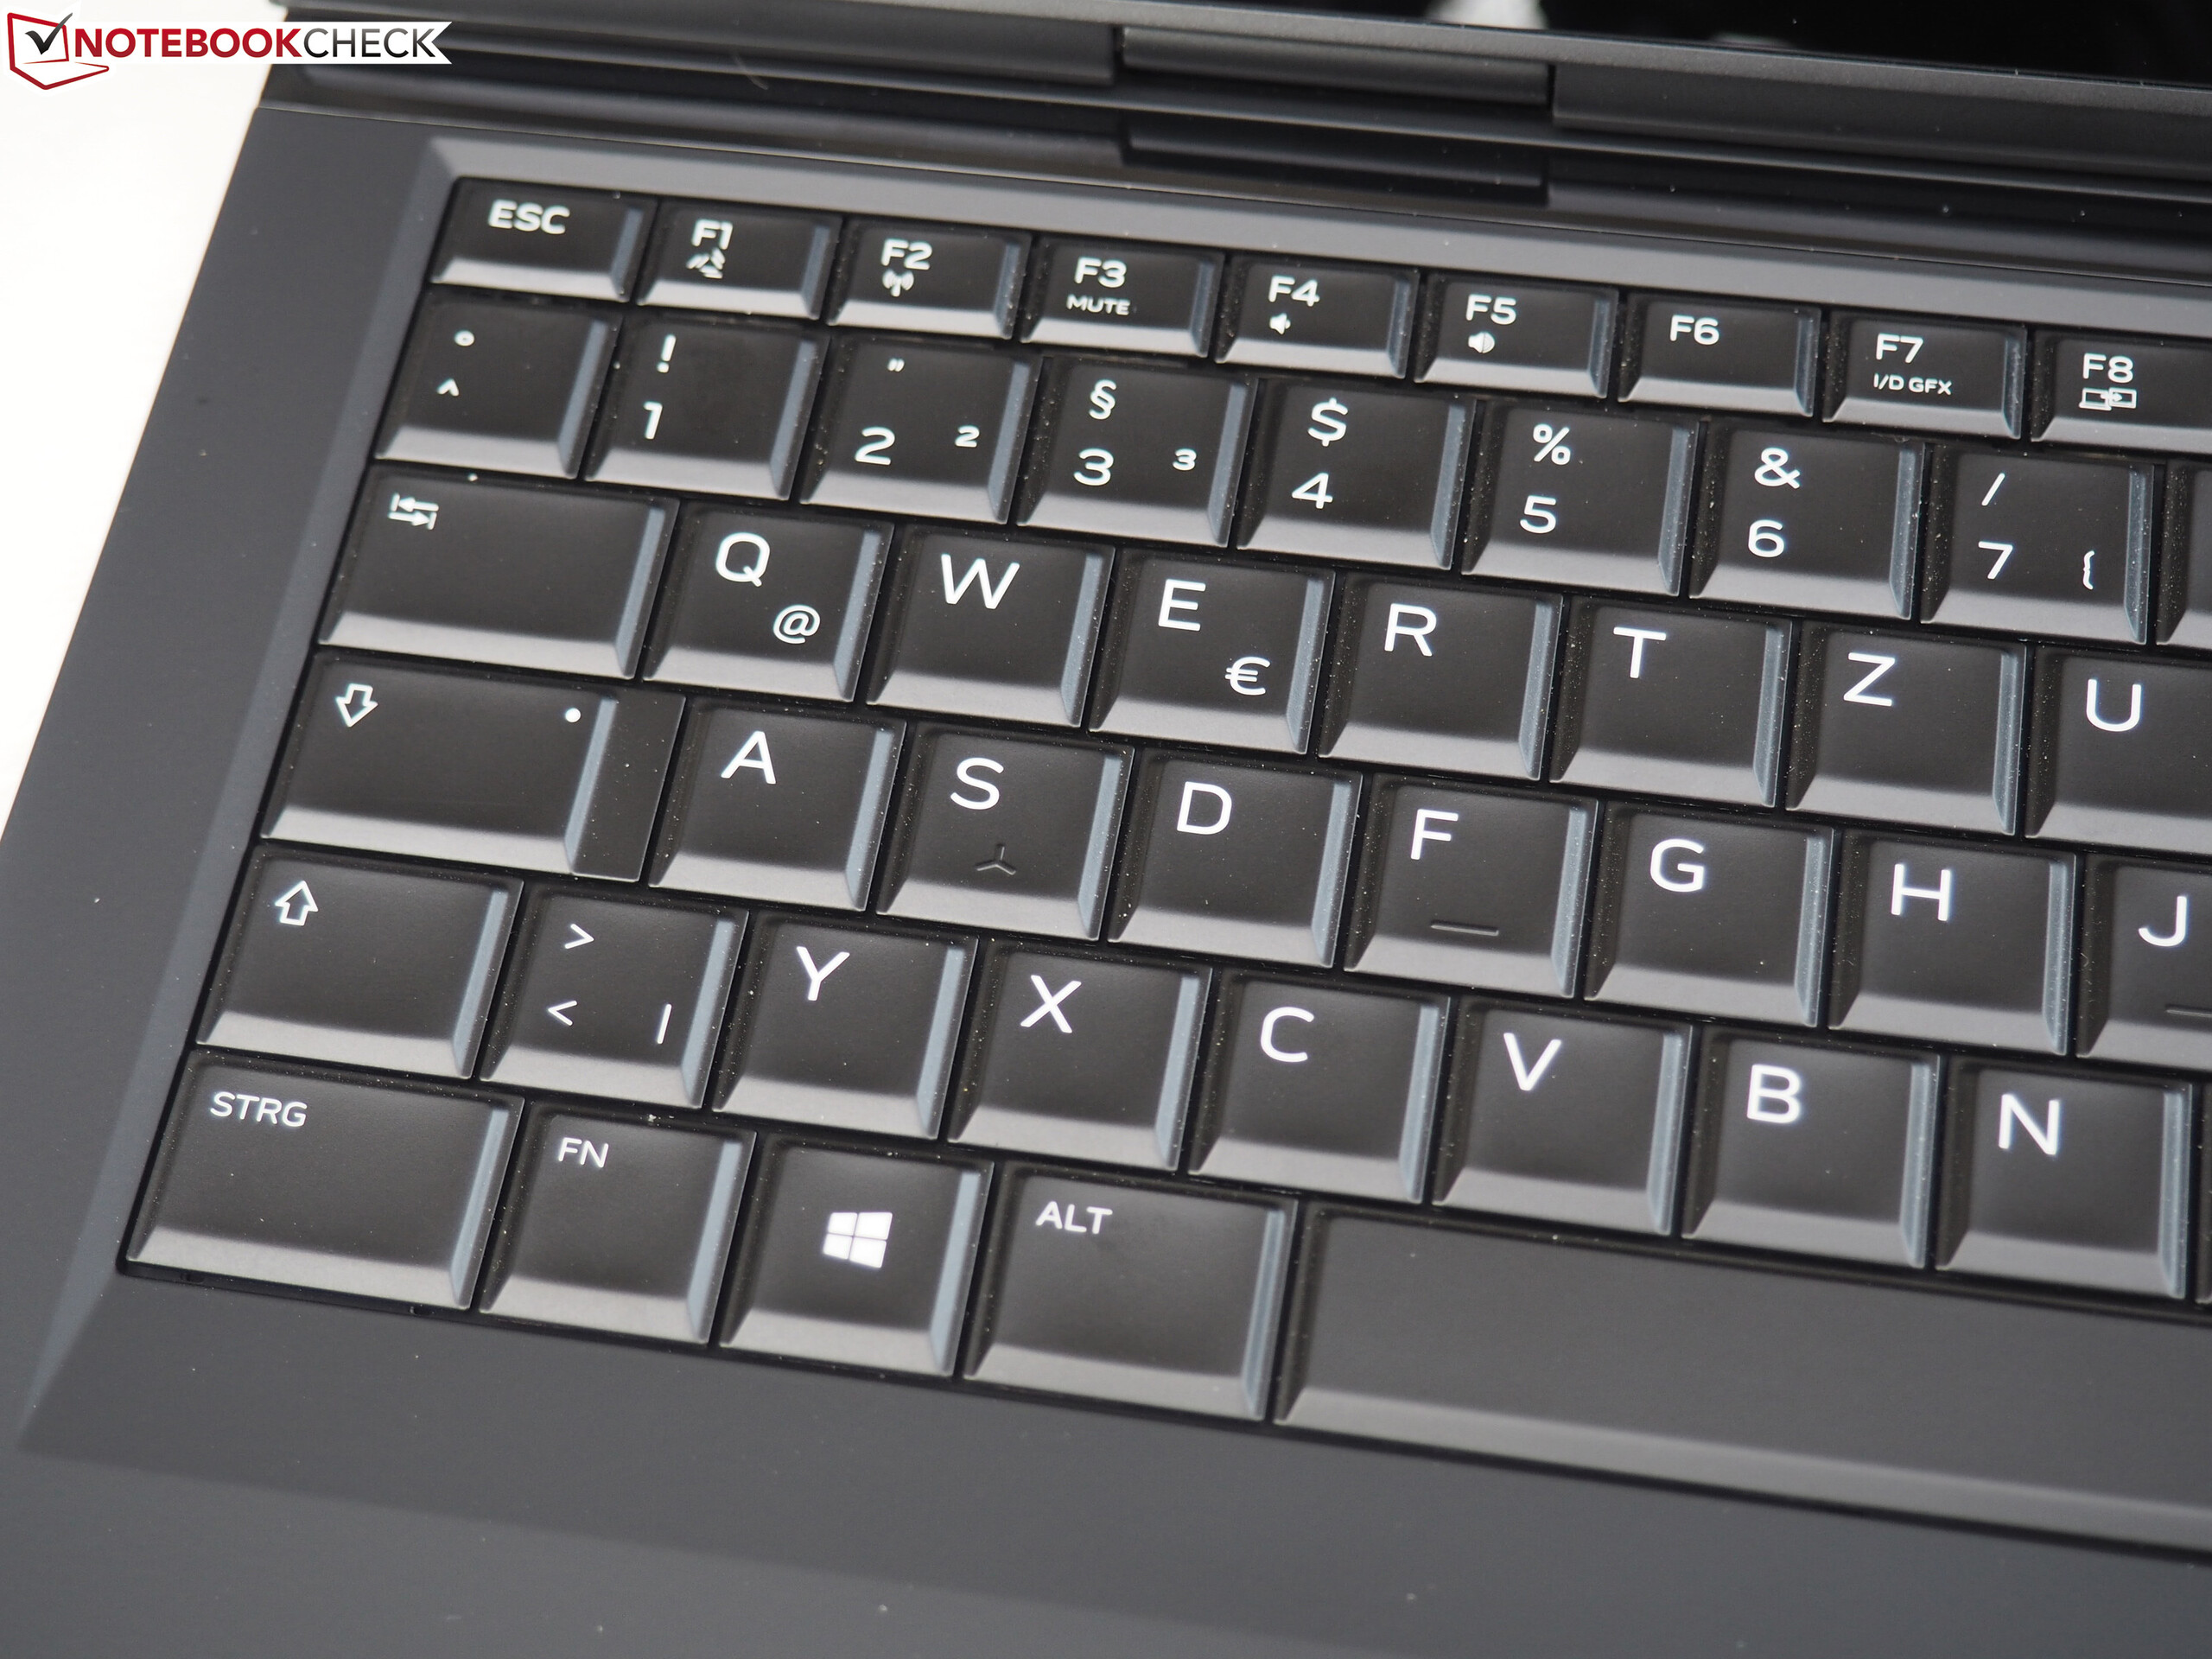
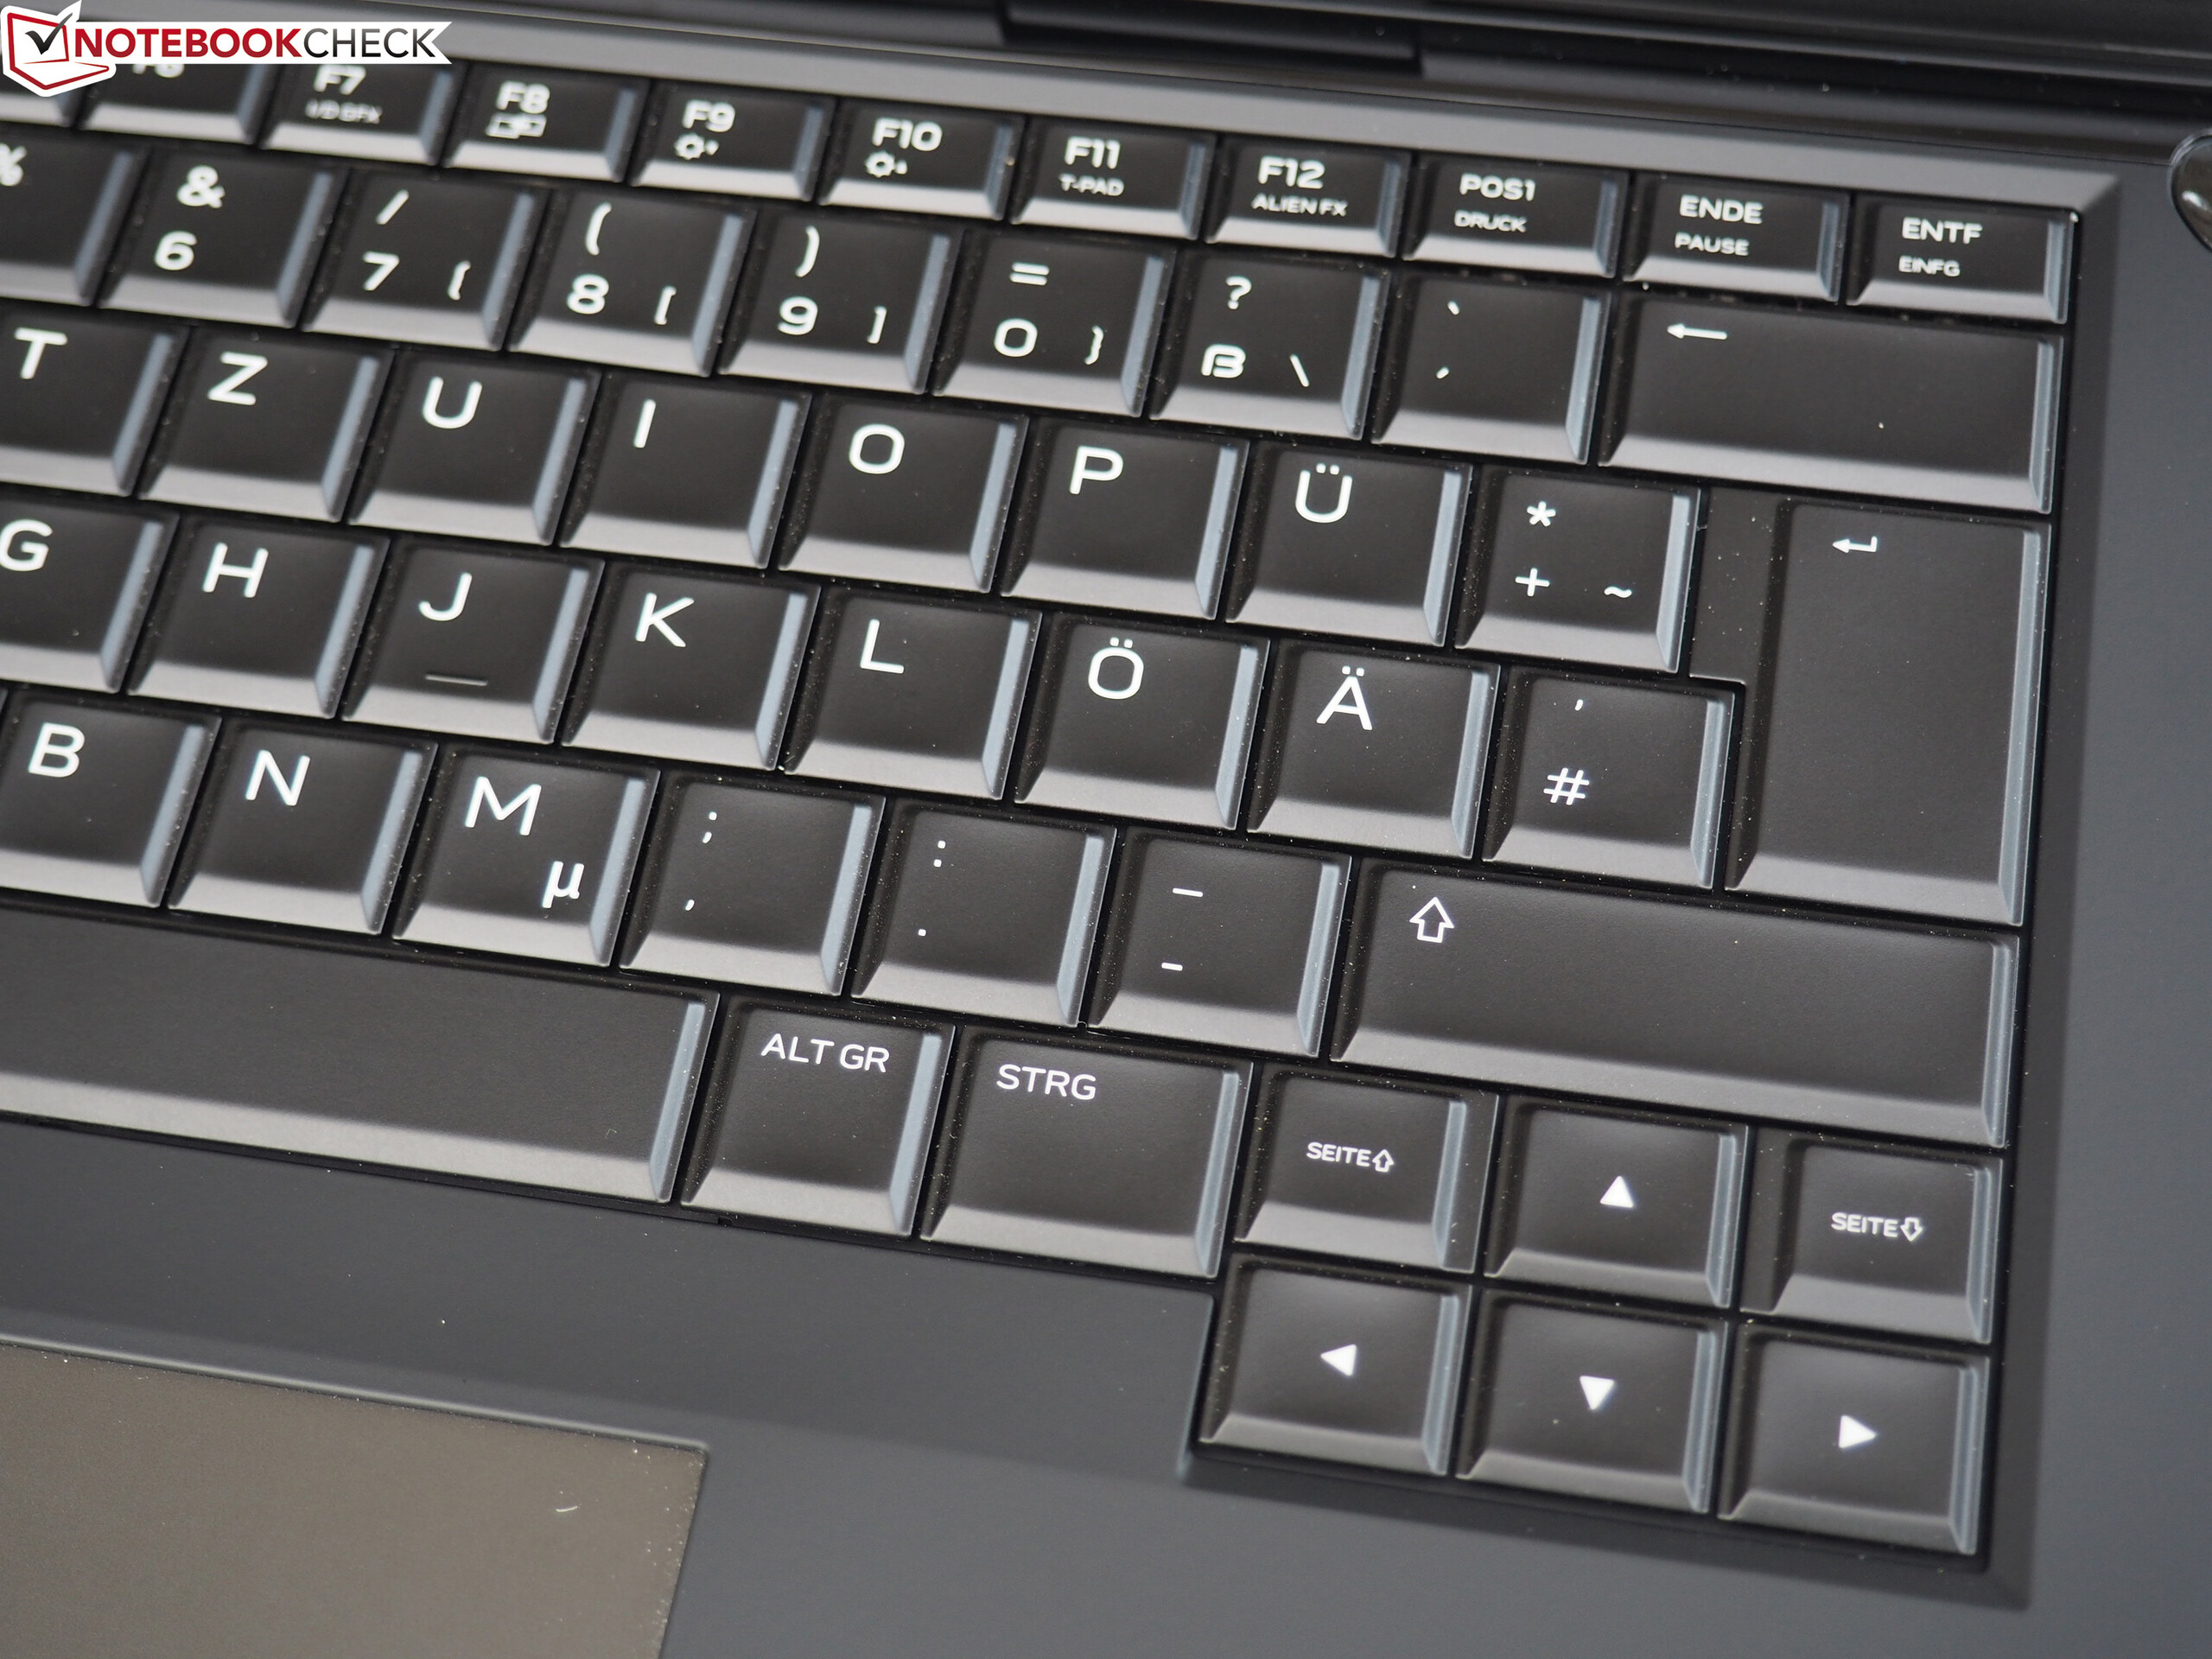
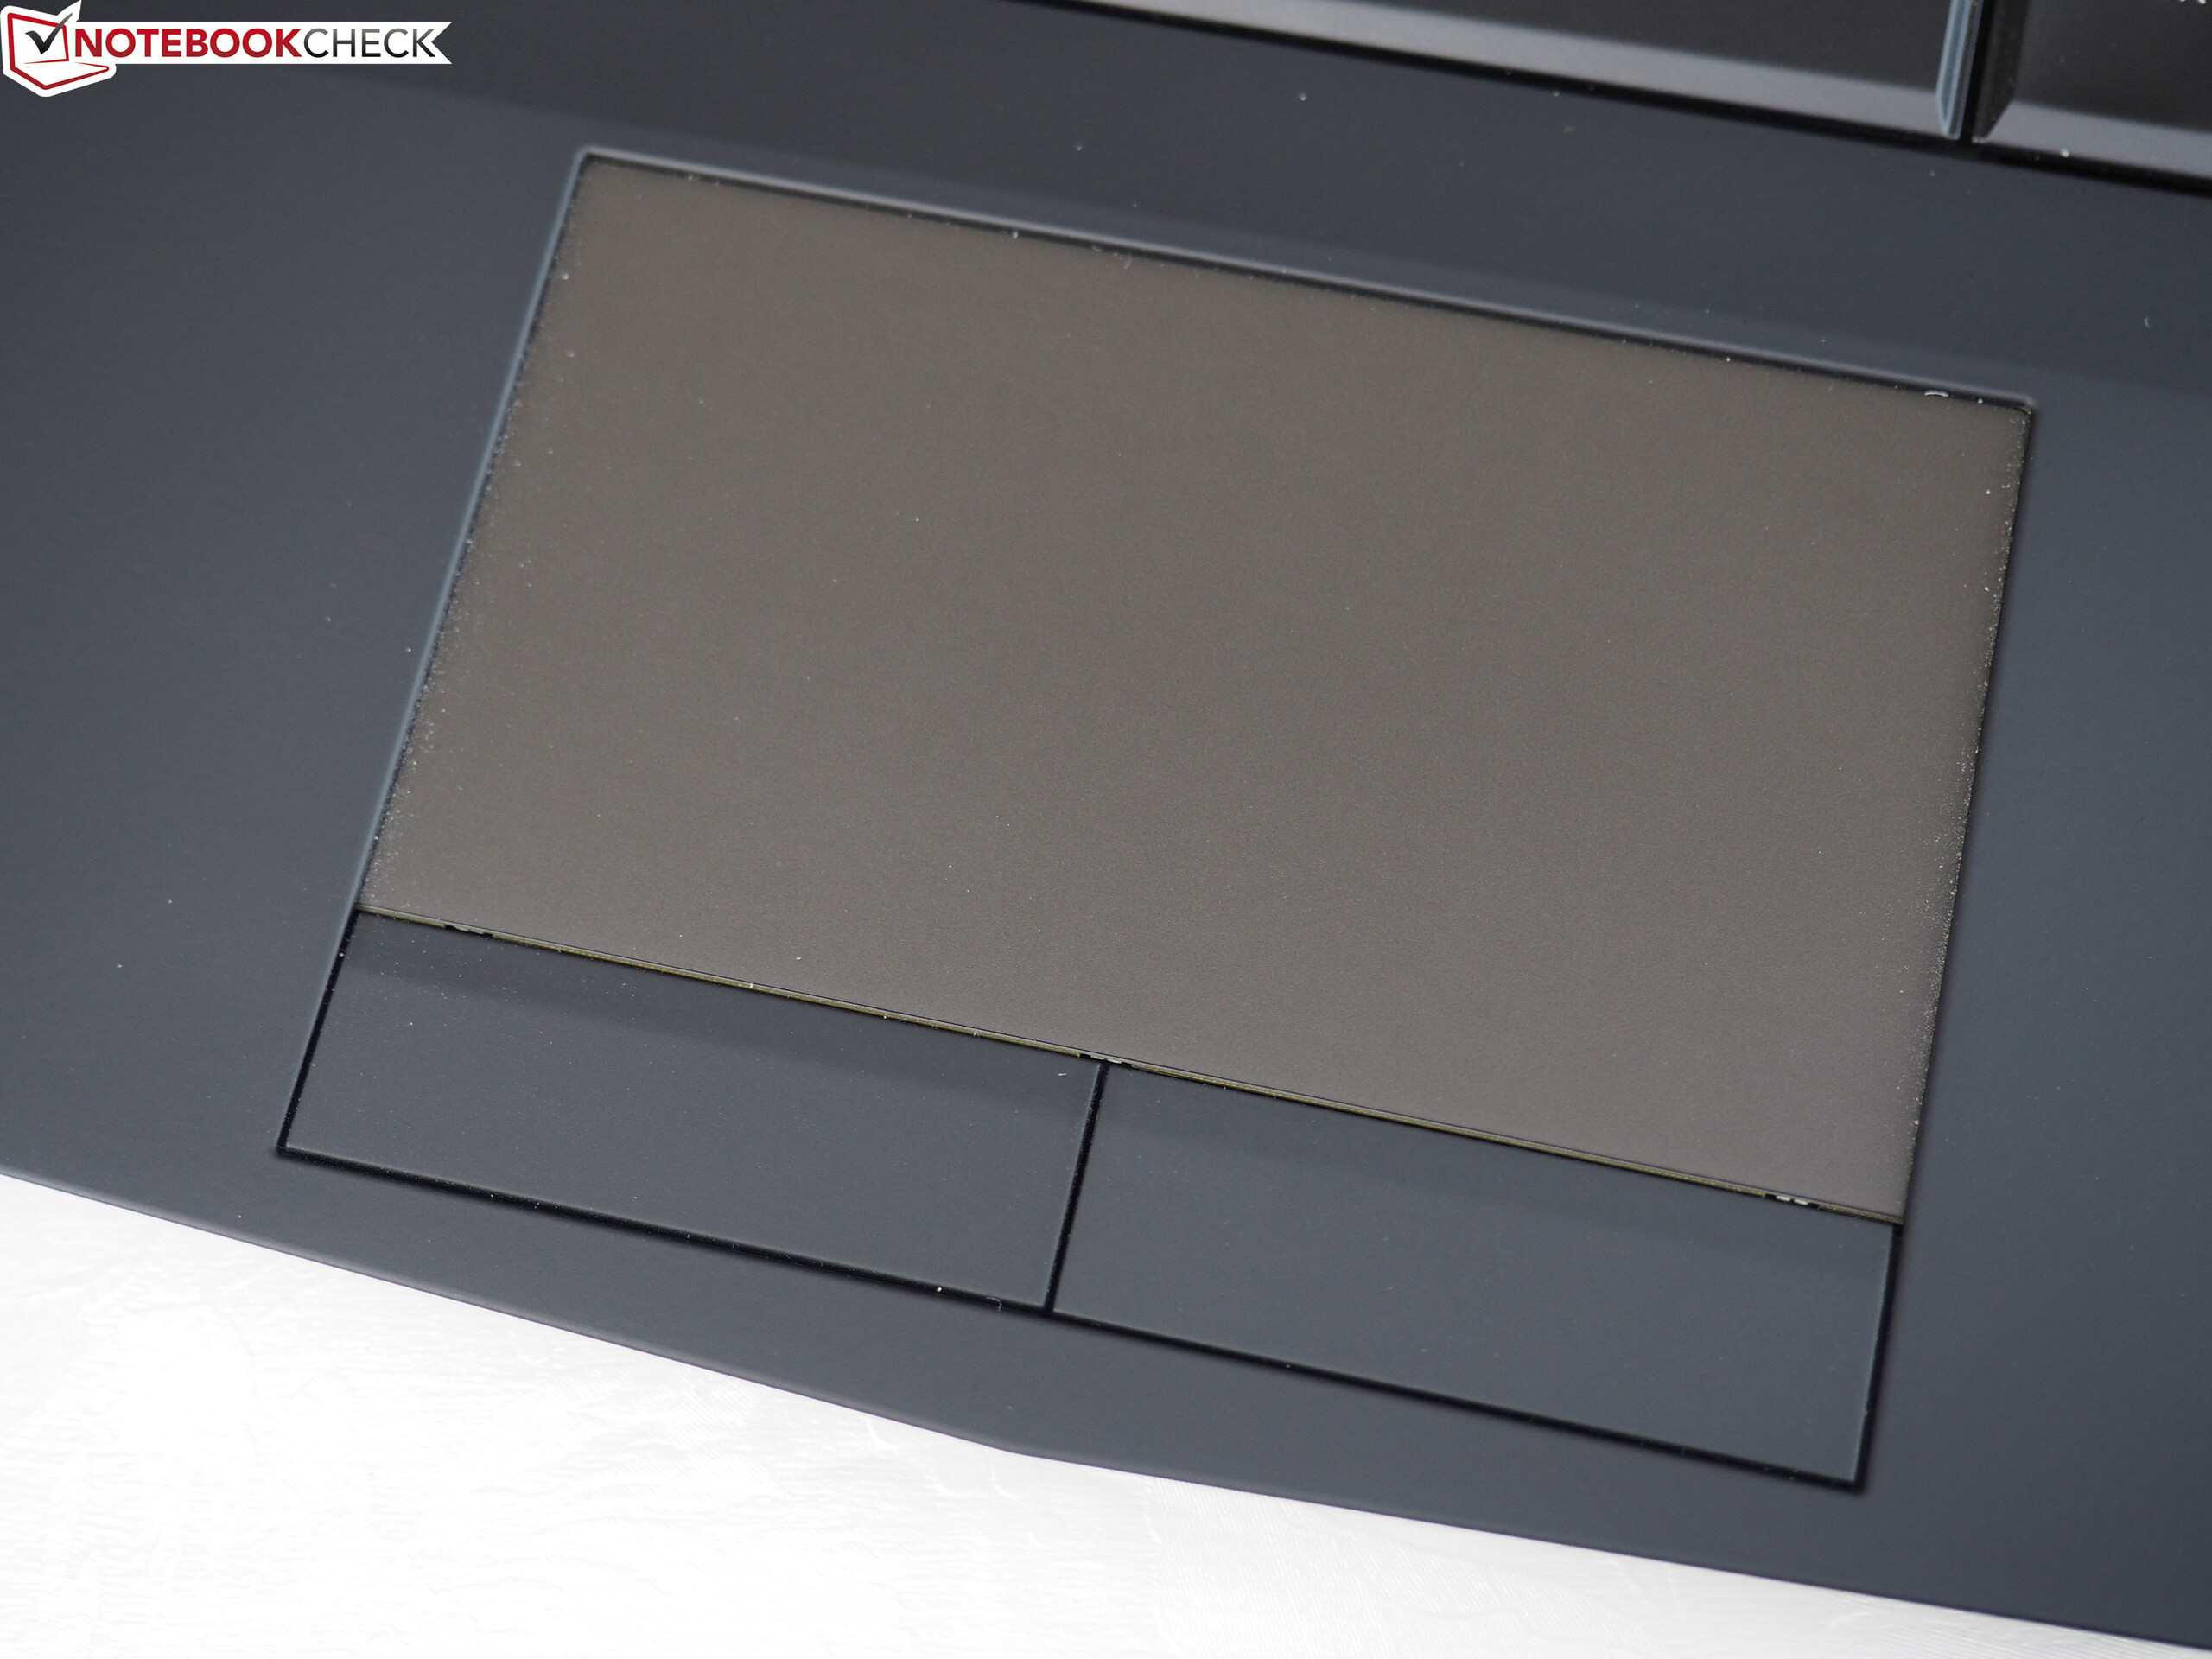
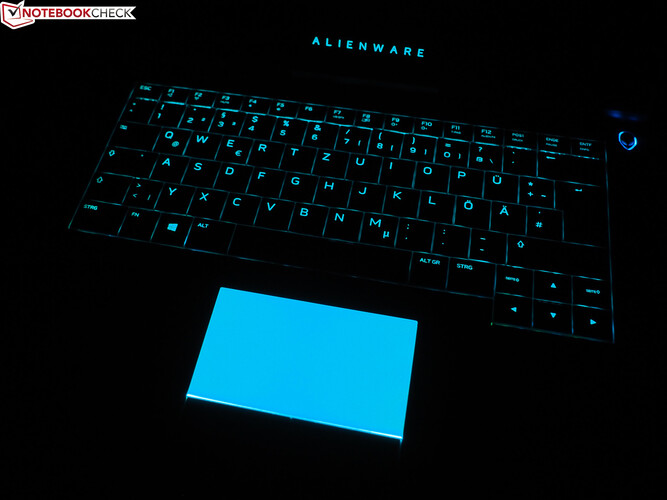
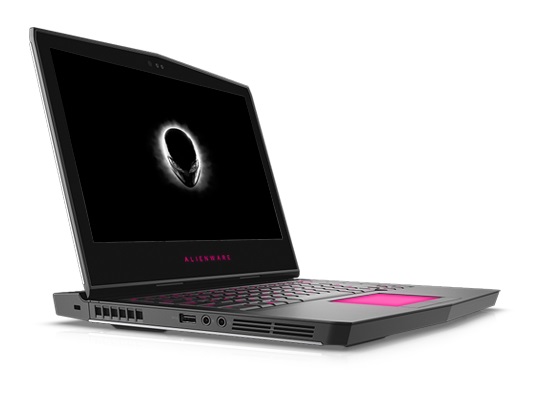
O chassi, em particular, merece ser elogiado. Assim como antigos sistemas Alienware, é muito elegante, sofisticado, estável e bem construído. Você também recebe muitos elementos de iluminação, que facilitam seu uso na escuridão. O teclado e o touchpad também conseguem atender as expectativas premium em sua maior parte. No entanto, o painel QHD OLED (2560x1440 pixels) do SKU de gama alta foi o componente mais impressionante. Não interessa se você olhar para os ângulos de visão, cores, valor de preto, contraste ou tempos de resposta: Os típicos painéis TN e IPS são derrotados em todos os aspectos. No entanto, você deve saber que o painel refletivo com funcionalidade touch produz muitos reflexos.
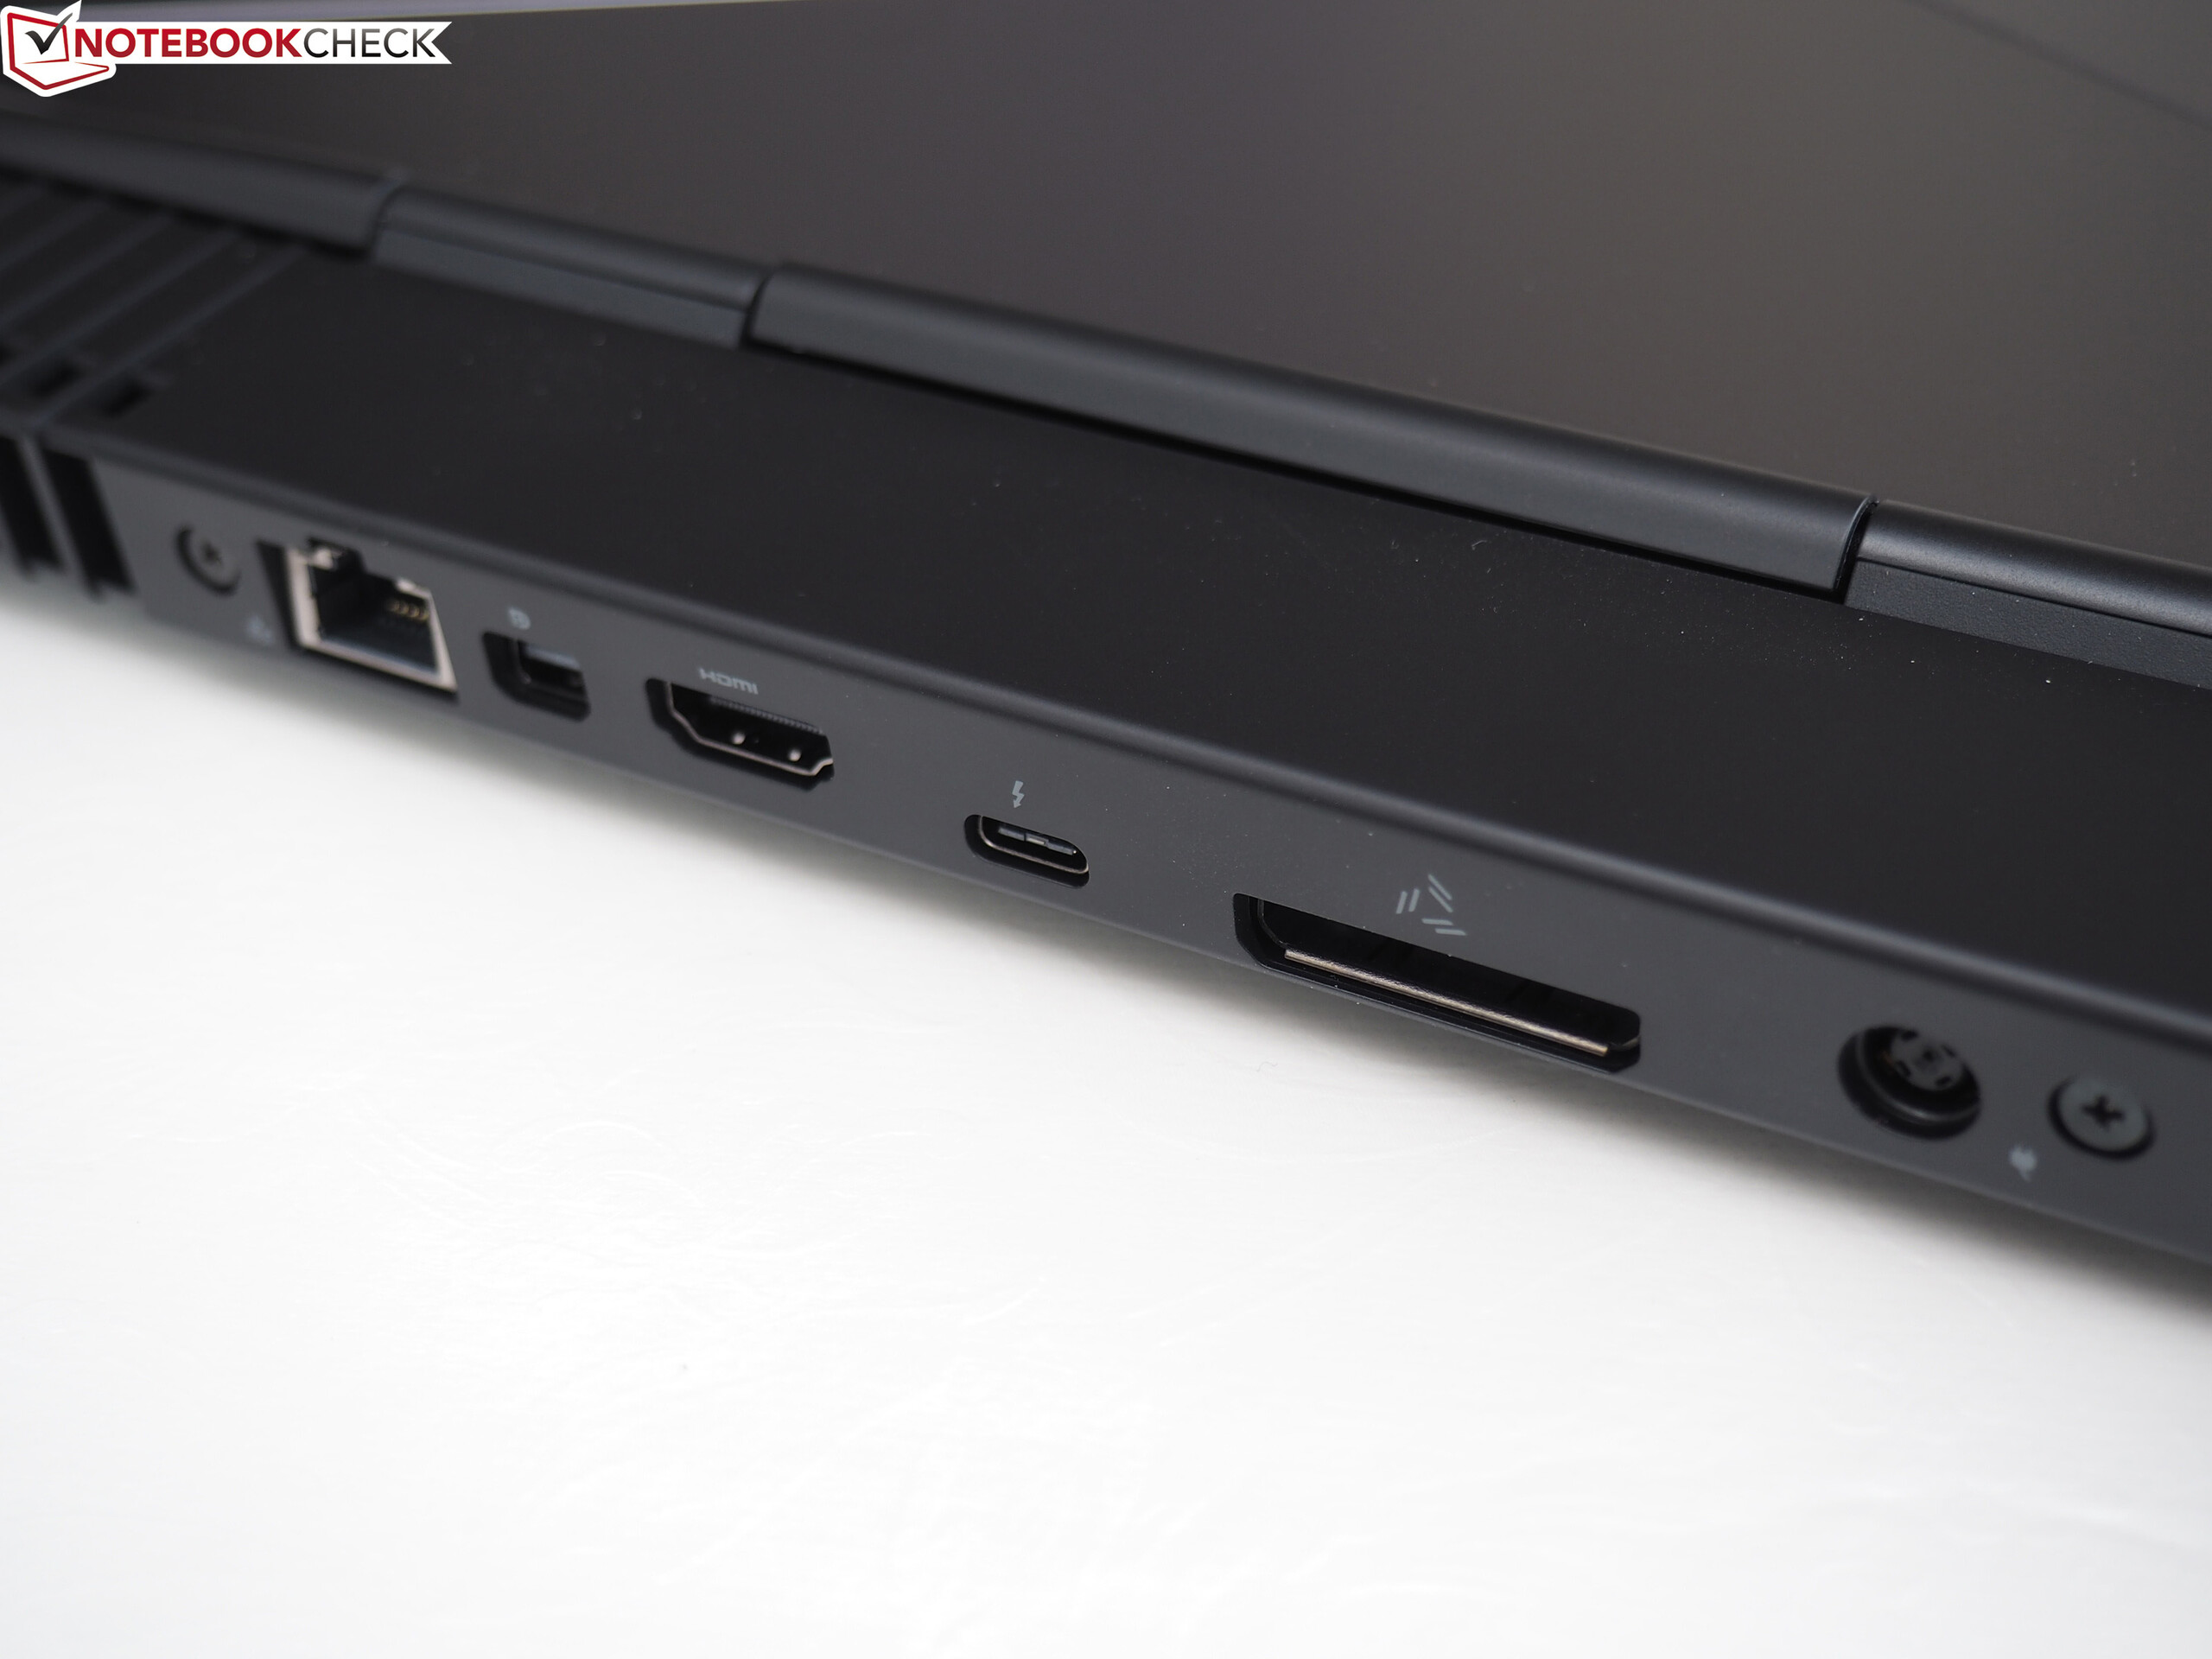
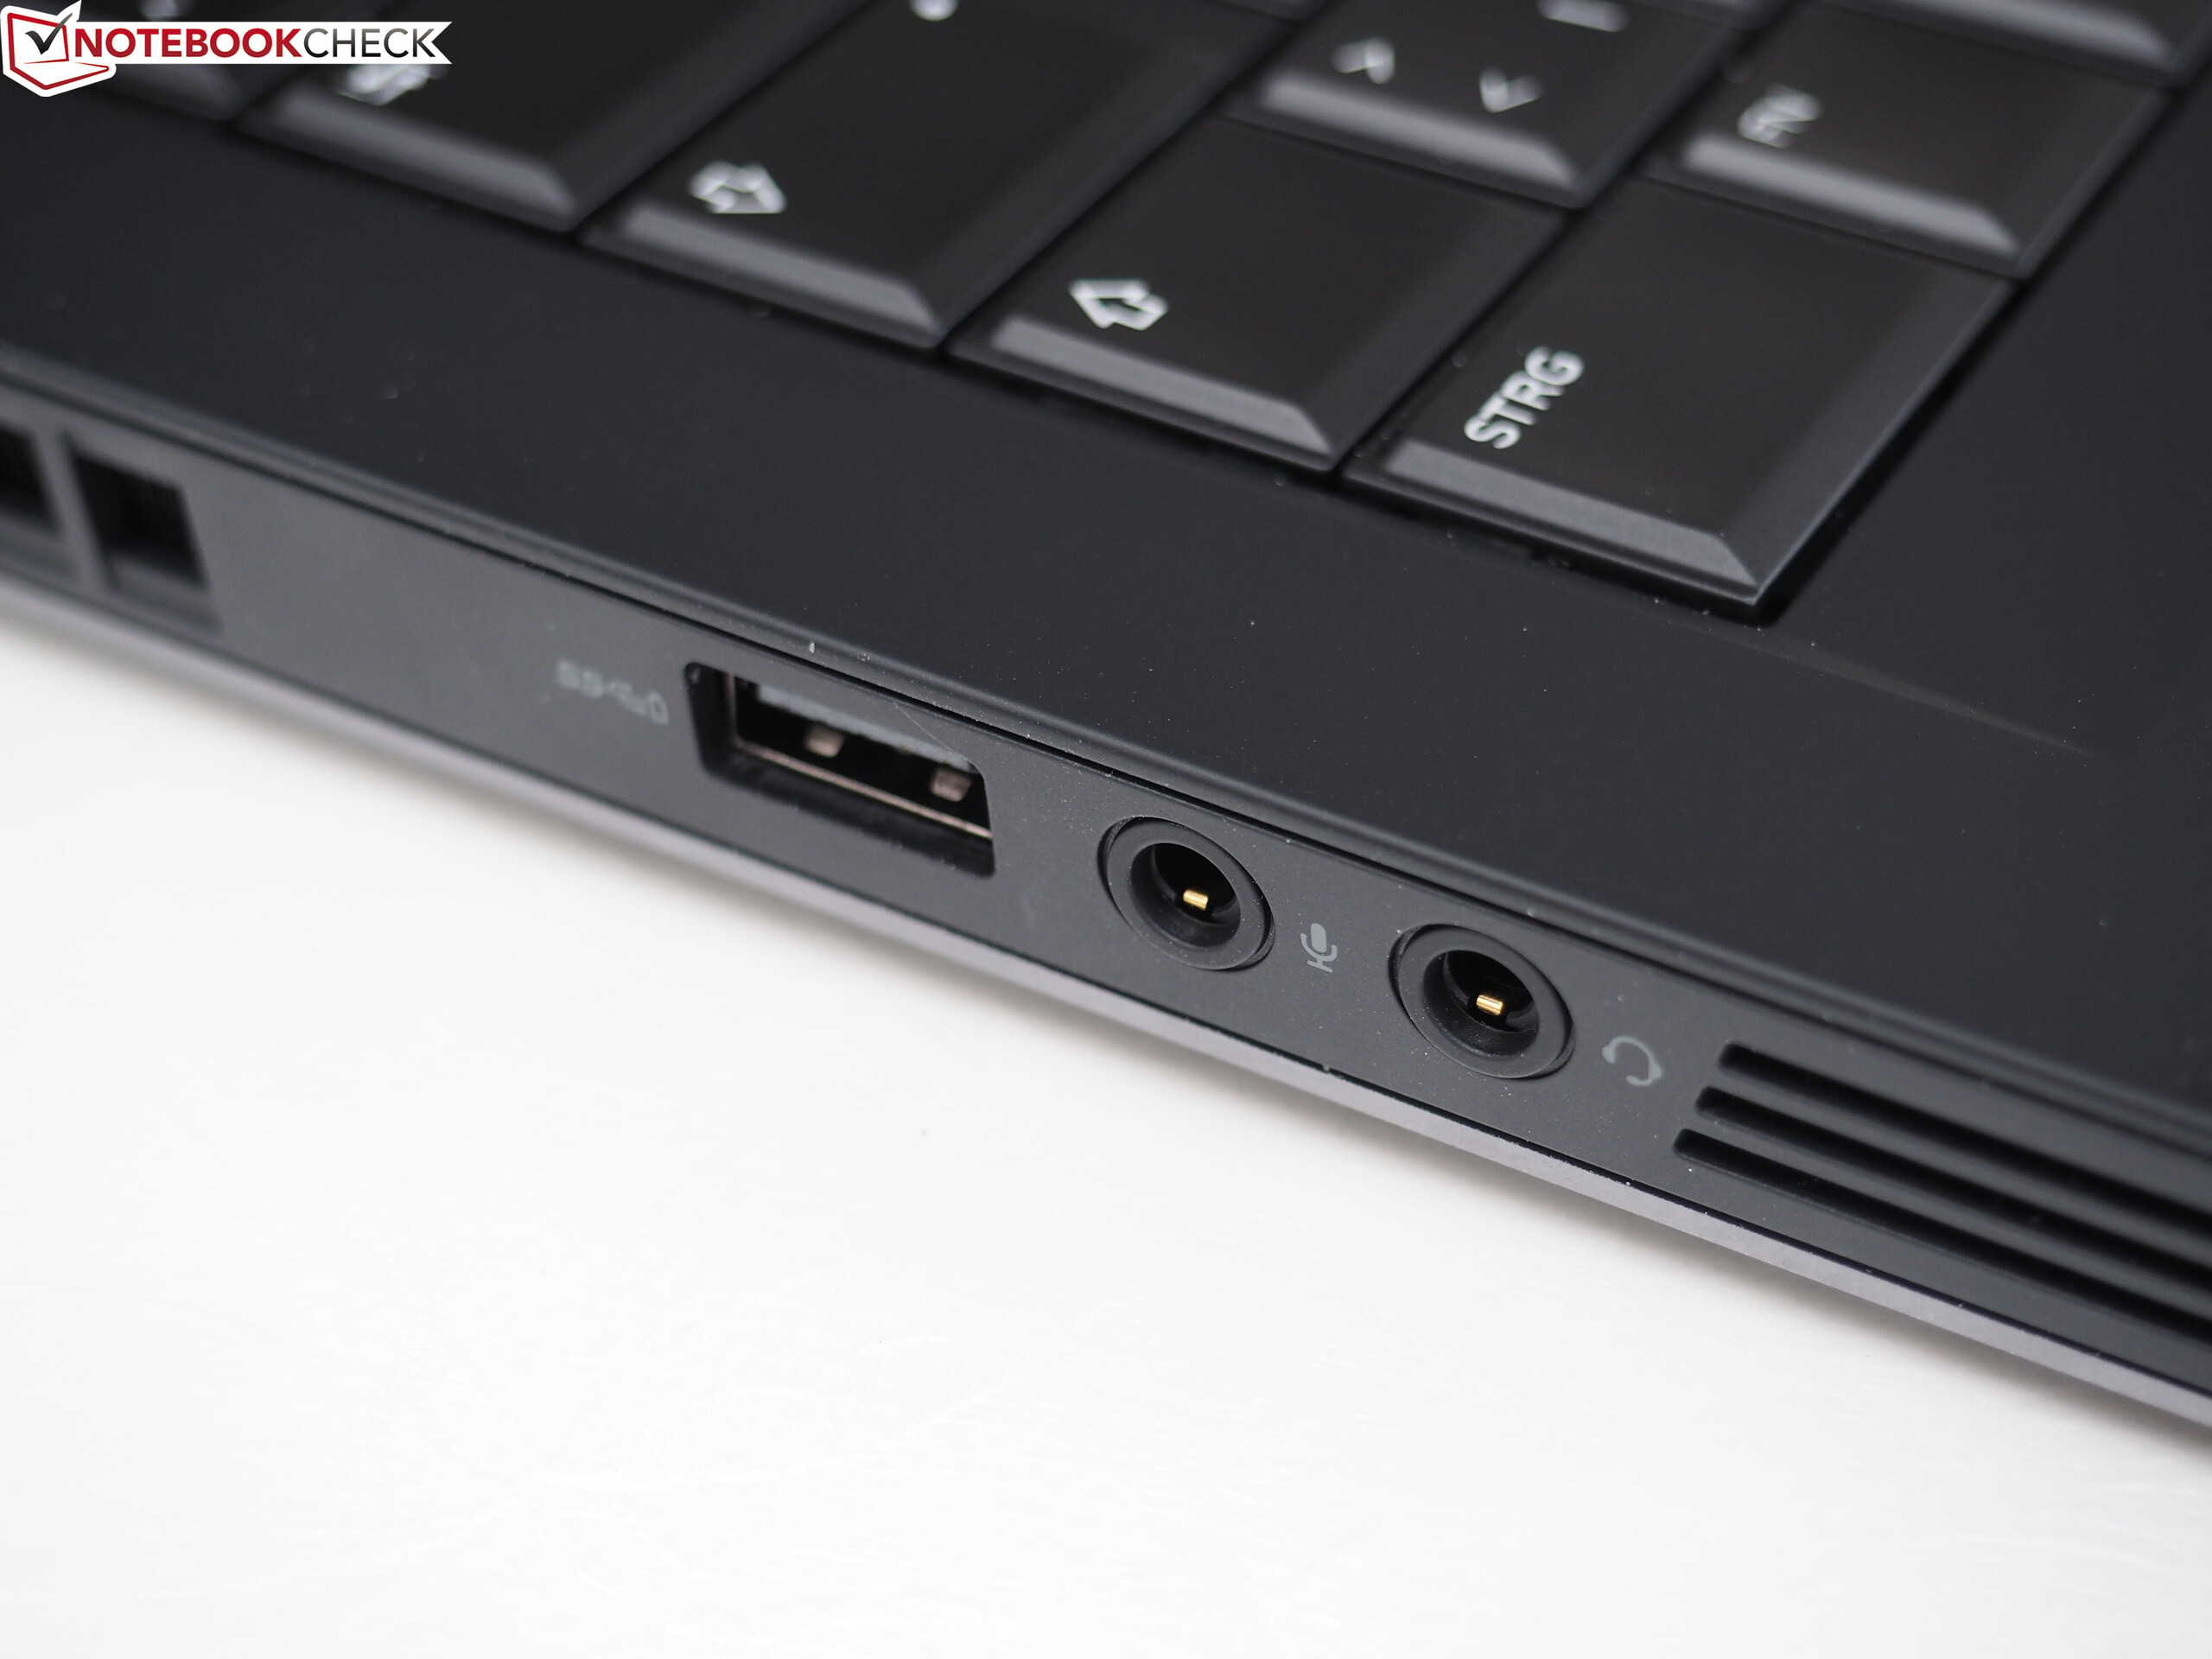
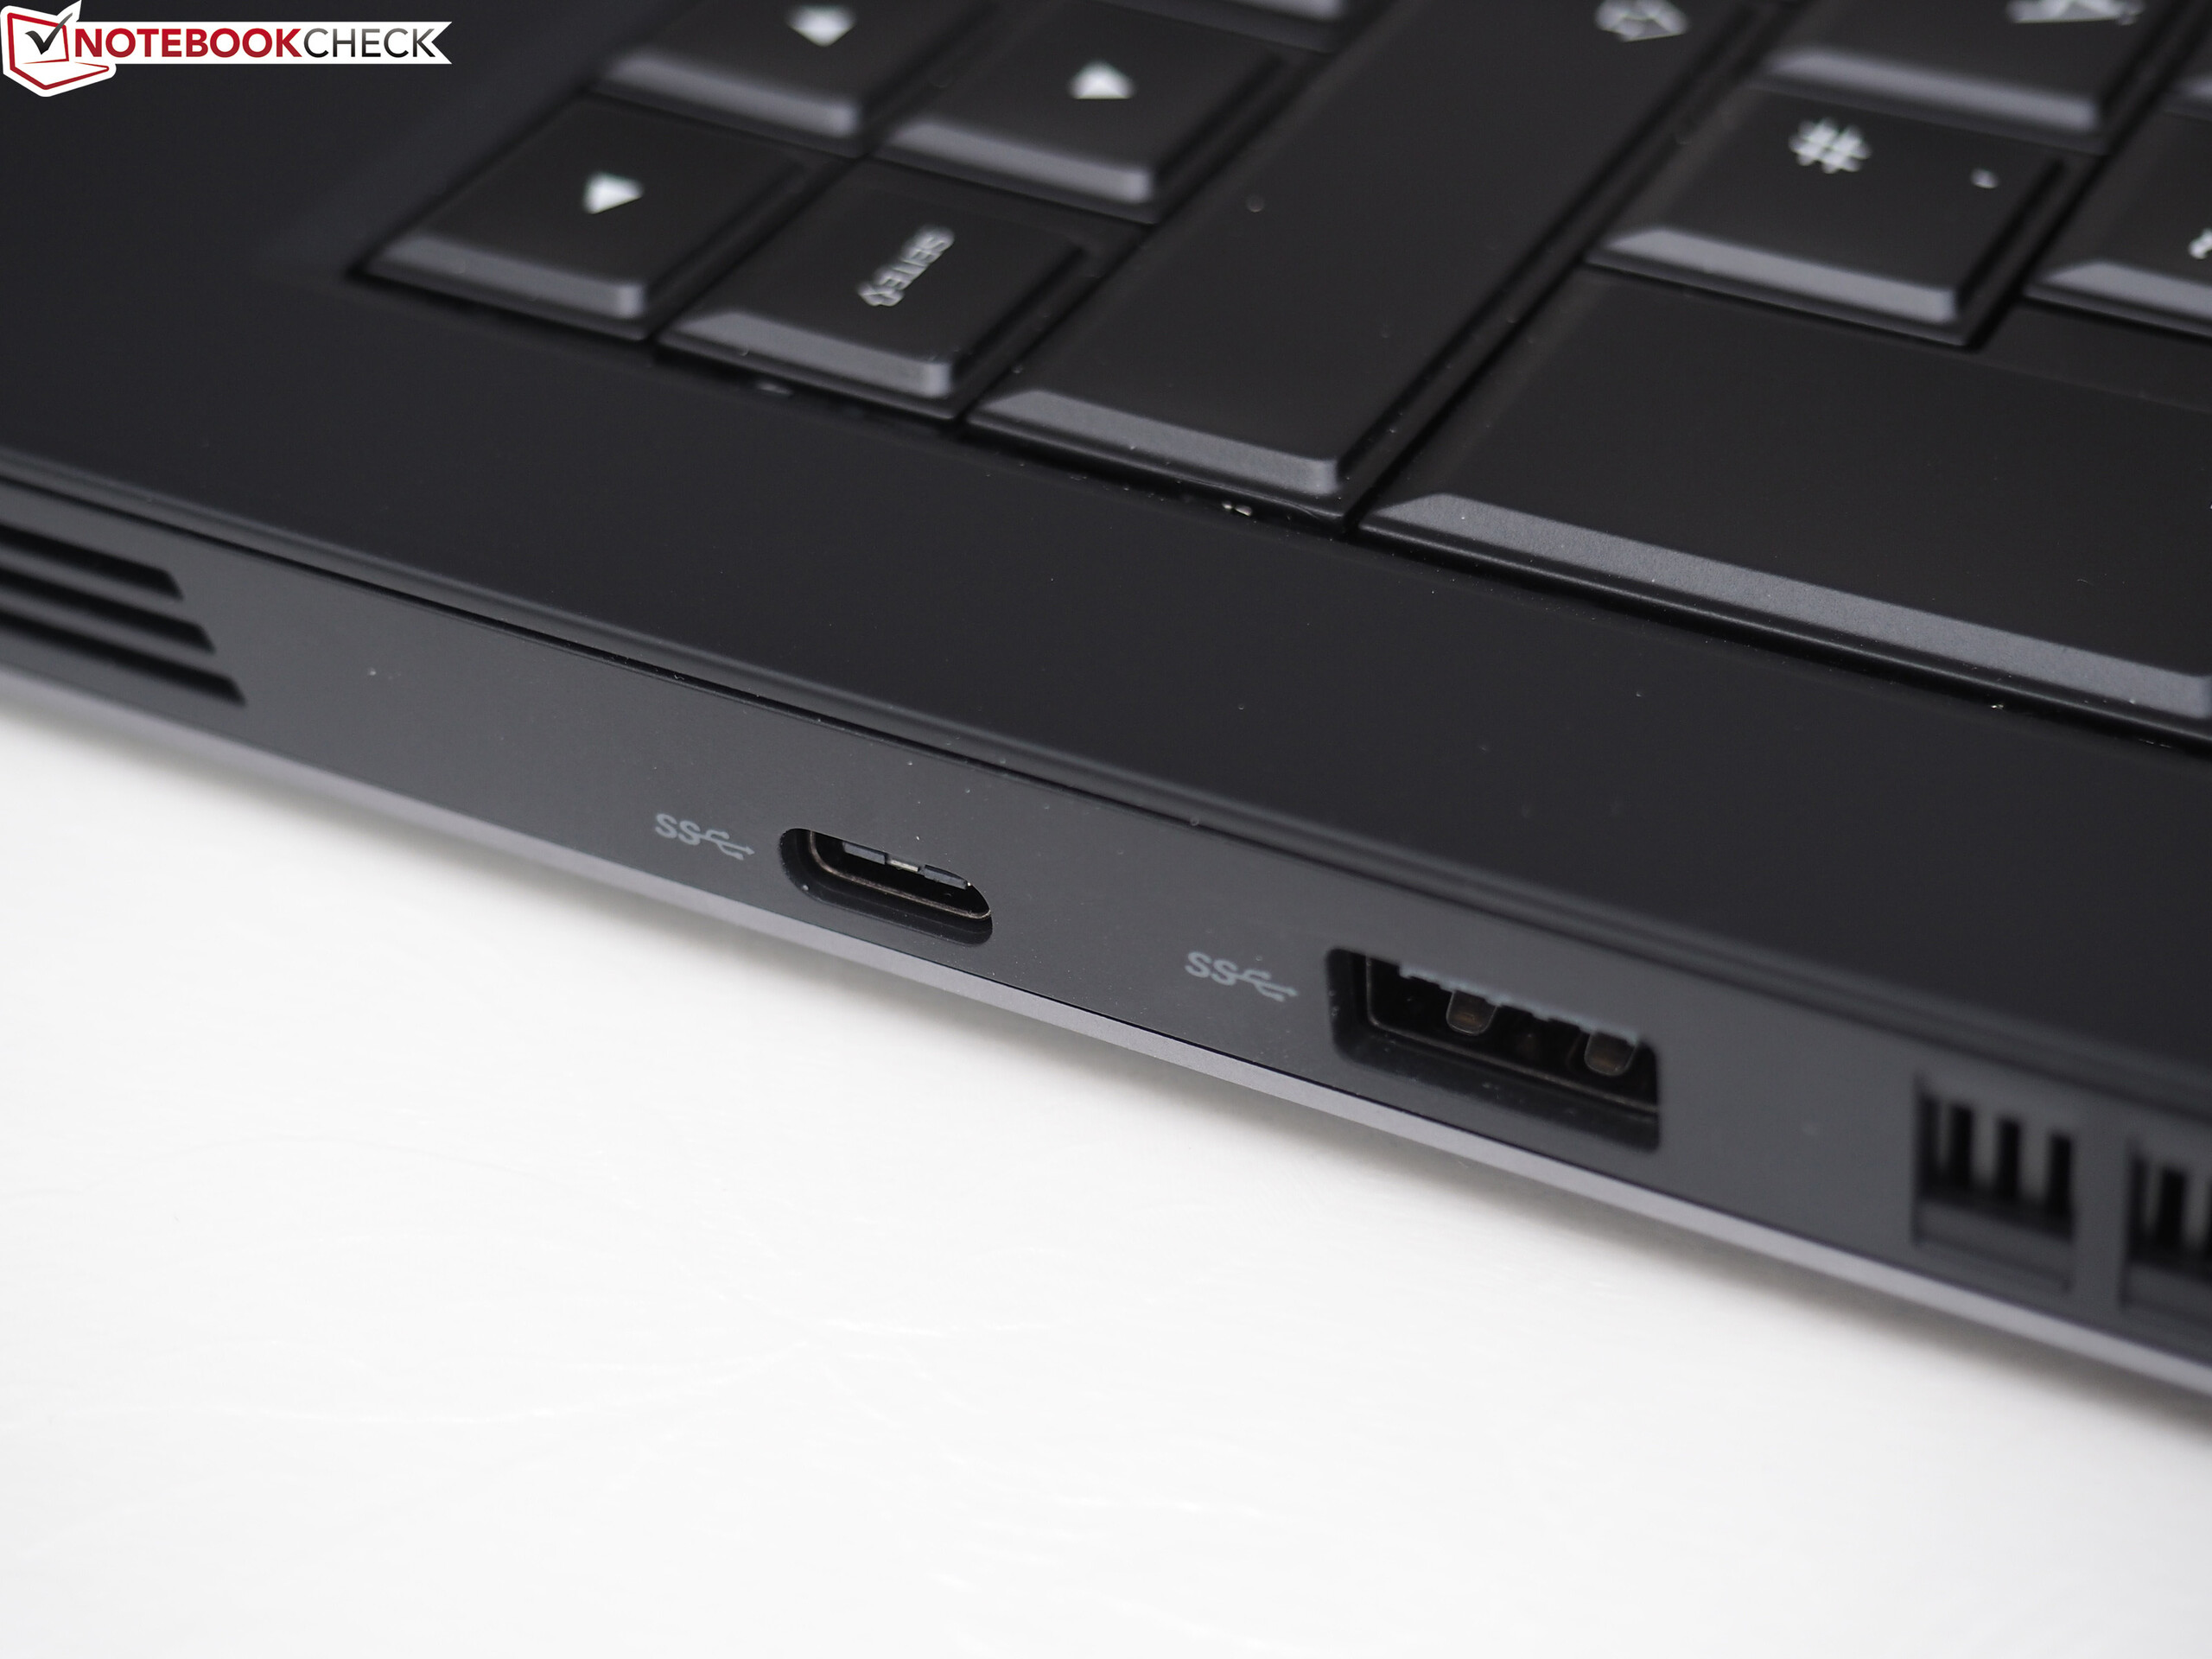
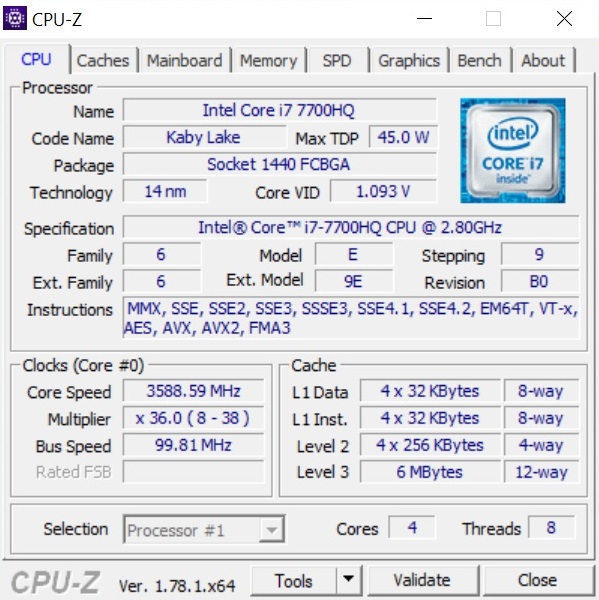
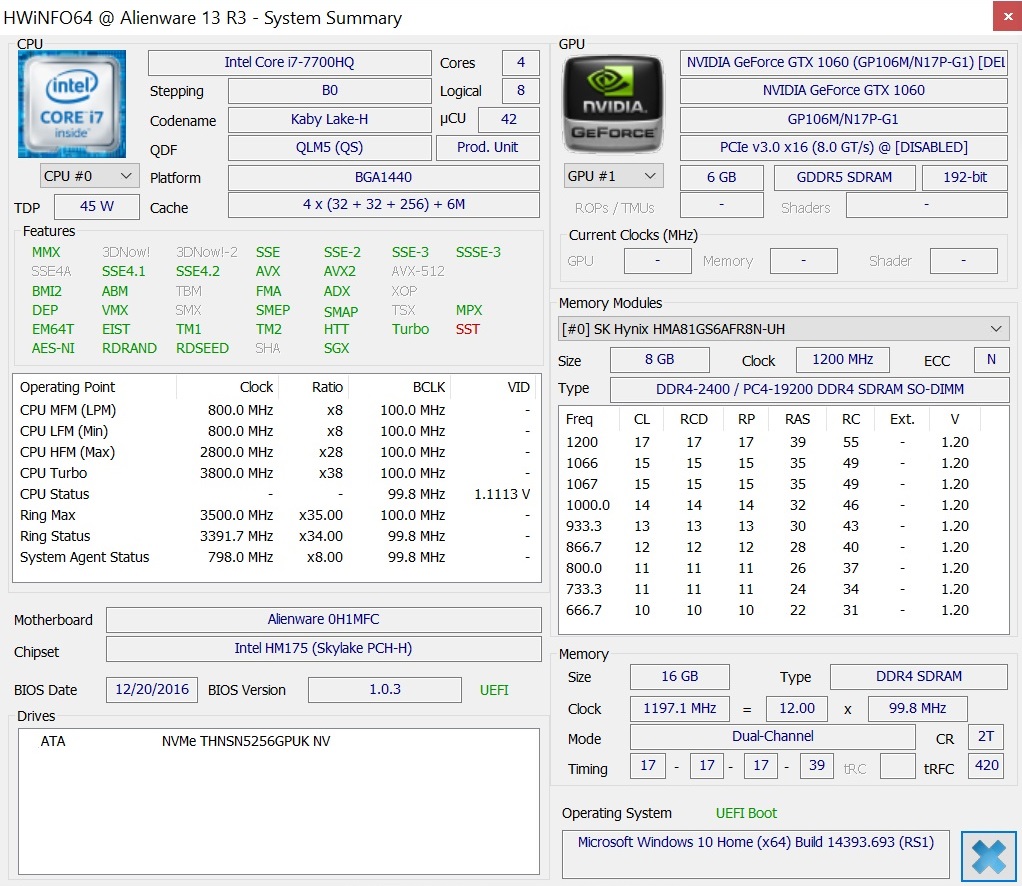
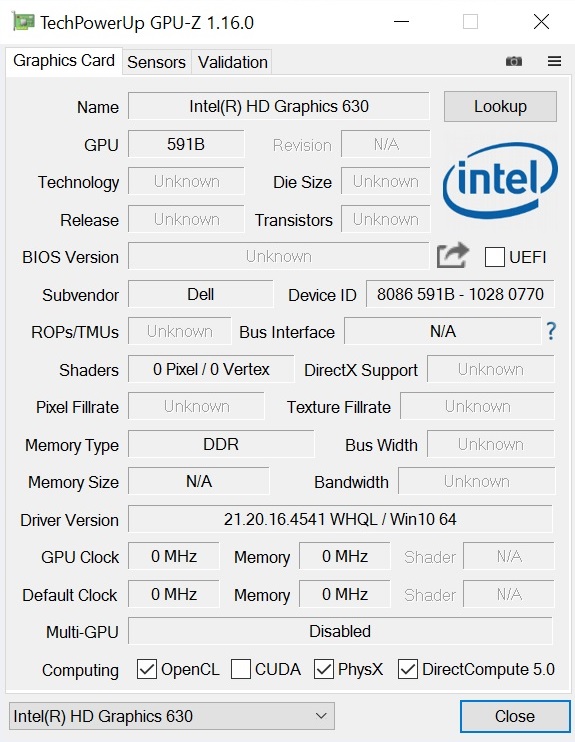
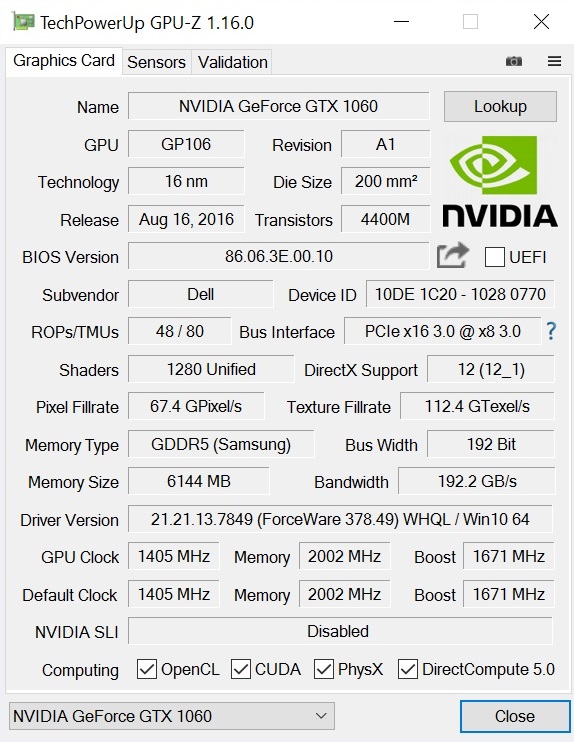
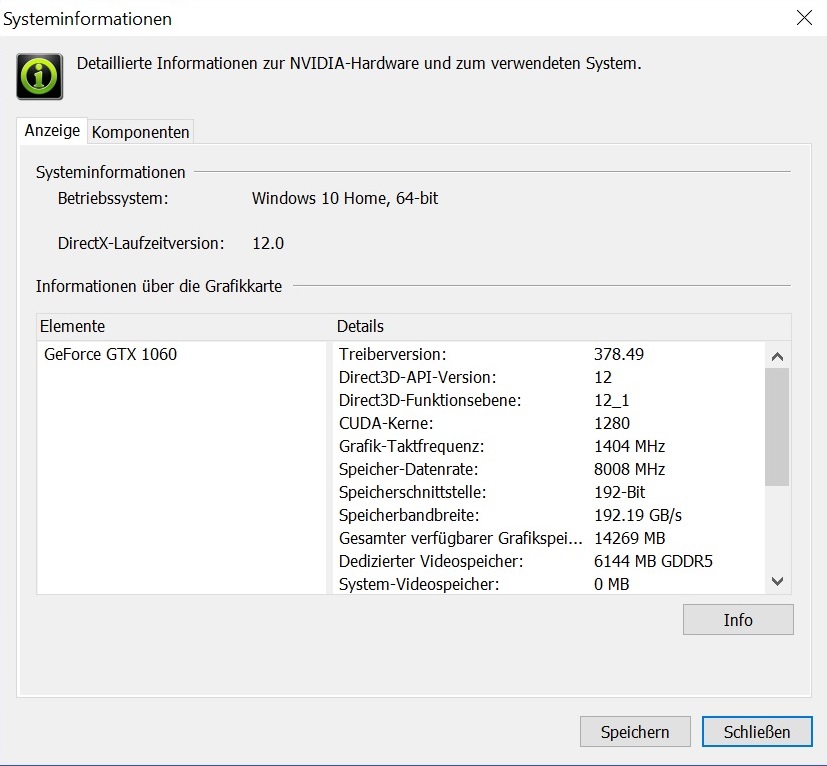
O fabricante incluiu o hardware mais recente e melhor atualmente disponível. Isto começa com o rastreamento de olho, o SSD M.2 NVMe até o processador Kaby Lake em combinação com uma GPU de gama alta da geração Pascal da Nvidia: A empresa mãe Dell tenta justificar o preço de venda. Os gamers somente sentirão falta do suporte para G-Sync e uma tela com taxa de atualização mais alta (sem opção para 120 Hz). No entanto, você pode conectar monitores correspondentes via HDMI 2.0 e mini-DisplayPort. As soluções gráficas externas não são problema graças ao Thunderbolt 3 e ao amplificador gráfico da Alienware.
No geral, o Alienware 13 R3 não é apenas um dos melhores sistemas de 13-polegadas no market, mas também um dos melhores portáteis para jogos no geral. Dificilmente há problemas e pontos de crítica reais, portanto, é, por muito, o melhor aparelho em nosso Ranking dos Top 10 móveis. Inclusive a pontuação do Razer Blade de alta qualidade, está alguns pontos abaixo (avaliação geral: 85 em vez de 88%).
Alienware 13 R3
- 02/14/2017 v6 (old)
Florian Glaser
Price comparison