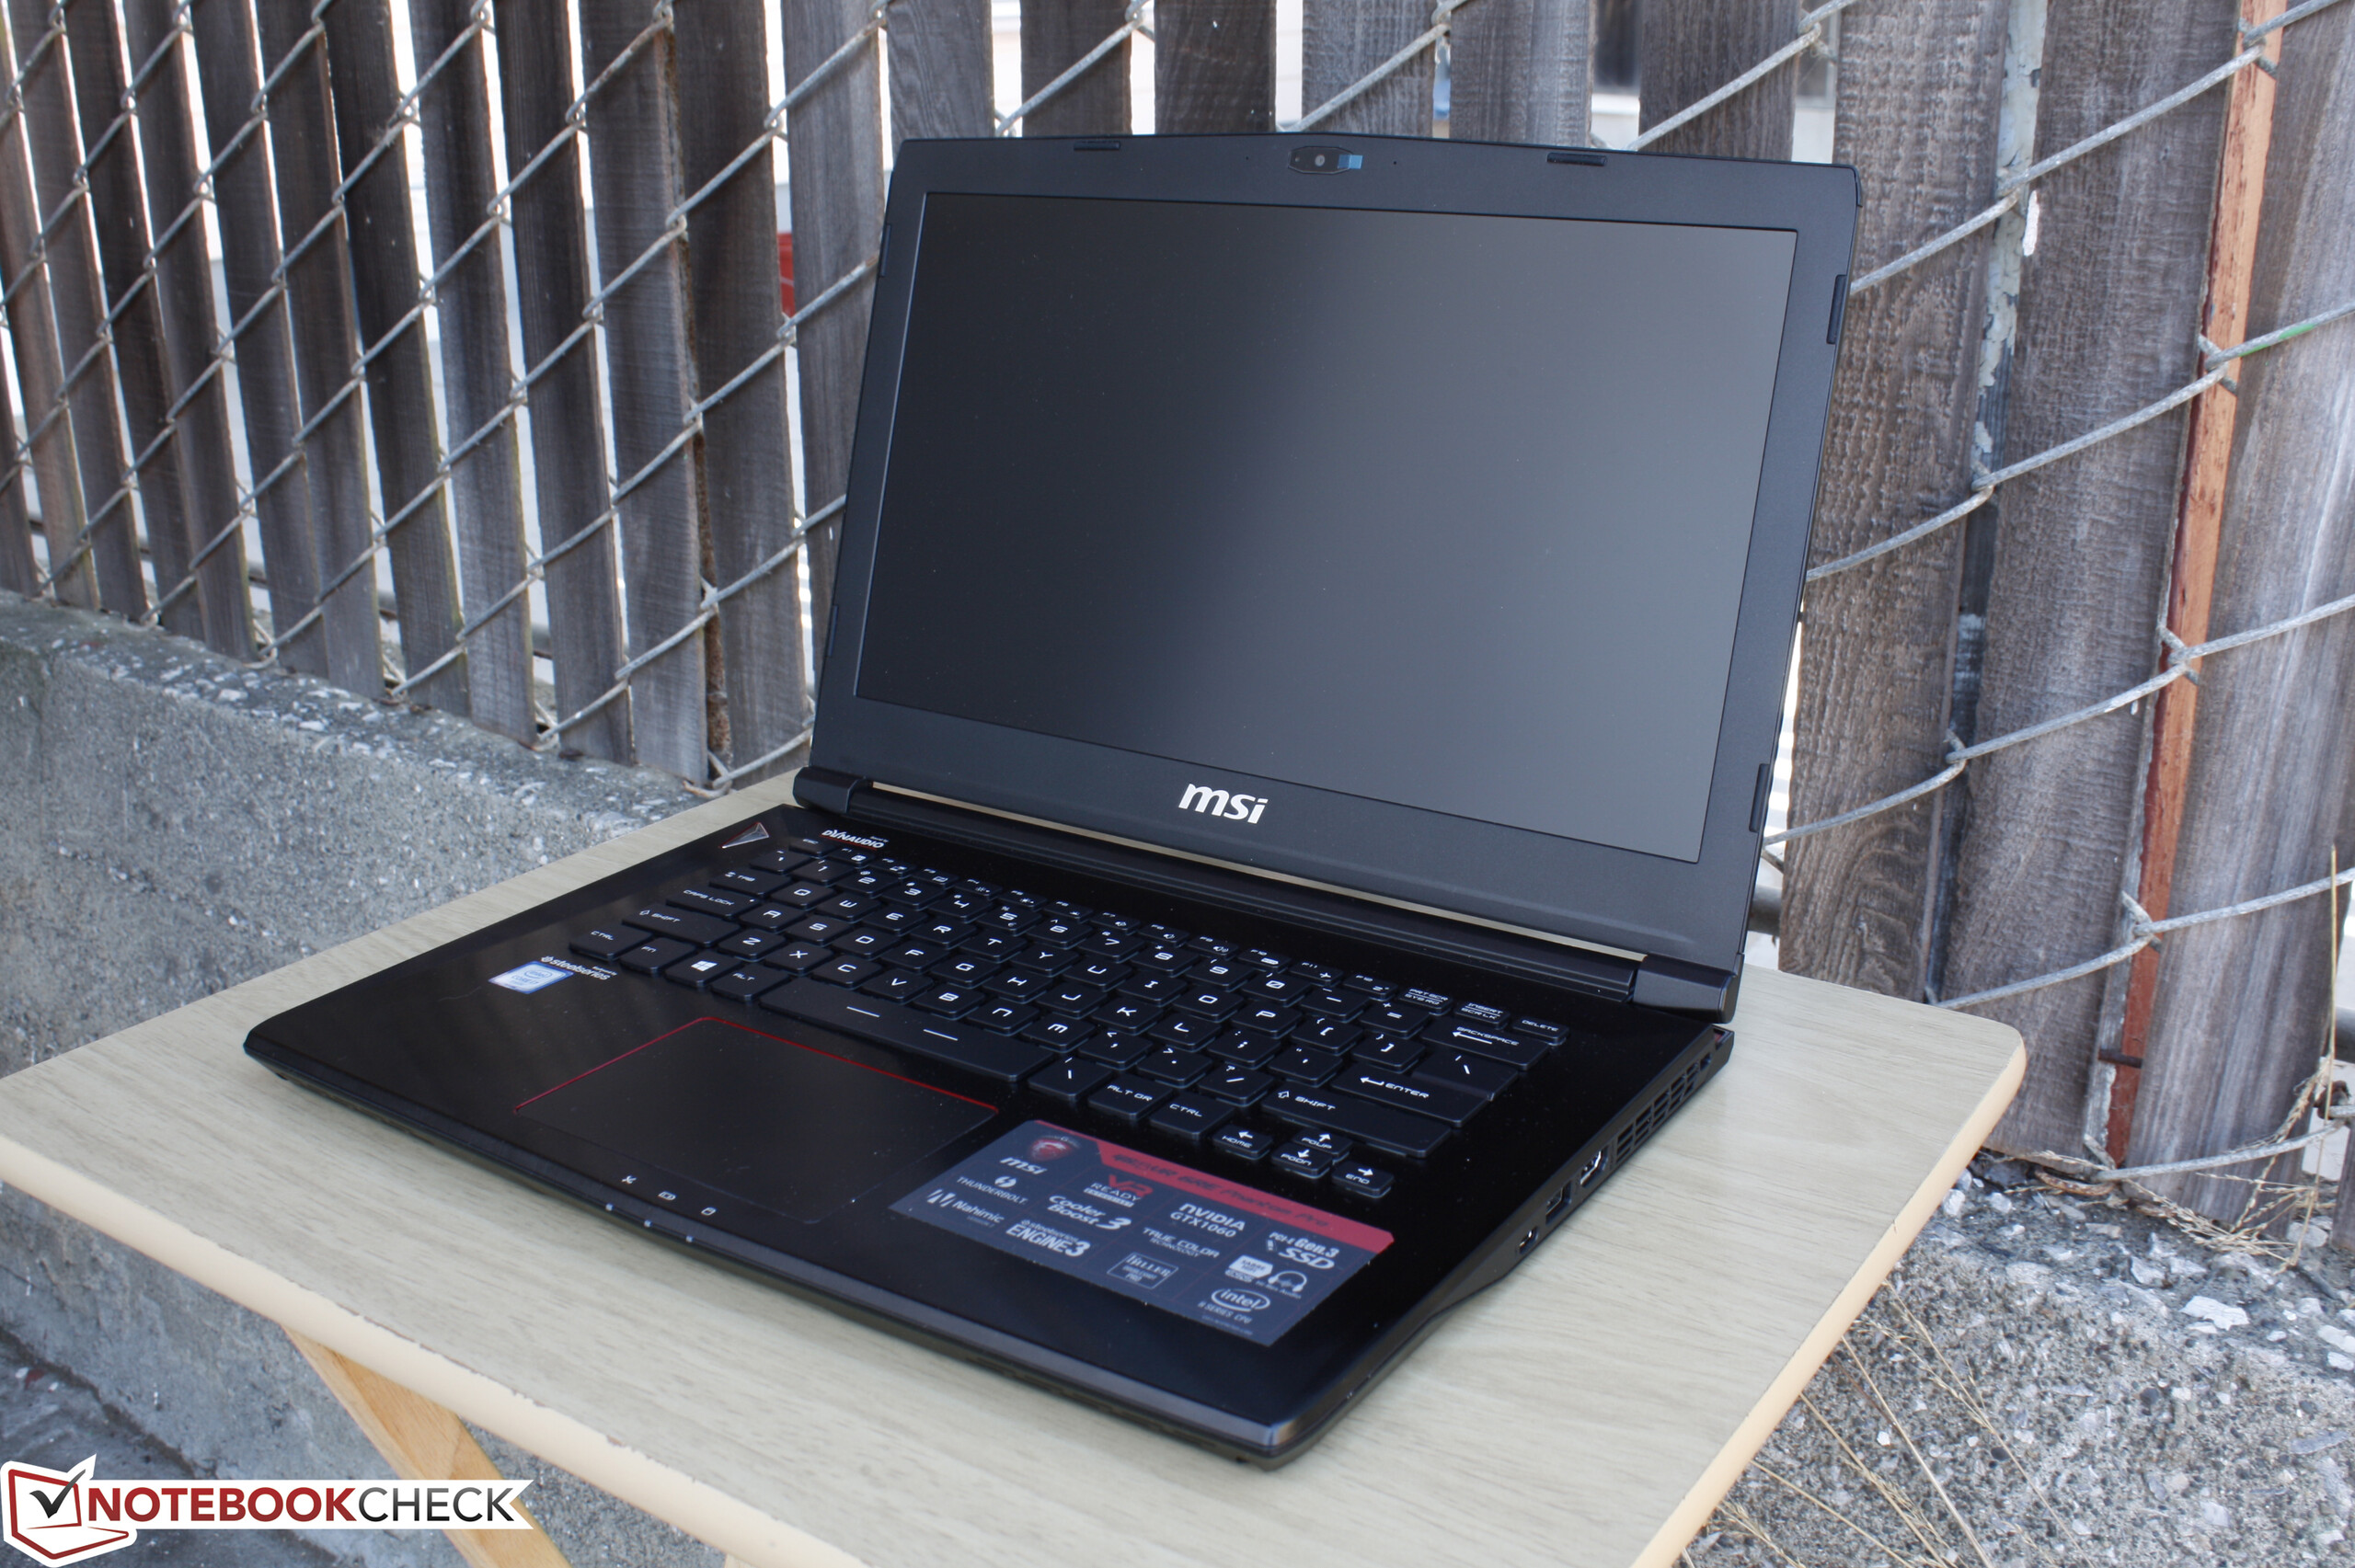
Breve análise do Portátil MSI GS43VR 6RE Phantom Pro

| SD Card Reader | |
| average JPG Copy Test (av. of 3 runs) | |
| Alienware 17 R3 (A17-9935) | |
| MSI GS73VR 6RF | |
| MSI GS43VR 6RE-006US | |
| maximum AS SSD Seq Read Test (1GB) | |
| Alienware 17 R3 (A17-9935) | |
| MSI GS73VR 6RF | |
| MSI GS43VR 6RE-006US | |
| Networking | |
| iperf Server (receive) TCP 1 m 512KB | |
| MSI GS43VR 6RE-006US | |
| iperf Client (transmit) TCP 1 m 512KB | |
| MSI GS43VR 6RE-006US | |
| |||||||||||||||||||||||||
iluminação: 83 %
iluminação com acumulador: 288.4 cd/m²
Contraste: 824:1 (Preto: 0.35 cd/m²)
ΔE ColorChecker Calman: 2.61 | ∀{0.5-29.43 Ø4.71}
ΔE Greyscale Calman: 1.18 | ∀{0.09-98 Ø4.96}
86.4% sRGB (Argyll 1.6.3 3D)
56.4% AdobeRGB 1998 (Argyll 1.6.3 3D)
63.1% AdobeRGB 1998 (Argyll 3D)
86.4% sRGB (Argyll 3D)
65.5% Display P3 (Argyll 3D)
Gamma: 2.24
CCT: 6506 K
| MSI GS43VR 6RE-006US Name: LG Philips LP140WF3-SPD1, ID: LGD046D, IPS, 14", 1920x1080 | Gigabyte P34W v5 IPS, 14", 2560x1440 | MSI GS40-6QE16H11 LG Philips LP140WF3-SPD1 (LGD046D), IPS, 14", 1920x1080 | Aorus X3 Plus v5 IPS, 13.9", 3200x1800 | Razer Blade 14 2015 IPS, 14", 3200x1800 | |
|---|---|---|---|---|---|
| Display | -16% | -0% | 9% | 11% | |
| Display P3 Coverage (%) | 65.5 | 51.4 -22% | 66.2 1% | 67.9 4% | 70.3 7% |
| sRGB Coverage (%) | 86.4 | 76.6 -11% | 85.7 -1% | 98.2 14% | 97.1 12% |
| AdobeRGB 1998 Coverage (%) | 63.1 | 52.8 -16% | 62.6 -1% | 69.2 10% | 71.1 13% |
| Response Times | -17% | 4% | -80% | ||
| Response Time Grey 50% / Grey 80% * (ms) | 31.6 ? | 41.2 ? -30% | 31 ? 2% | 52.4 ? -66% | |
| Response Time Black / White * (ms) | 24.4 ? | 25.4 ? -4% | 23 ? 6% | 47.2 ? -93% | |
| PWM Frequency (Hz) | 198 ? | ||||
| Screen | -11% | -70% | -27% | -50% | |
| Brightness middle (cd/m²) | 288.4 | 277.8 -4% | 304 5% | 394.8 37% | 318.4 10% |
| Brightness (cd/m²) | 282 | 270 -4% | 282 0% | 370 31% | 311 10% |
| Brightness Distribution (%) | 83 | 83 0% | 88 6% | 79 -5% | 78 -6% |
| Black Level * (cd/m²) | 0.35 | 0.38 -9% | 0.37 -6% | 0.293 16% | 0.416 -19% |
| Contrast (:1) | 824 | 731 -11% | 822 0% | 1347 63% | 765 -7% |
| Colorchecker dE 2000 * | 2.61 | 2.71 -4% | 7.47 -186% | 4.8 -84% | 3.67 -41% |
| Colorchecker dE 2000 max. * | 7.34 | 5.47 25% | |||
| Greyscale dE 2000 * | 1.18 | 2.11 -79% | 6.51 -452% | 5.04 -327% | 5.41 -358% |
| Gamma | 2.24 98% | 2.19 100% | 3.71 59% | 2.26 97% | 2.26 97% |
| CCT | 6506 100% | 6314 103% | 7840 83% | 7343 89% | 7118 91% |
| Color Space (Percent of AdobeRGB 1998) (%) | 56.4 | 48.5 -14% | 56 -1% | 63.4 12% | 64.64 15% |
| Color Space (Percent of sRGB) (%) | 86.4 | 76.9 -11% | 86 0% | 98.1 14% | |
| Média Total (Programa/Configurações) | -15% /
-13% | -22% /
-45% | -33% /
-27% | -20% /
-33% |
* ... menor é melhor
Exibir tempos de resposta
| ↔ Tempo de resposta preto para branco | ||
|---|---|---|
| 24.4 ms ... ascensão ↗ e queda ↘ combinadas | ↗ 5.2 ms ascensão | 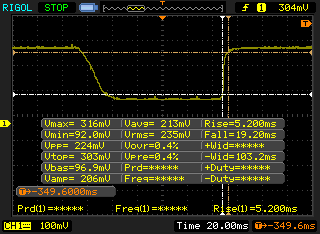 |
| ↘ 19.2 ms queda | ||
| A tela mostra boas taxas de resposta em nossos testes, mas pode ser muito lenta para jogadores competitivos. Em comparação, todos os dispositivos testados variam de 0.1 (mínimo) a 240 (máximo) ms. » 58 % de todos os dispositivos são melhores. Isso significa que o tempo de resposta medido é pior que a média de todos os dispositivos testados (19.8 ms). | ||
| ↔ Tempo de resposta 50% cinza a 80% cinza | ||
| 31.6 ms ... ascensão ↗ e queda ↘ combinadas | ↗ 10.4 ms ascensão | 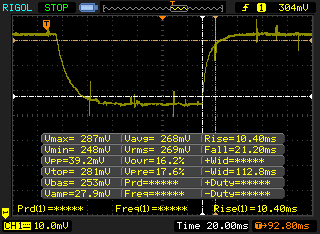 |
| ↘ 21.2 ms queda | ||
| A tela mostra taxas de resposta lentas em nossos testes e será insatisfatória para os jogadores. Em comparação, todos os dispositivos testados variam de 0.165 (mínimo) a 636 (máximo) ms. » 43 % de todos os dispositivos são melhores. Isso significa que o tempo de resposta medido é semelhante à média de todos os dispositivos testados (31 ms). | ||
Cintilação da tela / PWM (modulação por largura de pulso)
| Tela tremeluzindo / PWM não detectado | 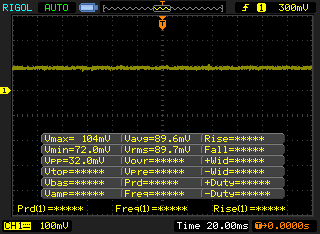 | ||
[pwm_comparison] Em comparação: 52 % de todos os dispositivos testados não usam PWM para escurecer a tela. Se PWM foi detectado, uma média de 7754 (mínimo: 5 - máximo: 343500) Hz foi medida. | |||
| Cinebench R10 | |
| Rendering Multiple CPUs 32Bit | |
| DogHouse Systems Mobius SS | |
| Gigabyte P55 V4 | |
| MSI GS43VR 6RE-006US | |
| Lenovo IdeaPad Y50 | |
| Rendering Single 32Bit | |
| DogHouse Systems Mobius SS | |
| Gigabyte P55 V4 | |
| Lenovo IdeaPad Y50 | |
| MSI GS43VR 6RE-006US | |
| wPrime 2.10 - 1024m | |
| Lenovo IdeaPad Y50 | |
| MSI GS43VR 6RE-006US | |
| Gigabyte P55 V4 | |
| DogHouse Systems Mobius SS | |
| Super Pi Mod 1.5 XS 32M - 32M | |
| MSI GS43VR 6RE-006US | |
| Gigabyte P55 V4 | |
| Lenovo IdeaPad Y50 | |
| DogHouse Systems Mobius SS | |
* ... menor é melhor
| PCMark 8 | |
| Home Score Accelerated v2 | |
| Eurocom Sky DLX7 | |
| MSI GS43VR 6RE-006US | |
| Gigabyte P34W v5 | |
| Razer Blade 14 2015 | |
| Work Score Accelerated v2 | |
| MSI GS43VR 6RE-006US | |
| Gigabyte P34W v5 | |
| Eurocom Sky DLX7 | |
| Razer Blade 14 2015 | |
| Creative Score Accelerated v2 | |
| Eurocom Sky DLX7 | |
| MSI GS43VR 6RE-006US | |
| Gigabyte P34W v5 | |
| Razer Blade 14 2015 | |
| PCMark 8 Home Score Accelerated v2 | 4016 pontos | |
| PCMark 8 Creative Score Accelerated v2 | 4954 pontos | |
| PCMark 8 Work Score Accelerated v2 | 4796 pontos | |
Ajuda | ||
| MSI GS43VR 6RE-006US SanDisk SD8SN8U1T001122 | Gigabyte P34W v5 Samsung SSD 950 Pro 512GB m.2 NVMe | MSI GS40-6QE16H11 Samsung MZFLV128 NVMe | Aorus X3 Plus v5 Samsung SM951 MZVPV512HDGL m.2 PCI-e | Razer Blade 14 2015 Lite-On IT L8T-256L9G | |
|---|---|---|---|---|---|
| CrystalDiskMark 3.0 | 338% | 196% | 307% | 66% | |
| Read Seq (MB/s) | 335.3 | 2269 577% | 1332 297% | 1529 356% | 496.6 48% |
| Write Seq (MB/s) | 299 | 1524 410% | 687 130% | 1565 423% | 418.6 40% |
| Read 512 (MB/s) | 223 | 937 320% | 936 320% | 929 317% | 371 66% |
| Write 512 (MB/s) | 246.7 | 1483 501% | 650 163% | 1536 523% | 392.6 59% |
| Read 4k (MB/s) | 17.68 | 53.8 204% | 49.57 180% | 51.7 192% | 31.25 77% |
| Write 4k (MB/s) | 35.31 | 167.3 374% | 138.8 293% | 147.2 317% | 64.4 82% |
| Read 4k QD32 (MB/s) | 247.4 | 622 151% | 559 126% | 636 157% | 357.6 45% |
| Write 4k QD32 (MB/s) | 156.3 | 418.9 168% | 247.3 58% | 421.4 170% | 323.2 107% |

| 3DMark | |
| 1920x1080 Fire Strike Graphics | |
| MSI GT73VR-6RE16SR451 | |
| Asus G701VO-CS74K | |
| MSI GS43VR 6RE-006US | |
| Aorus X5S v5 | |
| Asus Strix GL502VT-DS74 | |
| HP Pavilion 15 UHD T9Y85AV | |
| Fire Strike Extreme Graphics | |
| Asus G701VO-CS74K | |
| MSI GS43VR 6RE-006US | |
| Aorus X5S v5 | |
| Asus Strix GL502VT-DS74 | |
| HP Pavilion 15 UHD T9Y85AV | |
| 3840x2160 Fire Strike Ultra Graphics | |
| MSI GT73VR-6RE16SR451 | |
| Asus G701VO-CS74K | |
| MSI GS43VR 6RE-006US | |
| Aorus X5S v5 | |
| HP Pavilion 15 UHD T9Y85AV | |
| 3DMark 11 | |
| 1280x720 Performance GPU | |
| MSI GT73VR-6RE16SR451 | |
| Asus G701VO-CS74K | |
| MSI GS43VR 6RE-006US | |
| Aorus X5S v5 | |
| Asus Strix GL502VT-DS74 | |
| HP Pavilion 15 UHD T9Y85AV | |
| 1280x720 Performance Combined | |
| MSI GT73VR-6RE16SR451 | |
| Asus G701VO-CS74K | |
| MSI GS43VR 6RE-006US | |
| Asus Strix GL502VT-DS74 | |
| Aorus X5S v5 | |
| HP Pavilion 15 UHD T9Y85AV | |
| 3DMark 11 Performance | 12462 pontos | |
| 3DMark Ice Storm Standard Score | 83301 pontos | |
| 3DMark Cloud Gate Standard Score | 23391 pontos | |
| 3DMark Fire Strike Score | 9814 pontos | |
| 3DMark Fire Strike Extreme Score | 5170 pontos | |
Ajuda | ||
| BioShock Infinite - 1920x1080 Ultra Preset, DX11 (DDOF) | |
| Asus G752VS-XB78K | |
| Asus G701VO-CS74K | |
| MSI GS43VR 6RE-006US | |
| Asus Strix GL502VY-DS71 | |
| Asus Strix GL502VT-DS74 | |
| HP Pavilion 15 UHD T9Y85AV | |
| Metro: Last Light - 1920x1080 Very High (DX11) AF:16x | |
| Asus G701VO-CS74K | |
| MSI GS43VR 6RE-006US | |
| Asus Strix GL502VT-DS74 | |
| HP Pavilion 15 UHD T9Y85AV | |
| Thief - 1920x1080 Very High Preset AA:FXAA & High SS AF:8x | |
| Asus G752VS-XB78K | |
| Asus G701VO-CS74K | |
| MSI GS43VR 6RE-006US | |
| Asus Strix GL502VY-DS71 | |
| Asus Strix GL502VT-DS74 | |
| HP Pavilion 15 UHD T9Y85AV | |
| Batman: Arkham Knight - 1920x1080 High / On AA:SM AF:16x | |
| Asus G752VS-XB78K | |
| Asus G701VO-CS74K | |
| MSI GS43VR 6RE-006US | |
| Asus Strix GL502VT-DS74 | |
| HP Pavilion 15 UHD T9Y85AV | |
| Fallout 4 - 1920x1080 Ultra Preset AA:T AF:16x | |
| Asus G701VO-CS74K | |
| MSI GS43VR 6RE-006US | |
| Asus Strix GL502VY-DS71 | |
| Asus Strix GL502VT-DS74 | |
| HP Pavilion 15 UHD T9Y85AV | |
| Rise of the Tomb Raider - 1920x1080 Very High Preset AA:FX AF:16x | |
| Asus G752VS-XB78K | |
| MSI GS43VR 6RE-006US | |
| Asus G701VO-CS74K | |
| Asus Strix GL502VY-DS71 | |
| Asus Strix GL502VT-DS74 | |
| HP Pavilion 15 UHD T9Y85AV | |
| Doom - 1920x1080 Ultra Preset AA:SM | |
| Asus G701VO-CS74K | |
| MSI GS43VR 6RE-006US | |
| Asus Strix GL502VY-DS71 | |
| Overwatch - 1920x1080 Epic (Render Scale 100 %) AA:SM AF:16x | |
| Asus G701VO-CS74K | |
| MSI GS43VR 6RE-006US | |
| Asus Strix GL502VY-DS71 | |
| HP Pavilion 15 UHD T9Y85AV | |
| baixo | média | alto | ultra | |
|---|---|---|---|---|
| Guild Wars 2 (2012) | 50.1 | |||
| BioShock Infinite (2013) | 102.1 | |||
| Metro: Last Light (2013) | 78.6 | |||
| Thief (2014) | 65.6 | |||
| Batman: Arkham Knight (2015) | 80 | 58 | ||
| Metal Gear Solid V (2015) | 60 | |||
| Fallout 4 (2015) | 68.5 | |||
| Rise of the Tomb Raider (2016) | 66.8 | |||
| Doom (2016) | 77.8 | |||
| Overwatch (2016) | 106.7 |
Barulho
| Ocioso |
| 32 / 32 / 33.5 dB |
| Carga |
| 50 / 51.5 dB |
 | ||
30 dB silencioso 40 dB(A) audível 50 dB(A) ruidosamente alto |
||
min: | ||
| MSI GS43VR 6RE-006US GeForce GTX 1060 Mobile, 6700HQ, SanDisk SD8SN8U1T001122 | Gigabyte P34W v5 GeForce GTX 970M, 6700HQ, Samsung SSD 950 Pro 512GB m.2 NVMe | MSI GS40-6QE16H11 GeForce GTX 970M, 6700HQ, Samsung MZFLV128 NVMe | Aorus X3 Plus v5 GeForce GTX 970M, 6700HQ, Samsung SM951 MZVPV512HDGL m.2 PCI-e | Razer Blade 14 2015 GeForce GTX 970M, 4720HQ, Lite-On IT L8T-256L9G | |
|---|---|---|---|---|---|
| Noise | 2% | -2% | 3% | 5% | |
| desligado / ambiente * (dB) | 29.1 | ||||
| Idle Minimum * (dB) | 32 | 31.6 1% | 33 -3% | 32.1 -0% | 29.7 7% |
| Idle Average * (dB) | 32 | 31.6 1% | 34 -6% | 32.4 -1% | 29.9 7% |
| Idle Maximum * (dB) | 33.5 | 32.5 3% | 38 -13% | 32.5 3% | 30 10% |
| Load Average * (dB) | 50 | 46.5 7% | 44 12% | 40.1 20% | 42.1 16% |
| Load Maximum * (dB) | 51.5 | 52.5 -2% | 52 -1% | 54.6 -6% | 59 -15% |
* ... menor é melhor
(-) A temperatura máxima no lado superior é 55.6 °C / 132 F, em comparação com a média de 40.4 °C / 105 F , variando de 21.2 a 68.8 °C para a classe Gaming.
(-) A parte inferior aquece até um máximo de 62.4 °C / 144 F, em comparação com a média de 43.2 °C / 110 F
(+) Em uso inativo, a temperatura média para o lado superior é 30.5 °C / 87 F, em comparação com a média do dispositivo de 33.9 °C / ### class_avg_f### F.
(+) Os apoios para as mãos e o touchpad estão atingindo a temperatura máxima da pele (32.2 °C / 90 F) e, portanto, não estão quentes.
(-) A temperatura média da área do apoio para as mãos de dispositivos semelhantes foi 28.8 °C / 83.8 F (-3.4 °C / -6.2 F).
MSI GS43VR 6RE-006US análise de áudio
(±) | o volume do alto-falante é médio, mas bom (###valor### dB)
Graves 100 - 315Hz
(-) | quase nenhum baixo - em média 17.5% menor que a mediana
(±) | a linearidade dos graves é média (12% delta para a frequência anterior)
Médios 400 - 2.000 Hz
(+) | médios equilibrados - apenas 3.9% longe da mediana
(±) | a linearidade dos médios é média (9.5% delta para frequência anterior)
Altos 2 - 16 kHz
(±) | máximos mais altos - em média 6.4% maior que a mediana
(±) | a linearidade dos máximos é média (8.5% delta para frequência anterior)
Geral 100 - 16.000 Hz
(±) | a linearidade do som geral é média (28.9% diferença em relação à mediana)
Comparado com a mesma classe
» 95% de todos os dispositivos testados nesta classe foram melhores, 2% semelhantes, 4% piores
» O melhor teve um delta de 6%, a média foi 18%, o pior foi 132%
Comparado com todos os dispositivos testados
» 87% de todos os dispositivos testados foram melhores, 2% semelhantes, 11% piores
» O melhor teve um delta de 4%, a média foi 23%, o pior foi 134%
Apple MacBook 12 (Early 2016) 1.1 GHz análise de áudio
(+) | os alto-falantes podem tocar relativamente alto (###valor### dB)
Graves 100 - 315Hz
(±) | graves reduzidos - em média 11.3% menor que a mediana
(±) | a linearidade dos graves é média (14.2% delta para a frequência anterior)
Médios 400 - 2.000 Hz
(+) | médios equilibrados - apenas 2.4% longe da mediana
(+) | médios são lineares (5.5% delta para frequência anterior)
Altos 2 - 16 kHz
(+) | agudos equilibrados - apenas 2% longe da mediana
(+) | os máximos são lineares (4.5% delta da frequência anterior)
Geral 100 - 16.000 Hz
(+) | o som geral é linear (10.2% diferença em relação à mediana)
Comparado com a mesma classe
» 7% de todos os dispositivos testados nesta classe foram melhores, 2% semelhantes, 90% piores
» O melhor teve um delta de 5%, a média foi 18%, o pior foi 53%
Comparado com todos os dispositivos testados
» 5% de todos os dispositivos testados foram melhores, 1% semelhantes, 94% piores
» O melhor teve um delta de 4%, a média foi 23%, o pior foi 134%
| desligado | |
| Ocioso | |
| Carga |
|
Key:
min: | |
| MSI GS43VR 6RE-006US 6700HQ, GeForce GTX 1060 Mobile, SanDisk SD8SN8U1T001122, IPS, 1920x1080, 14" | MSI GT72VR 6RE-015US 6700HQ, GeForce GTX 1070 Mobile, SanDisk SD8SNAT256G1122, IPS, 1920x1080, 17.3" | MSI GS40-6QE16H11 6700HQ, GeForce GTX 970M, Samsung MZFLV128 NVMe, IPS, 1920x1080, 14" | Acer Predator 17 G9-792-71EF 6700HQ, GeForce GTX 980M, Samsung SSD PM871 MZNLN512HCJH, IPS, 3840x2160, 17.3" | HP Pavilion 15 UHD T9Y85AV 6700HQ, GeForce GTX 960M, SanDisk Z400s SD8SNAT-128G, IPS, 3840x2160, 15.6" | |
|---|---|---|---|---|---|
| Power Consumption | -51% | 6% | -22% | 25% | |
| Idle Minimum * (Watt) | 12.1 | 22.3 -84% | 10 17% | 14 -16% | 8.3 31% |
| Idle Average * (Watt) | 19 | 27.3 -44% | 14 26% | 24 -26% | 14.8 22% |
| Idle Maximum * (Watt) | 19.5 | 30 -54% | 24 -23% | 32 -64% | 16.8 14% |
| Load Average * (Watt) | 106.7 | 152.2 -43% | 90 16% | 108 -1% | 71 33% |
| Load Maximum * (Watt) | 159 | 204.2 -28% | 172 -8% | 164 -3% | 119.2 25% |
* ... menor é melhor
| MSI GS43VR 6RE-006US 6700HQ, GeForce GTX 1060 Mobile, 61 Wh | Gigabyte P34W v5 6700HQ, GeForce GTX 970M, 61 Wh | MSI GS40-6QE16H11 6700HQ, GeForce GTX 970M, 61 Wh | Aorus X3 Plus v5 6700HQ, GeForce GTX 970M, 73 Wh | Razer Blade 14 2015 4720HQ, GeForce GTX 970M, 71 Wh | |
|---|---|---|---|---|---|
| Duração da bateria | -27% | -18% | -11% | -22% | |
| Reader / Idle (h) | 9.6 | 6.5 -32% | 5.2 -46% | 8 -17% | 6.3 -34% |
| WiFi v1.3 (h) | 4.4 | 3.9 -11% | 5 14% | 5.1 16% | 3.7 -16% |
| Load (h) | 1.3 | 0.8 -38% | 1 -23% | 0.9 -31% | 1.1 -15% |
Pro
Contra

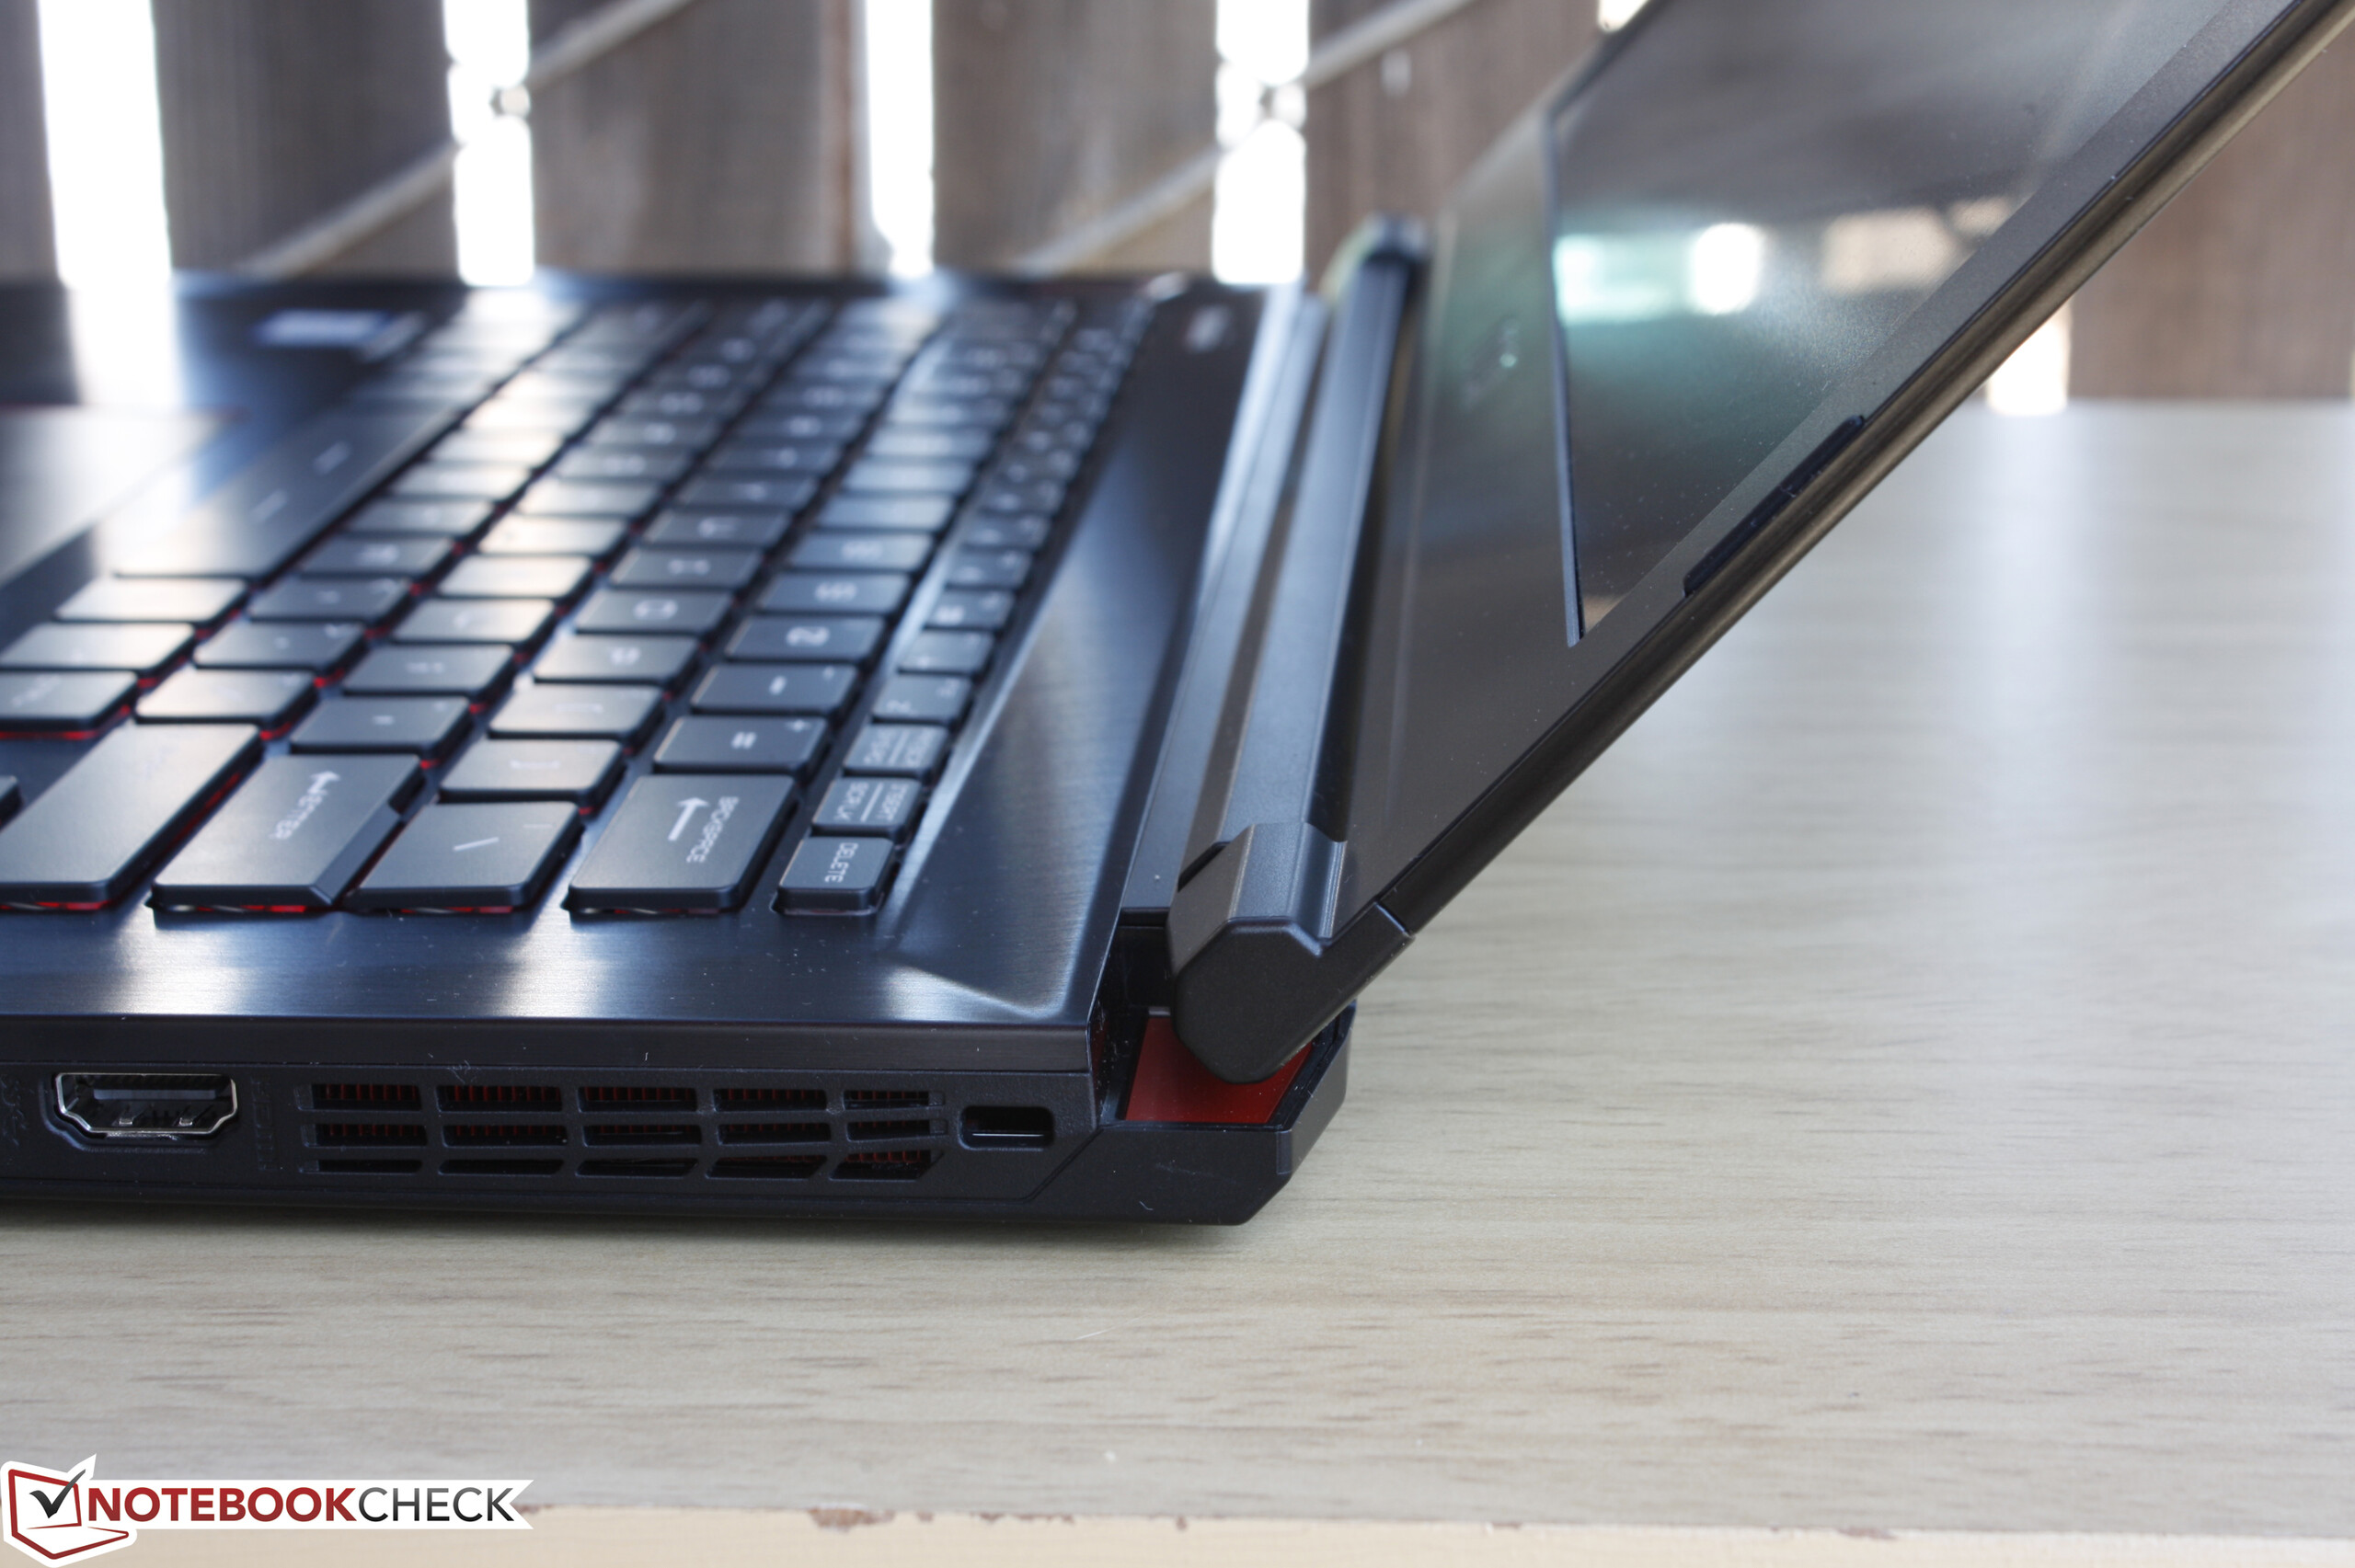
Nós concluímos que o GS40 foi um "bom compromisso entre desempenho e dimensões compactas", mas a introdução da Pascal significa que os usuários não precisam mais sacrificar tanto desempenho para um design menor. Era uma loucura pensar que os jogos em configurações máximas 1080p60 seriam possíveis no formato de 14 polegadas até um ano atrás, mas aqui estamos com um portátil que literalmente é da metade do tamanho da geração anterior de portáteis Maxwell para jogos com desempenho gráfico ultrapassando o da GTX 980M.
As falhas continuam a ser os habituais para formatos pequenos e finos: Ventoinha barulhenta, menos recursos, e temperaturas de funcionamento mais altas. Neste quesito, o GS43VR não fornece atualizações significantes sobre o GS40 dado que não funciona significantemente mais frios, mais silenciosos, ou inclusive durante mais tempo que o modelo vindouro. De fato, nossas medições mostram que o GS43VR é igual de barulhento se não mais barulhento sob cargas de jogos com temperaturas da GPU ao redor da faixa dos 80 C.
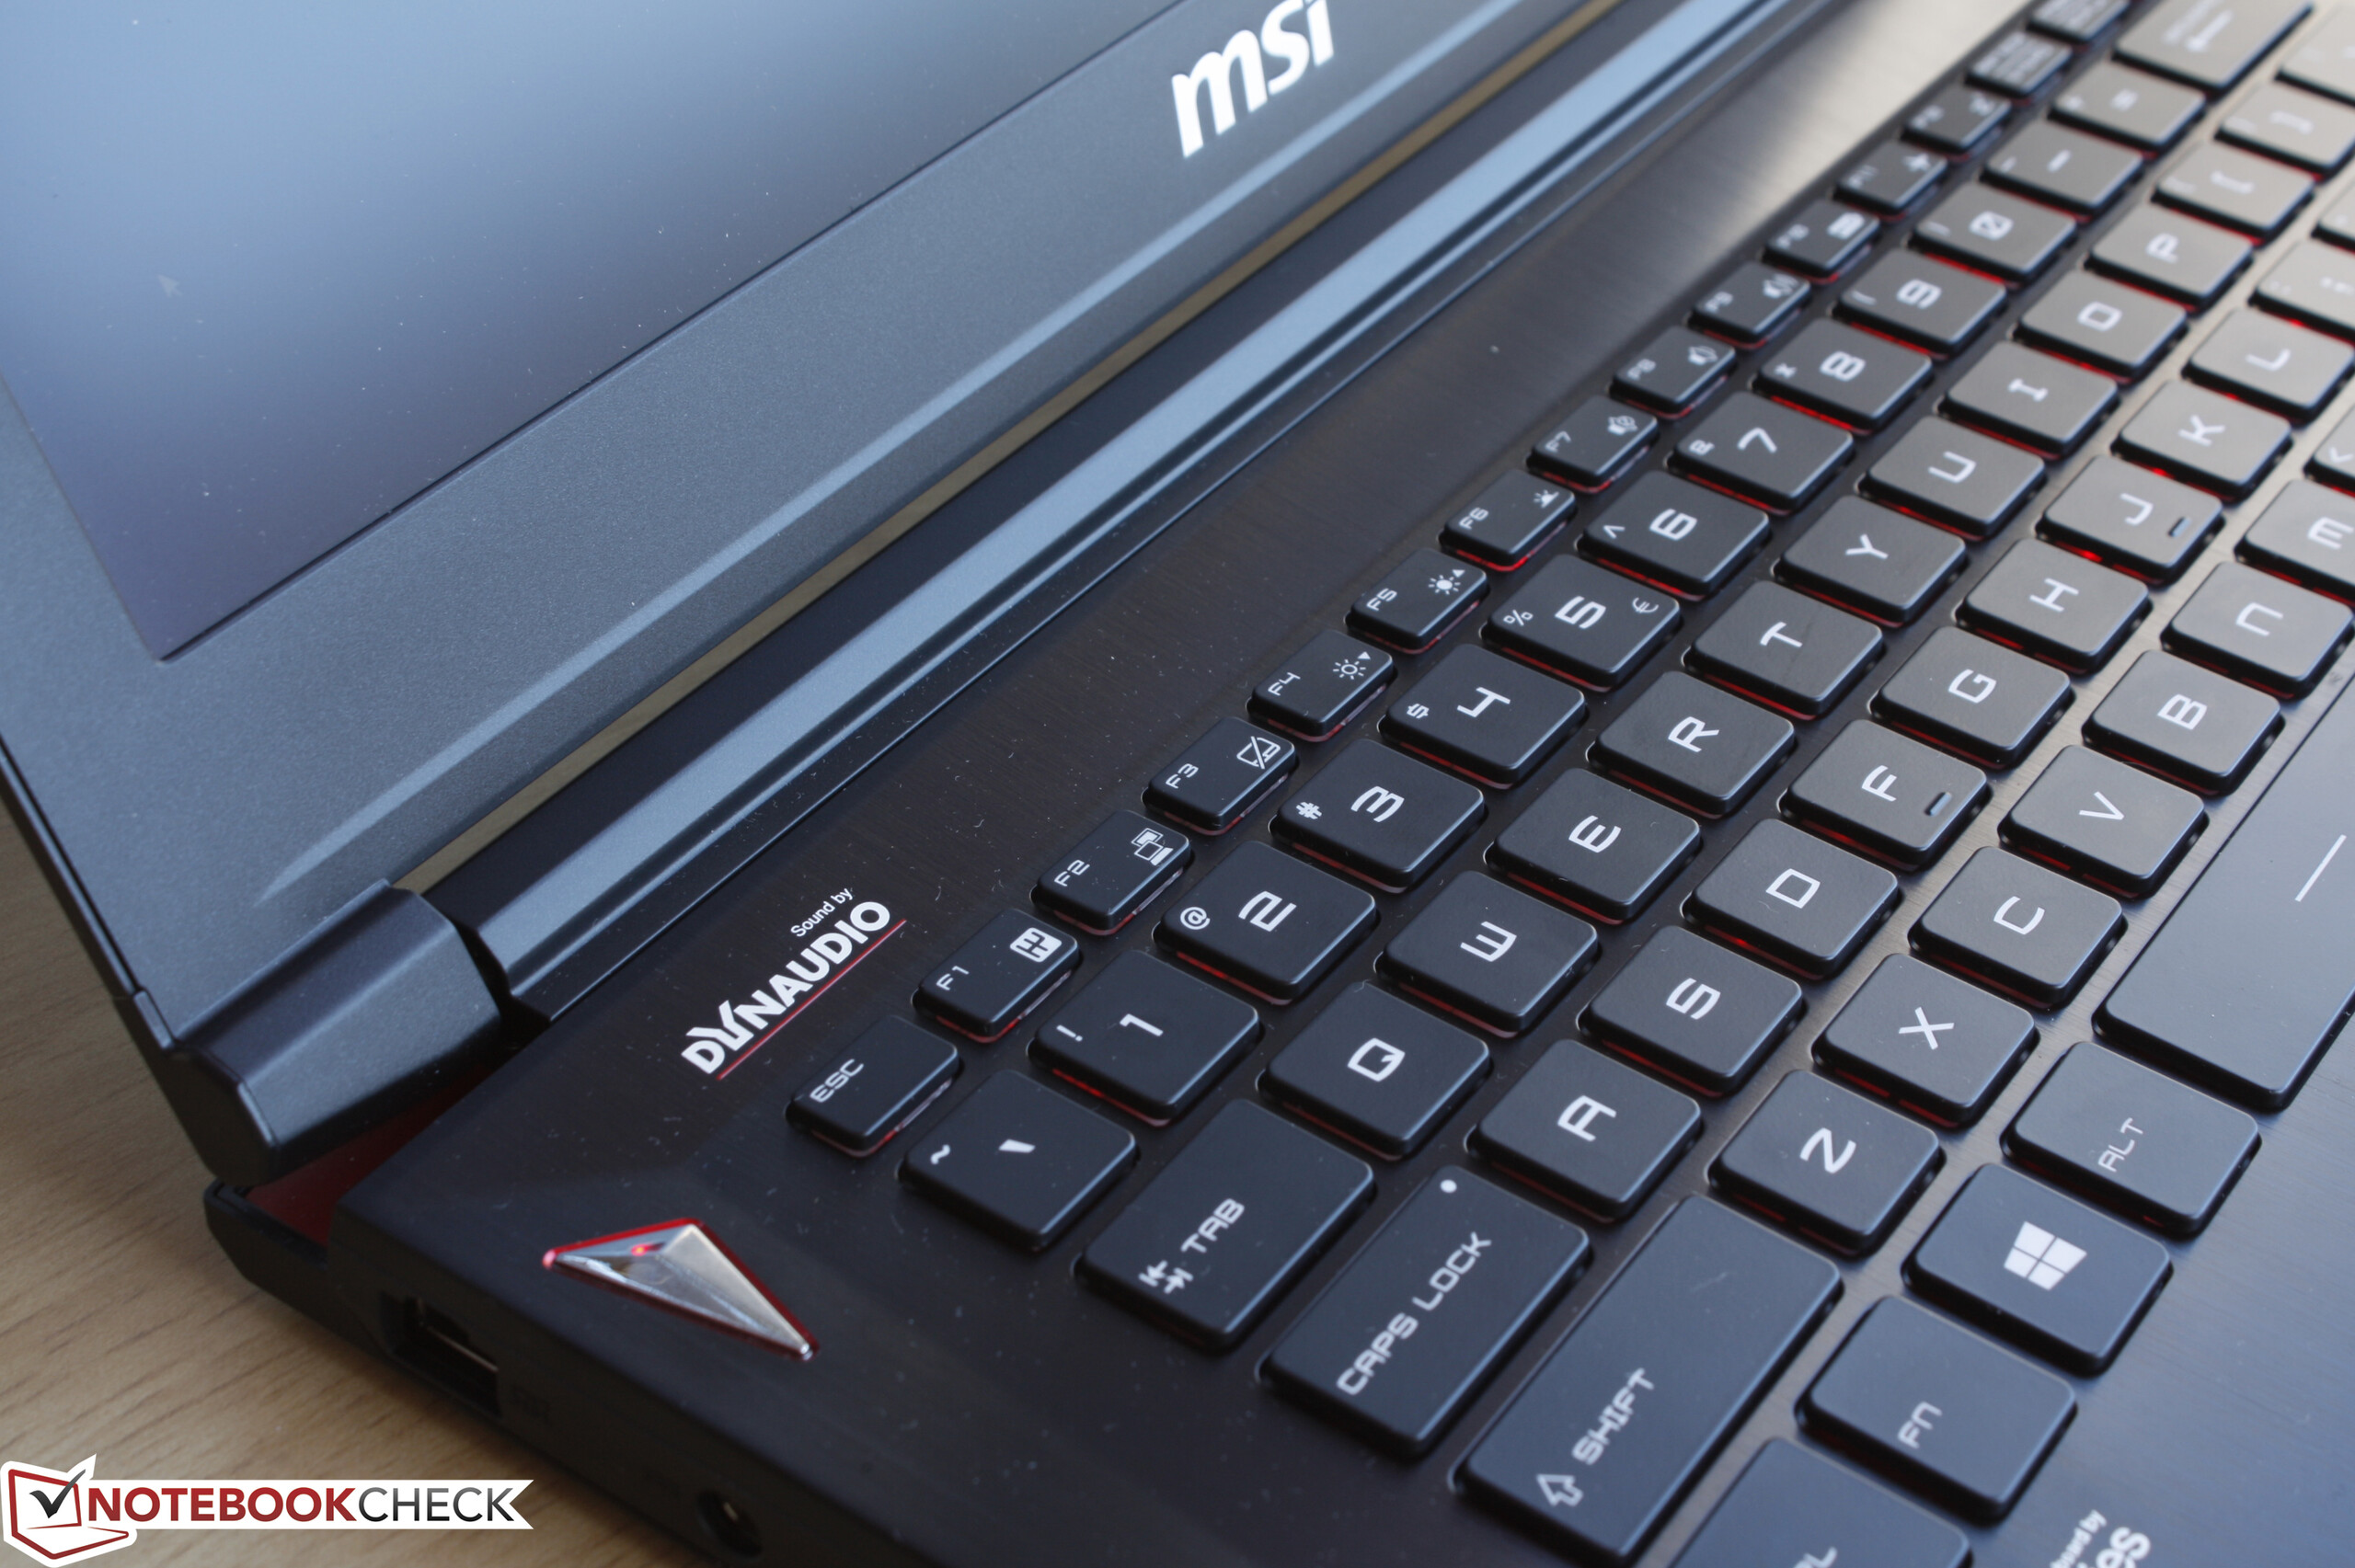
Gostaríamos de ver um sistema de resfriamento revisado para as futuras revisões da série de 14-polegadas. Enquanto o teclado é um bom, uma base mais rígida o tornaria ainda melhor. Percebemos que o G-Sync atualmente não é possível com o Optimus, mas ter a opção de painéis com resoluções maiores ou inclusive suporte para as telas G-Sync externas poderiam aumentar a versatilidade do sistema tanto em casa quanto em viagens.
O GS43VR somente é recomendado se você valora sua portabilidade sobre tudo. Por outro lado, sistemas maiores e mais fortes como o GT72VR ou GE62VR com a mesma GPU são ambos mais frios e mais silenciosos e carregam mais recursos na mesma faixa de preços.
MSI GS43VR 6RE-006US
- 09/08/2016 v5.1 (old)
Allen Ngo
Price comparison
