Breve Análise do Portátil Asus ROG Strix GL504 Scar II (i7-8750H, GTX 1070, FHD)
| SD Card Reader | |
| average JPG Copy Test (av. of 3 runs) | |
| Gigabyte Aero 15X v8 (Toshiba Exceria Pro SDXC 64 GB UHS-II) | |
| Média da turma Gaming (20.9 - 210, n=54, últimos 2 anos) | |
| Asus GL504GS (Toshiba Exceria Pro SDXC 64 GB UHS-II) | |
| Schenker XMG Neo 15 (Toshiba Exceria Pro SDXC 64 GB UHS-II) | |
| maximum AS SSD Seq Read Test (1GB) | |
| Gigabyte Aero 15X v8 (Toshiba Exceria Pro SDXC 64 GB UHS-II) | |
| Média da turma Gaming (25.5 - 261, n=51, últimos 2 anos) | |
| Asus GL504GS (Toshiba Exceria Pro SDXC 64 GB UHS-II) | |
| Schenker XMG Neo 15 (Toshiba Exceria Pro SDXC 64 GB UHS-II) | |
| Networking | |
| iperf3 transmit AX12 | |
| Asus GL504GS | |
| Schenker XMG Neo 15 | |
| MSI GS65 8RF-019DE Stealth Thin | |
| Razer Blade 15 2018 | |
| Gigabyte Aero 15X v8 | |
| iperf3 receive AX12 | |
| Schenker XMG Neo 15 | |
| Gigabyte Aero 15X v8 | |
| Razer Blade 15 2018 | |
| Asus GL504GS | |
| MSI GS65 8RF-019DE Stealth Thin | |
| |||||||||||||||||||||||||
iluminação: 86 %
iluminação com acumulador: 271 cd/m²
Contraste: 847:1 (Preto: 0.32 cd/m²)
ΔE ColorChecker Calman: 2.61 | ∀{0.5-29.43 Ø4.71}
calibrated: 2.33
ΔE Greyscale Calman: 1.97 | ∀{0.09-98 Ø4.96}
90% sRGB (Argyll 1.6.3 3D)
59% AdobeRGB 1998 (Argyll 1.6.3 3D)
66% AdobeRGB 1998 (Argyll 3D)
90.2% sRGB (Argyll 3D)
66.4% Display P3 (Argyll 3D)
Gamma: 2.4
CCT: 6398 K
| Asus GL504GS AU Optronics B156HAN08.2 (AUO82ED), IPS, 1920x1080 | Razer Blade 15 2018 LGD05C0, IPS, 1920x1080 | Gigabyte Aero 15X v8 LGD05C0, IPS, 1920x1080 | MSI GS65 8RF-019DE Stealth Thin AU Optronics B156HAN08.0 (AUO80ED), IPS, 1920x1080 | Schenker XMG Neo 15 LGD05C0, IPS, 1920x1080 | |
|---|---|---|---|---|---|
| Display | 0% | -1% | 1% | 0% | |
| Display P3 Coverage (%) | 66.4 | 64.3 -3% | 63.6 -4% | 66.2 0% | 64.3 -3% |
| sRGB Coverage (%) | 90.2 | 93.7 4% | 93.8 4% | 92.1 2% | 94.1 4% |
| AdobeRGB 1998 Coverage (%) | 66 | 65.5 -1% | 64.9 -2% | 67.2 2% | 65.3 -1% |
| Response Times | -88% | -80% | -95% | -66% | |
| Response Time Grey 50% / Grey 80% * (ms) | 7.2 ? | 17.2 ? -139% | 16.8 ? -133% | 17.6 ? -144% | 16 ? -122% |
| Response Time Black / White * (ms) | 8.8 ? | 12 ? -36% | 11.2 ? -27% | 12.8 ? -45% | 9.6 ? -9% |
| PWM Frequency (Hz) | |||||
| Screen | 2% | 21% | 11% | 8% | |
| Brightness middle (cd/m²) | 271 | 290 7% | 313 15% | 254 -6% | 325 20% |
| Brightness (cd/m²) | 261 | 281 8% | 300 15% | 262 0% | 303 16% |
| Brightness Distribution (%) | 86 | 82 -5% | 78 -9% | 89 3% | 90 5% |
| Black Level * (cd/m²) | 0.32 | 0.3 6% | 0.33 -3% | 0.22 31% | 0.33 -3% |
| Contrast (:1) | 847 | 967 14% | 948 12% | 1155 36% | 985 16% |
| Colorchecker dE 2000 * | 2.61 | 2.85 -9% | 1.29 51% | 2.37 9% | 2.69 -3% |
| Colorchecker dE 2000 max. * | 4.93 | 6.27 -27% | 2.04 59% | 4.71 4% | 4.91 -0% |
| Colorchecker dE 2000 calibrated * | 2.33 | 1.39 40% | 1.84 21% | 1.27 45% | |
| Greyscale dE 2000 * | 1.97 | 2.4 -22% | 0.69 65% | 1.58 20% | 2.34 -19% |
| Gamma | 2.4 92% | 2.34 94% | 2.43 91% | 2.48 89% | 2.38 92% |
| CCT | 6398 102% | 6718 97% | 6550 99% | 6785 96% | 6872 95% |
| Color Space (Percent of AdobeRGB 1998) (%) | 59 | 60 2% | 60 2% | 60 2% | 60 2% |
| Color Space (Percent of sRGB) (%) | 90 | 94 4% | 94 4% | 92 2% | 94 4% |
| Média Total (Programa/Configurações) | -29% /
-10% | -20% /
3% | -28% /
-4% | -19% /
-3% |
* ... menor é melhor
Exibir tempos de resposta
| ↔ Tempo de resposta preto para branco | ||
|---|---|---|
| 8.8 ms ... ascensão ↗ e queda ↘ combinadas | ↗ 4.4 ms ascensão | 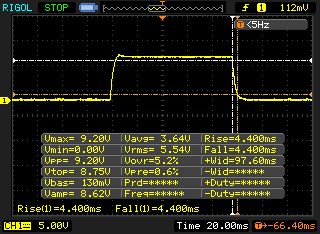 |
| ↘ 4.4 ms queda | ||
| A tela mostra taxas de resposta rápidas em nossos testes e deve ser adequada para jogos. Em comparação, todos os dispositivos testados variam de 0.1 (mínimo) a 240 (máximo) ms. » 25 % de todos os dispositivos são melhores. Isso significa que o tempo de resposta medido é melhor que a média de todos os dispositivos testados (19.8 ms). | ||
| ↔ Tempo de resposta 50% cinza a 80% cinza | ||
| 7.2 ms ... ascensão ↗ e queda ↘ combinadas | ↗ 3.8 ms ascensão | 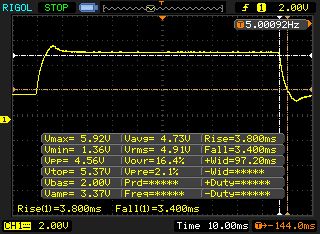 |
| ↘ 3.4 ms queda | ||
| A tela mostra taxas de resposta muito rápidas em nossos testes e deve ser muito adequada para jogos em ritmo acelerado. Em comparação, todos os dispositivos testados variam de 0.165 (mínimo) a 636 (máximo) ms. » 20 % de todos os dispositivos são melhores. Isso significa que o tempo de resposta medido é melhor que a média de todos os dispositivos testados (30.9 ms). | ||
Cintilação da tela / PWM (modulação por largura de pulso)
| Tela tremeluzindo / PWM não detectado | 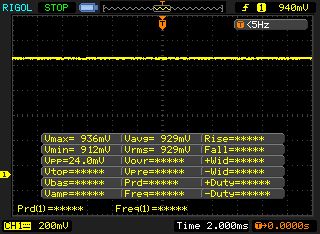 | ||
[pwm_comparison] Em comparação: 52 % de todos os dispositivos testados não usam PWM para escurecer a tela. Se PWM foi detectado, uma média de 7744 (mínimo: 5 - máximo: 343500) Hz foi medida. | |||
| PCMark 10 - Score | |
| Média da turma Gaming (5828 - 12414, n=93, últimos 2 anos) | |
| Schenker XMG Neo 15 | |
| MSI GS65 8RF-019DE Stealth Thin | |
| Gigabyte Aero 15X v8 | |
| Razer Blade 15 2018 | |
| Asus GL504GS | |
| PCMark 8 Home Score Accelerated v2 | 5390 pontos | |
| PCMark 8 Work Score Accelerated v2 | 5673 pontos | |
| PCMark 10 Score | 4854 pontos | |
Ajuda | ||
| Asus GL504GS Samsung SSD PM981 MZVLB512HAJQ | Razer Blade 15 2018 Samsung PM961 NVMe MZVLW512HMJP | Gigabyte Aero 15X v8 Toshiba NVMe THNSN5512GPU7 | MSI GS65 8RF-019DE Stealth Thin Samsung SSD PM981 MZVLB512HAJQ | Schenker XMG Neo 15 Samsung SSD 970 Pro 1TB | |
|---|---|---|---|---|---|
| AS SSD | -6% | -31% | -7% | 13% | |
| Seq Read (MB/s) | 1837 | 2376 29% | 2213 20% | 1266 -31% | 1915 4% |
| Seq Write (MB/s) | 1730 | 1521 -12% | 1163 -33% | 1834 6% | 2324 34% |
| 4K Read (MB/s) | 53.3 | 46.45 -13% | 23.36 -56% | 48.94 -8% | 48.03 -10% |
| 4K Write (MB/s) | 105.7 | 93.6 -11% | 80.4 -24% | 107.2 1% | 106 0% |
| Score Read (Points) | 1542 | 1584 3% | 1092 -29% | 1346 -13% | 1837 19% |
| Score Write (Points) | 1983 | 1450 -27% | 939 -53% | 2051 3% | 2423 22% |
| Score Total (Points) | 4318 | 3806 -12% | 2536 -41% | 4122 -5% | 5224 21% |

| 3DMark 11 Performance | 17775 pontos | |
| 3DMark Cloud Gate Standard Score | 36818 pontos | |
| 3DMark Fire Strike Score | 14394 pontos | |
Ajuda | ||
| 3DMark - 1920x1080 Fire Strike Graphics | |
| Média da turma Gaming (18629 - 62849, n=112, últimos 2 anos) | |
| Asus GL504GS | |
| Razer Blade 15 2018 | |
| Gigabyte Aero 15X v8 | |
| MSI GS65 8RF-019DE Stealth Thin | |
| Schenker XMG Neo 15 | |
| 3DMark 11 - 1280x720 Performance GPU | |
| Média da turma Gaming (21841 - 80022, n=103, últimos 2 anos) | |
| Asus GL504GS | |
| Razer Blade 15 2018 | |
| Gigabyte Aero 15X v8 | |
| MSI GS65 8RF-019DE Stealth Thin | |
| Schenker XMG Neo 15 | |
| The Witcher 3 - 1920x1080 Ultra Graphics & Postprocessing (HBAO+) | |
| Média da turma Gaming (104.7 - 240, n=7, últimos 2 anos) | |
| Asus GL504GS | |
| Razer Blade 15 2018 | |
| MSI GS65 8RF-019DE Stealth Thin | |
| Gigabyte Aero 15X v8 | |
| Schenker XMG Neo 15 | |
| baixo | média | alto | ultra | |
|---|---|---|---|---|
| The Witcher 3 (2015) | 102 | 55.6 | ||
| Farming Simulator 17 (2016) | 247 | 218 | ||
| Destiny 2 (2017) | 135 | 116 | ||
| Fortnite (2018) | 148 | 111 | ||
| Final Fantasy XV Benchmark (2018) | 57.2 | |||
| Far Cry 5 (2018) | 92 | 87 | ||
| The Crew 2 (2018) | 60 | 60 |
Barulho
| Ocioso |
| 32 / 33 / 40 dB |
| Carga |
| 49 / 53 dB |
 | ||
30 dB silencioso 40 dB(A) audível 50 dB(A) ruidosamente alto |
||
min: | ||
| Asus GL504GS GeForce GTX 1070 Mobile, i7-8750H | Razer Blade 15 2018 GeForce GTX 1070 Max-Q, i7-8750H | Gigabyte Aero 15X v8 GeForce GTX 1070 Max-Q, i7-8750H | MSI GS65 8RF-019DE Stealth Thin GeForce GTX 1070 Max-Q, i7-8750H | Schenker XMG Neo 15 GeForce GTX 1060 Mobile, i7-8750H | Média da turma Gaming | |
|---|---|---|---|---|---|---|
| Noise | 7% | 3% | 10% | -2% | 15% | |
| desligado / ambiente * (dB) | 29 | 29 -0% | 29 -0% | 30 -3% | 29 -0% | 24.1 ? 17% |
| Idle Minimum * (dB) | 32 | 29 9% | 30 6% | 30 6% | 29 9% | 25.9 ? 19% |
| Idle Average * (dB) | 33 | 30 9% | 31 6% | 31 6% | 35 -6% | 27.4 ? 17% |
| Idle Maximum * (dB) | 40 | 38 5% | 35 12% | 34 15% | 40 -0% | 30.1 ? 25% |
| Load Average * (dB) | 49 | 46 6% | 49 -0% | 43 12% | 50 -2% | 43.7 ? 11% |
| Witcher 3 ultra * (dB) | 51 | 49 4% | 51 -0% | 42 18% | 53 -4% | |
| Load Maximum * (dB) | 53 | 46 13% | 54 -2% | 44 17% | 58 -9% | 54.3 ? -2% |
* ... menor é melhor
(-) A temperatura máxima no lado superior é 55 °C / 131 F, em comparação com a média de 40.4 °C / 105 F , variando de 21.2 a 68.8 °C para a classe Gaming.
(-) A parte inferior aquece até um máximo de 55 °C / 131 F, em comparação com a média de 43.2 °C / 110 F
(±) Em uso inativo, a temperatura média para o lado superior é 33.7 °C / 93 F, em comparação com a média do dispositivo de 33.9 °C / ### class_avg_f### F.
(-) Jogando The Witcher 3, a temperatura média para o lado superior é 41.8 °C / 107 F, em comparação com a média do dispositivo de 33.9 °C / ## #class_avg_f### F.
(±) Os apoios para as mãos e o touchpad podem ficar muito quentes ao toque, com um máximo de 37 °C / 98.6 F.
(-) A temperatura média da área do apoio para as mãos de dispositivos semelhantes foi 28.8 °C / 83.8 F (-8.2 °C / -14.8 F).
| Asus GL504GS GeForce GTX 1070 Mobile, i7-8750H | Razer Blade 15 2018 GeForce GTX 1070 Max-Q, i7-8750H | Gigabyte Aero 15X v8 GeForce GTX 1070 Max-Q, i7-8750H | MSI GS65 8RF-019DE Stealth Thin GeForce GTX 1070 Max-Q, i7-8750H | Schenker XMG Neo 15 GeForce GTX 1060 Mobile, i7-8750H | Média da turma Gaming | |
|---|---|---|---|---|---|---|
| Heat | 1% | 8% | 15% | 4% | 13% | |
| Maximum Upper Side * (°C) | 55 | 56 -2% | 53 4% | 49 11% | 56 -2% | 45.1 ? 18% |
| Maximum Bottom * (°C) | 55 | 59 -7% | 65 -18% | 63 -15% | 68 -24% | 48.1 ? 13% |
| Idle Upper Side * (°C) | 36 | 33 8% | 26 28% | 24 33% | 28 22% | 31 ? 14% |
| Idle Bottom * (°C) | 36 | 34 6% | 30 17% | 25 31% | 29 19% | 34.2 ? 5% |
* ... menor é melhor
Asus GL504GS análise de áudio
(±) | o volume do alto-falante é médio, mas bom (###valor### dB)
Graves 100 - 315Hz
(+) | bons graves - apenas 2.9% longe da mediana
(±) | a linearidade dos graves é média (7.8% delta para a frequência anterior)
Médios 400 - 2.000 Hz
(+) | médios equilibrados - apenas 3.3% longe da mediana
(+) | médios são lineares (4.5% delta para frequência anterior)
Altos 2 - 16 kHz
(+) | agudos equilibrados - apenas 4.6% longe da mediana
(+) | os máximos são lineares (4.2% delta da frequência anterior)
Geral 100 - 16.000 Hz
(+) | o som geral é linear (11.6% diferença em relação à mediana)
Comparado com a mesma classe
» 10% de todos os dispositivos testados nesta classe foram melhores, 3% semelhantes, 87% piores
» O melhor teve um delta de 6%, a média foi 18%, o pior foi 132%
Comparado com todos os dispositivos testados
» 8% de todos os dispositivos testados foram melhores, 2% semelhantes, 90% piores
» O melhor teve um delta de 4%, a média foi 23%, o pior foi 134%
Razer Blade 15 2018 análise de áudio
(+) | os alto-falantes podem tocar relativamente alto (###valor### dB)
Graves 100 - 315Hz
(±) | graves reduzidos - em média 12.1% menor que a mediana
(±) | a linearidade dos graves é média (7.6% delta para a frequência anterior)
Médios 400 - 2.000 Hz
(±) | médios mais altos - em média 7.4% maior que a mediana
(+) | médios são lineares (5.6% delta para frequência anterior)
Altos 2 - 16 kHz
(±) | máximos reduzidos - em média 5% menor que a mediana
(+) | os máximos são lineares (6.7% delta da frequência anterior)
Geral 100 - 16.000 Hz
(±) | a linearidade do som geral é média (21.1% diferença em relação à mediana)
Comparado com a mesma classe
» 76% de todos os dispositivos testados nesta classe foram melhores, 4% semelhantes, 20% piores
» O melhor teve um delta de 6%, a média foi 18%, o pior foi 132%
Comparado com todos os dispositivos testados
» 58% de todos os dispositivos testados foram melhores, 7% semelhantes, 34% piores
» O melhor teve um delta de 4%, a média foi 23%, o pior foi 134%
| desligado | |
| Ocioso | |
| Carga |
|
Key:
min: | |
| Asus GL504GS GeForce GTX 1070 Mobile, i7-8750H | Razer Blade 15 2018 GeForce GTX 1070 Max-Q, i7-8750H | Gigabyte Aero 15X v8 GeForce GTX 1070 Max-Q, i7-8750H | MSI GS65 8RF-019DE Stealth Thin GeForce GTX 1070 Max-Q, i7-8750H | Schenker XMG Neo 15 GeForce GTX 1060 Mobile, i7-8750H | Média da turma Gaming | |
|---|---|---|---|---|---|---|
| Power Consumption | 31% | 31% | 38% | 39% | 20% | |
| Idle Minimum * (Watt) | 29 | 14 52% | 14 52% | 7 76% | 10 66% | 13.1 ? 55% |
| Idle Average * (Watt) | 32 | 17 47% | 18 44% | 11 66% | 13 59% | 19 ? 41% |
| Idle Maximum * (Watt) | 38 | 21 45% | 22 42% | 20 47% | 18 53% | 24.6 ? 35% |
| Load Average * (Watt) | 100 | 95 5% | 91 9% | 98 2% | 95 5% | 111.3 ? -11% |
| Witcher 3 ultra * (Watt) | 170 | 141 17% | 142 16% | 132 22% | 114 33% | |
| Load Maximum * (Watt) | 217 | 179 18% | 173 20% | 182 16% | 179 18% | 260 ? -20% |
* ... menor é melhor
| Asus GL504GS GeForce GTX 1070 Mobile, i7-8750H, 66 Wh | Razer Blade 15 2018 GeForce GTX 1070 Max-Q, i7-8750H, 80 Wh | Gigabyte Aero 15X v8 GeForce GTX 1070 Max-Q, i7-8750H, 94.24 Wh | MSI GS65 8RF-019DE Stealth Thin GeForce GTX 1070 Max-Q, i7-8750H, 82 Wh | Schenker XMG Neo 15 GeForce GTX 1060 Mobile, i7-8750H, 46.7 Wh | Média da turma Gaming | |
|---|---|---|---|---|---|---|
| Duração da bateria | 91% | 237% | 124% | 91% | 155% | |
| Reader / Idle (h) | 2.9 | 6.4 121% | 12.7 338% | 8.5 193% | 6.7 131% | 7.84 ? 170% |
| H.264 (h) | 2.5 | 5.4 116% | 8.4 236% | 5.9 136% | 4.8 92% | 8.27 ? 231% |
| WiFi v1.3 (h) | 2.4 | 5.4 125% | 8.6 258% | 6 150% | 4.4 83% | 7.08 ? 195% |
| Load (h) | 1.2 | 1.2 0% | 2.6 117% | 1.4 17% | 1.9 58% | 1.496 ? 25% |
Pro
Contra
No segmento de portáteis de jogos finos com um design de marcos finos, podemos ver o início de uma dura concorrência. Depois de que o Gigabyte Aero 15X e o Razer Blade 15 já conseguiram convencer quase completamente nos últimos meses, com o ASUS ROG Strix GL504 Cicatriz II, agora há um terceiro candidato que alcança uma avaliação geral de 87% ou 88%.
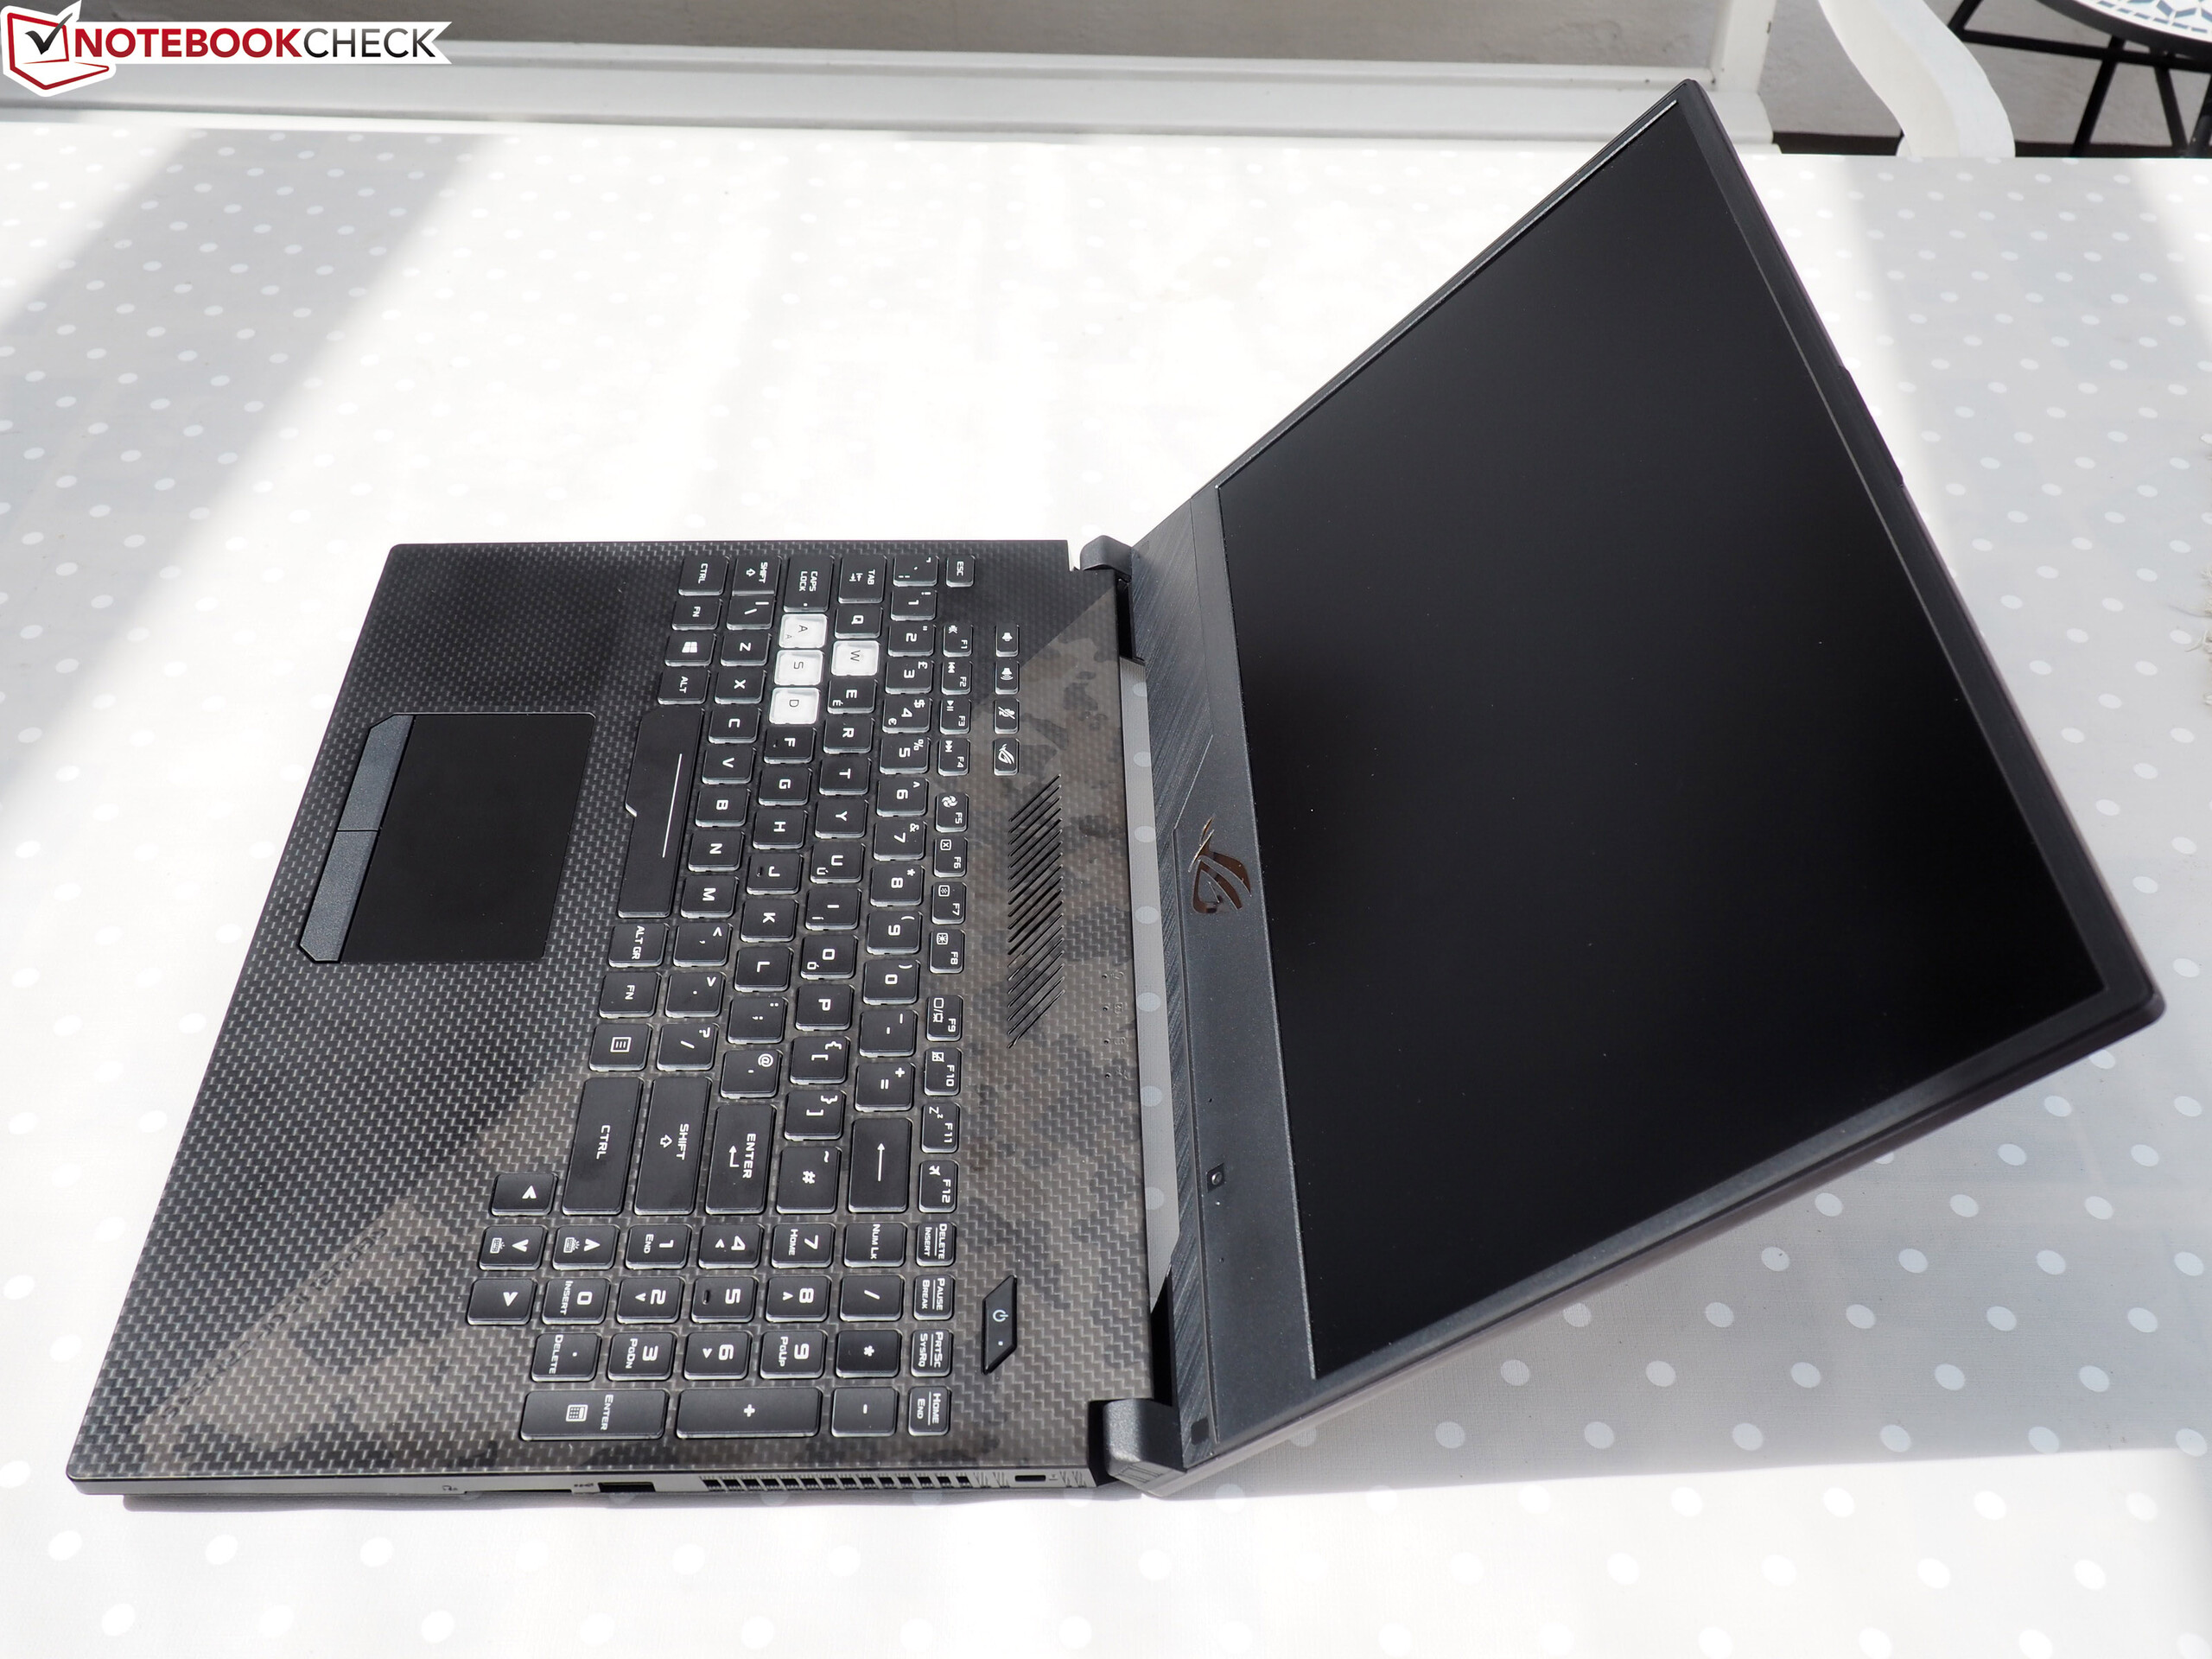
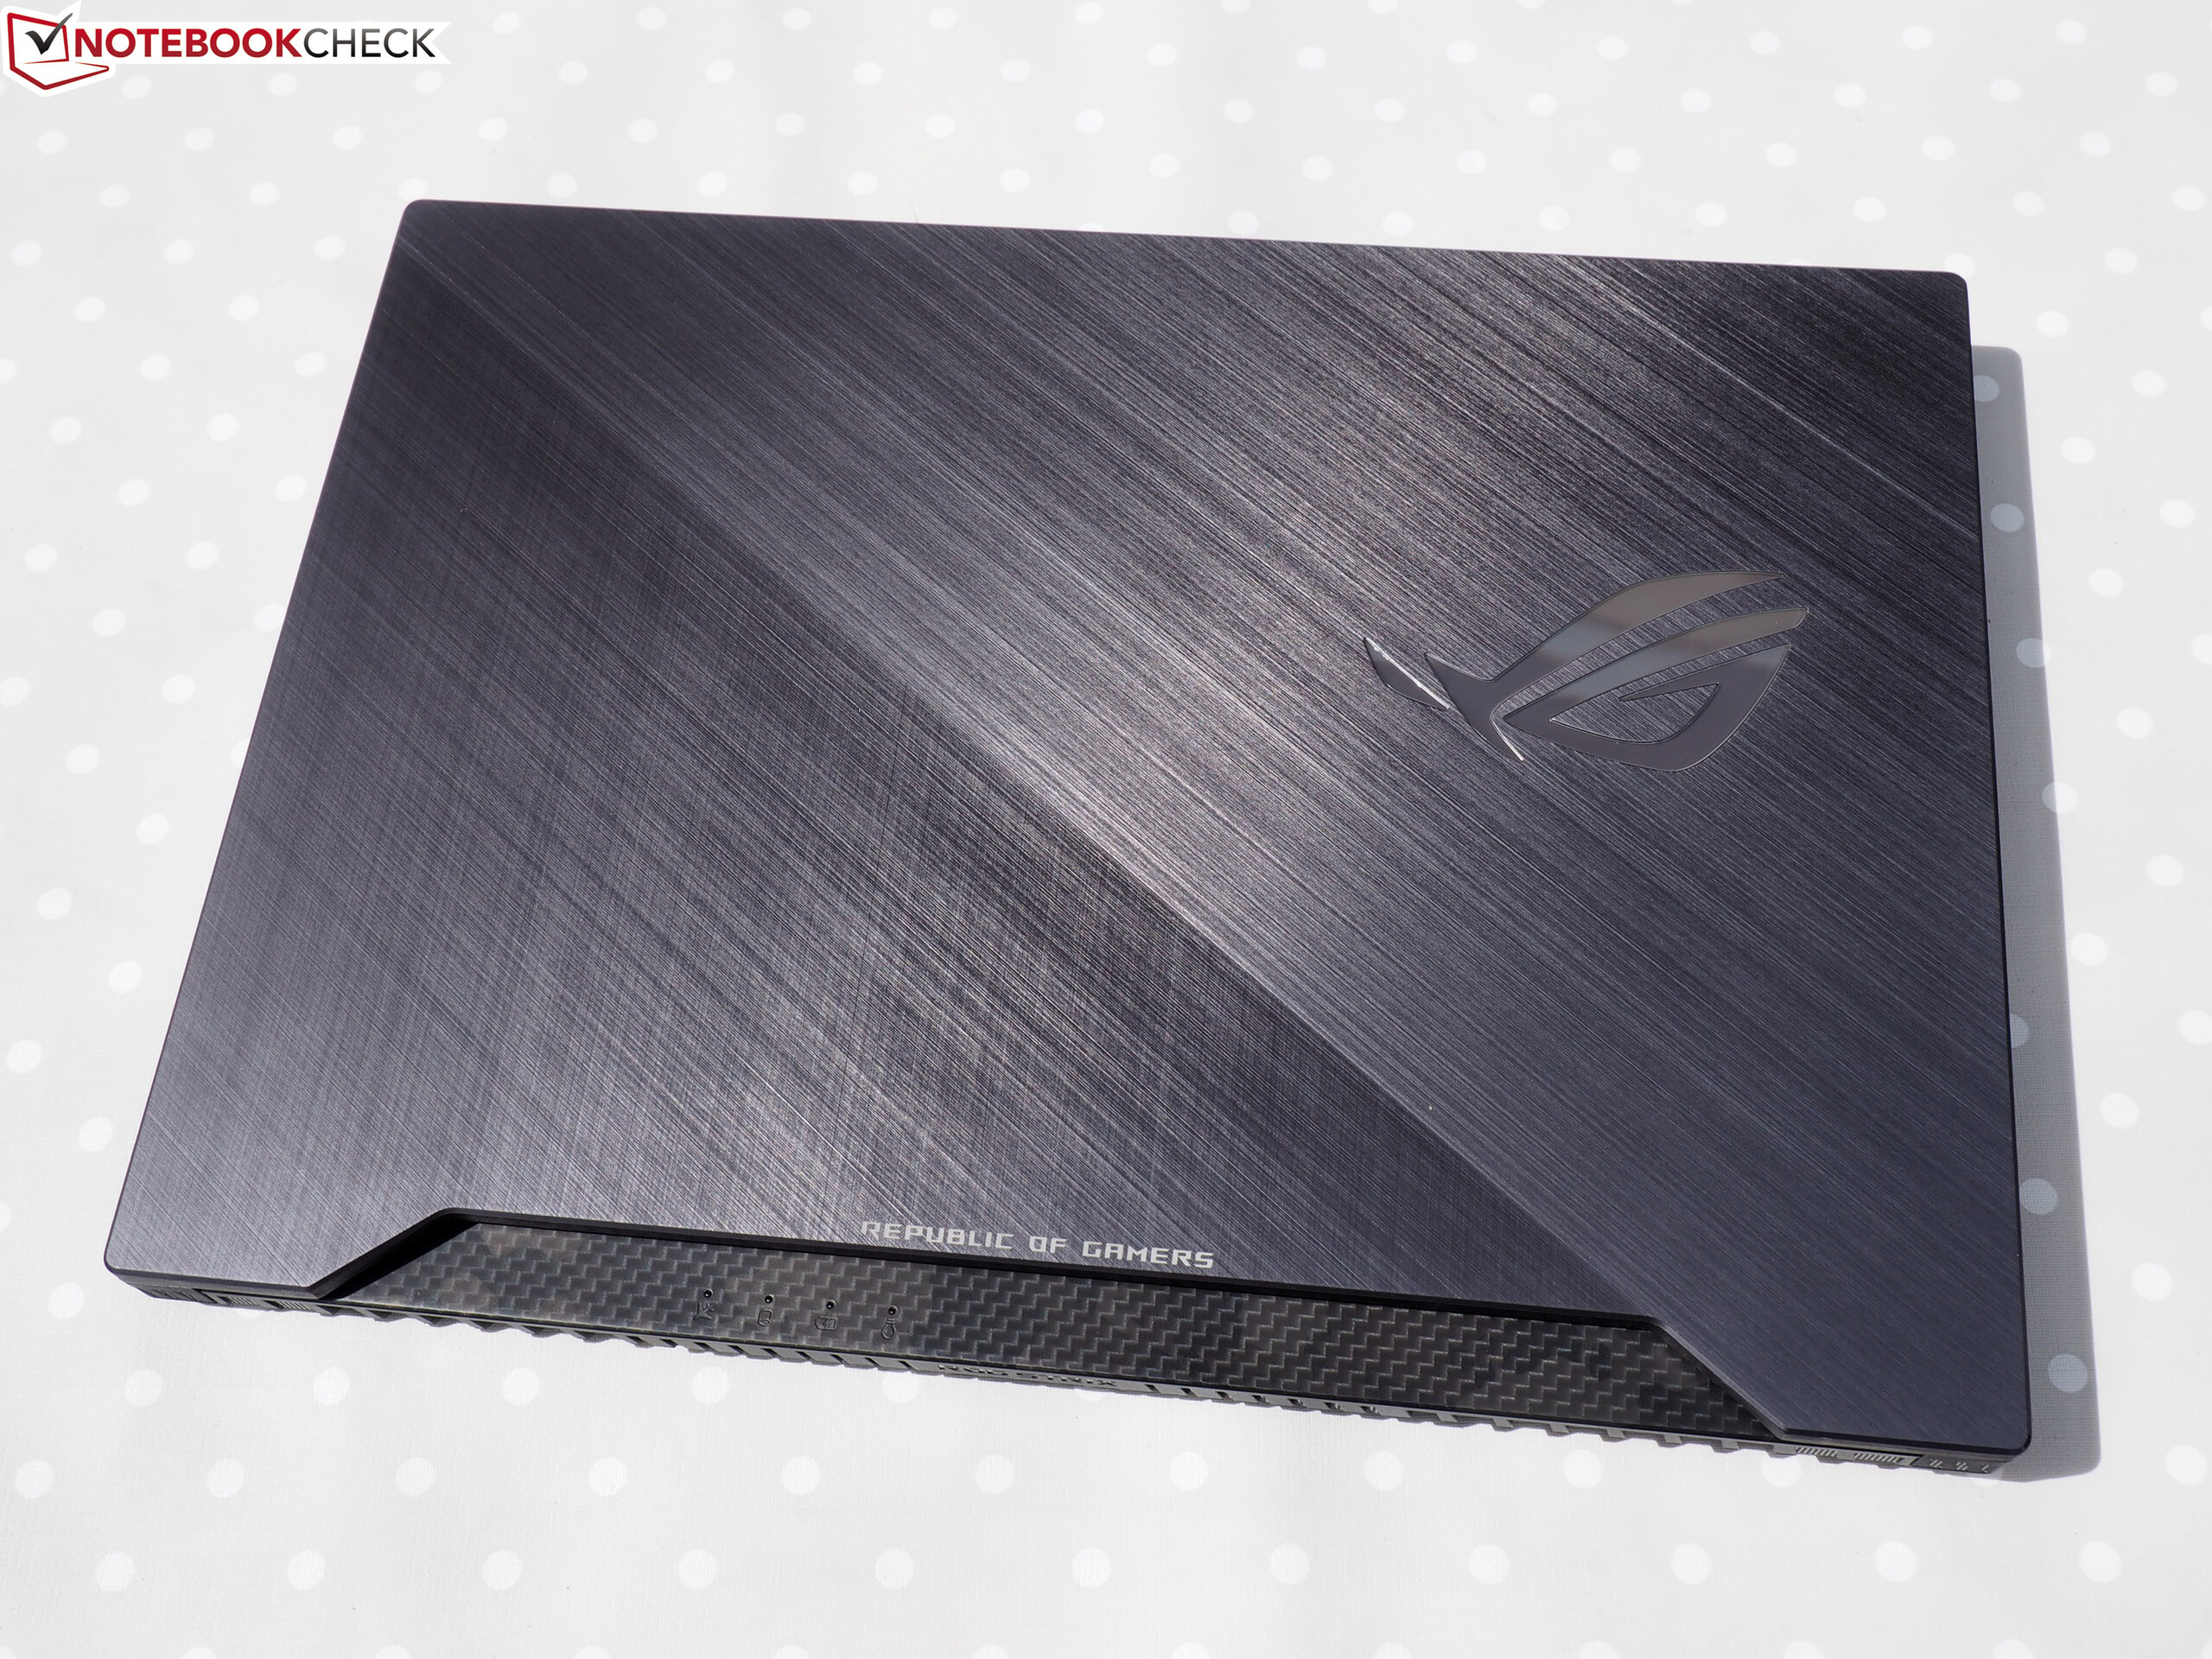
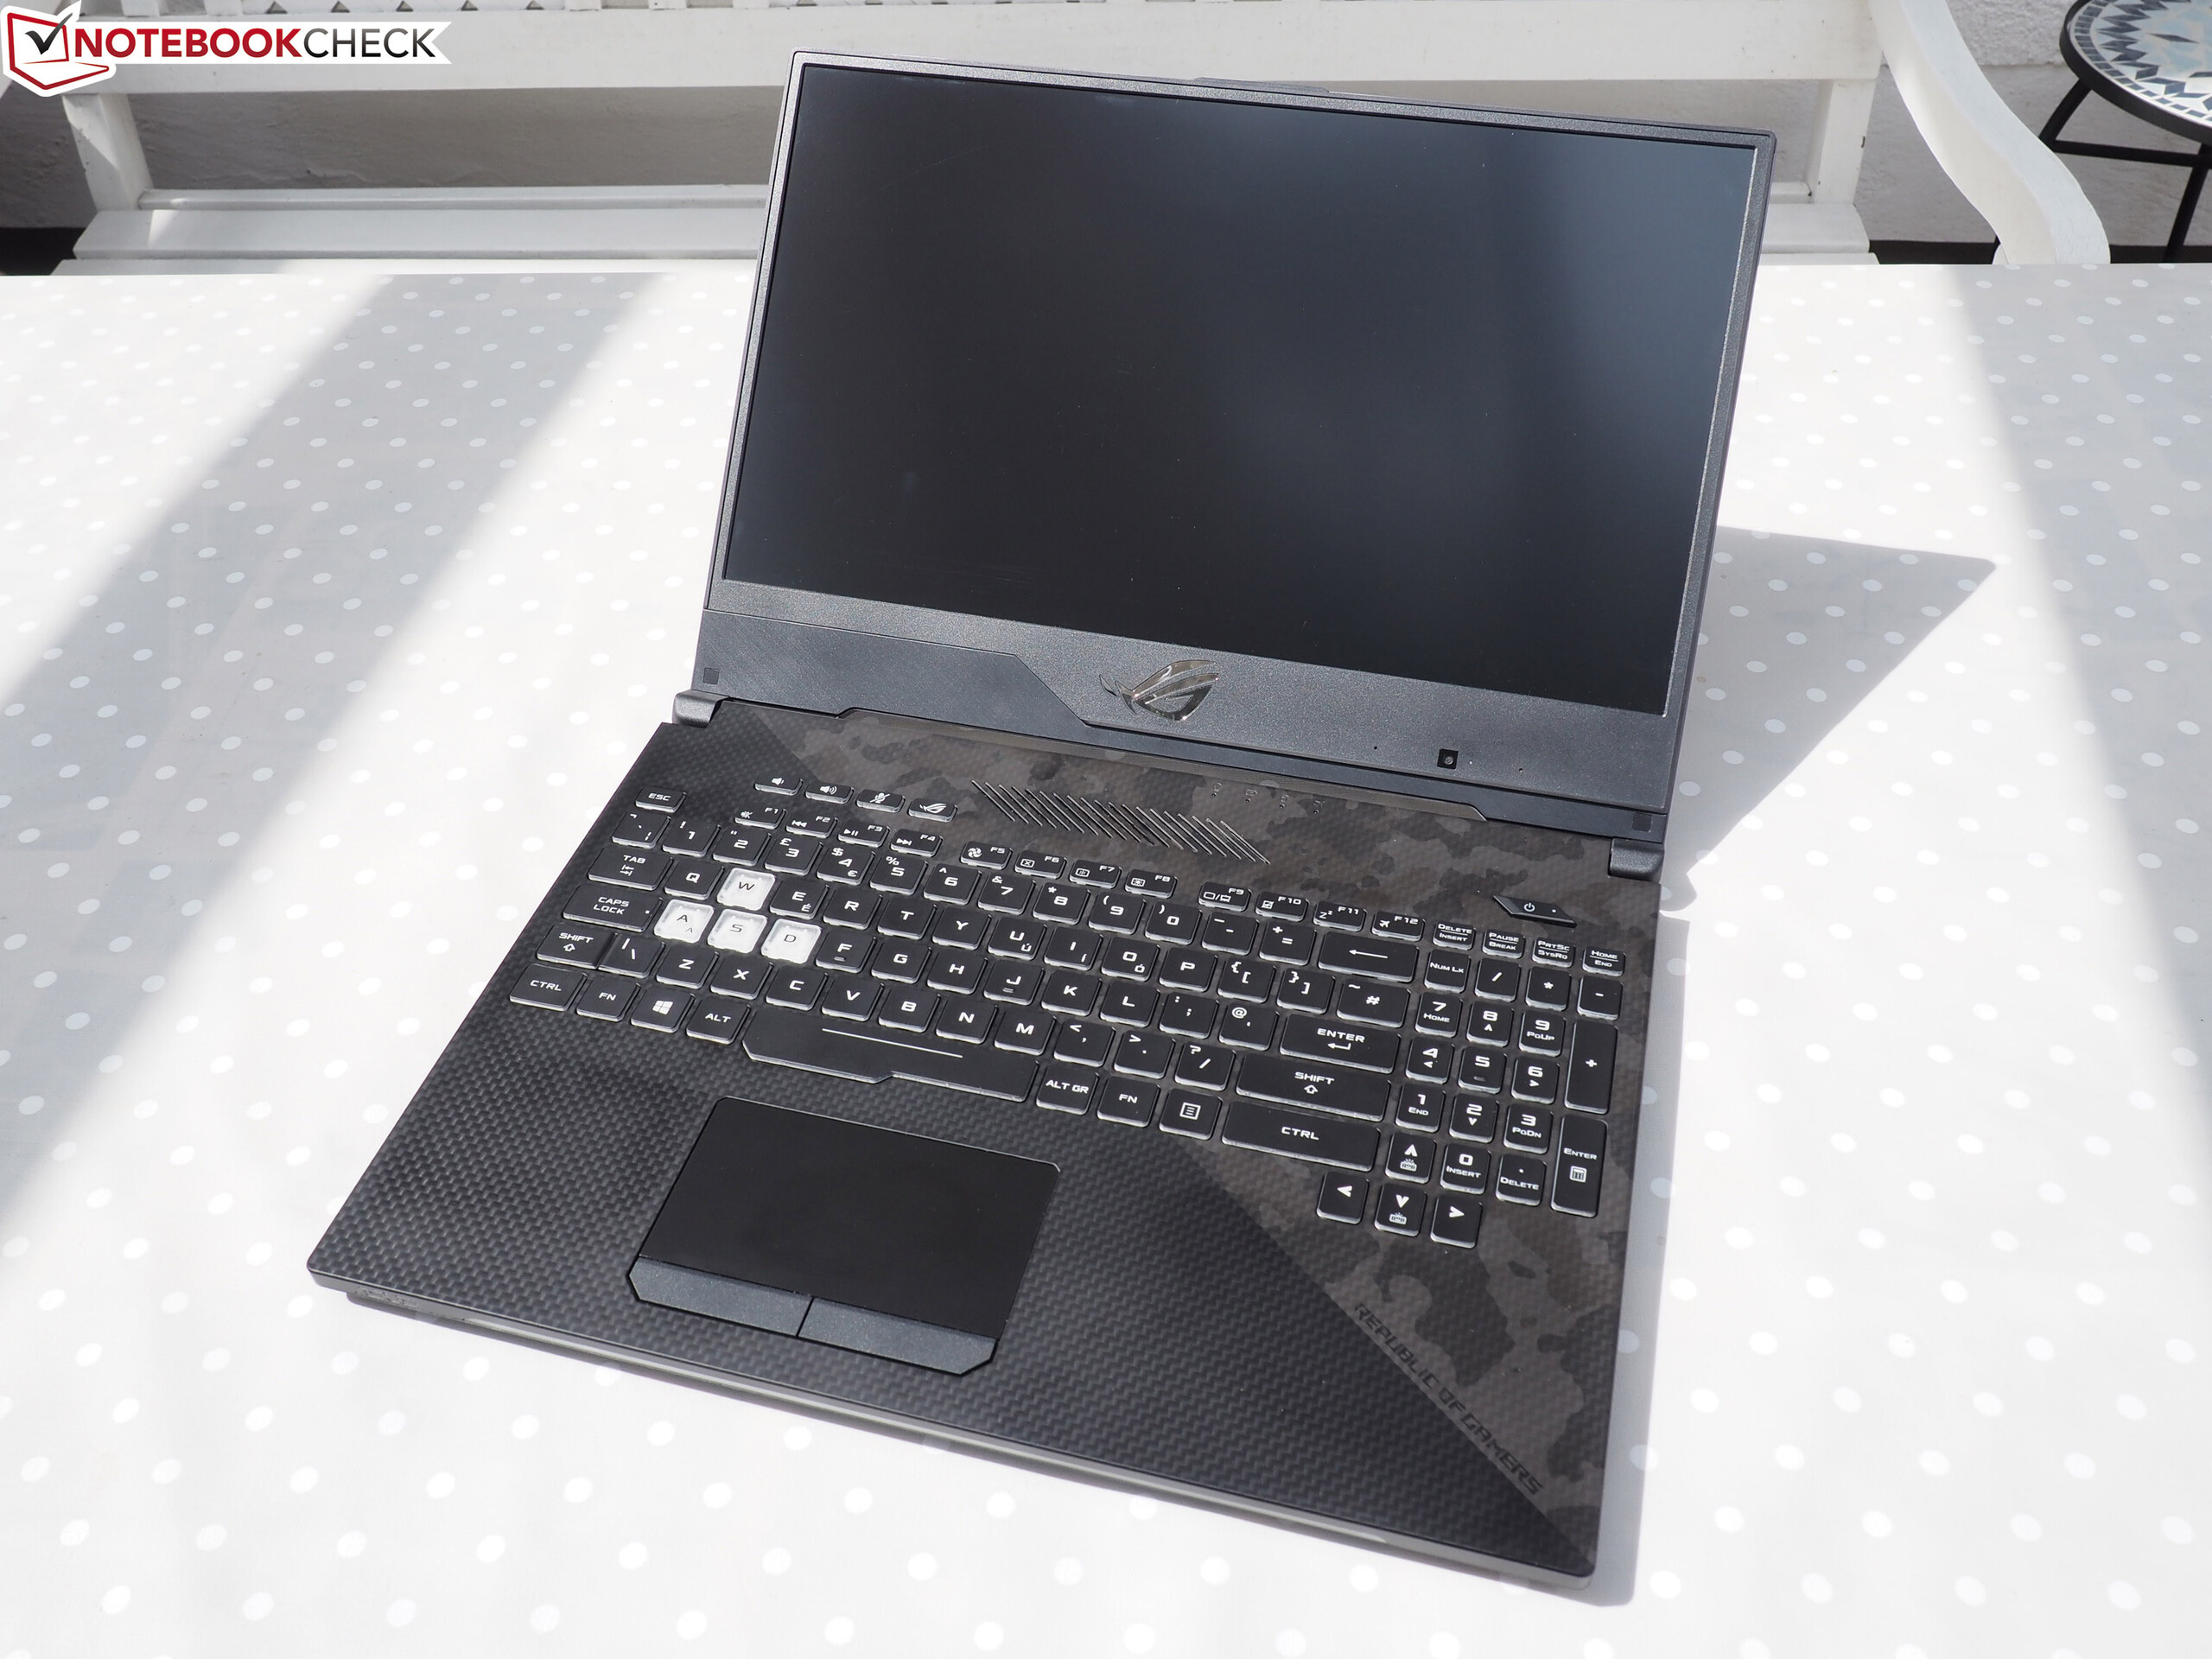
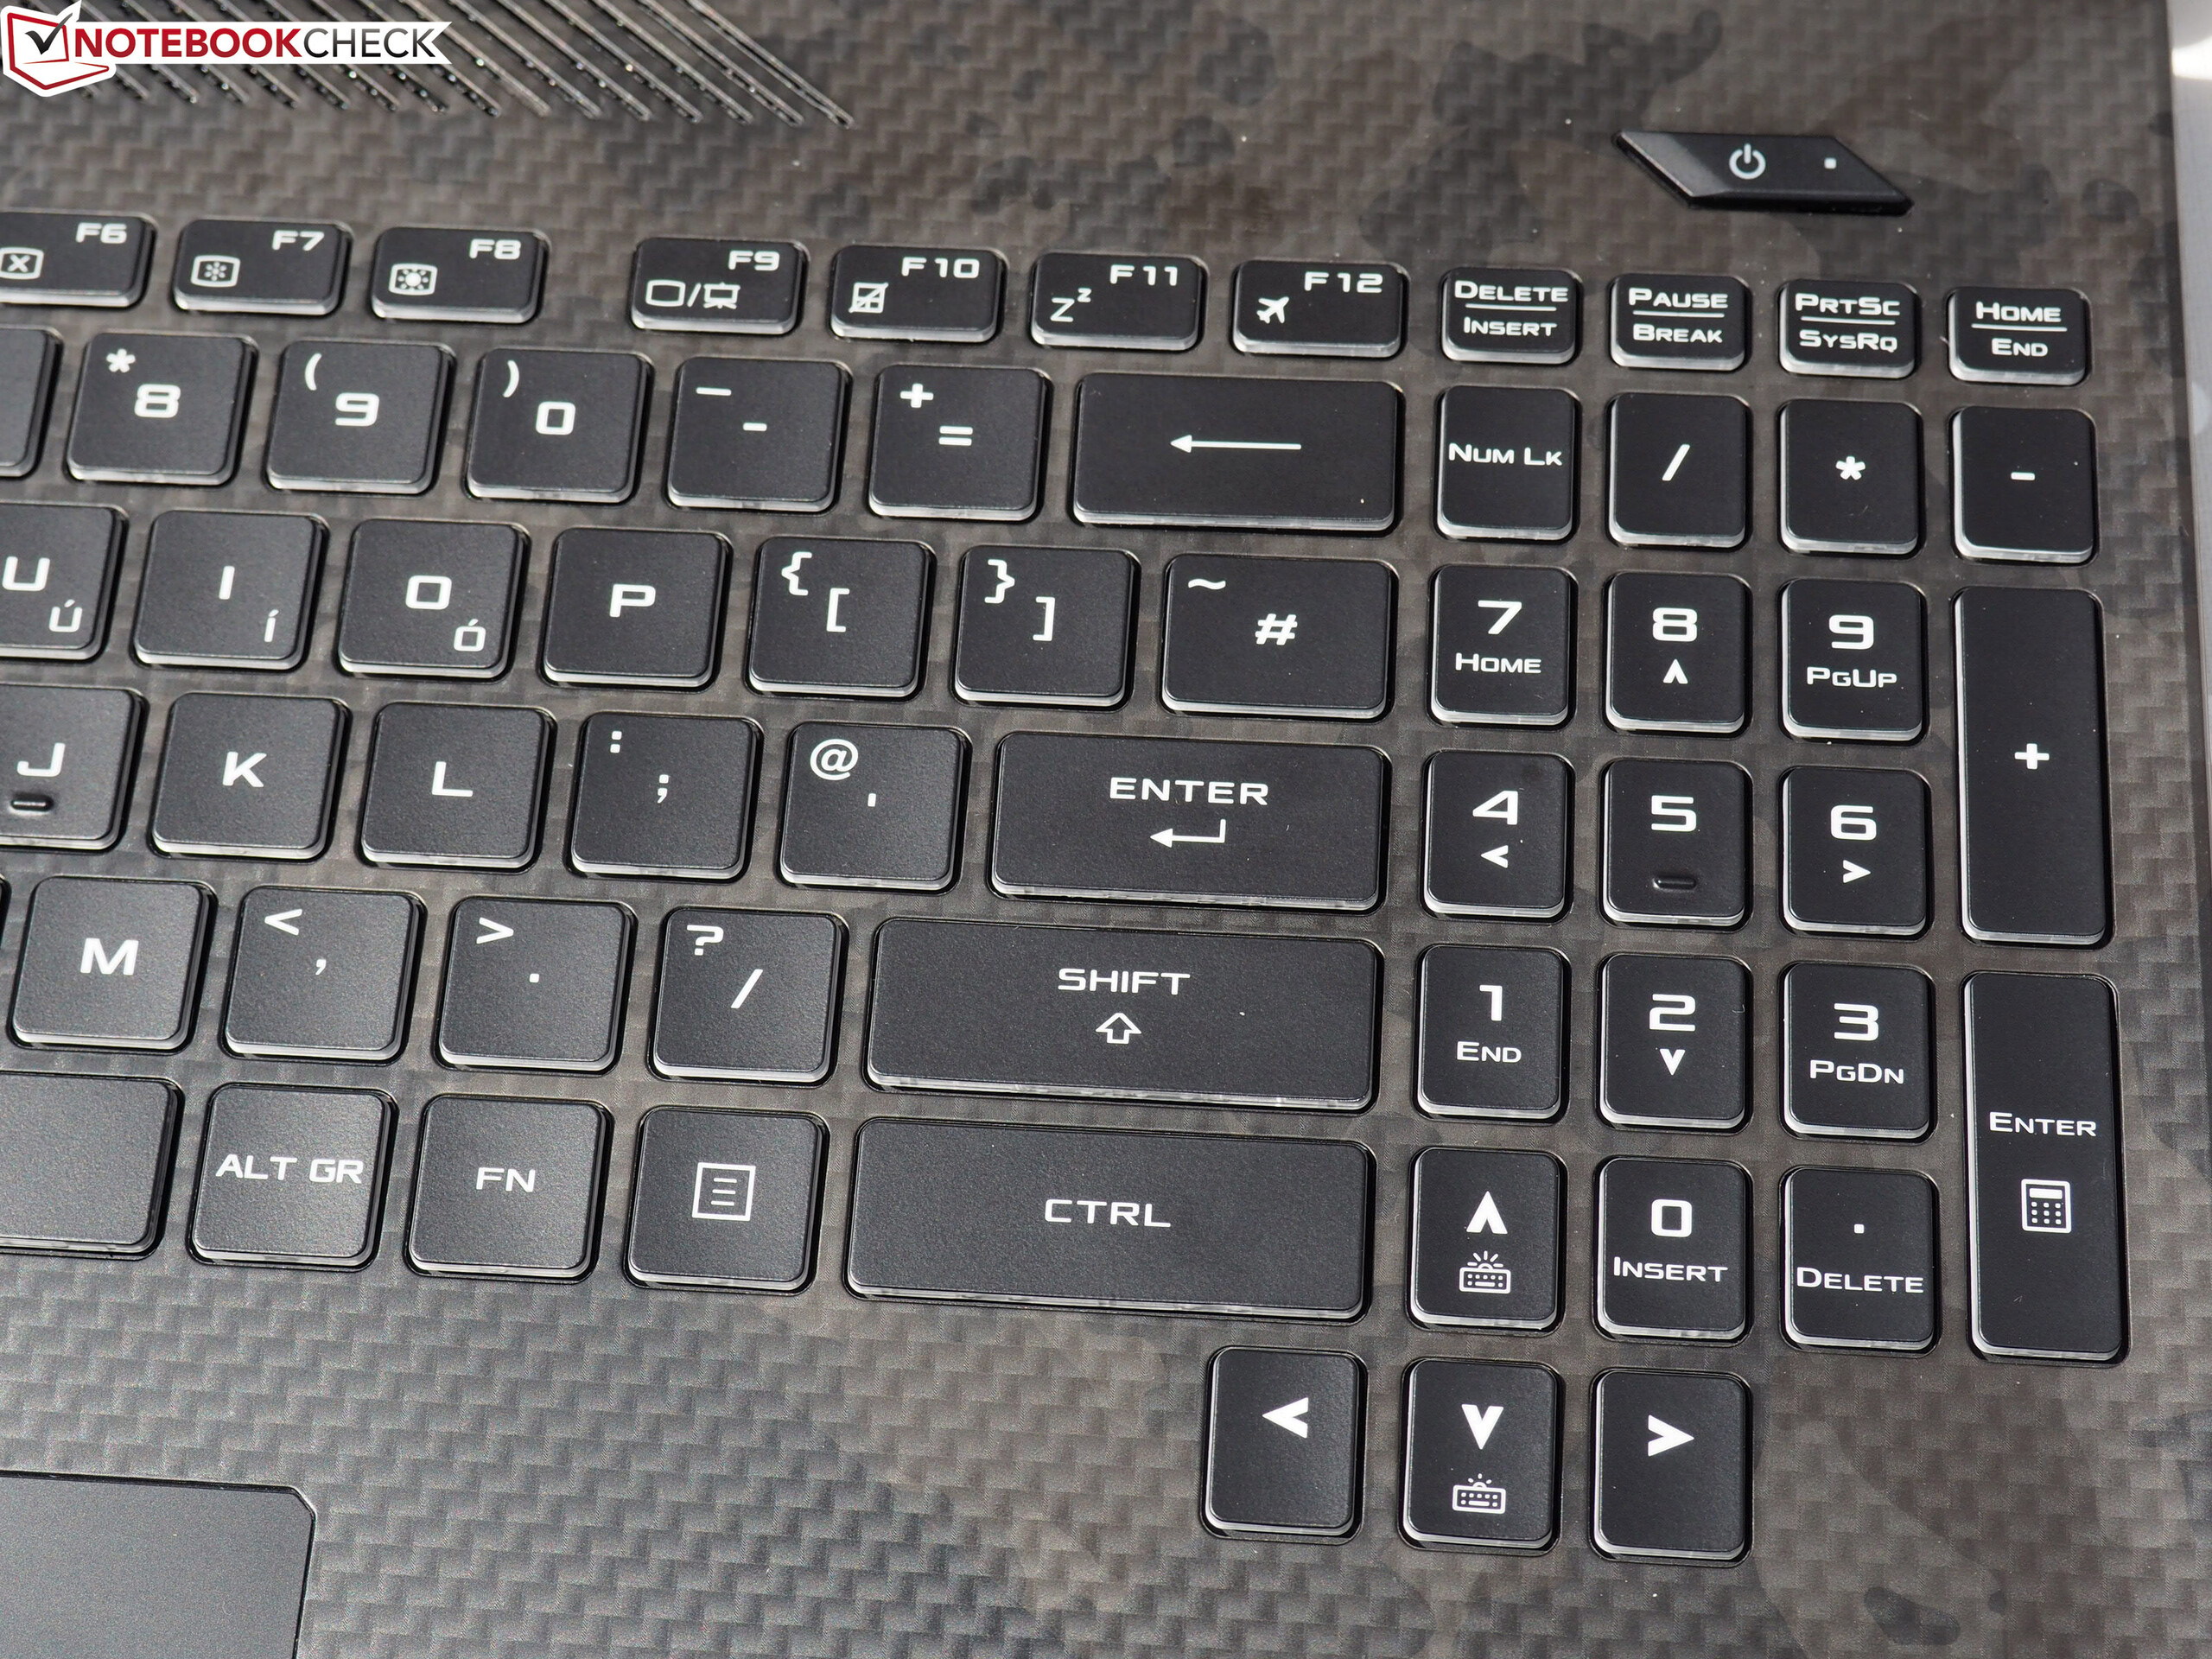
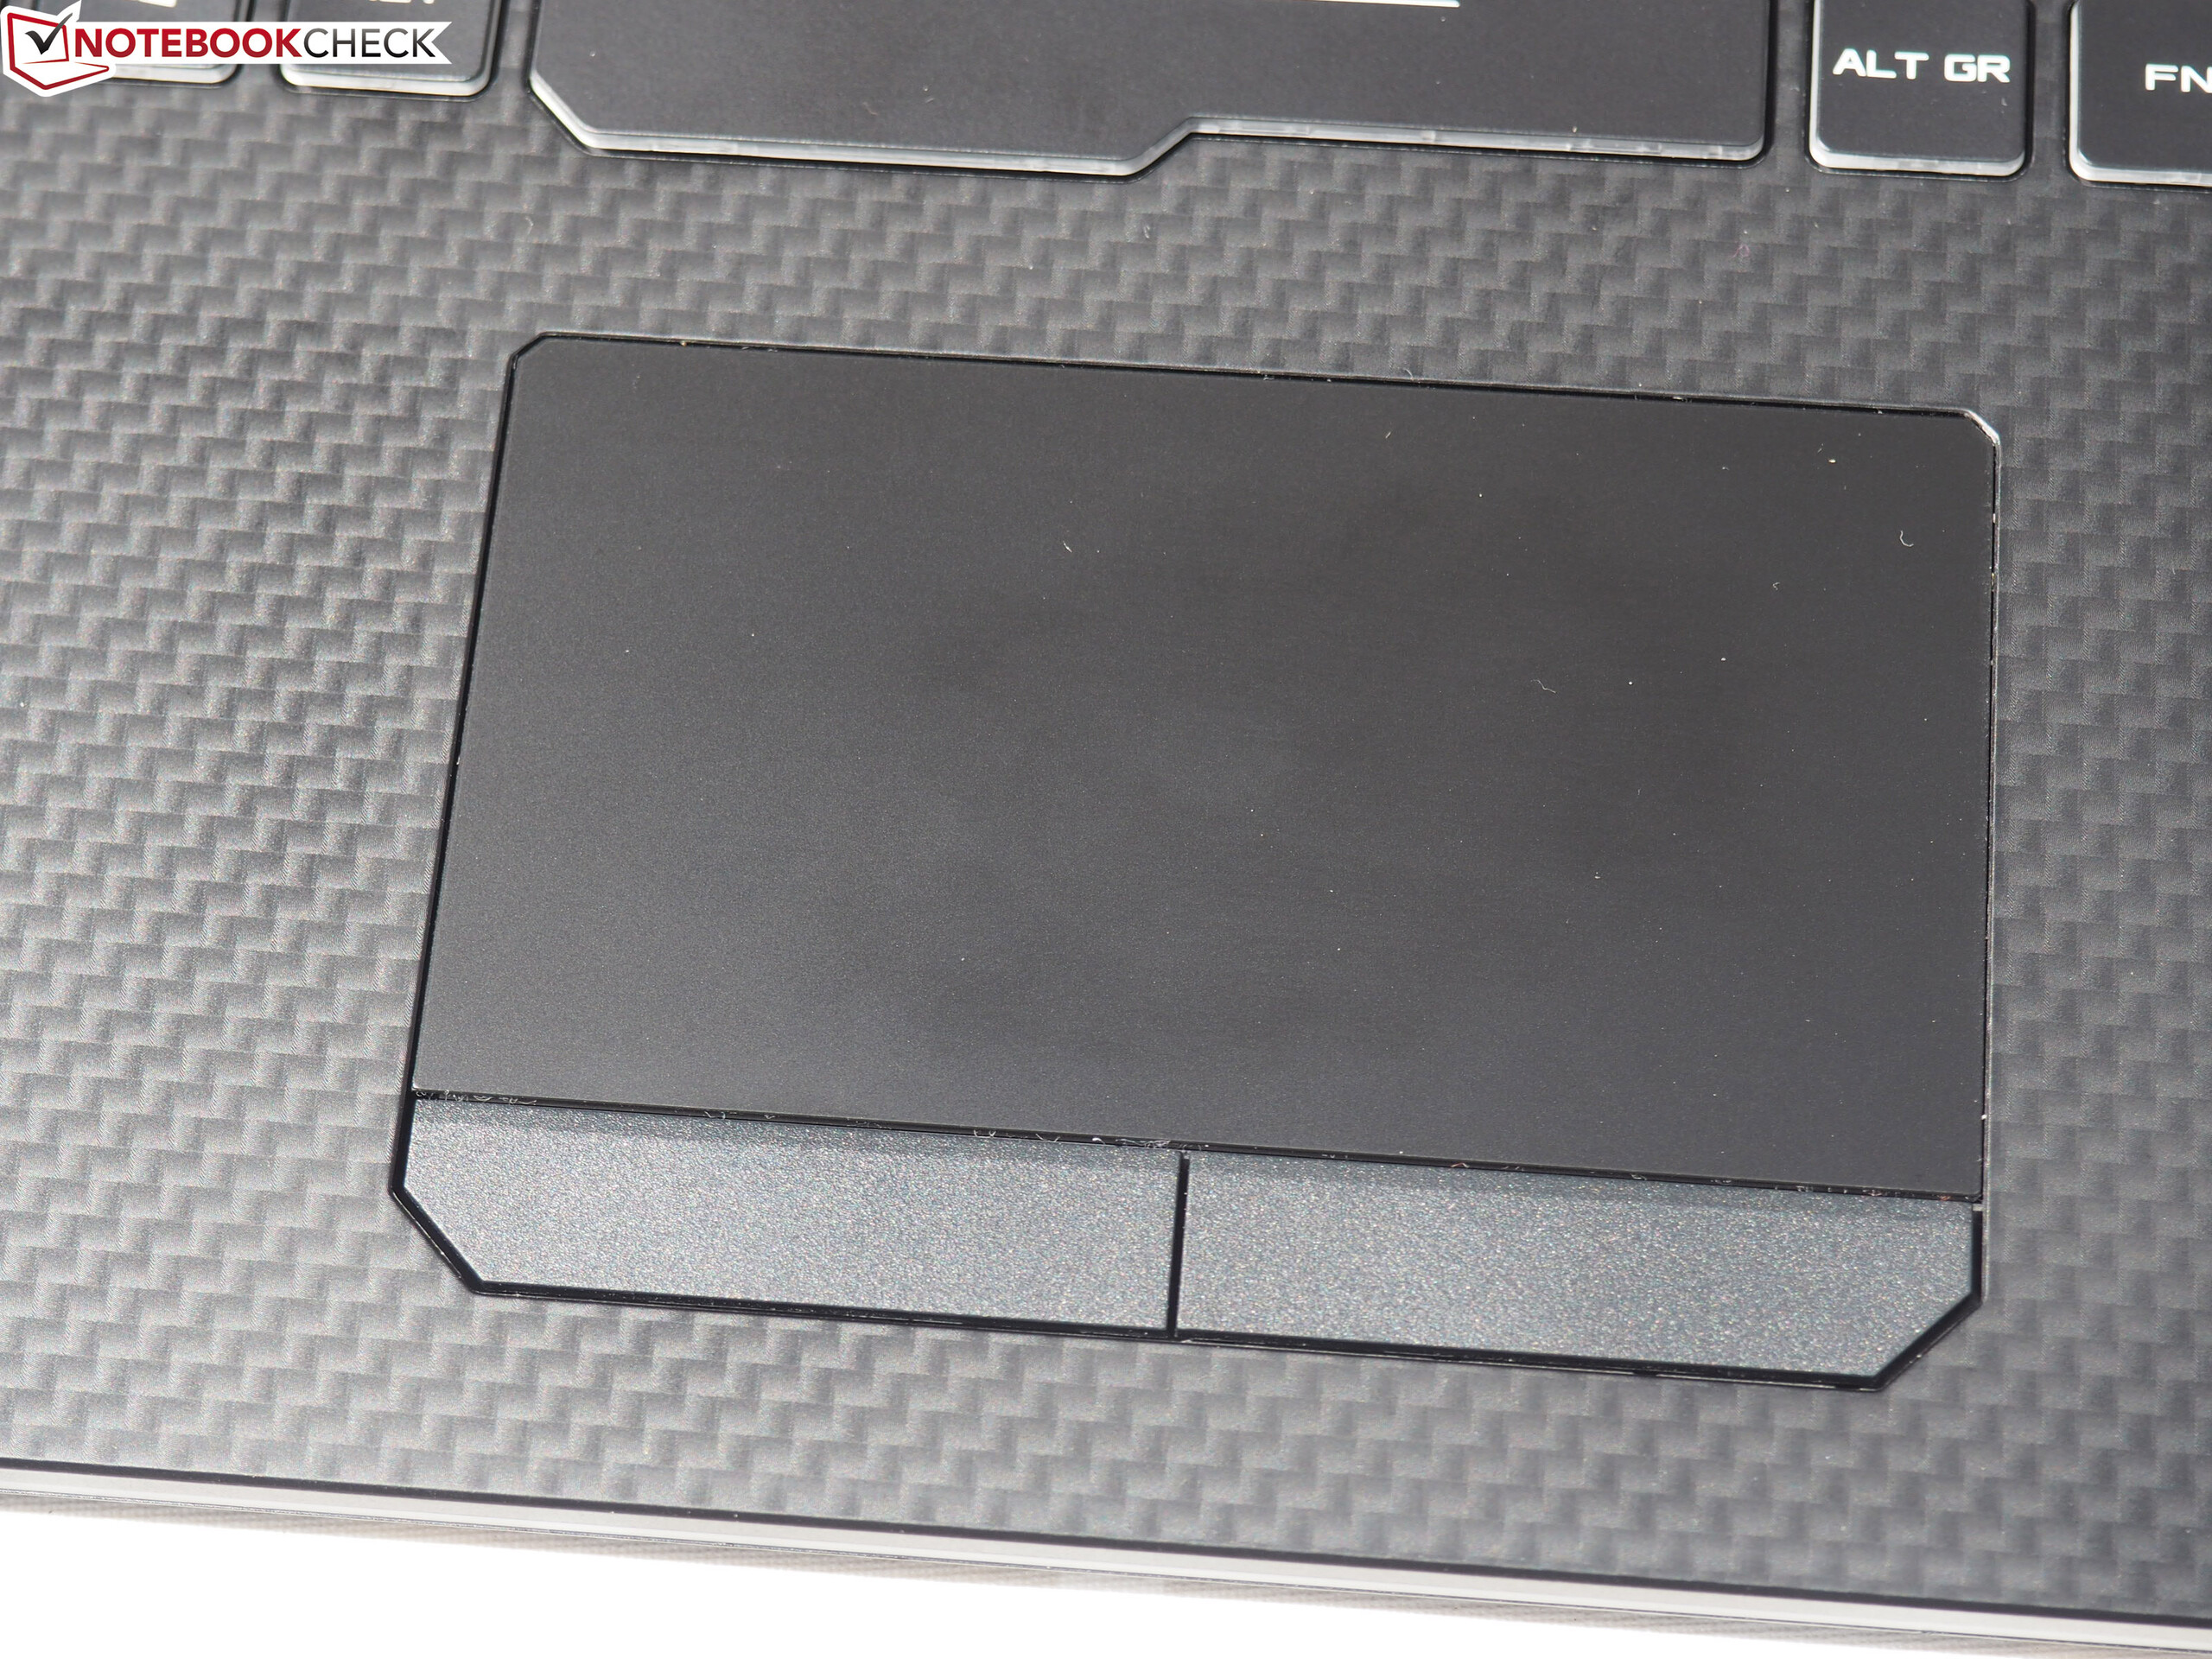
O dispositivos de15 polegadas deve sua alta porcentagem na avaliação não só à carcaça estilosa com a tela de 144-Hz, mas também a seus bons dispositivos de entrada e o som surpreendentemente alto dos alto-falantes.
Por outro lado, é questionável porque a Asus escolheu um GeForce GTX 1070 convencional, em vez da versão Max-Q. Embora o modelo padrão traga um pouco mais de potência, como resultado, as emissões, a altura da carcaça e o peso sofrem, ficando melhor com os concorrentes na maioria dos casos.
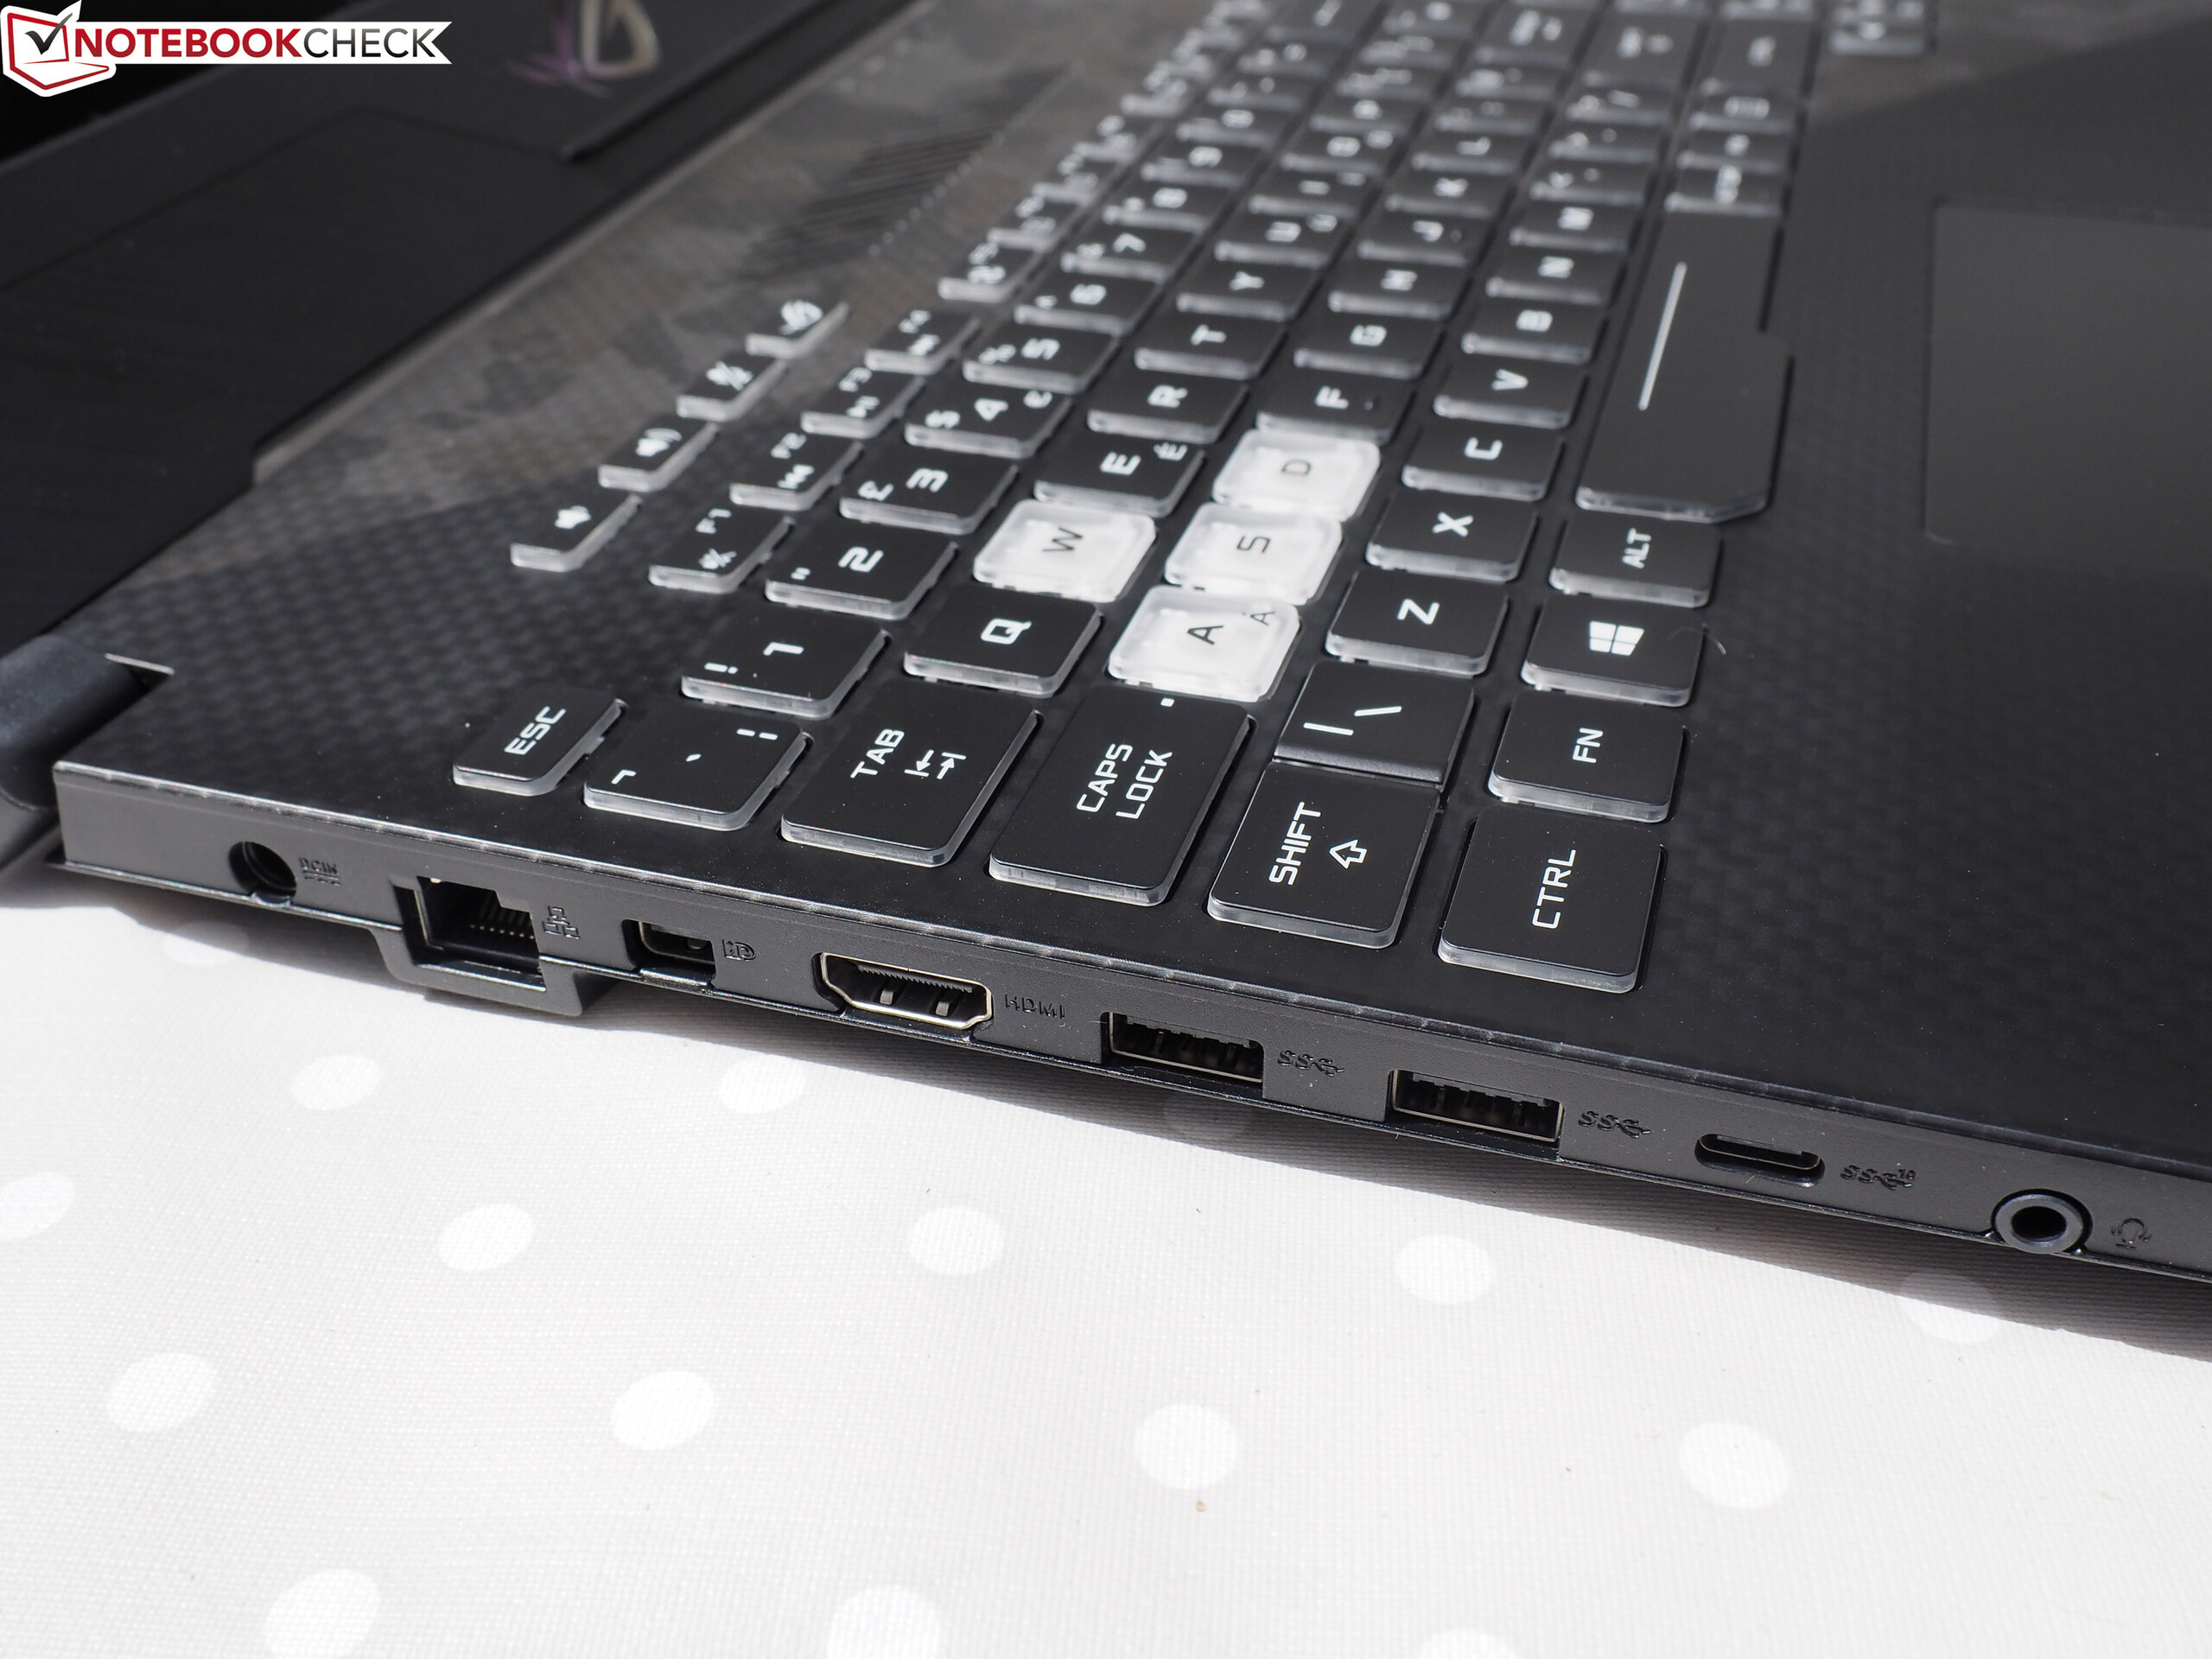
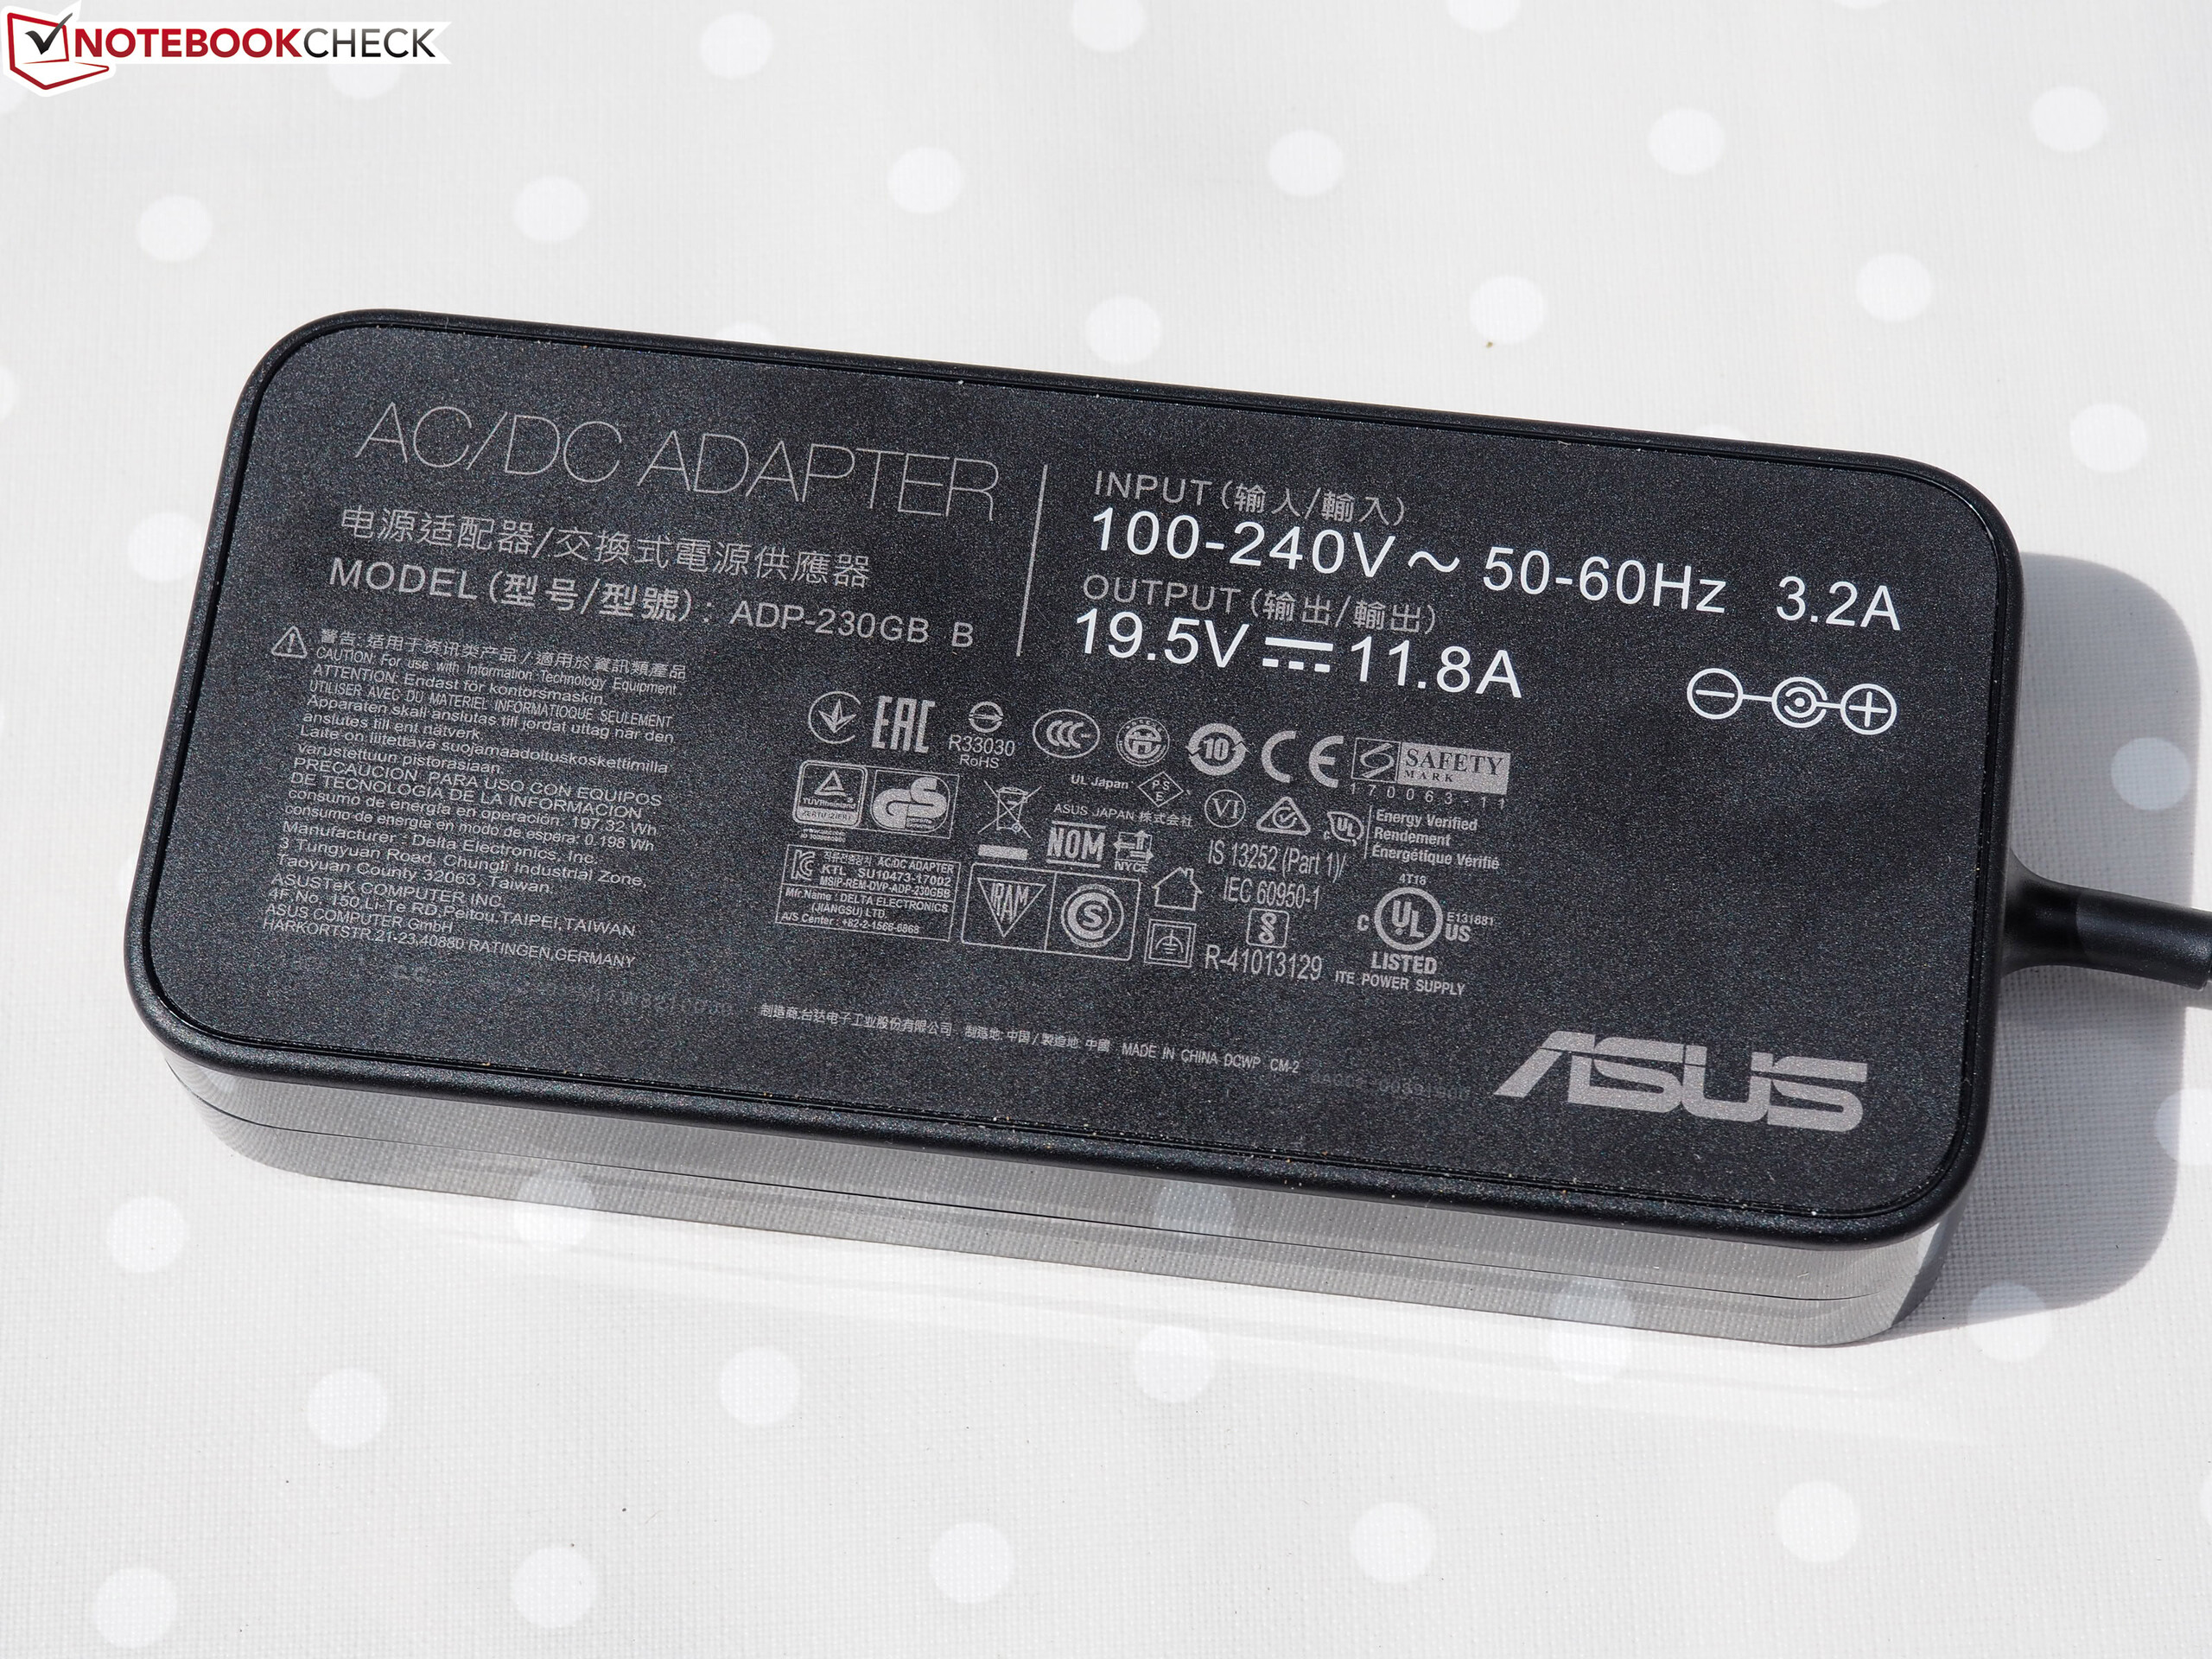
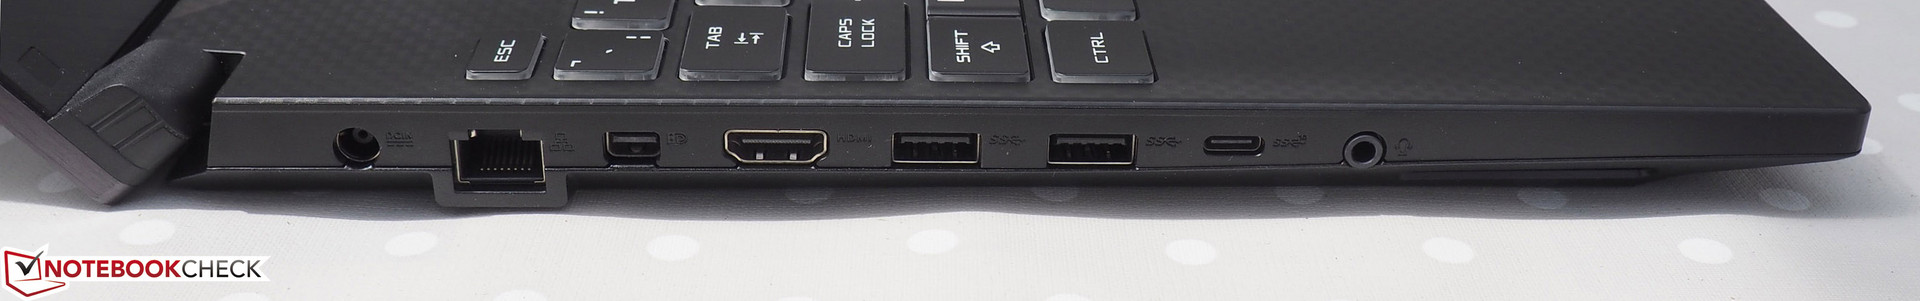
No entanto, na prática, a falta da comutação gráfica é ainda mais um problema. Sem a tecnologia Optimus, torna-se difícil considerar o GL504GS uma plataforma móvel de jogos, uma vez que os compradores estarão muito dependentes da fonte de alimentação (de acordo com a Asus, pelo menos o GL504GM com uma GTX 1060 supostamente suporta Optimus). O fabricante também poderia fazer algumas melhorias em termos de conexões. Em 2018, esperamos uma porta Thunderbolt 3 na faixa de preço acima de 1000 Euros (~$1139).
Apesar destes déficits, o dispositivo de 15 polegadas pode superar o MSI GS65 cuja carcaça mostra diversas fraquezas. E no final do dia, o Schenker XMG Neo 15 também perde contra ele.
Asus GL504GS
- 08/21/2018 v6 (old)
Florian Glaser
Price comparison