Breve Análise do Portátil Schenker XMG Neo 15 (i7-8750H, GTX 1060, Full HD)
| SD Card Reader | |
| average JPG Copy Test (av. of 3 runs) | |
| Gigabyte Aero 15X v8 (Toshiba Exceria Pro SDXC 64 GB UHS-II) | |
| Schenker Key 15 Coffee Lake (Toshiba Exceria Pro SDXC 64 GB UHS-II) | |
| Média da turma Gaming (20.9 - 210, n=54, últimos 2 anos) | |
| Schenker XMG Neo 15 (Toshiba Exceria Pro SDXC 64 GB UHS-II) | |
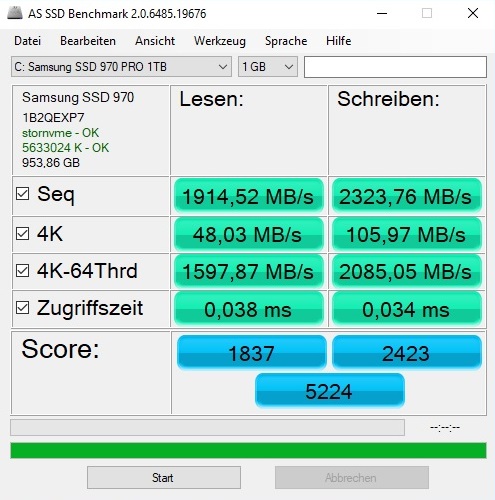
| maximum AS SSD Seq Read Test (1GB) | |
| Gigabyte Aero 15X v8 (Toshiba Exceria Pro SDXC 64 GB UHS-II) | |
| Schenker Key 15 Coffee Lake (Toshiba Exceria Pro SDXC 64 GB UHS-II) | |
| Média da turma Gaming (25.5 - 261, n=51, últimos 2 anos) | |
| Schenker XMG Neo 15 (Toshiba Exceria Pro SDXC 64 GB UHS-II) | |
| Networking | |
| iperf3 transmit AX12 | |
| Schenker Key 15 Coffee Lake | |
| Schenker XMG Neo 15 | |
| MSI GS65 8RF-019DE Stealth Thin | |
| Razer Blade 15 2018 | |
| Asus ROG GU501GM-BI7N8 | |
| Gigabyte Aero 15X v8 | |
| iperf3 receive AX12 | |
| Schenker XMG Neo 15 | |
| Schenker Key 15 Coffee Lake | |
| Gigabyte Aero 15X v8 | |
| Razer Blade 15 2018 | |
| Asus ROG GU501GM-BI7N8 | |
| MSI GS65 8RF-019DE Stealth Thin | |

| |||||||||||||||||||||||||
iluminação: 90 %
iluminação com acumulador: 325 cd/m²
Contraste: 985:1 (Preto: 0.33 cd/m²)
ΔE ColorChecker Calman: 2.69 | ∀{0.5-29.43 Ø4.71}
calibrated: 1.27
ΔE Greyscale Calman: 2.34 | ∀{0.09-98 Ø4.96}
94% sRGB (Argyll 1.6.3 3D)
60% AdobeRGB 1998 (Argyll 1.6.3 3D)
65.3% AdobeRGB 1998 (Argyll 3D)
94.1% sRGB (Argyll 3D)
64.3% Display P3 (Argyll 3D)
Gamma: 2.38
CCT: 6872 K
| Schenker XMG Neo 15 LGD05C0, IPS, 1920x1080 | Schenker Key 15 Coffee Lake LGD05C0, IPS, 1920x1080 | MSI GS65 8RF-019DE Stealth Thin AU Optronics B156HAN08.0 (AUO80ED), IPS, 1920x1080 | Gigabyte Aero 15X v8 LGD05C0, IPS, 1920x1080 | Razer Blade 15 2018 LGD05C0, IPS, 1920x1080 | Asus ROG GU501GM-BI7N8 AU Optronics AUO45ED, IPS, 1920x1080 | |
|---|---|---|---|---|---|---|
| Display | -1% | 1% | -1% | 0% | -4% | |
| Display P3 Coverage (%) | 64.3 | 63.4 -1% | 66.2 3% | 63.6 -1% | 64.3 0% | 63.4 -1% |
| sRGB Coverage (%) | 94.1 | 93.3 -1% | 92.1 -2% | 93.8 0% | 93.7 0% | 87.7 -7% |
| AdobeRGB 1998 Coverage (%) | 65.3 | 64.5 -1% | 67.2 3% | 64.9 -1% | 65.5 0% | |
| Response Times | -6% | -22% | -11% | -17% | -141% | |
| Response Time Grey 50% / Grey 80% * (ms) | 16 ? | 15.2 ? 5% | 17.6 ? -10% | 16.8 ? -5% | 17.2 ? -8% | 30.8 ? -93% |
| Response Time Black / White * (ms) | 9.6 ? | 11.2 ? -17% | 12.8 ? -33% | 11.2 ? -17% | 12 ? -25% | 27.6 ? -188% |
| PWM Frequency (Hz) | ||||||
| Screen | -5% | 1% | 16% | -6% | -18% | |
| Brightness middle (cd/m²) | 325 | 309 -5% | 254 -22% | 313 -4% | 290 -11% | 286.7 -12% |
| Brightness (cd/m²) | 303 | 291 -4% | 262 -14% | 300 -1% | 281 -7% | 281 -7% |
| Brightness Distribution (%) | 90 | 91 1% | 89 -1% | 78 -13% | 82 -9% | 92 2% |
| Black Level * (cd/m²) | 0.33 | 0.31 6% | 0.22 33% | 0.33 -0% | 0.3 9% | 0.39 -18% |
| Contrast (:1) | 985 | 997 1% | 1155 17% | 948 -4% | 967 -2% | 735 -25% |
| Colorchecker dE 2000 * | 2.69 | 2.96 -10% | 2.37 12% | 1.29 52% | 2.85 -6% | 4.17 -55% |
| Colorchecker dE 2000 max. * | 4.91 | 5.14 -5% | 4.71 4% | 2.04 58% | 6.27 -28% | 7.22 -47% |
| Colorchecker dE 2000 calibrated * | 1.27 | 1.41 -11% | 1.84 -45% | 1.39 -9% | ||
| Greyscale dE 2000 * | 2.34 | 2.88 -23% | 1.58 32% | 0.69 71% | 2.4 -3% | 2.5 -7% |
| Gamma | 2.38 92% | 2.33 94% | 2.48 89% | 2.43 91% | 2.34 94% | 2.274 97% |
| CCT | 6872 95% | 6725 97% | 6785 96% | 6550 99% | 6718 97% | 6885 94% |
| Color Space (Percent of AdobeRGB 1998) (%) | 60 | 60 0% | 60 0% | 60 0% | 60 0% | 57 -5% |
| Color Space (Percent of sRGB) (%) | 94 | 93 -1% | 92 -2% | 94 0% | 94 0% | 87 -7% |
| Média Total (Programa/Configurações) | -4% /
-4% | -7% /
-2% | 1% /
9% | -8% /
-6% | -54% /
-34% |
* ... menor é melhor
Exibir tempos de resposta
| ↔ Tempo de resposta preto para branco | ||
|---|---|---|
| 9.6 ms ... ascensão ↗ e queda ↘ combinadas | ↗ 5.2 ms ascensão | 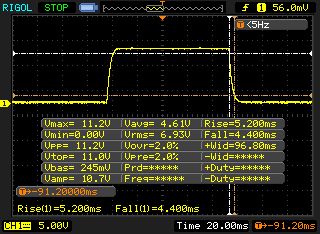 |
| ↘ 4.4 ms queda | ||
| A tela mostra taxas de resposta rápidas em nossos testes e deve ser adequada para jogos. Em comparação, todos os dispositivos testados variam de 0.1 (mínimo) a 240 (máximo) ms. » 26 % de todos os dispositivos são melhores. Isso significa que o tempo de resposta medido é melhor que a média de todos os dispositivos testados (19.8 ms). | ||
| ↔ Tempo de resposta 50% cinza a 80% cinza | ||
| 16 ms ... ascensão ↗ e queda ↘ combinadas | ↗ 8.4 ms ascensão | 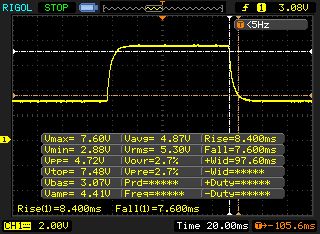 |
| ↘ 7.6 ms queda | ||
| A tela mostra boas taxas de resposta em nossos testes, mas pode ser muito lenta para jogadores competitivos. Em comparação, todos os dispositivos testados variam de 0.165 (mínimo) a 636 (máximo) ms. » 30 % de todos os dispositivos são melhores. Isso significa que o tempo de resposta medido é melhor que a média de todos os dispositivos testados (31 ms). | ||
Cintilação da tela / PWM (modulação por largura de pulso)
| Tela tremeluzindo / PWM não detectado | 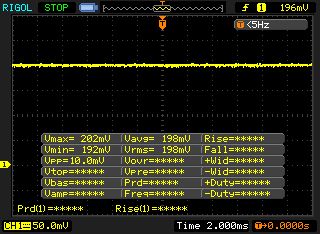 | ||
[pwm_comparison] Em comparação: 52 % de todos os dispositivos testados não usam PWM para escurecer a tela. Se PWM foi detectado, uma média de 7754 (mínimo: 5 - máximo: 343500) Hz foi medida. | |||
| Cinebench R15 | |
| CPU Single 64Bit | |
| Média da turma Gaming (188.8 - 350, n=106, últimos 2 anos) | |
| Gigabyte Aero 15X v8 | |
| MSI GS65 8RF-019DE Stealth Thin | |
| Schenker Key 15 Coffee Lake | |
| Razer Blade 15 2018 | |
| Schenker XMG Neo 15 | |
| Asus ROG GU501GM-BI7N8 | |
| CPU Multi 64Bit | |
| Média da turma Gaming (1578 - 6330, n=105, últimos 2 anos) | |
| Asus ROG GU501GM-BI7N8 | |
| Schenker XMG Neo 15 | |
| Gigabyte Aero 15X v8 | |
| Schenker Key 15 Coffee Lake | |
| MSI GS65 8RF-019DE Stealth Thin | |
| Razer Blade 15 2018 | |
| Cinebench R11.5 | |
| CPU Single 64Bit | |
| Média da turma Gaming (3.3 - 4.16, n=9, últimos 2 anos) | |
| MSI GS65 8RF-019DE Stealth Thin | |
| Schenker Key 15 Coffee Lake | |
| Gigabyte Aero 15X v8 | |
| Schenker XMG Neo 15 | |
| Razer Blade 15 2018 | |
| Asus ROG GU501GM-BI7N8 | |
| CPU Multi 64Bit | |
| Média da turma Gaming (29.8 - 76.7, n=9, últimos 2 anos) | |
| Gigabyte Aero 15X v8 | |
| Schenker XMG Neo 15 | |
| Asus ROG GU501GM-BI7N8 | |
| Schenker Key 15 Coffee Lake | |
| MSI GS65 8RF-019DE Stealth Thin | |
| Razer Blade 15 2018 | |
| PCMark 10 - Score | |
| Média da turma Gaming (5828 - 12414, n=93, últimos 2 anos) | |
| Schenker Key 15 Coffee Lake | |
| Schenker XMG Neo 15 | |
| MSI GS65 8RF-019DE Stealth Thin | |
| Asus ROG GU501GM-BI7N8 | |
| Gigabyte Aero 15X v8 | |
| Razer Blade 15 2018 | |
| PCMark 8 | |
| Home Score Accelerated v2 | |
| Média da turma Gaming (n=1últimos 2 anos) | |
| MSI GS65 8RF-019DE Stealth Thin | |
| Razer Blade 15 2018 | |
| Schenker XMG Neo 15 | |
| Schenker Key 15 Coffee Lake | |
| Gigabyte Aero 15X v8 | |
| Asus ROG GU501GM-BI7N8 | |
| Work Score Accelerated v2 | |
| Schenker Key 15 Coffee Lake | |
| Gigabyte Aero 15X v8 | |
| Schenker XMG Neo 15 | |
| Razer Blade 15 2018 | |
| MSI GS65 8RF-019DE Stealth Thin | |
| Asus ROG GU501GM-BI7N8 | |
| Média da turma Gaming (n=1últimos 2 anos) | |
| PCMark 8 Home Score Accelerated v2 | 4585 pontos | |
| PCMark 8 Work Score Accelerated v2 | 5669 pontos | |
| PCMark 10 Score | 5191 pontos | |
Ajuda | ||
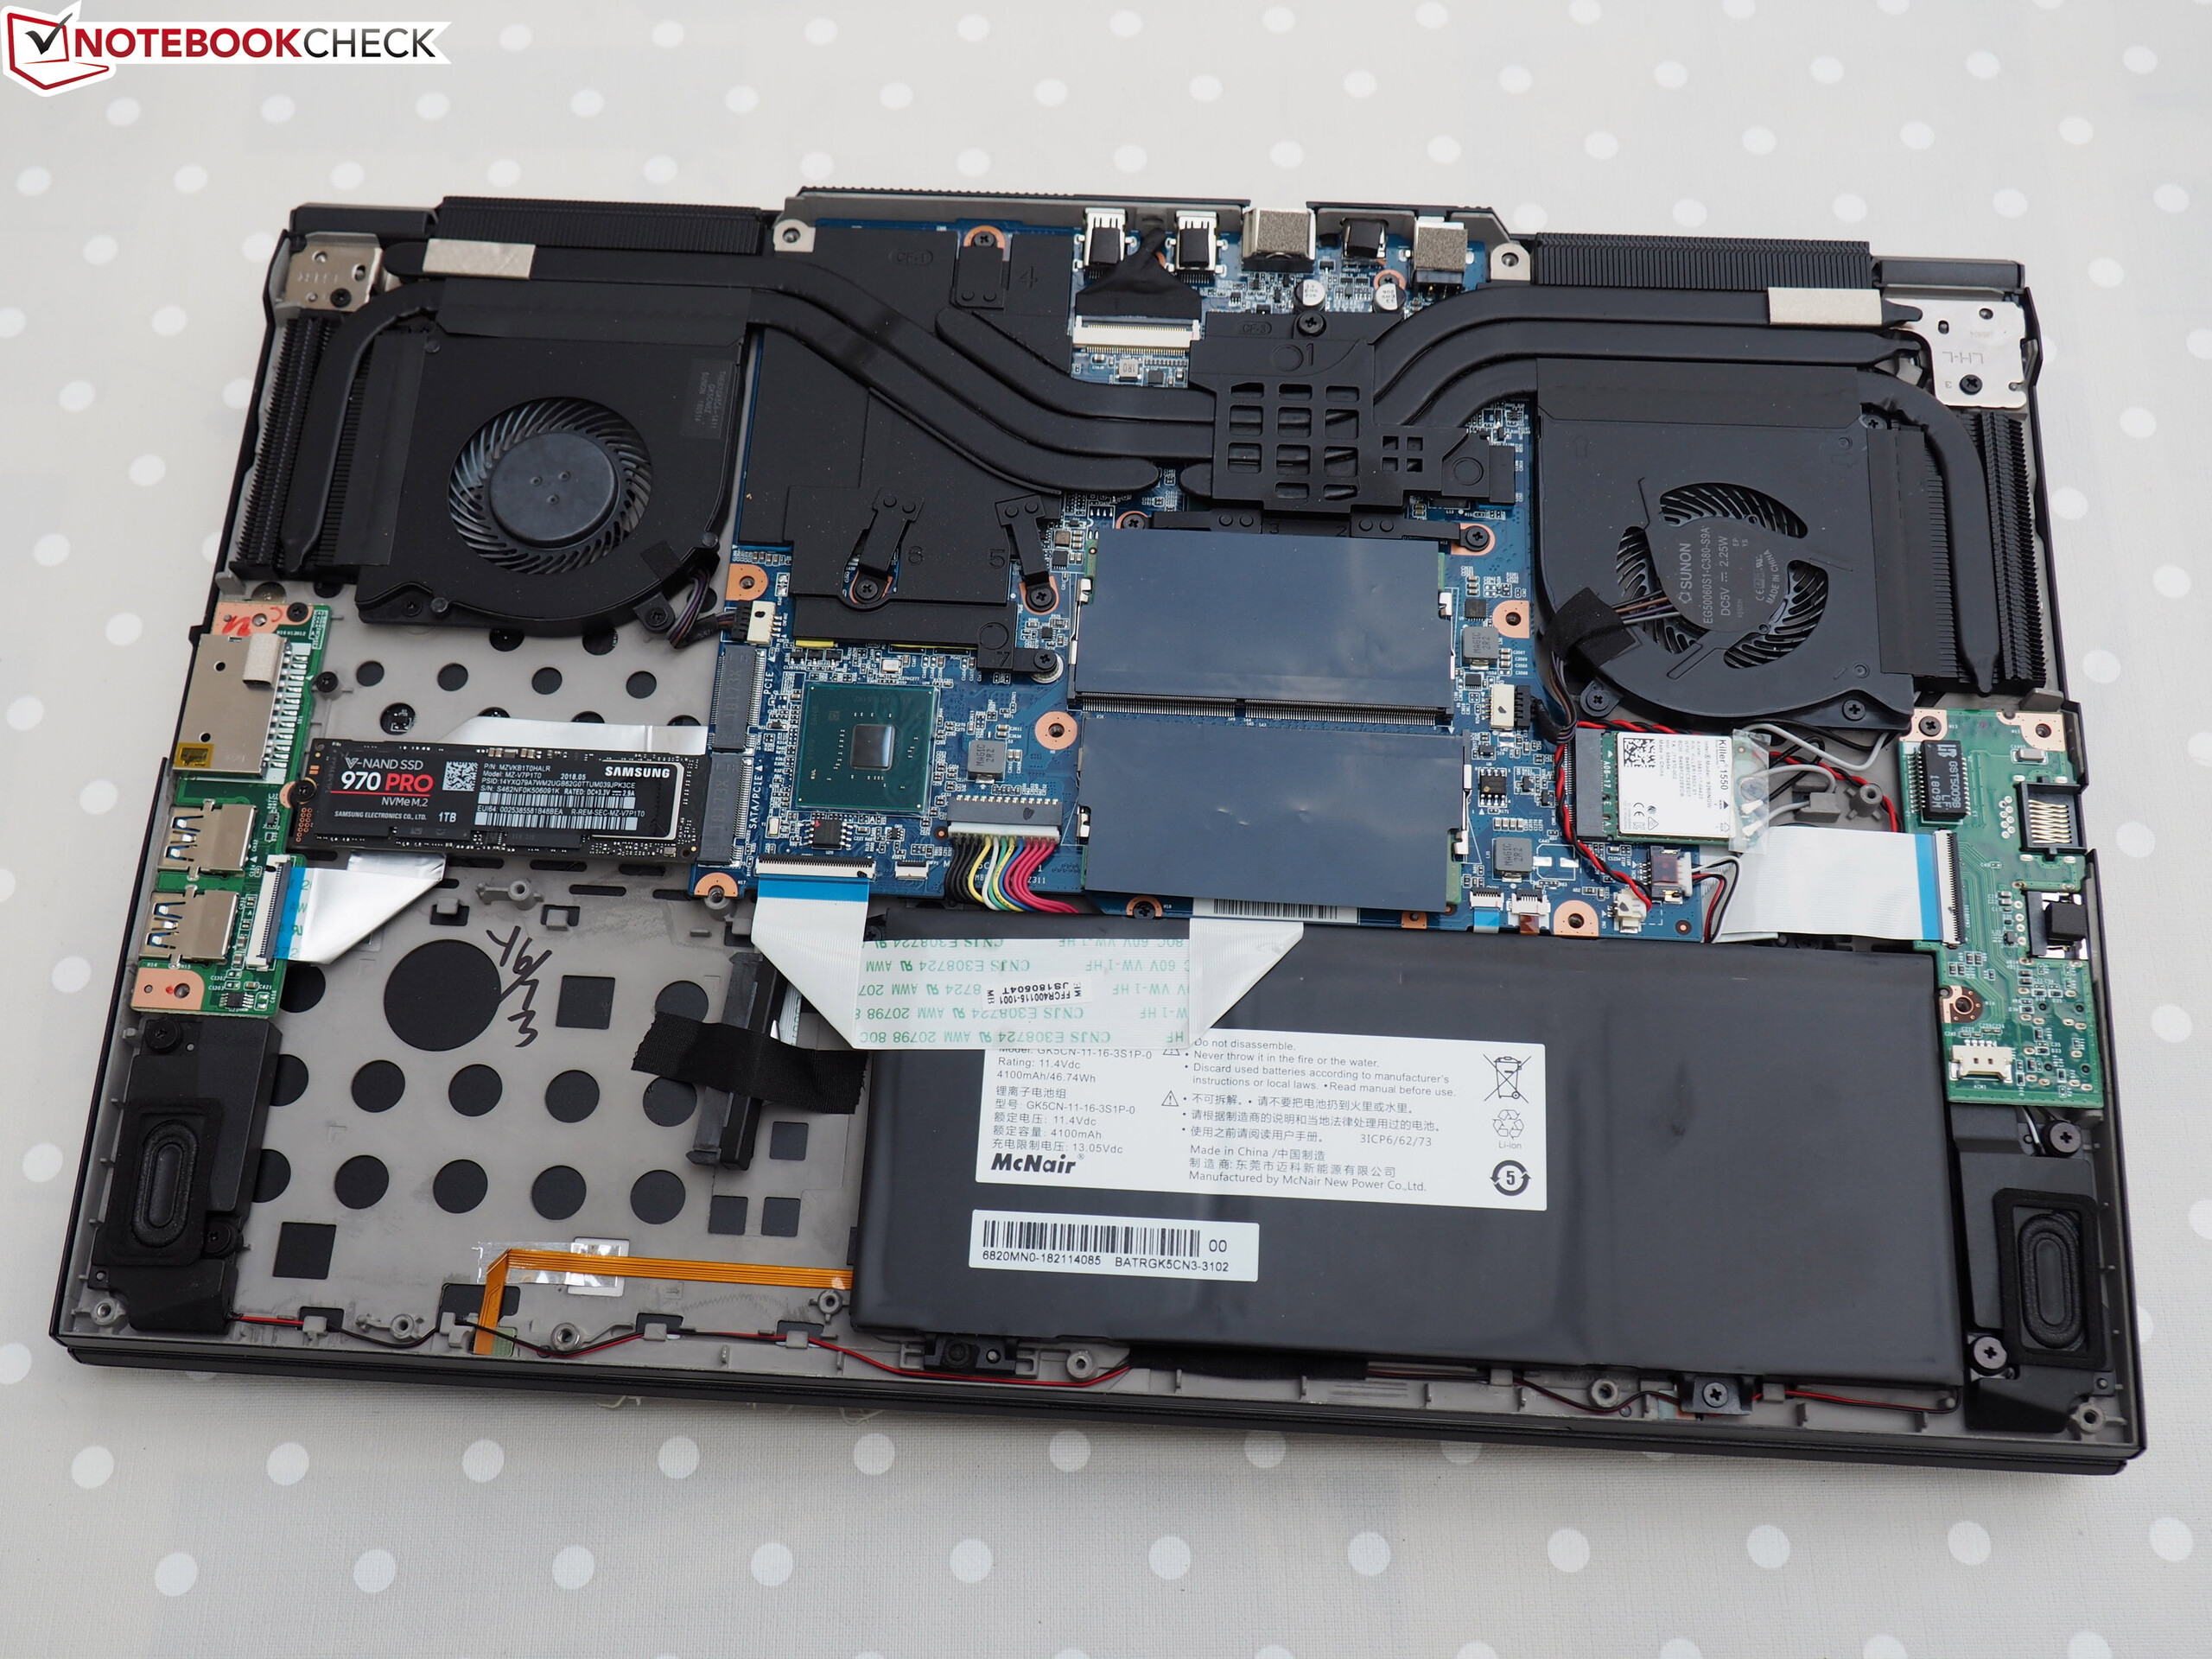
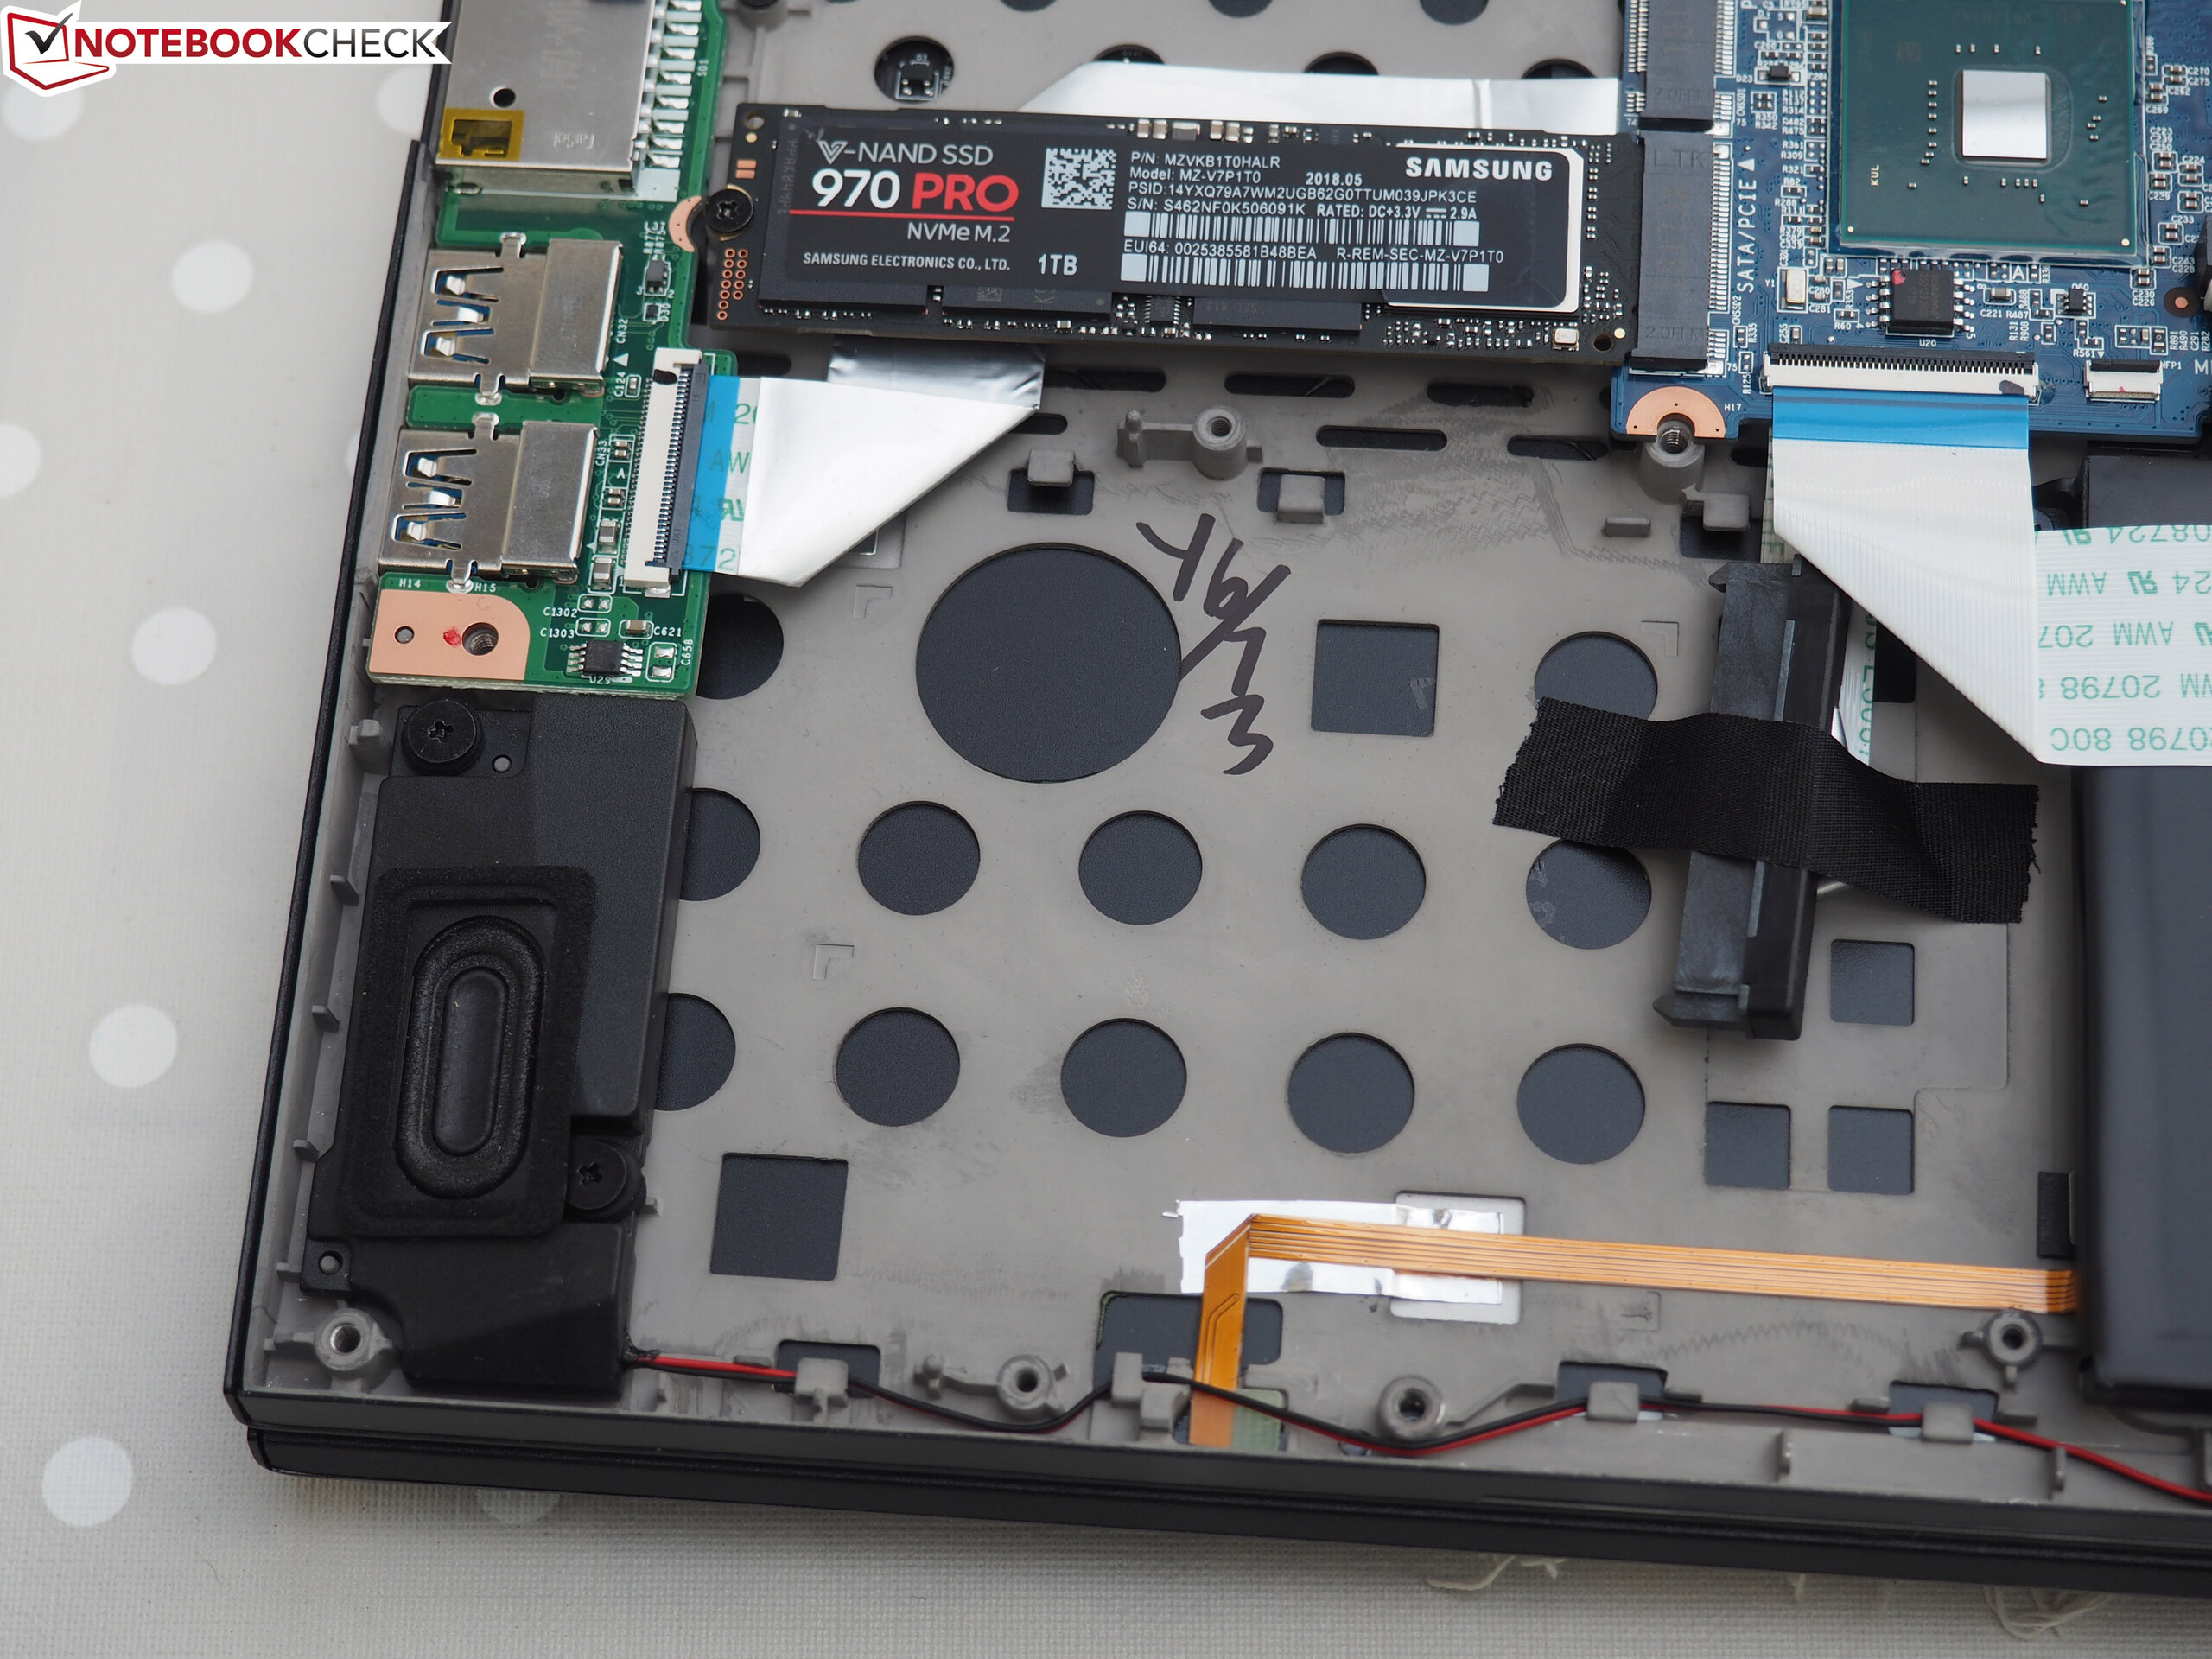
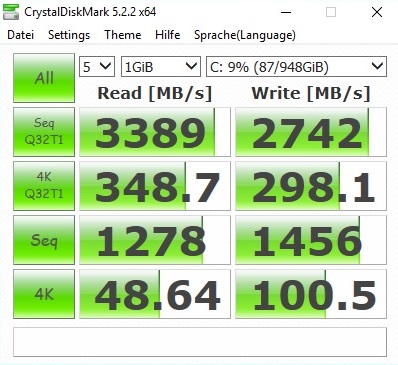
| Schenker XMG Neo 15 Samsung SSD 970 Pro 1TB | Schenker Key 15 Coffee Lake Samsung SSD 970 EVO 500GB | MSI GS65 8RF-019DE Stealth Thin Samsung SSD PM981 MZVLB512HAJQ | Gigabyte Aero 15X v8 Toshiba NVMe THNSN5512GPU7 | Razer Blade 15 2018 Samsung PM961 NVMe MZVLW512HMJP | Asus ROG GU501GM-BI7N8 Kingston RBUSNS8154P3128GJ | |
|---|---|---|---|---|---|---|
| CrystalDiskMark 5.2 / 6 | 0% | -5% | -14% | -8% | -40% | |
| Read Seq Q32T1 (MB/s) | 3389 | 3549 5% | 2466 -27% | 2627 -22% | 3280 -3% | 1498 -56% |
| Write Seq Q32T1 (MB/s) | 2742 | 2498 -9% | 1919 -30% | 1375 -50% | 1527 -44% | 471.5 -83% |
| Read 4K Q32T1 (MB/s) | 348.7 | 376.8 8% | 353.7 1% | 332.8 -5% | 342.5 -2% | 342.2 -2% |
| Write 4K Q32T1 (MB/s) | 298.1 | 295.4 -1% | 309.9 4% | 268.6 -10% | 296.2 -1% | 264.8 -11% |
| Read Seq (MB/s) | 1278 | 1200 -6% | 1322 3% | 1404 10% | 1371 7% | 707 -45% |
| Write Seq (MB/s) | 1456 | 1466 1% | 1883 29% | 1335 -8% | 1483 2% | 469.5 -68% |
| Read 4K (MB/s) | 48.64 | 43.49 -11% | 40.13 -17% | 37.65 -23% | 39.23 -19% | 32.8 -33% |
| Write 4K (MB/s) | 100.5 | 113.5 13% | 95.3 -5% | 94.4 -6% | 94.2 -6% | 75.6 -25% |

| 3DMark - 1920x1080 Fire Strike Graphics | |
| Média da turma Gaming (12242 - 62849, n=115, últimos 2 anos) | |
| Razer Blade 15 2018 | |
| Gigabyte Aero 15X v8 | |
| MSI GS65 8RF-019DE Stealth Thin | |
| Schenker Key 15 Coffee Lake | |
| Asus ROG GU501GM-BI7N8 | |
| Schenker XMG Neo 15 | |
| 3DMark 11 - 1280x720 Performance GPU | |
| Média da turma Gaming (21841 - 80022, n=104, últimos 2 anos) | |
| Razer Blade 15 2018 | |
| Gigabyte Aero 15X v8 | |
| MSI GS65 8RF-019DE Stealth Thin | |
| Schenker Key 15 Coffee Lake | |
| Asus ROG GU501GM-BI7N8 | |
| Schenker XMG Neo 15 | |
| 3DMark 11 Performance | 13509 pontos | |
| 3DMark Cloud Gate Standard Score | 32771 pontos | |
| 3DMark Fire Strike Score | 10263 pontos | |
Ajuda | ||
| The Witcher 3 - 1920x1080 Ultra Graphics & Postprocessing (HBAO+) | |
| Média da turma Gaming (104.7 - 240, n=7, últimos 2 anos) | |
| Razer Blade 15 2018 | |
| MSI GS65 8RF-019DE Stealth Thin | |
| Gigabyte Aero 15X v8 | |
| Schenker Key 15 Coffee Lake | |
| Schenker Key 15 Coffee Lake | |
| Asus ROG GU501GM-BI7N8 | |
| Schenker XMG Neo 15 | |
| baixo | média | alto | ultra | |
|---|---|---|---|---|
| The Witcher 3 (2015) | 71.7 | 38.6 | ||
| Fortnite (2018) | 110 | 84.4 | ||
| Final Fantasy XV Benchmark (2018) | 42 | |||
| Kingdom Come: Deliverance (2018) | 57.1 | 43 | ||
| Far Cry 5 (2018) | 68 | 64 | ||
| The Crew 2 (2018) | 60 | 59.9 |
Barulho
| Ocioso |
| 29 / 35 / 40 dB |
| Carga |
| 50 / 58 dB |
 | ||
30 dB silencioso 40 dB(A) audível 50 dB(A) ruidosamente alto |
||
min: | ||
| Schenker XMG Neo 15 GeForce GTX 1060 Mobile, i7-8750H | Schenker Key 15 Coffee Lake GeForce GTX 1070 Max-Q, i7-8750H | MSI GS65 8RF-019DE Stealth Thin GeForce GTX 1070 Max-Q, i7-8750H | Gigabyte Aero 15X v8 GeForce GTX 1070 Max-Q, i7-8750H | Razer Blade 15 2018 GeForce GTX 1070 Max-Q, i7-8750H | Asus ROG GU501GM-BI7N8 GeForce GTX 1060 Mobile, i7-8750H | Média da turma Gaming | |
|---|---|---|---|---|---|---|---|
| Noise | 3% | 11% | 5% | 8% | 7% | 16% | |
| desligado / ambiente * (dB) | 29 | 30 -3% | 30 -3% | 29 -0% | 29 -0% | 28.6 1% | 24.1 ? 17% |
| Idle Minimum * (dB) | 29 | 31 -7% | 30 -3% | 30 -3% | 29 -0% | 31.4 -8% | 26 ? 10% |
| Idle Average * (dB) | 35 | 37 -6% | 31 11% | 31 11% | 30 14% | 31.4 10% | 27.4 ? 22% |
| Idle Maximum * (dB) | 40 | 43 -8% | 34 15% | 35 12% | 38 5% | 34.2 14% | 30.1 ? 25% |
| Load Average * (dB) | 50 | 45 10% | 43 14% | 49 2% | 46 8% | 42.8 14% | 43.6 ? 13% |
| Witcher 3 ultra * (dB) | 53 | 46 13% | 42 21% | 51 4% | 49 8% | 50.9 4% | |
| Load Maximum * (dB) | 58 | 46 21% | 44 24% | 54 7% | 46 21% | 50.9 12% | 54.2 ? 7% |
* ... menor é melhor
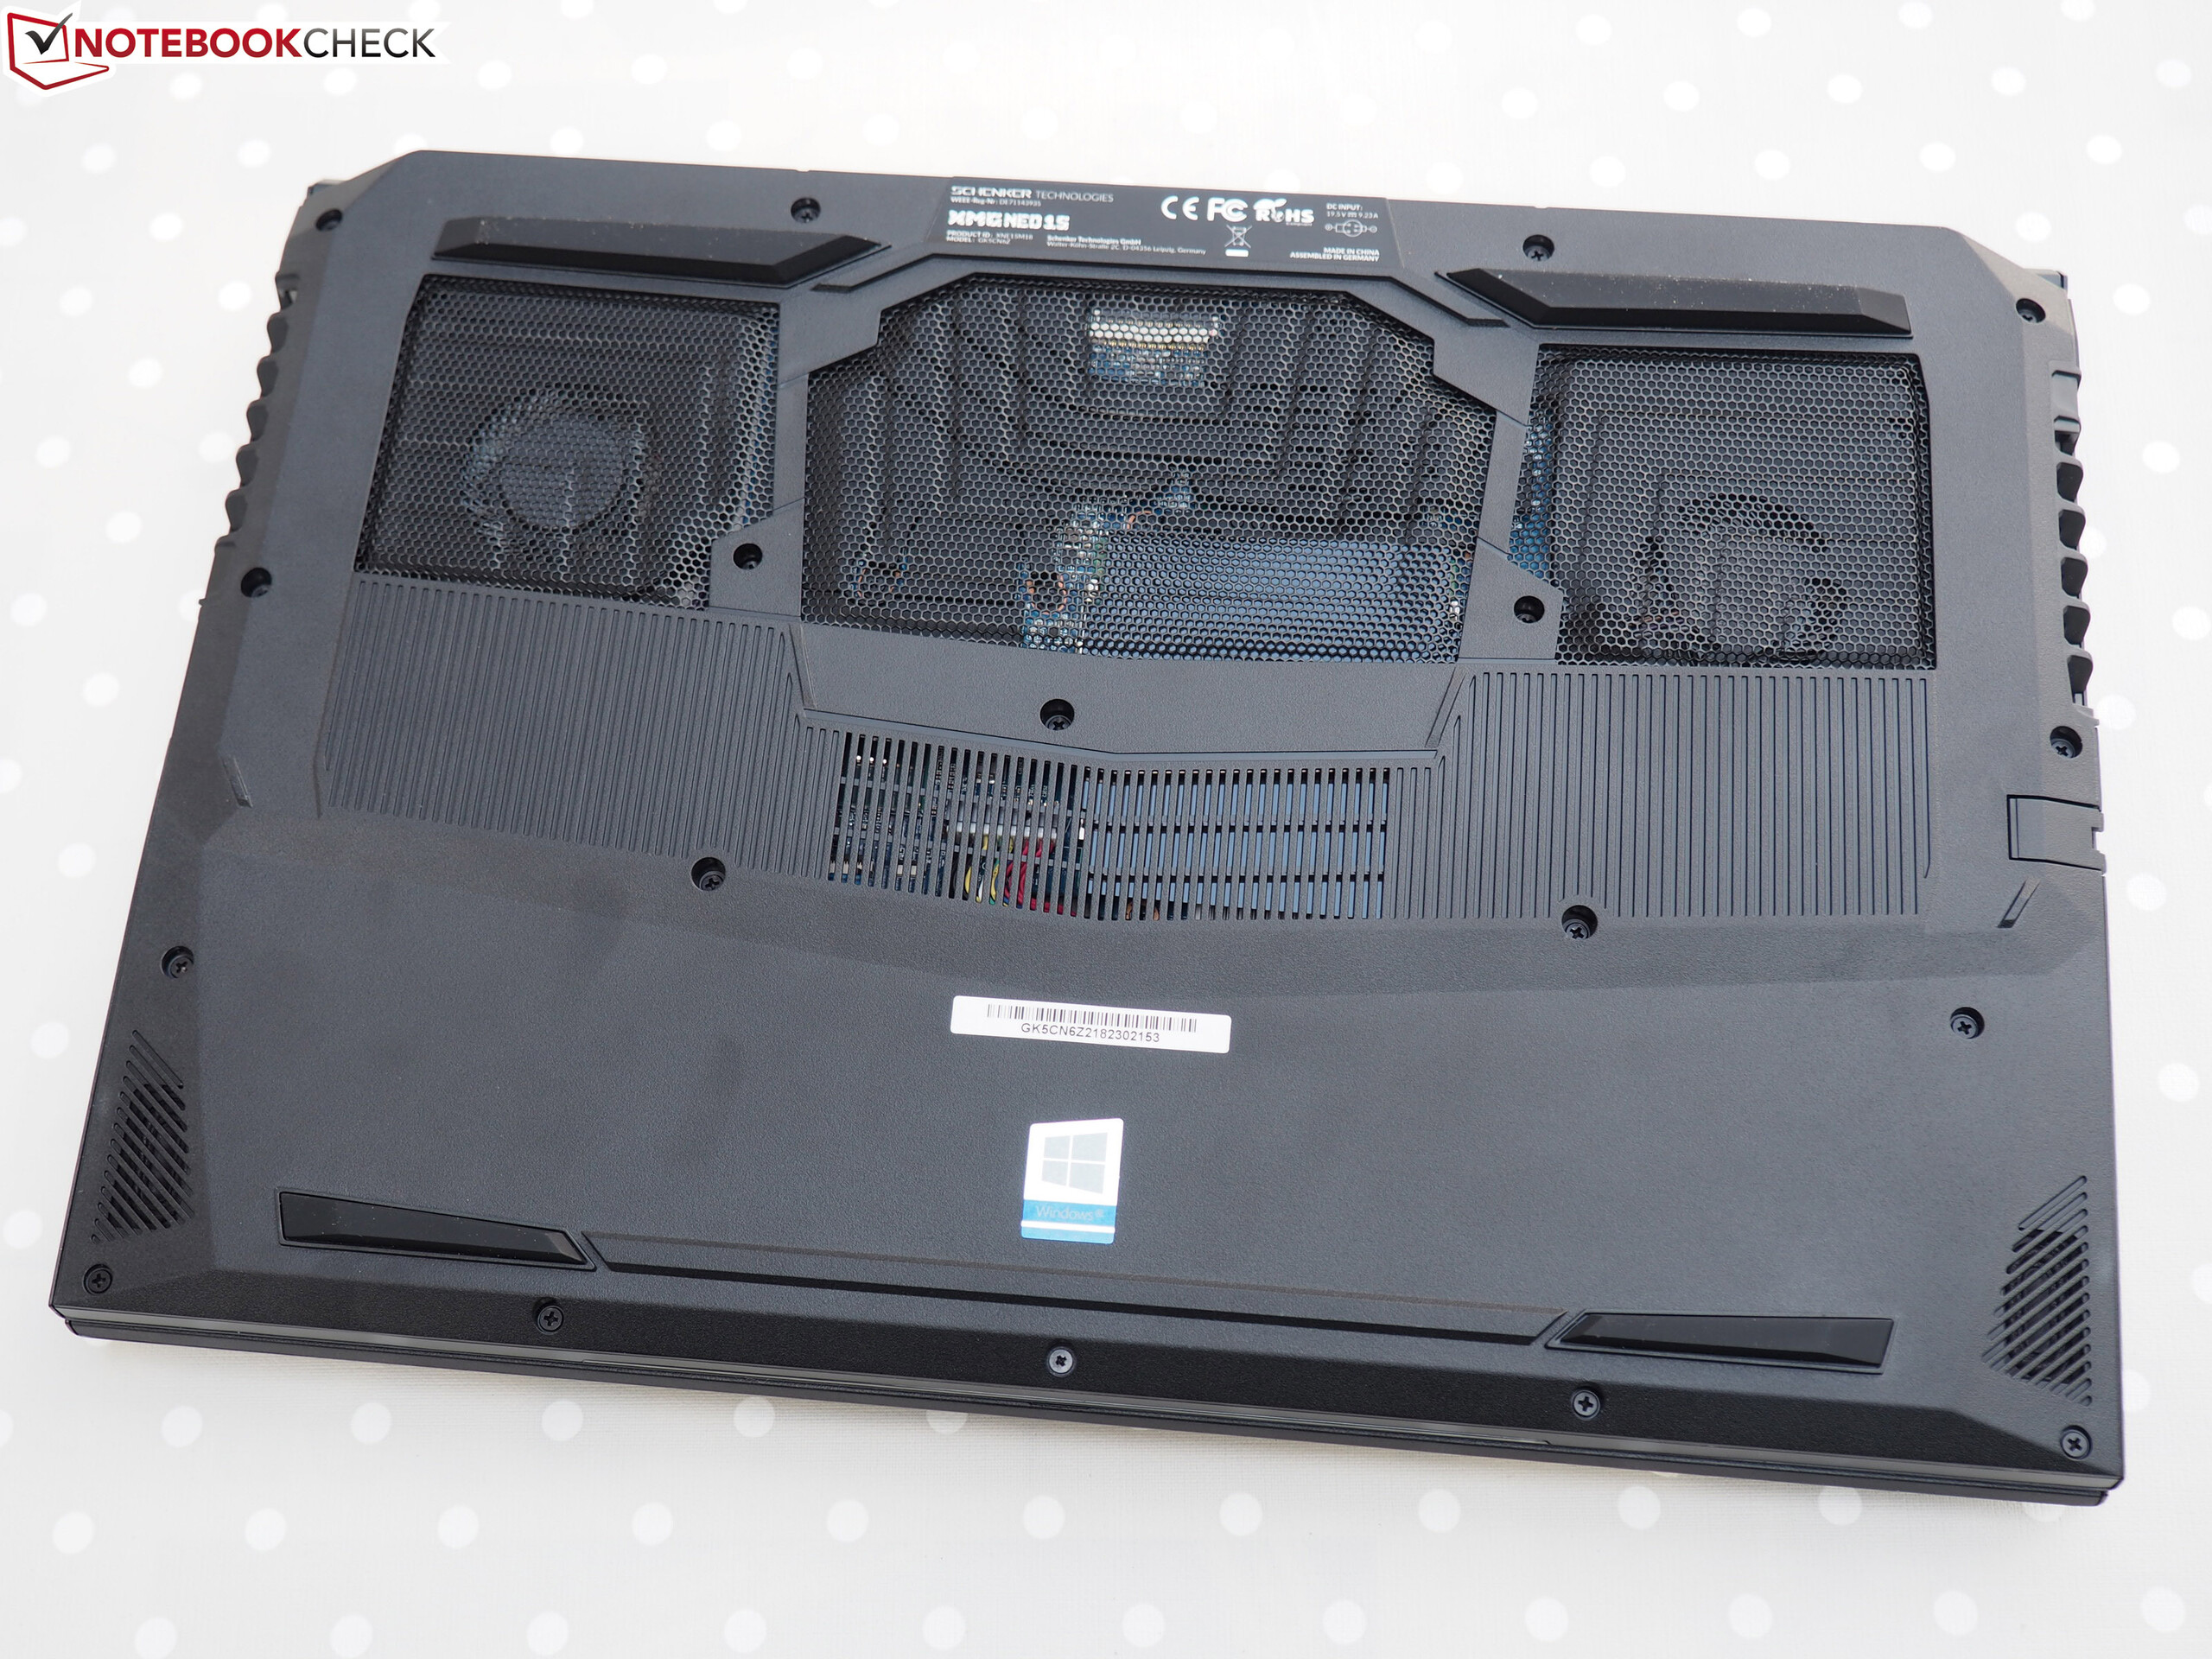
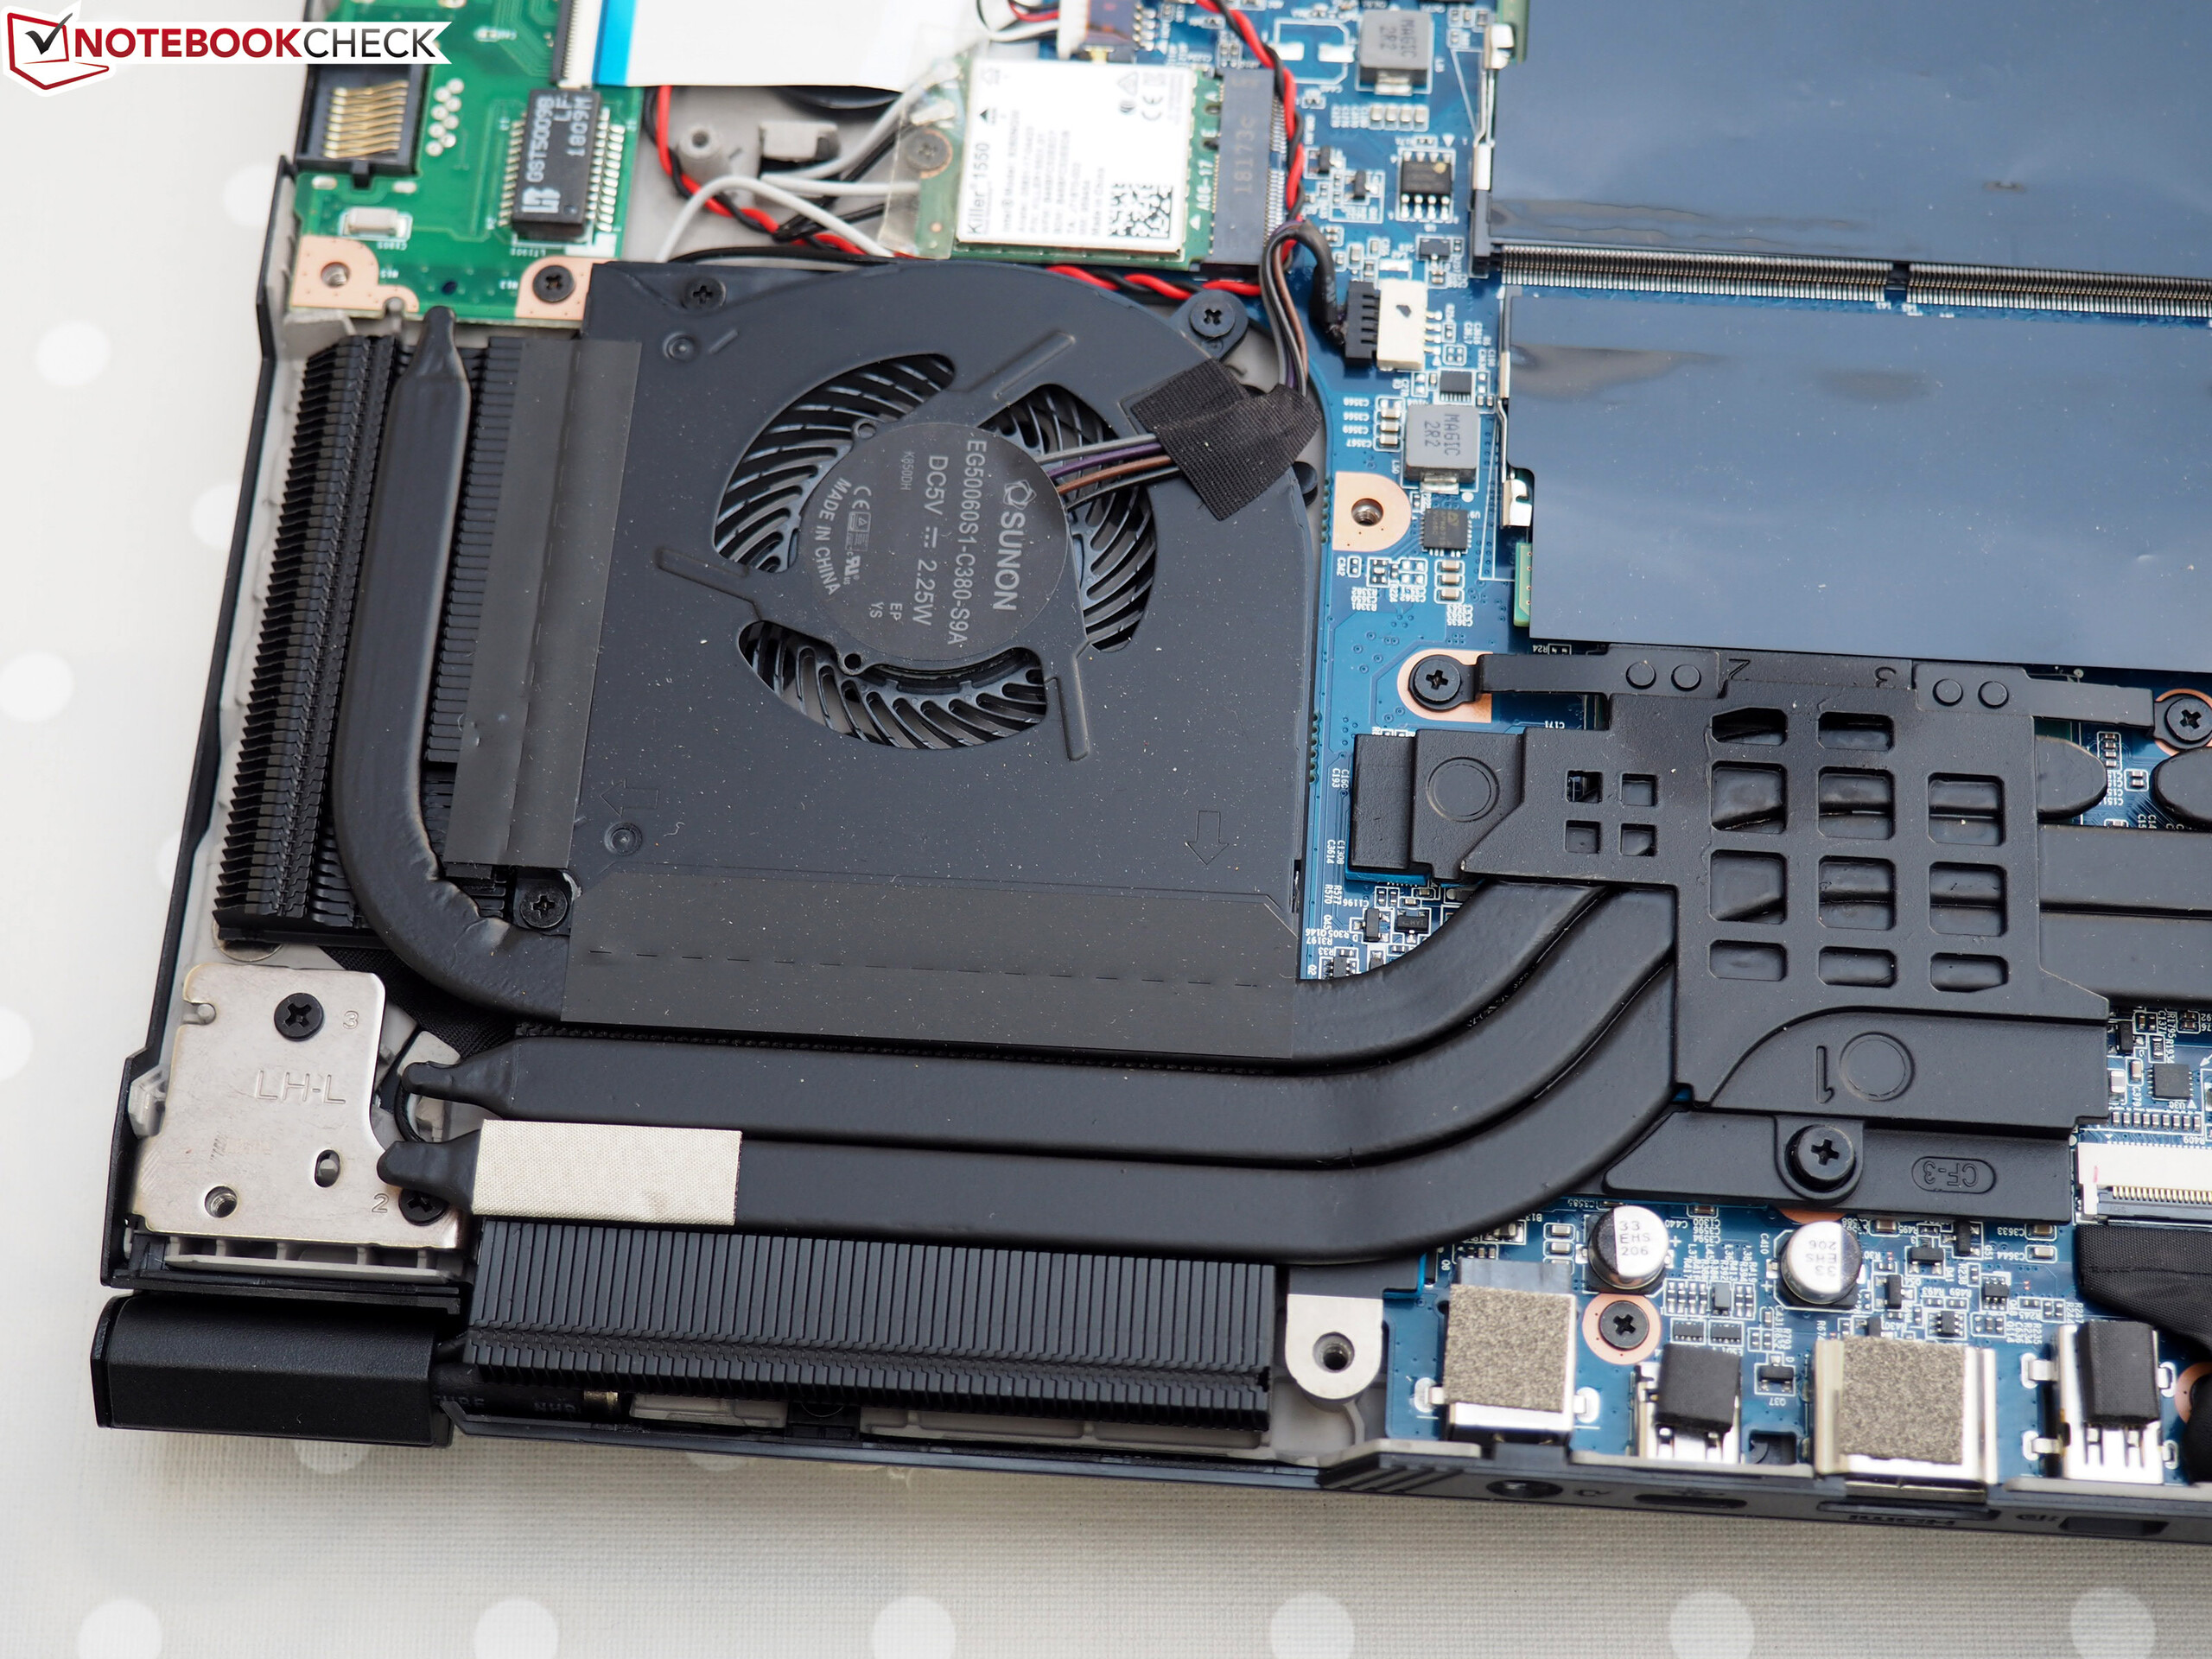
(-) A temperatura máxima no lado superior é 56 °C / 133 F, em comparação com a média de 40.4 °C / 105 F , variando de 21.2 a 68.8 °C para a classe Gaming.
(-) A parte inferior aquece até um máximo de 68 °C / 154 F, em comparação com a média de 43.2 °C / 110 F
(+) Em uso inativo, a temperatura média para o lado superior é 27.2 °C / 81 F, em comparação com a média do dispositivo de 33.9 °C / ### class_avg_f### F.
(-) Jogando The Witcher 3, a temperatura média para o lado superior é 41.6 °C / 107 F, em comparação com a média do dispositivo de 33.9 °C / ## #class_avg_f### F.
(-) Os apoios para as mãos e o touchpad podem ficar muito quentes ao toque, com um máximo de 41 °C / 105.8 F.
(-) A temperatura média da área do apoio para as mãos de dispositivos semelhantes foi 28.8 °C / 83.8 F (-12.2 °C / -22 F).
| Schenker XMG Neo 15 GeForce GTX 1060 Mobile, i7-8750H | Schenker Key 15 Coffee Lake GeForce GTX 1070 Max-Q, i7-8750H | MSI GS65 8RF-019DE Stealth Thin GeForce GTX 1070 Max-Q, i7-8750H | Gigabyte Aero 15X v8 GeForce GTX 1070 Max-Q, i7-8750H | Razer Blade 15 2018 GeForce GTX 1070 Max-Q, i7-8750H | Asus ROG GU501GM-BI7N8 GeForce GTX 1060 Mobile, i7-8750H | Média da turma Gaming | |
|---|---|---|---|---|---|---|---|
| Heat | -8% | 12% | 3% | -6% | 8% | 5% | |
| Maximum Upper Side * (°C) | 56 | 57 -2% | 49 12% | 53 5% | 56 -0% | 43 23% | 45.2 ? 19% |
| Maximum Bottom * (°C) | 68 | 65 4% | 63 7% | 65 4% | 59 13% | 46.6 31% | 48.1 ? 29% |
| Idle Upper Side * (°C) | 28 | 33 -18% | 24 14% | 26 7% | 33 -18% | 29.2 -4% | 31 ? -11% |
| Idle Bottom * (°C) | 29 | 33 -14% | 25 14% | 30 -3% | 34 -17% | 34 -17% | 34.2 ? -18% |
* ... menor é melhor
Schenker XMG Neo 15 análise de áudio
(±) | o volume do alto-falante é médio, mas bom (###valor### dB)
Graves 100 - 315Hz
(-) | quase nenhum baixo - em média 26.2% menor que a mediana
(±) | a linearidade dos graves é média (12.9% delta para a frequência anterior)
Médios 400 - 2.000 Hz
(+) | médios equilibrados - apenas 4.8% longe da mediana
(±) | a linearidade dos médios é média (7.4% delta para frequência anterior)
Altos 2 - 16 kHz
(+) | agudos equilibrados - apenas 2.6% longe da mediana
(+) | os máximos são lineares (6.4% delta da frequência anterior)
Geral 100 - 16.000 Hz
(±) | a linearidade do som geral é média (21.8% diferença em relação à mediana)
Comparado com a mesma classe
» 78% de todos os dispositivos testados nesta classe foram melhores, 6% semelhantes, 16% piores
» O melhor teve um delta de 6%, a média foi 18%, o pior foi 132%
Comparado com todos os dispositivos testados
» 62% de todos os dispositivos testados foram melhores, 7% semelhantes, 31% piores
» O melhor teve um delta de 4%, a média foi 23%, o pior foi 134%
Schenker Key 15 Coffee Lake análise de áudio
(±) | o volume do alto-falante é médio, mas bom (###valor### dB)
Graves 100 - 315Hz
(-) | quase nenhum baixo - em média 26.7% menor que a mediana
(±) | a linearidade dos graves é média (10.8% delta para a frequência anterior)
Médios 400 - 2.000 Hz
(±) | médios mais altos - em média 5.7% maior que a mediana
(±) | a linearidade dos médios é média (9.6% delta para frequência anterior)
Altos 2 - 16 kHz
(+) | agudos equilibrados - apenas 1.4% longe da mediana
(+) | os máximos são lineares (3.8% delta da frequência anterior)
Geral 100 - 16.000 Hz
(±) | a linearidade do som geral é média (24.6% diferença em relação à mediana)
Comparado com a mesma classe
» 89% de todos os dispositivos testados nesta classe foram melhores, 4% semelhantes, 8% piores
» O melhor teve um delta de 6%, a média foi 18%, o pior foi 132%
Comparado com todos os dispositivos testados
» 75% de todos os dispositivos testados foram melhores, 5% semelhantes, 20% piores
» O melhor teve um delta de 4%, a média foi 23%, o pior foi 134%
| desligado | |
| Ocioso | |
| Carga |
|
Key:
min: | |
| Schenker XMG Neo 15 GeForce GTX 1060 Mobile, i7-8750H | Schenker Key 15 Coffee Lake GeForce GTX 1070 Max-Q, i7-8750H | MSI GS65 8RF-019DE Stealth Thin GeForce GTX 1070 Max-Q, i7-8750H | Gigabyte Aero 15X v8 GeForce GTX 1070 Max-Q, i7-8750H | Razer Blade 15 2018 GeForce GTX 1070 Max-Q, i7-8750H | Asus ROG GU501GM-BI7N8 GeForce GTX 1060 Mobile, i7-8750H | Média da turma Gaming | |
|---|---|---|---|---|---|---|---|
| Power Consumption | -17% | 2% | -20% | -19% | -19% | -35% | |
| Idle Minimum * (Watt) | 10 | 14 -40% | 7 30% | 14 -40% | 14 -40% | 12.35 -23% | 13 ? -30% |
| Idle Average * (Watt) | 13 | 17 -31% | 11 15% | 18 -38% | 17 -31% | 19.98 -54% | 19 ? -46% |
| Idle Maximum * (Watt) | 18 | 22 -22% | 20 -11% | 22 -22% | 21 -17% | 25.44 -41% | 24.6 ? -37% |
| Load Average * (Watt) | 95 | 102 -7% | 98 -3% | 91 4% | 95 -0% | 94.28 1% | 110.7 ? -17% |
| Witcher 3 ultra * (Watt) | 114 | 130 -14% | 132 -16% | 142 -25% | 141 -24% | 132.9 -17% | |
| Load Maximum * (Watt) | 179 | 157 12% | 182 -2% | 173 3% | 179 -0% | 140.63 21% | 259 ? -45% |
* ... menor é melhor
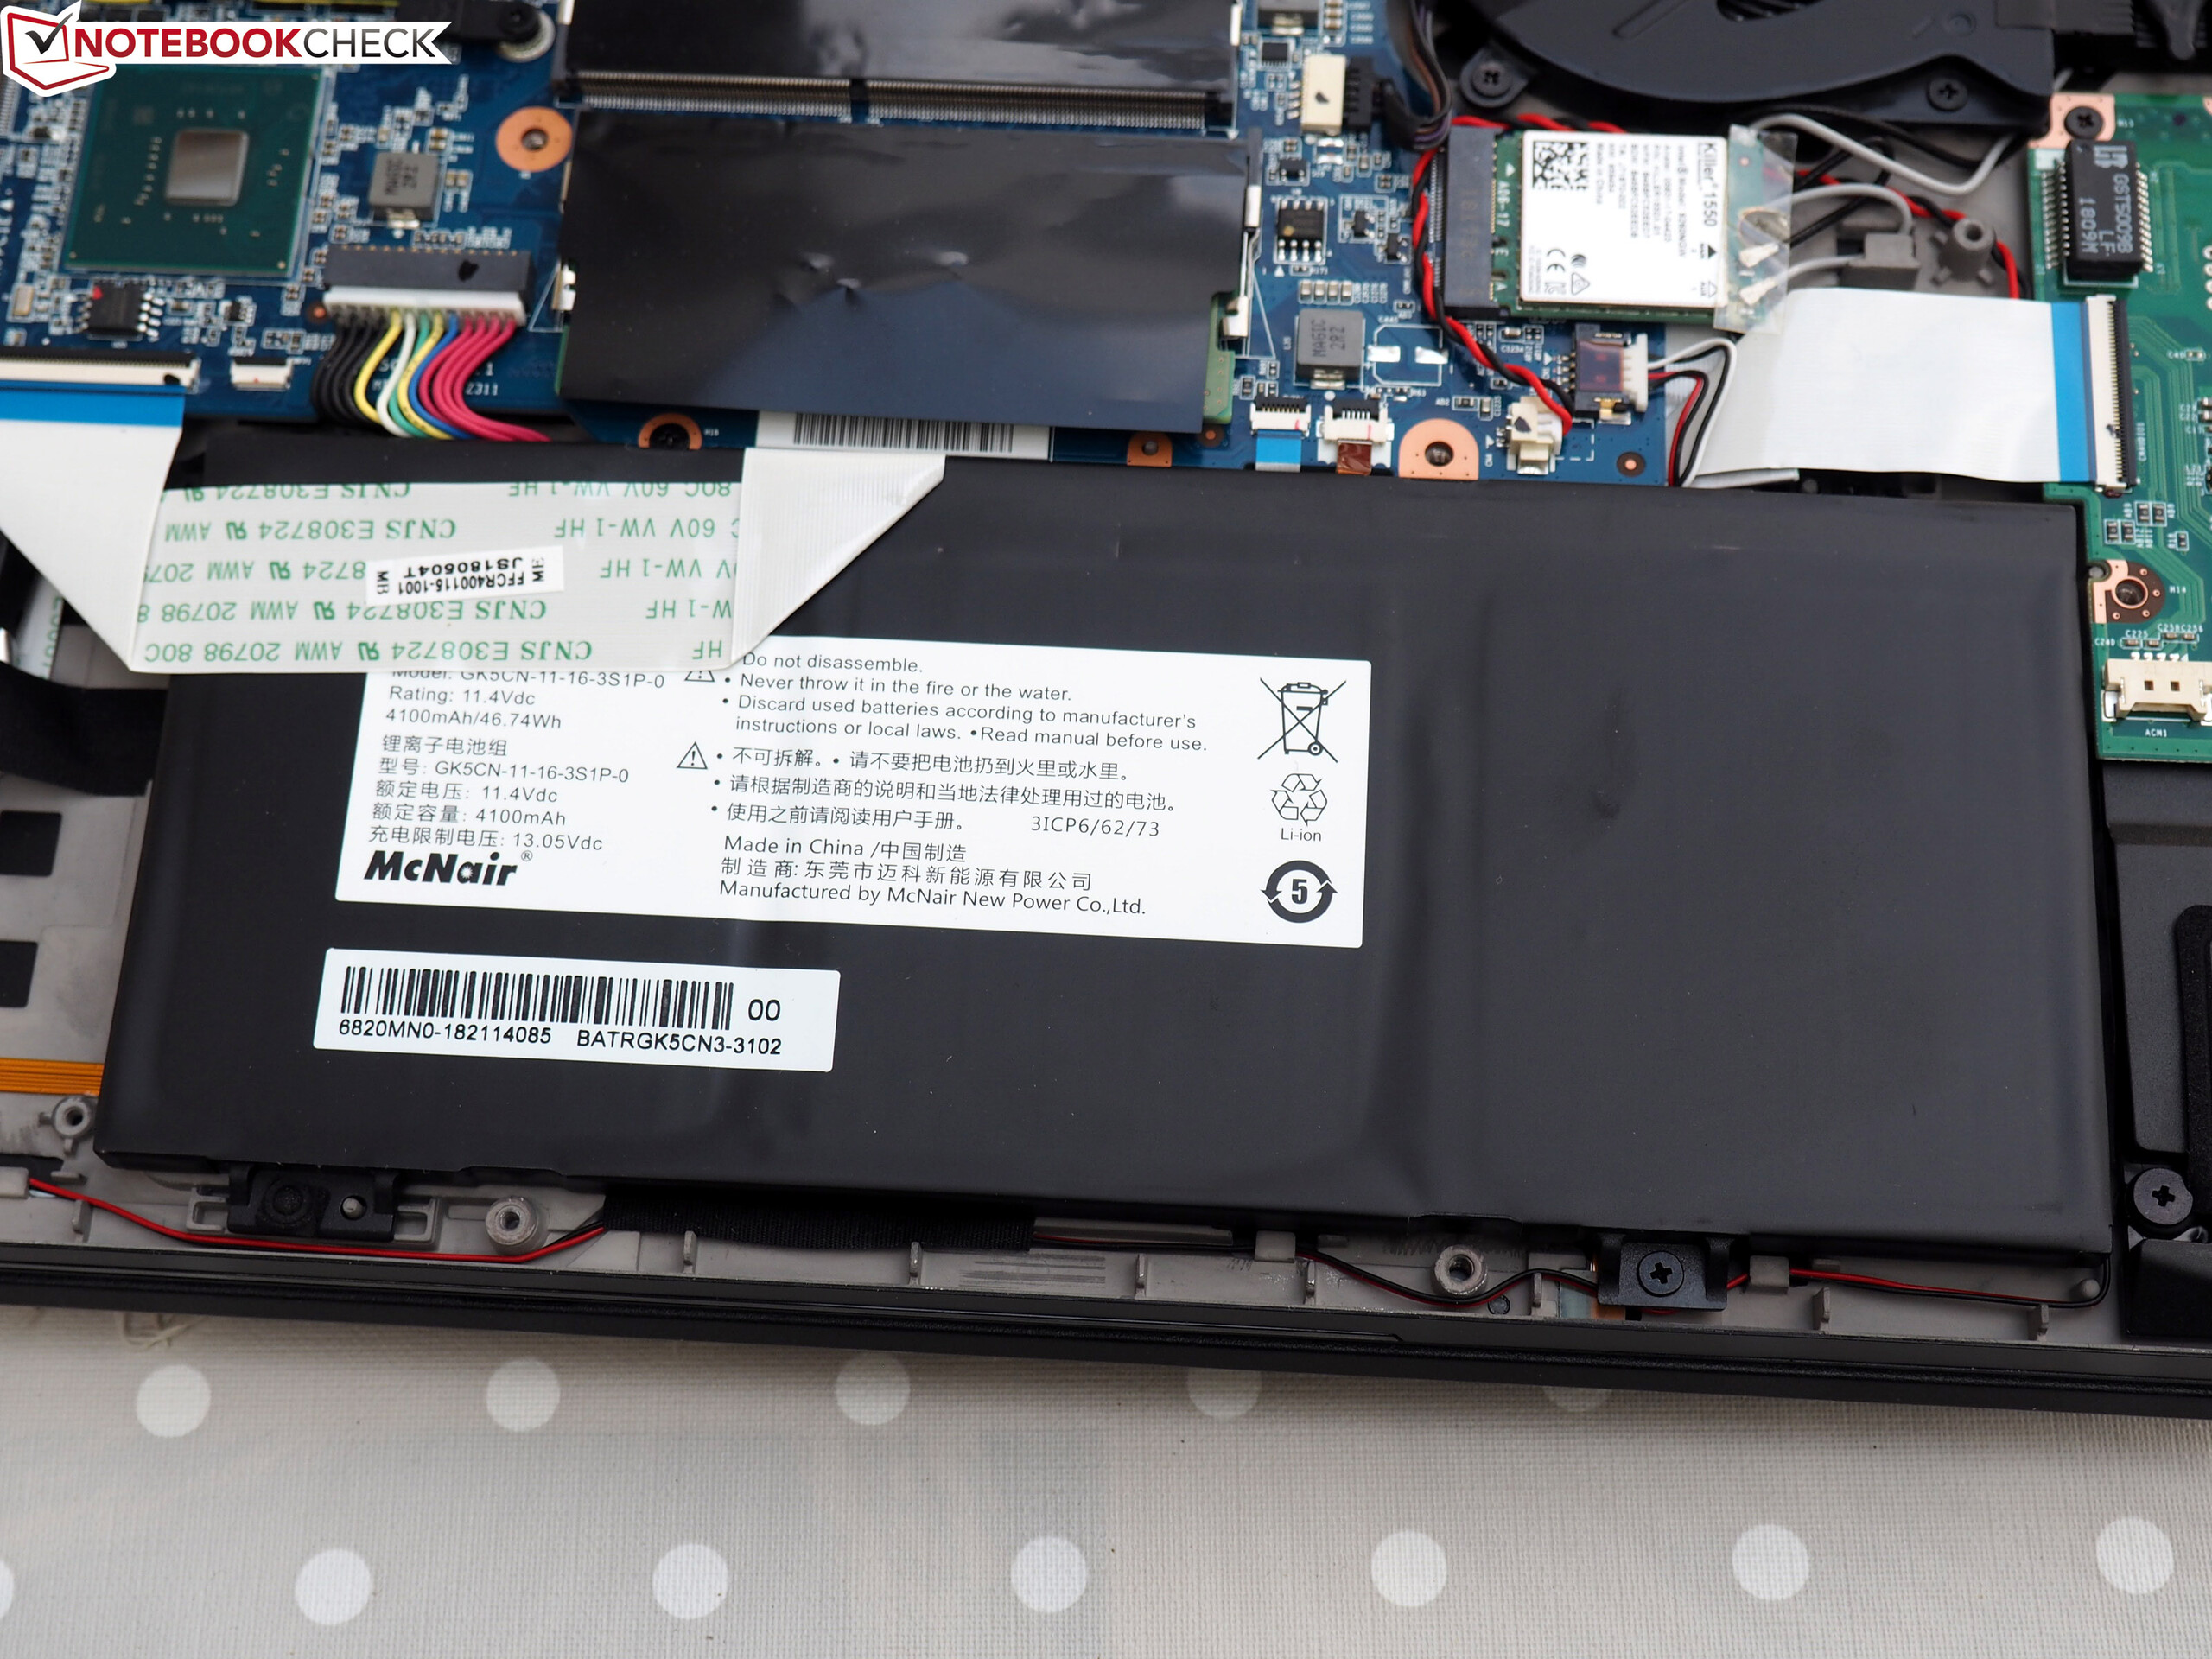
| Schenker XMG Neo 15 GeForce GTX 1060 Mobile, i7-8750H, 46.7 Wh | Schenker Key 15 Coffee Lake GeForce GTX 1070 Max-Q, i7-8750H, 55 Wh | MSI GS65 8RF-019DE Stealth Thin GeForce GTX 1070 Max-Q, i7-8750H, 82 Wh | Gigabyte Aero 15X v8 GeForce GTX 1070 Max-Q, i7-8750H, 94.24 Wh | Razer Blade 15 2018 GeForce GTX 1070 Max-Q, i7-8750H, 80 Wh | Asus ROG GU501GM-BI7N8 GeForce GTX 1060 Mobile, i7-8750H, 55 Wh | Média da turma Gaming | |
|---|---|---|---|---|---|---|---|
| Duração da bateria | -21% | 15% | 74% | -1% | -33% | 34% | |
| Reader / Idle (h) | 6.7 | 5 -25% | 8.5 27% | 12.7 90% | 6.4 -4% | 4.5 -33% | 8.27 ? 23% |
| H.264 (h) | 4.8 | 5.9 23% | 8.4 75% | 5.4 13% | 8.32 ? 73% | ||
| WiFi v1.3 (h) | 4.4 | 3.7 -16% | 6 36% | 8.6 95% | 5.4 23% | 4 -9% | 7.11 ? 62% |
| Load (h) | 1.9 | 1.5 -21% | 1.4 -26% | 2.6 37% | 1.2 -37% | 0.8 -58% | 1.502 ? -21% |
Pro
Contra
O XMG Neo 15 pode competir no topo do mercado altamente competitivo de portáteis de jogos finos, mas não consegue vencer os atuais líderes Gigabyte Aero 15X (88%) e Razer Blade 15 (87%).
A impressão geral está mais no nível com o MSI GS65 (86%) ou Asus ROG GU501GM (85%), respectivamente.
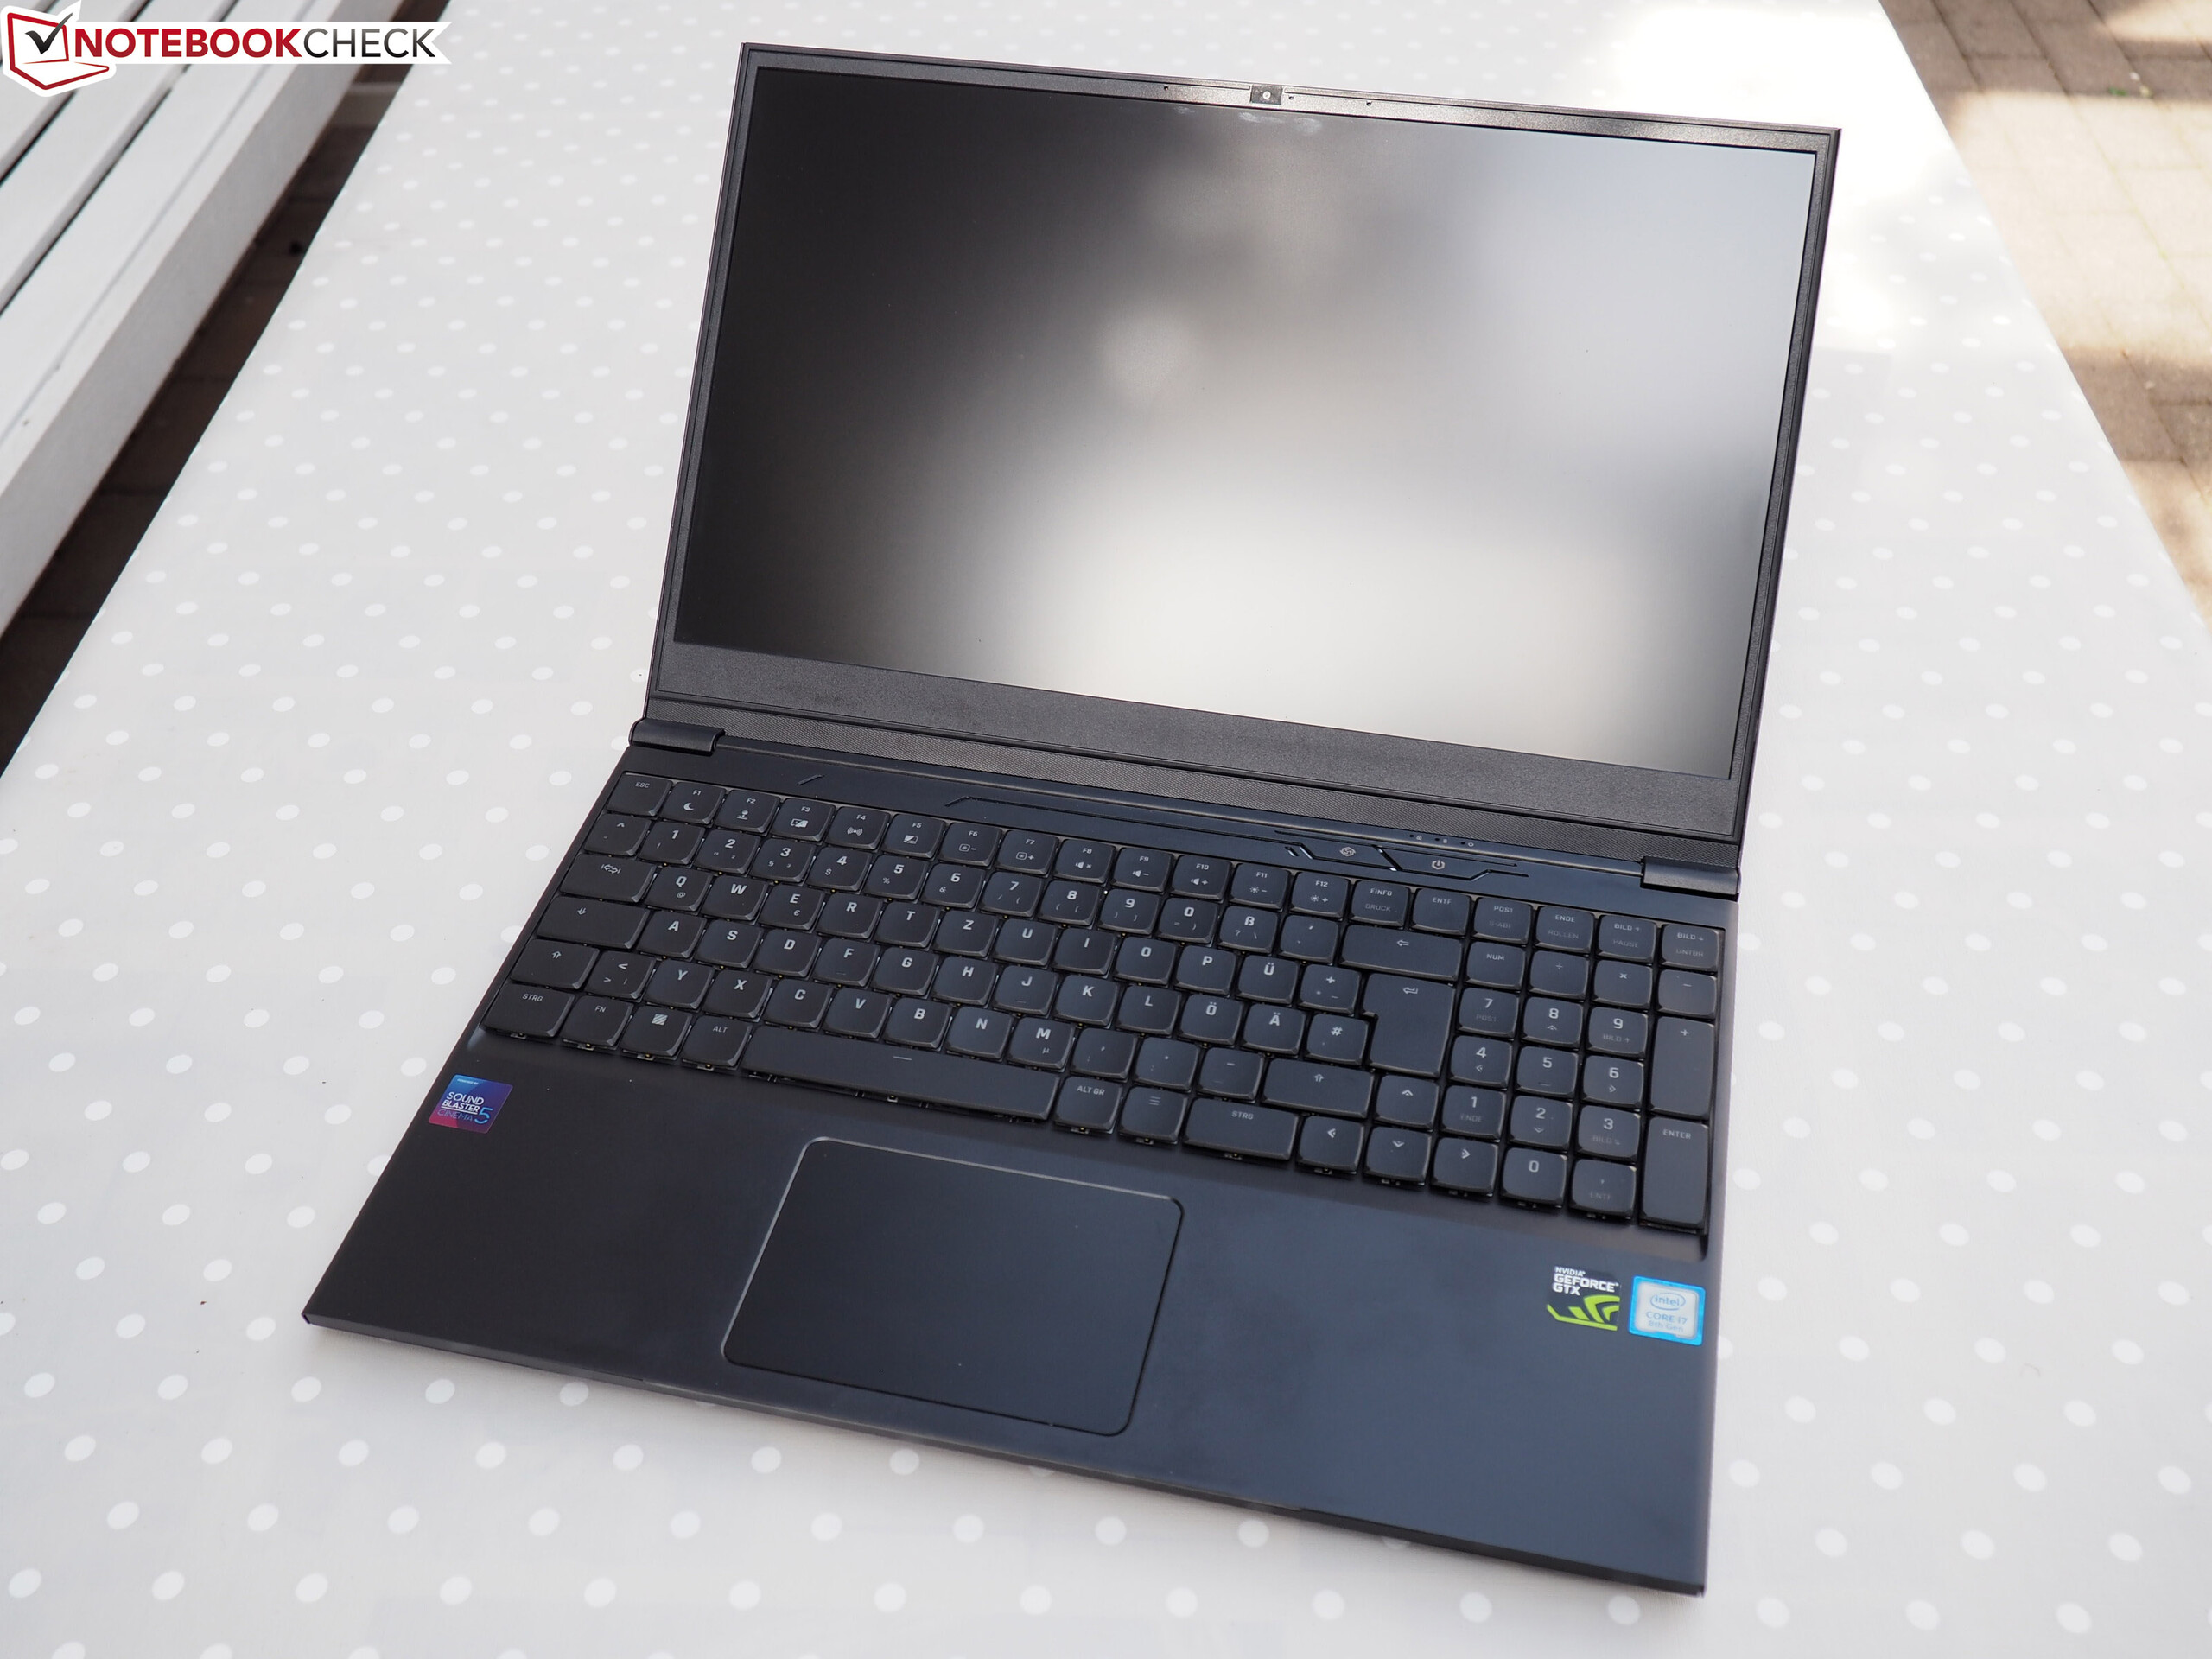
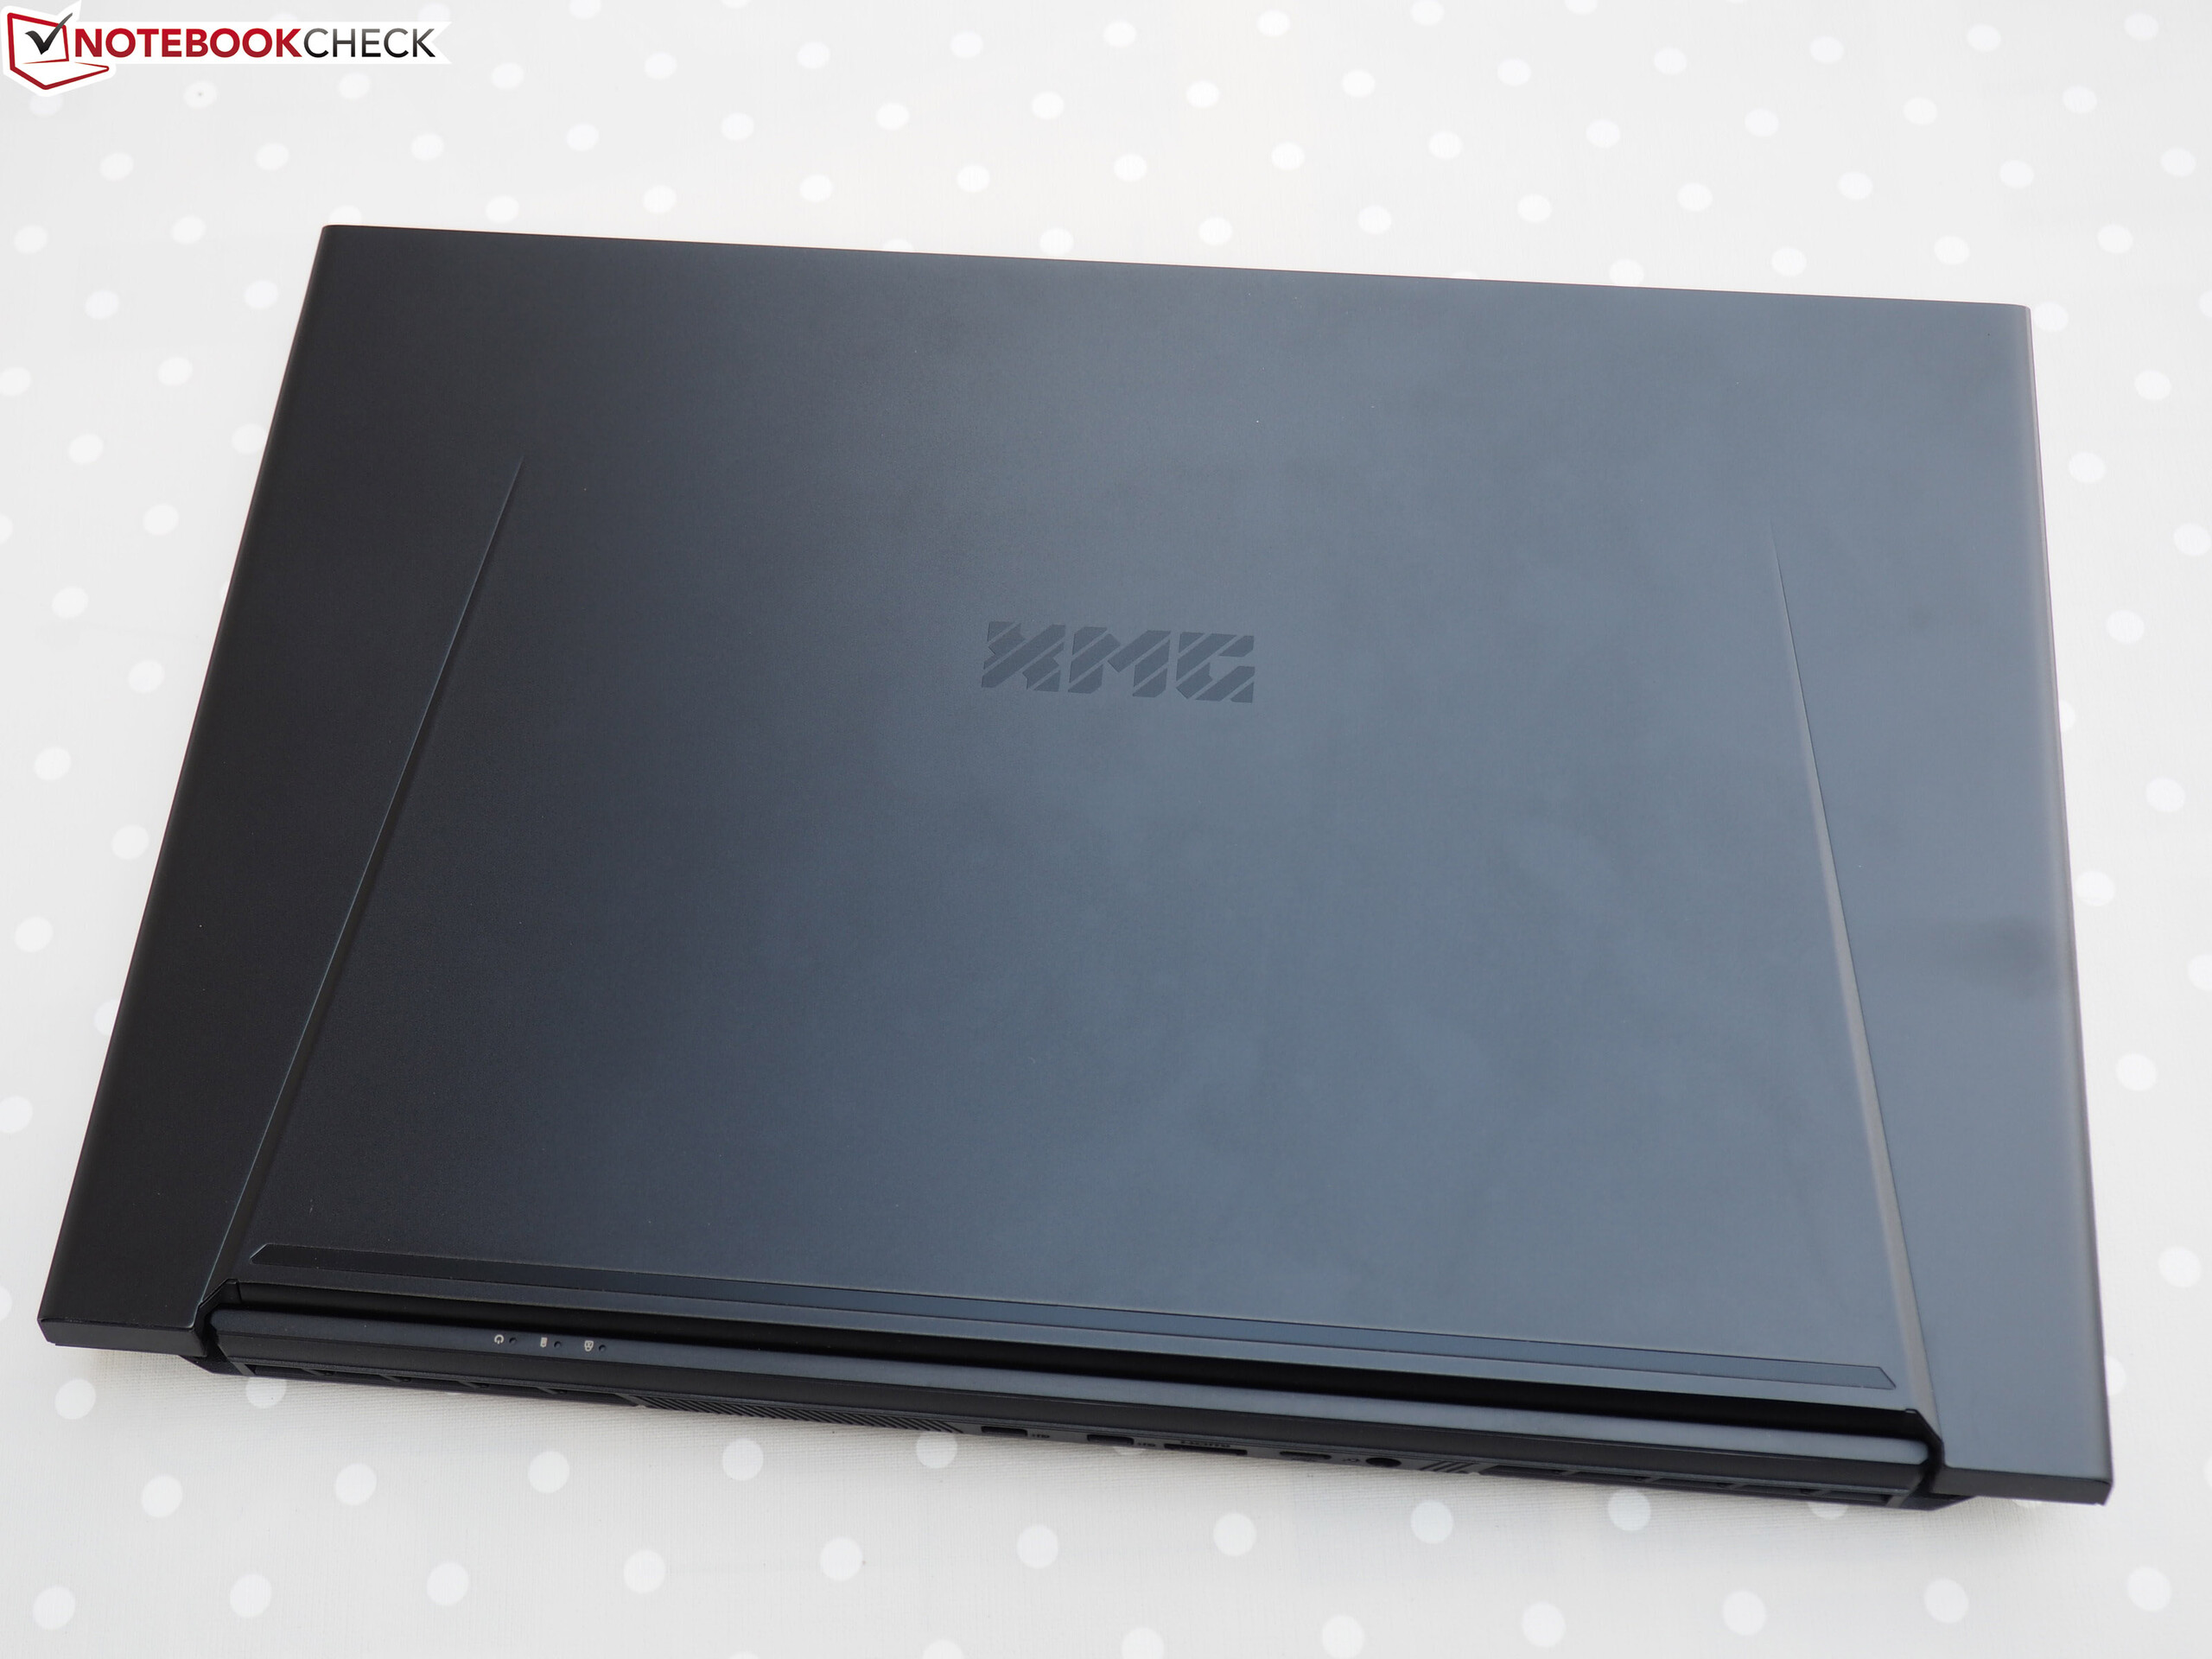
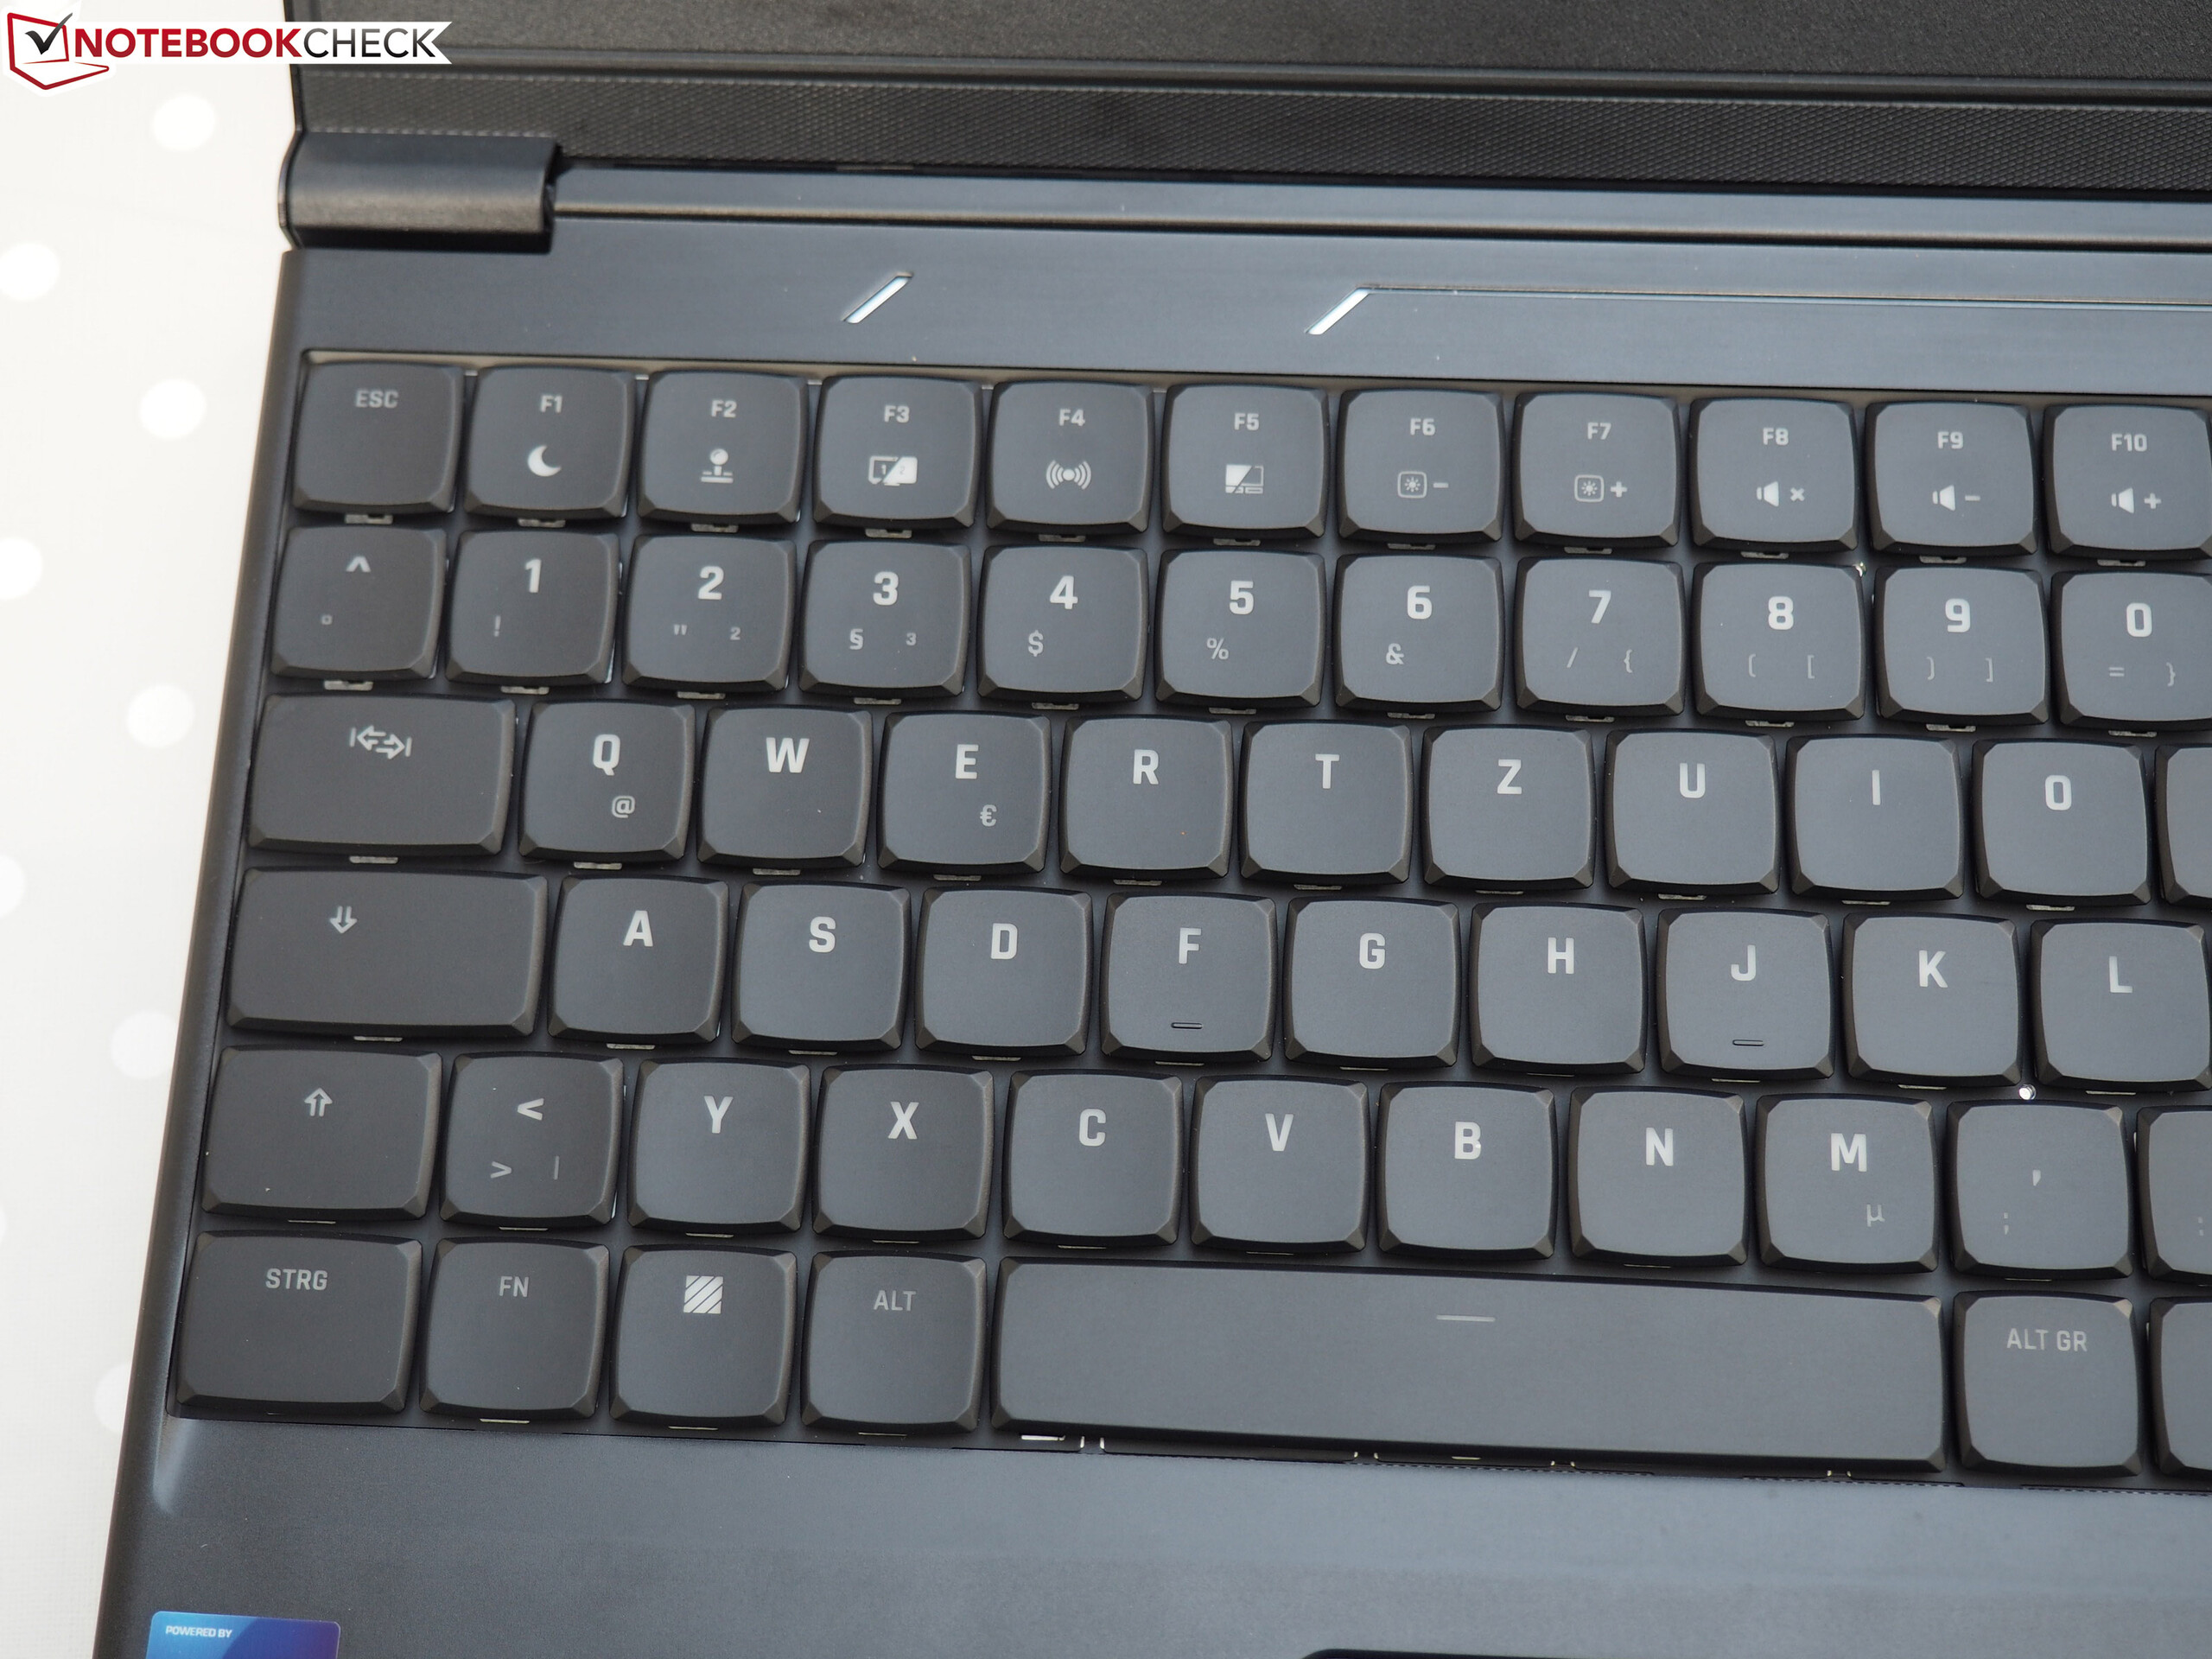
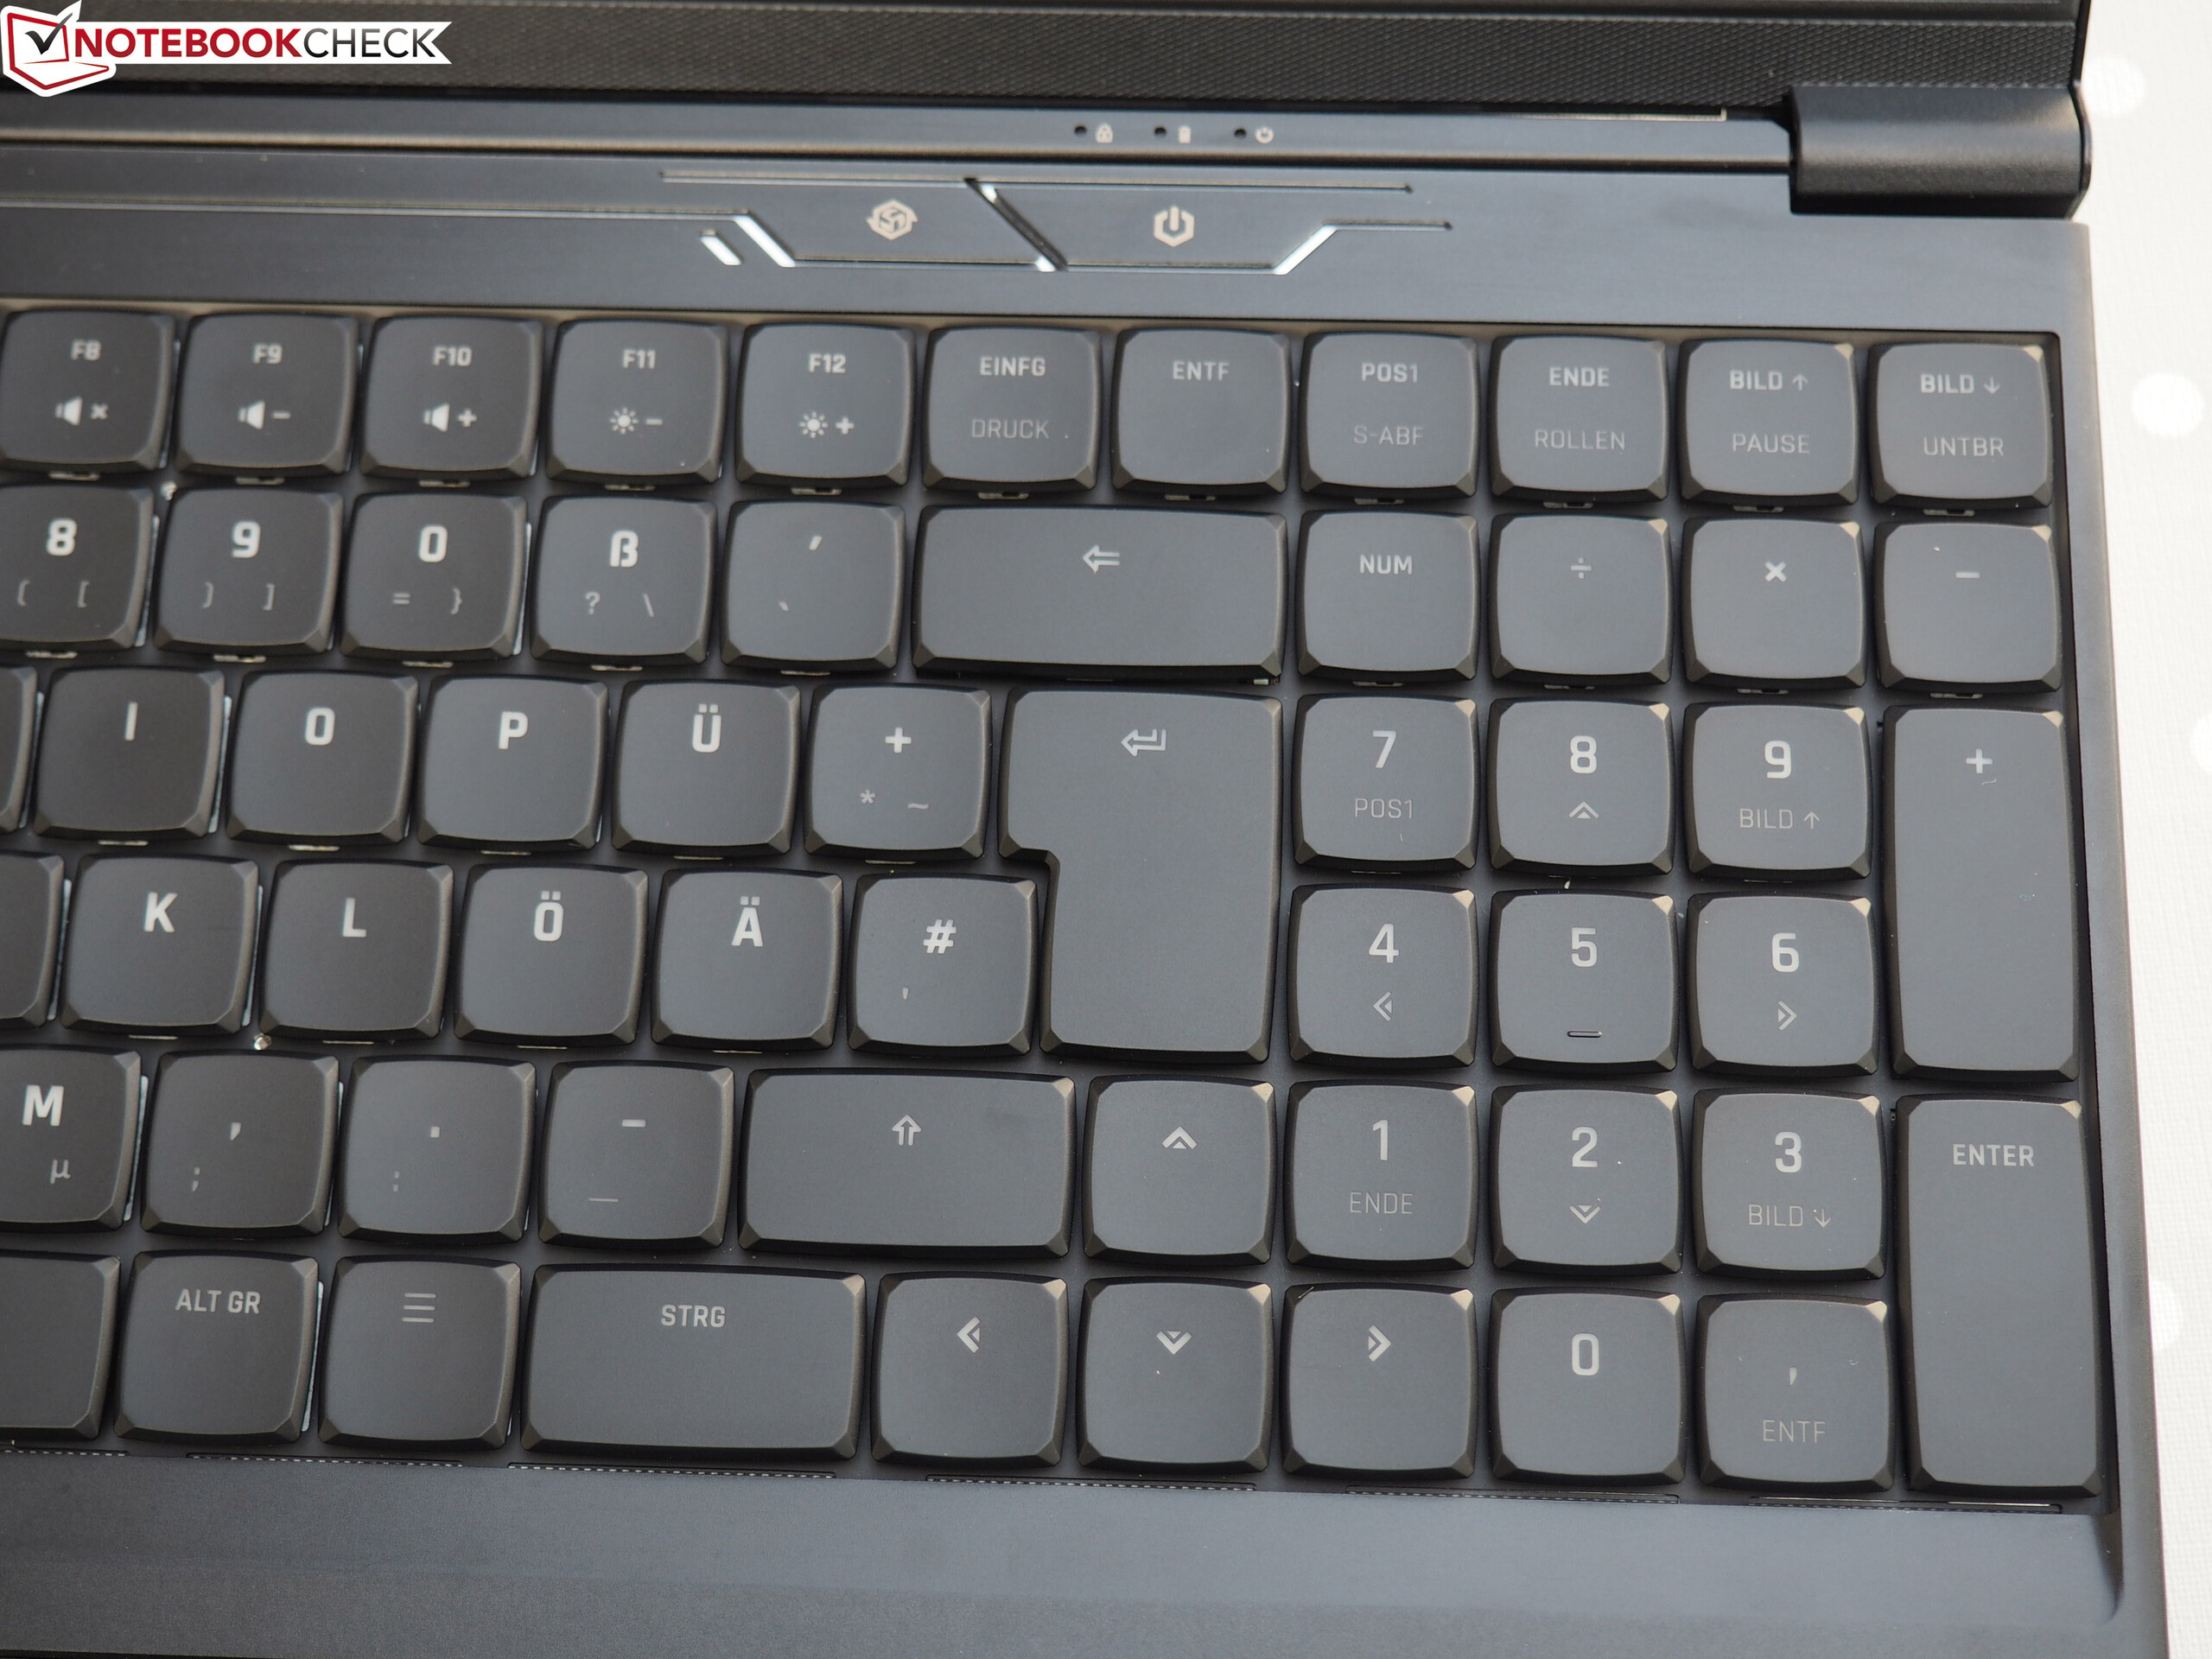
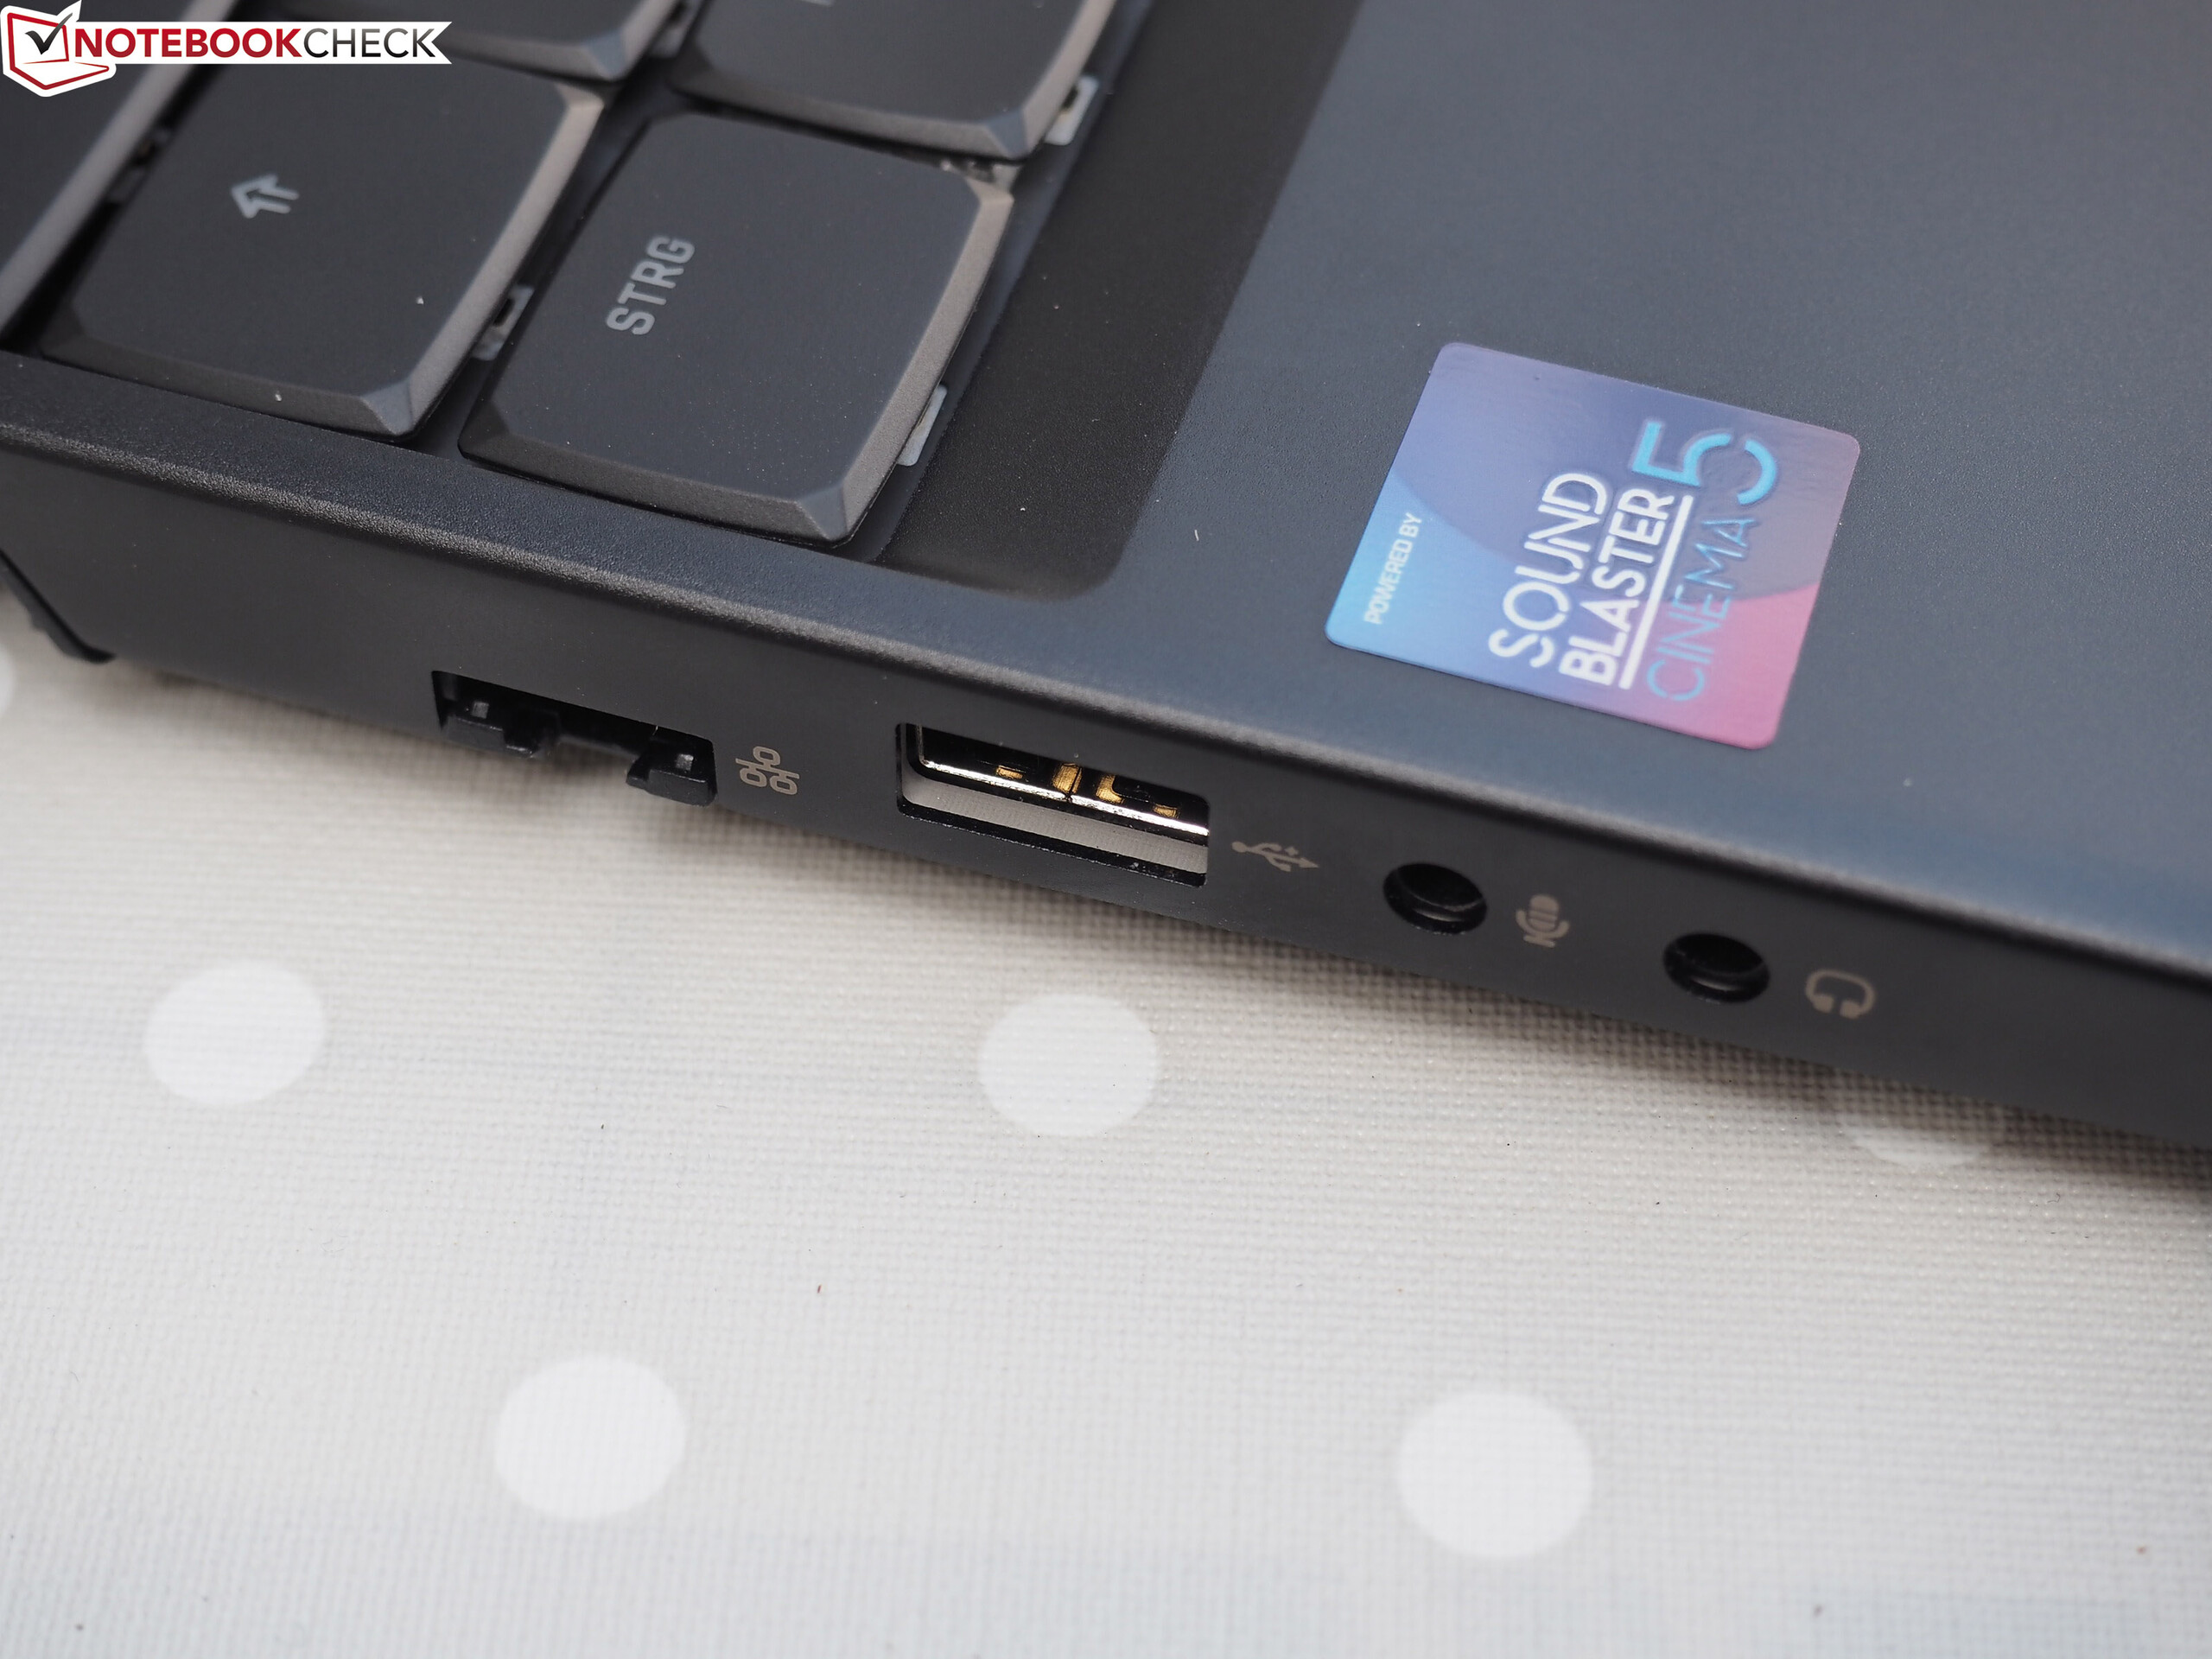
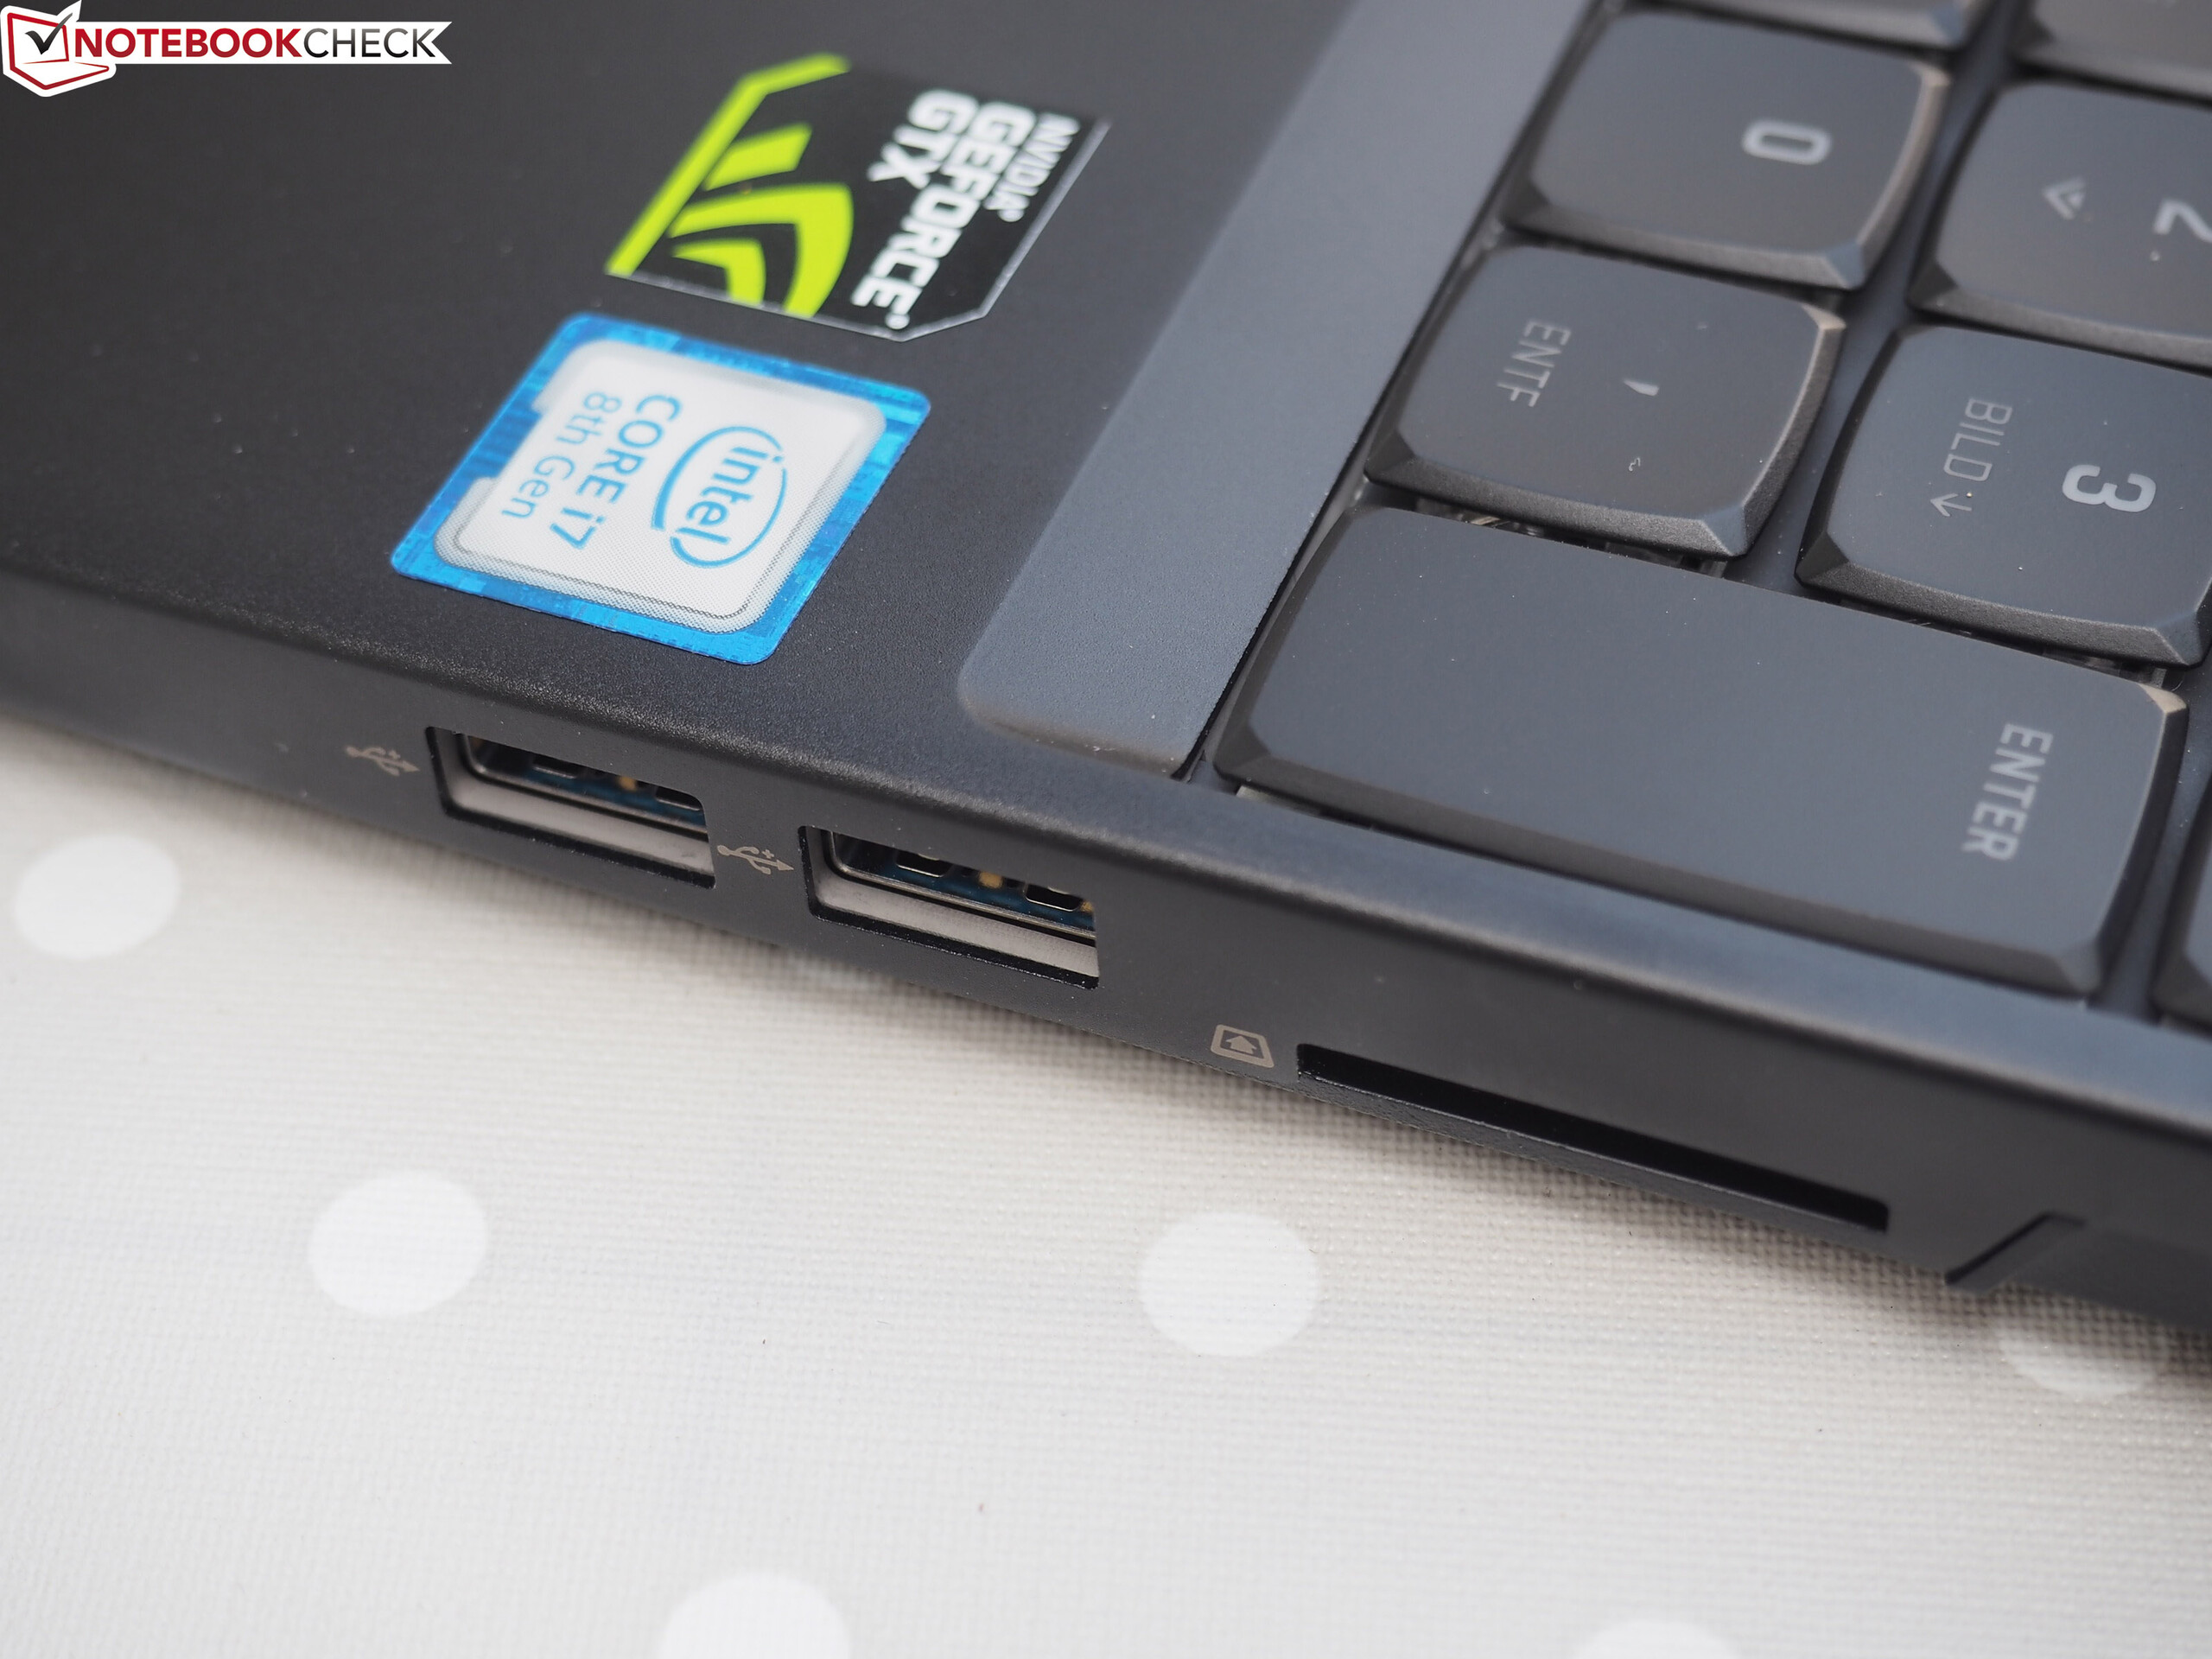
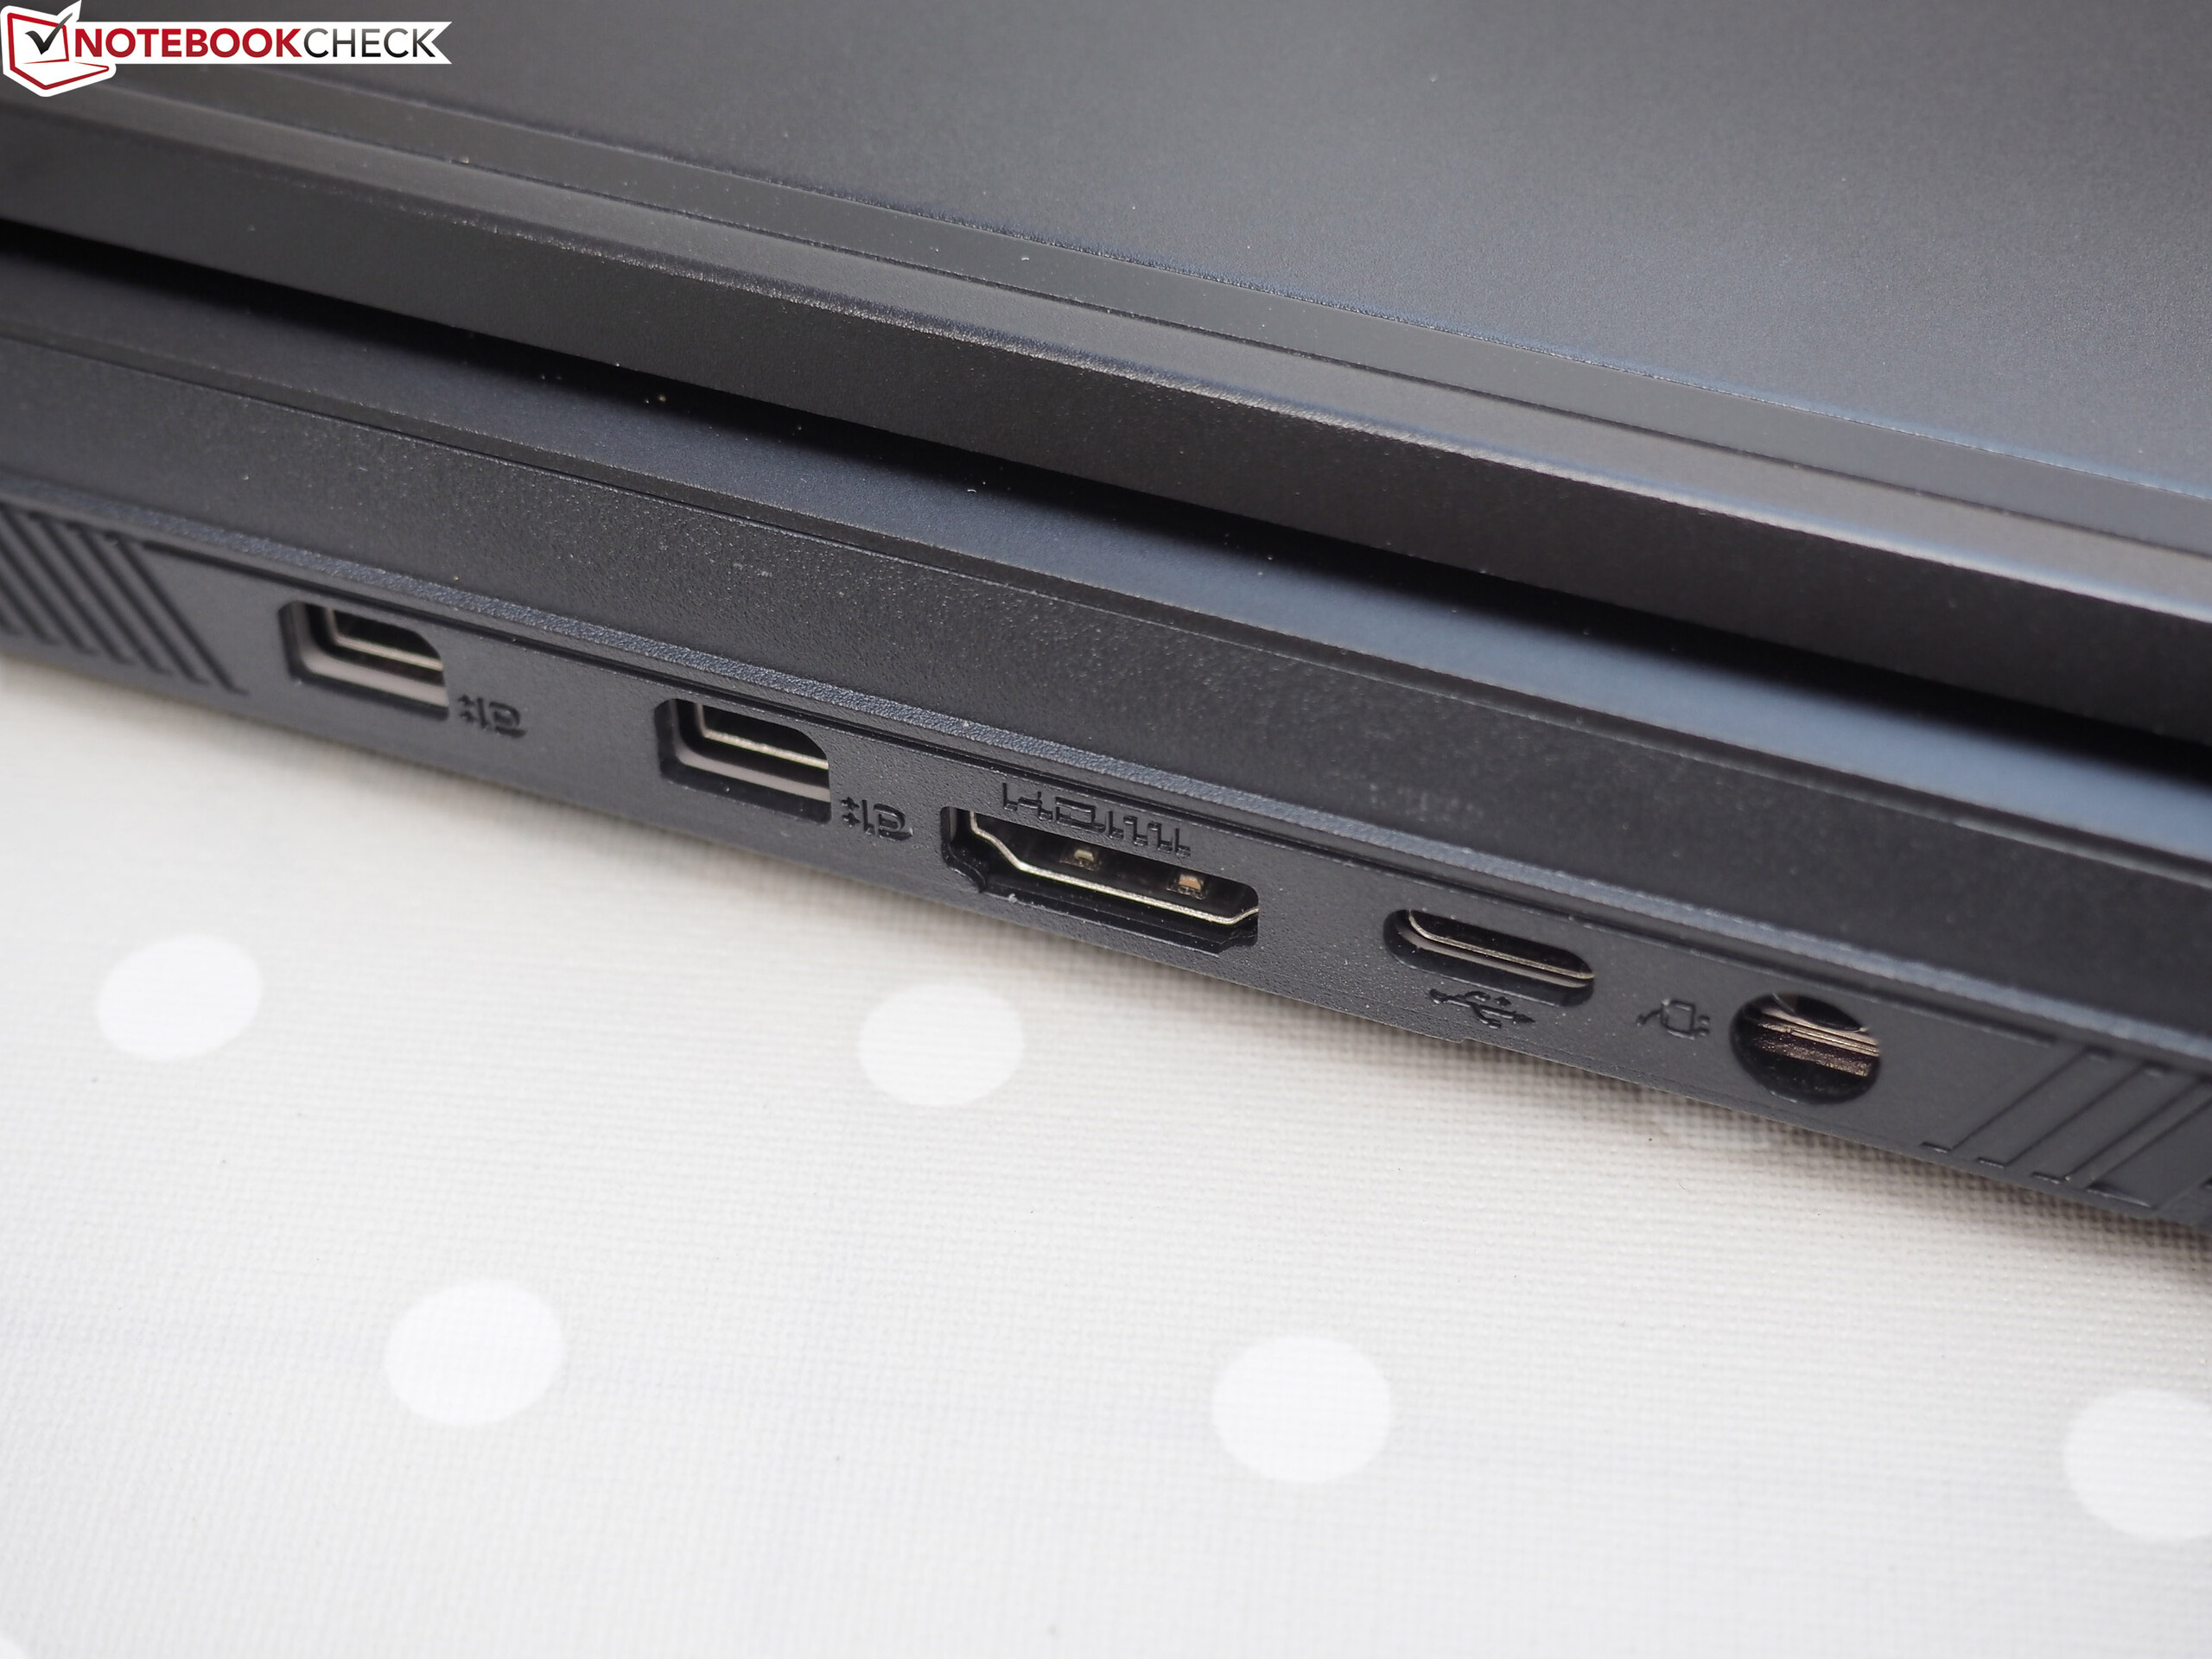
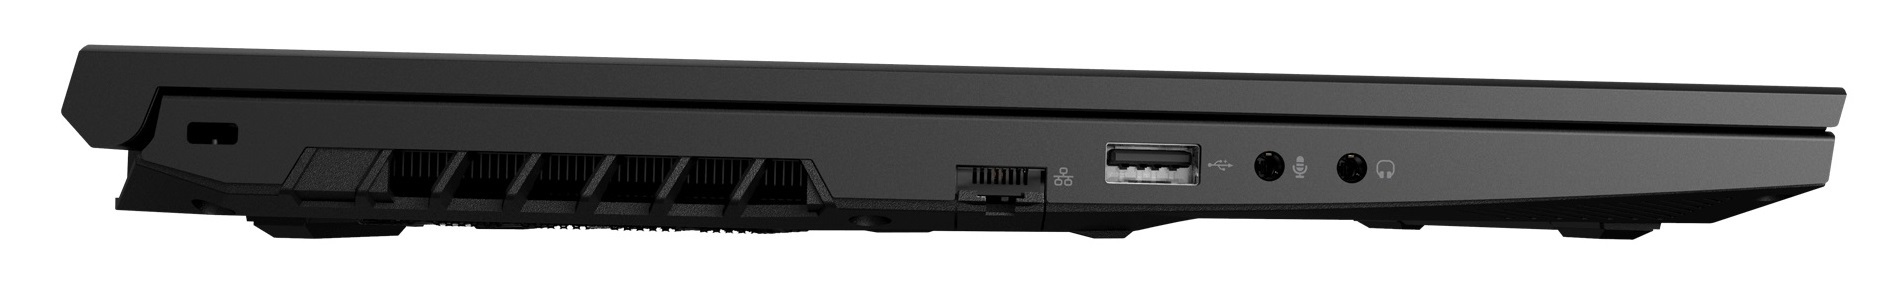
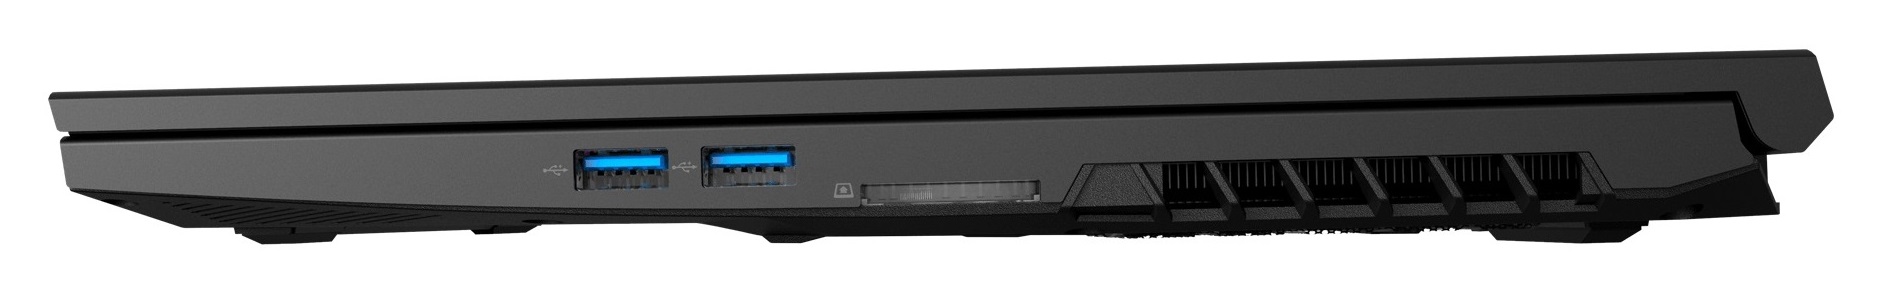
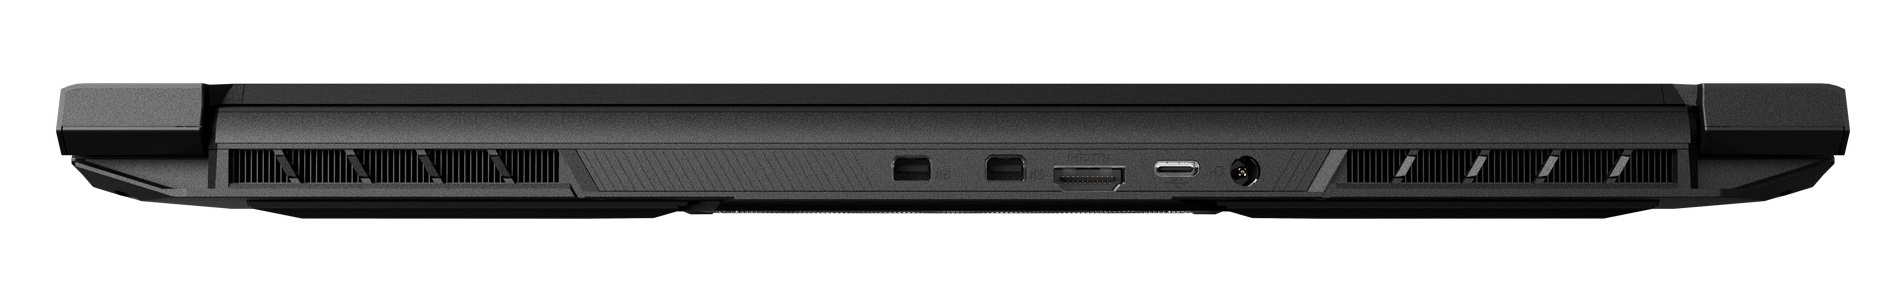
Os aspectos positivos incluem o chassi de metal muito compacto e surpreendentemente resistente, que - exceto pelo Thunderbolt 3 ou USB 3.1 Gen.2 - oferece muitas portas, bem como um teclado mecânico (com iluminação RGB). O último é um argumento de compra real e eleva o Neo 15 acima da concorrência.
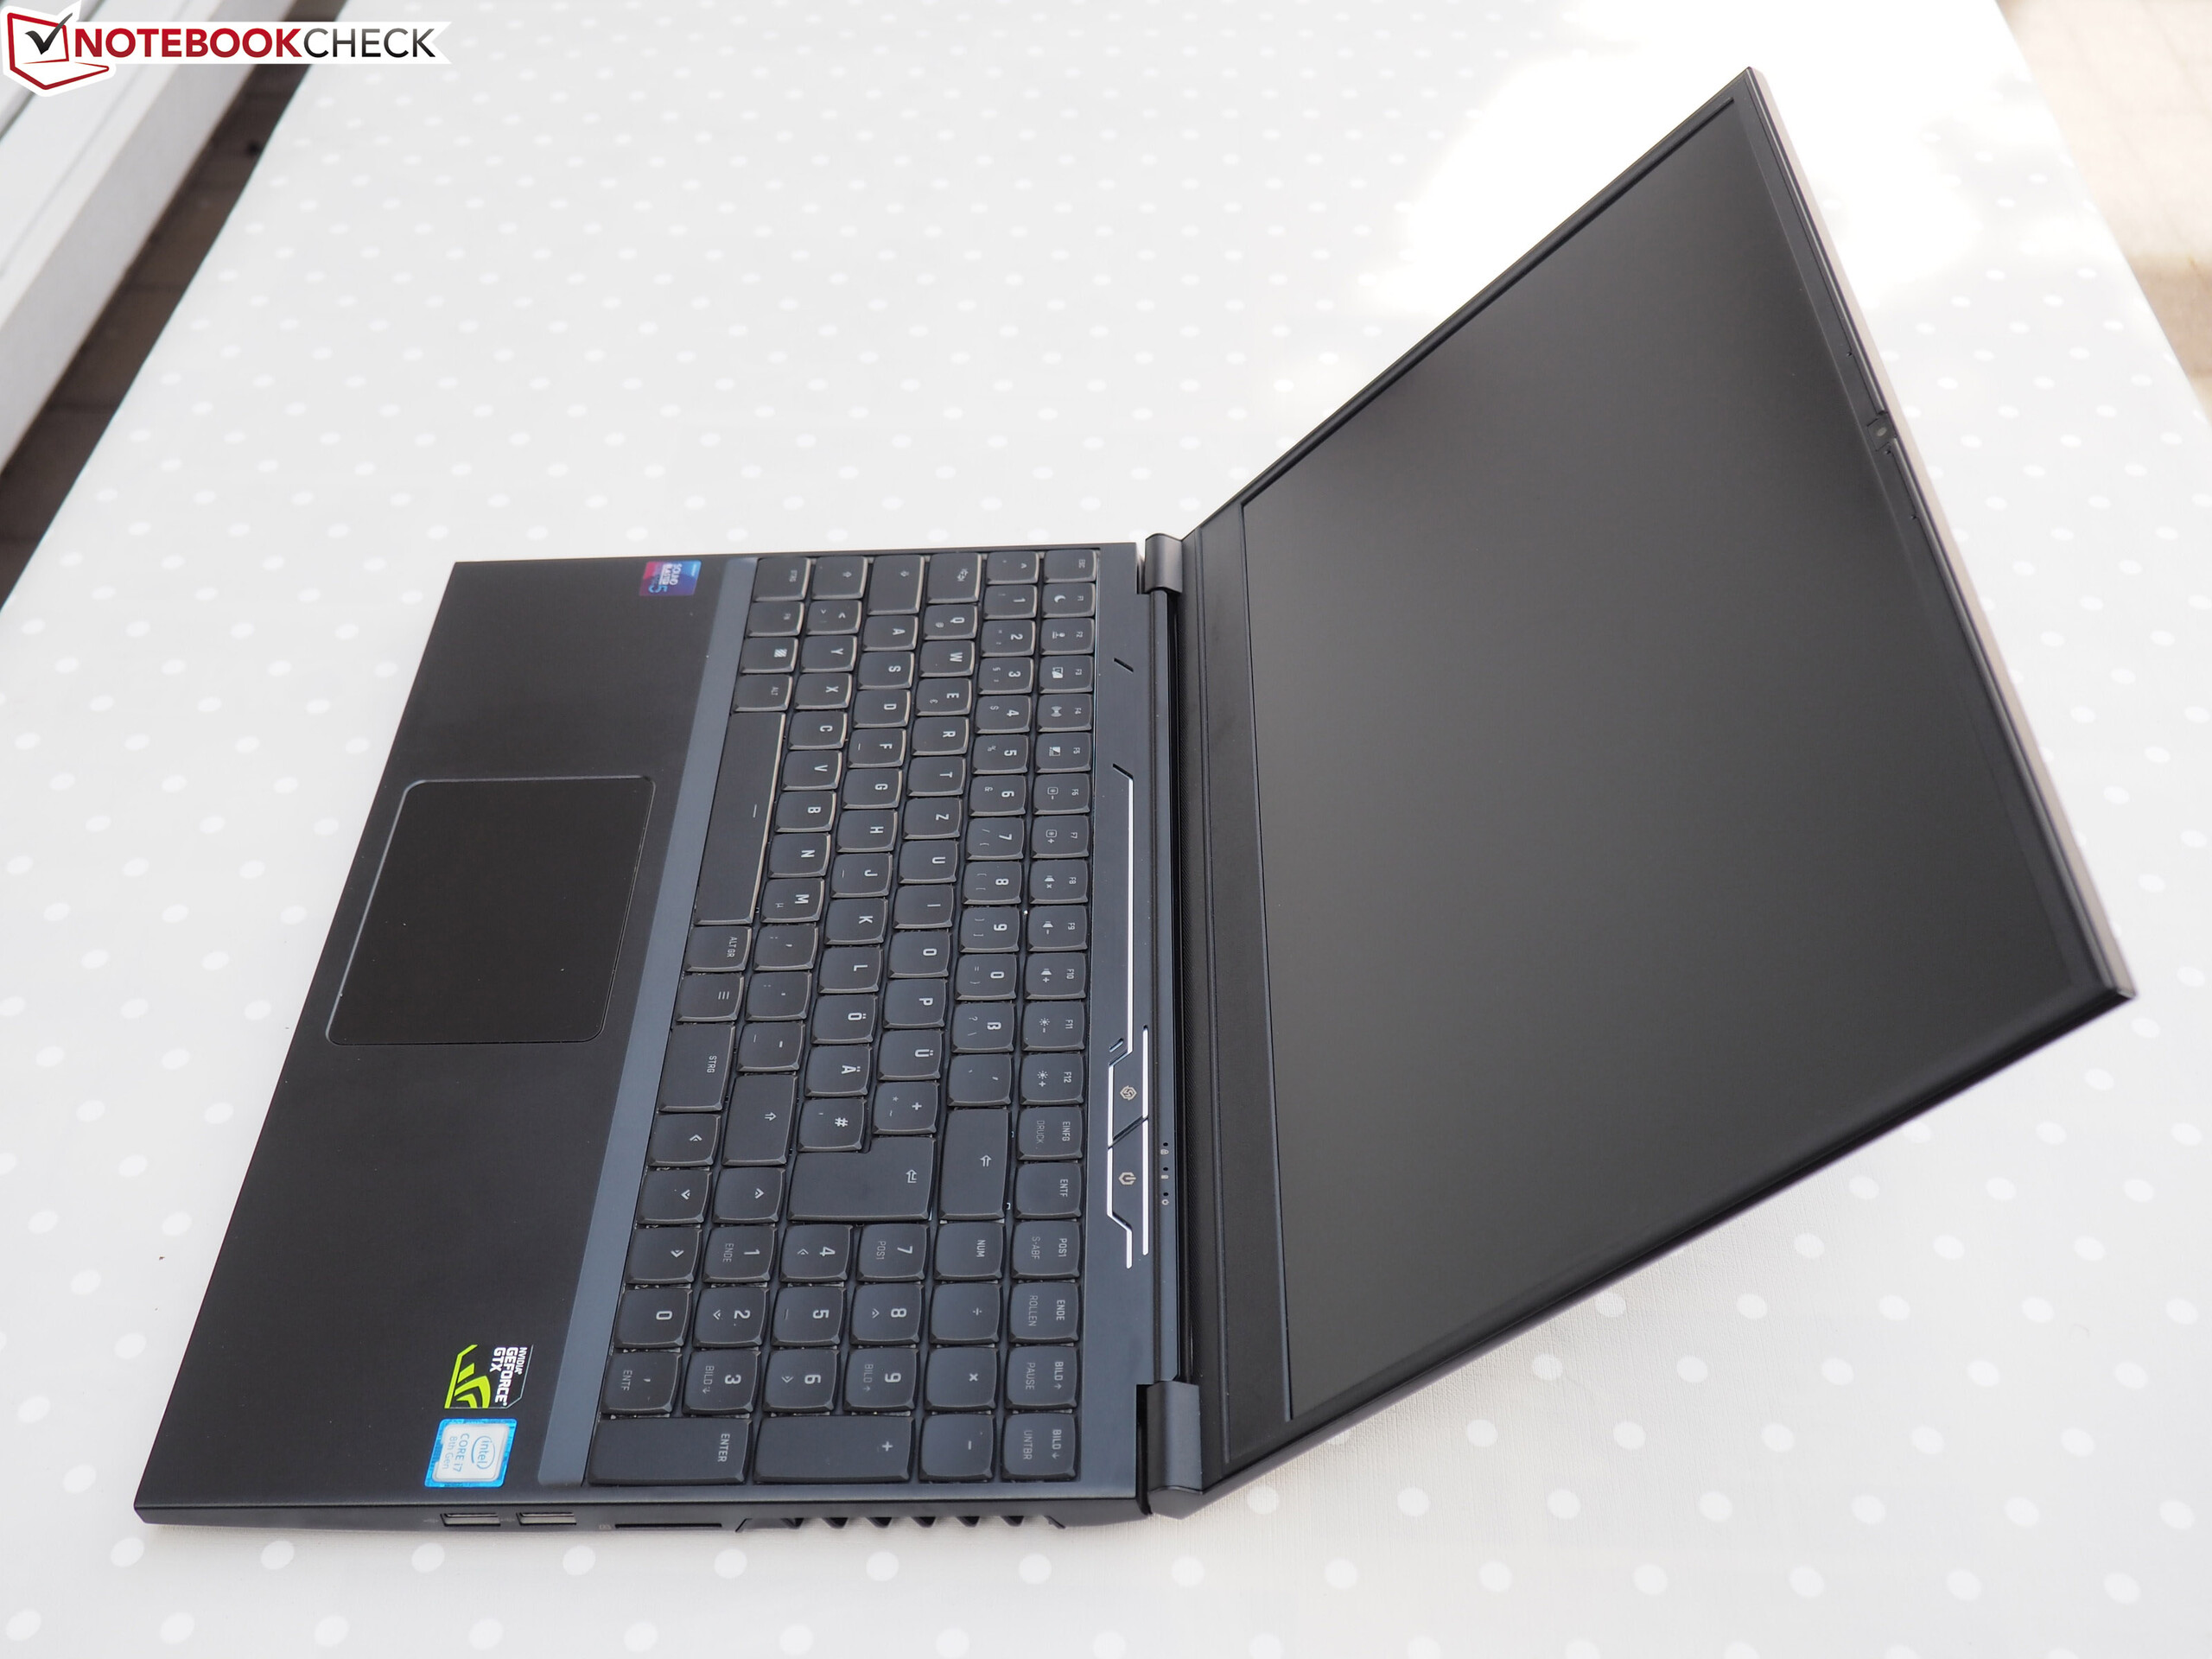
Também gostamos da tela: A combinação da tecnologia IPS, 144 Hz e design de marcos finos é quase tudo que você espera de um portátil caro em 2018.
Há também algumas desvantagens, como a qualidade do alto-falante e as emissões (temperatura, ruído). O Neo 15 não apenas esquenta bastante sob uso intenso, mas também é muito barulhento. O fabricante do Barebone, Tongfang, também deve trabalhar no controle do ventilador enquanto estiver no modo inativo e na capacidade da bateria, que deveria estar pelo menos em 70 Wh para uma melhor mobilidade.
Schenker XMG Neo 15
- 05/14/2020 v7 (old)
Florian Glaser
Price comparison