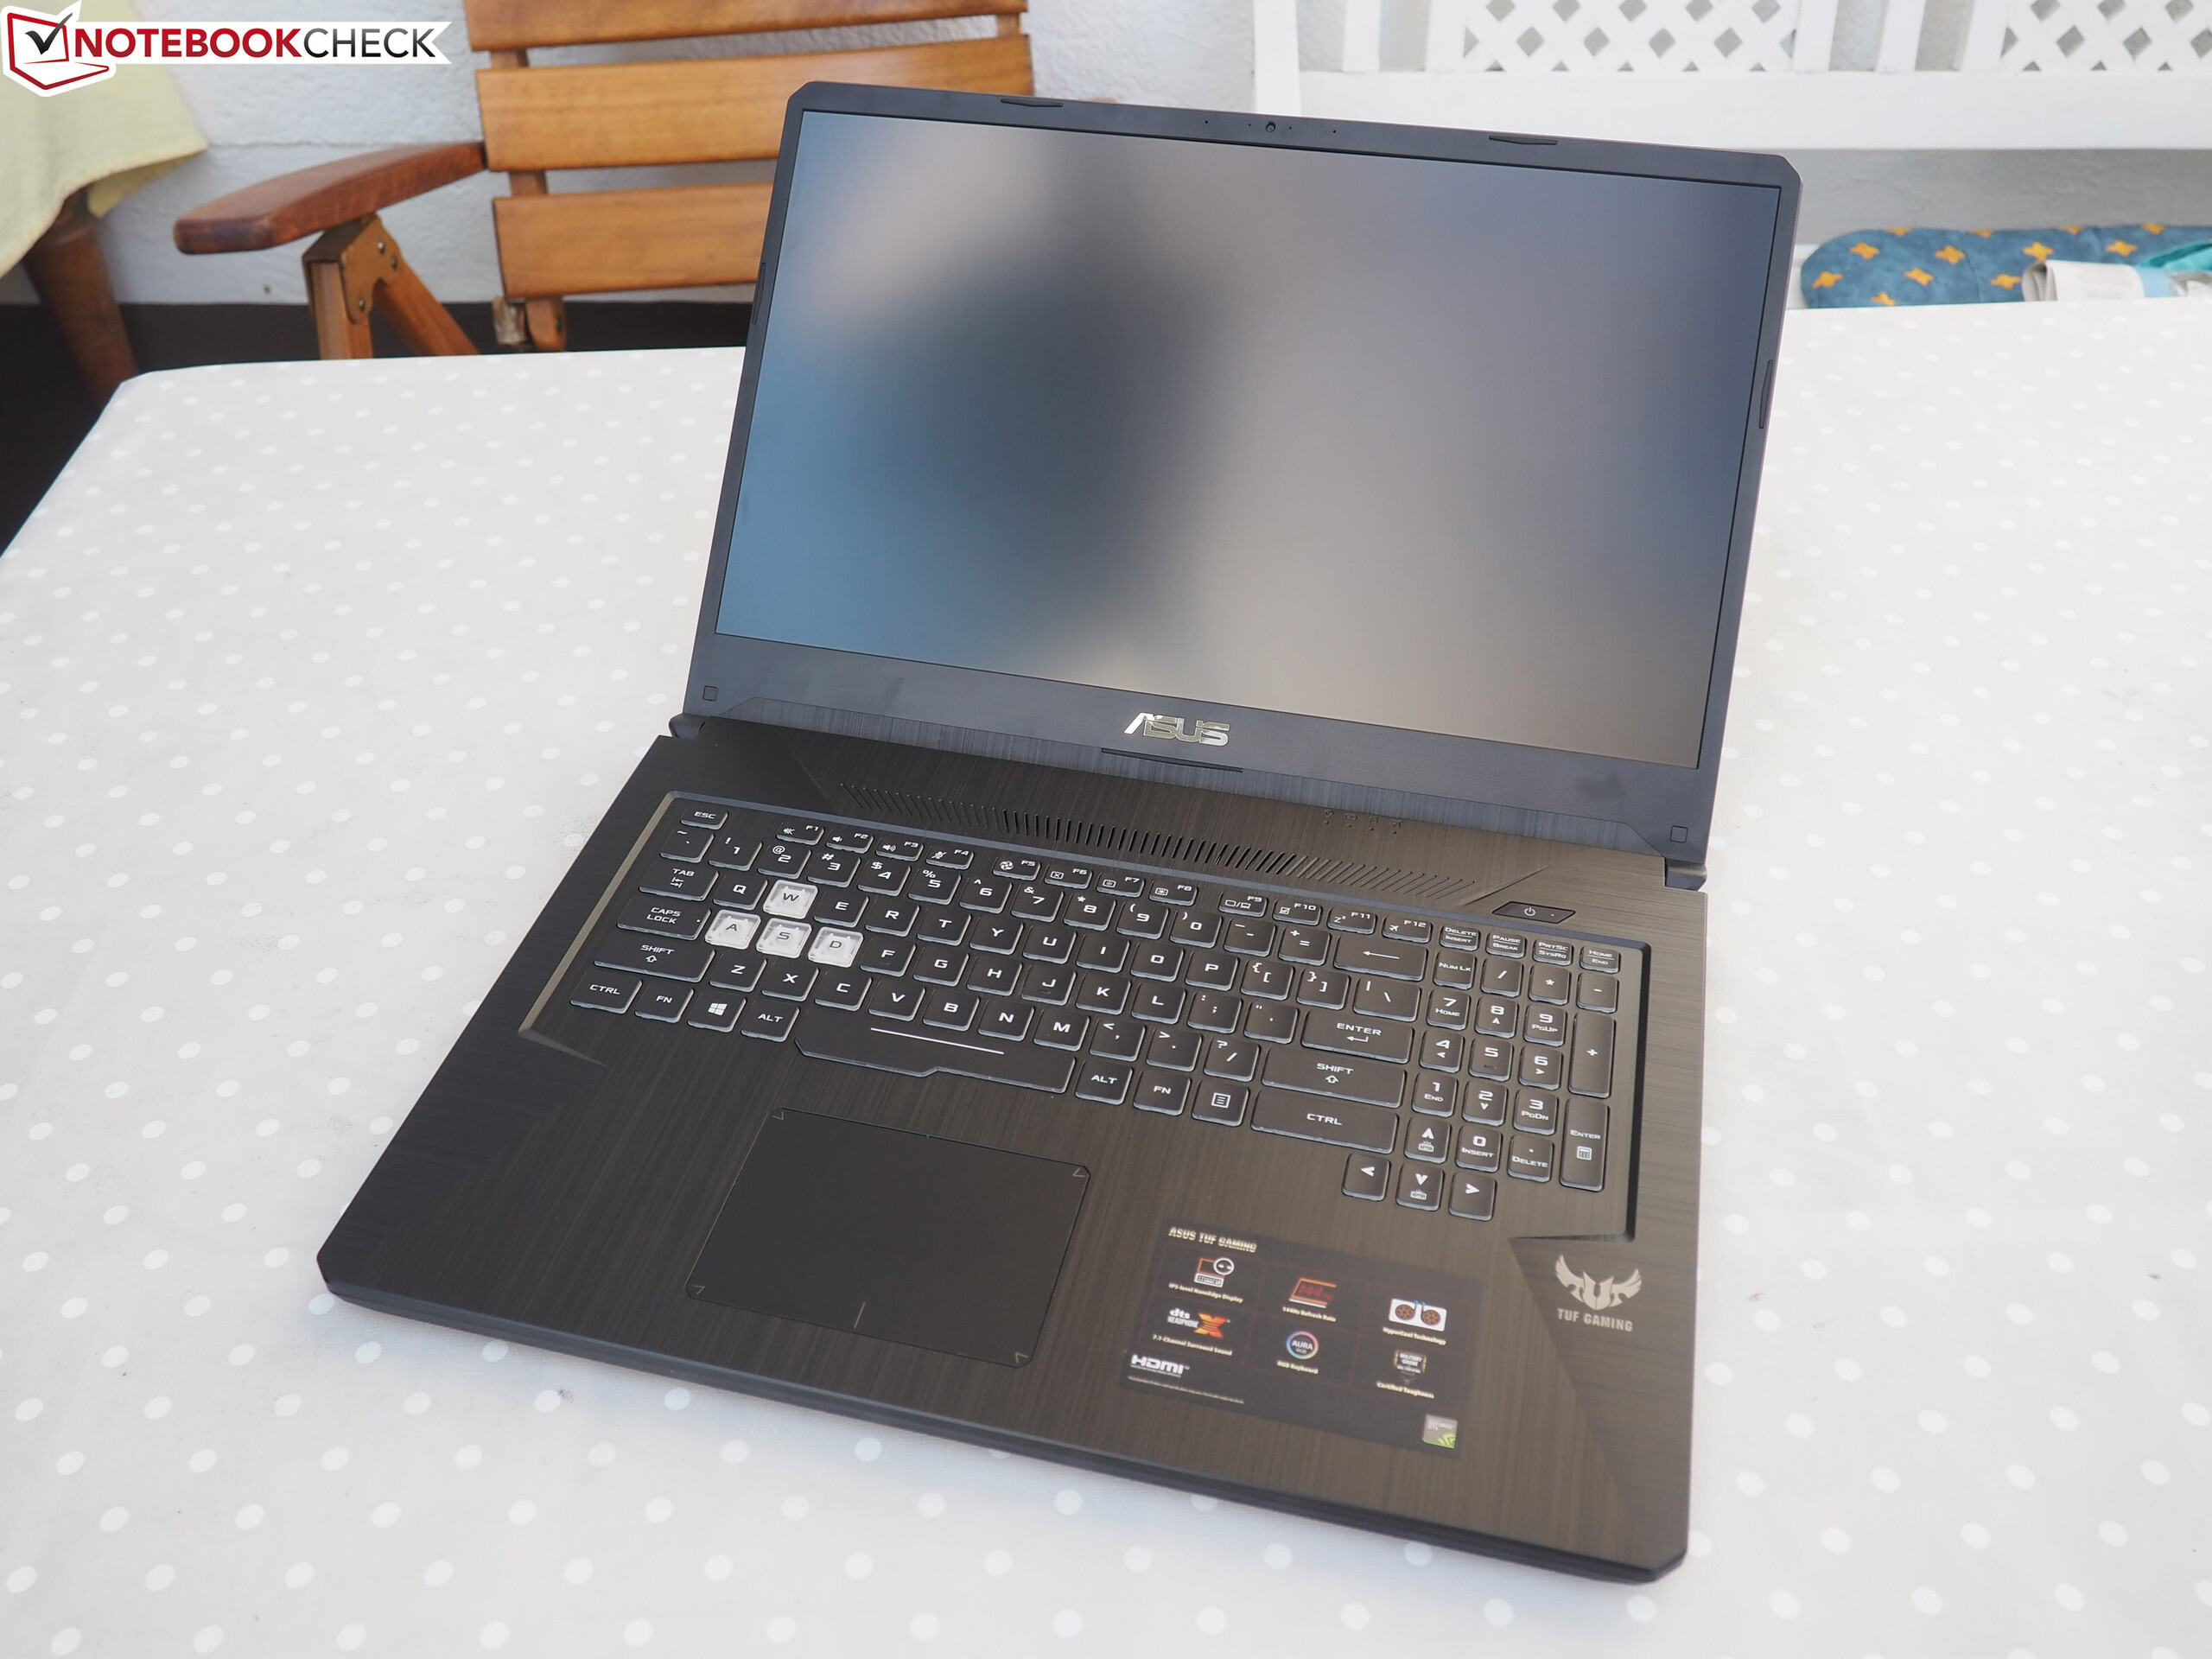
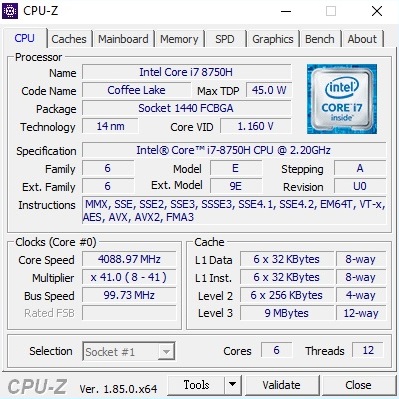
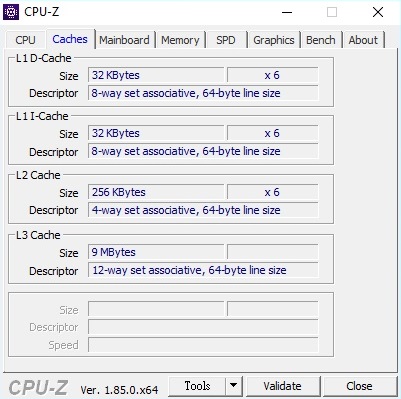
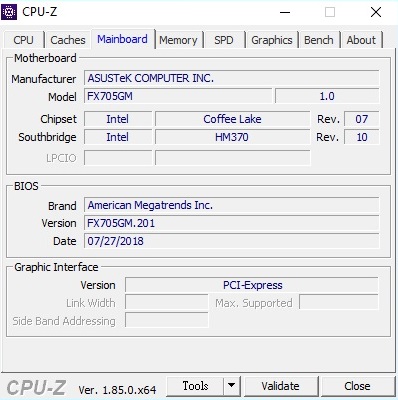
Breve Análise do Portátil Asus TUF FX705GM (i7-8750H, GTX 1060, FHD)
| Networking | |
| iperf3 transmit AX12 | |
| Asus TUF FX705GM | |
| Schenker XMG A707 Coffee Lake | |
| Acer Predator Helios 300 PH317-52-51M6 | |
| Asus Strix GL703GM-DS74 | |
| MSI GS73 Stealth 8RF-011 | |
| iperf3 receive AX12 | |
| Schenker XMG A707 Coffee Lake | |
| Acer Predator Helios 300 PH317-52-51M6 | |
| Asus TUF FX705GM | |
| Asus Strix GL703GM-DS74 | |
| MSI GS73 Stealth 8RF-011 | |
| |||||||||||||||||||||||||
iluminação: 85 %
iluminação com acumulador: 205 cd/m²
Contraste: 1170:1 (Preto: 0.2 cd/m²)
ΔE ColorChecker Calman: 2.16 | ∀{0.5-29.43 Ø4.72}
calibrated: 2.02
ΔE Greyscale Calman: 2 | ∀{0.09-98 Ø4.97}
89% sRGB (Argyll 1.6.3 3D)
58% AdobeRGB 1998 (Argyll 1.6.3 3D)
63.8% AdobeRGB 1998 (Argyll 3D)
88.8% sRGB (Argyll 3D)
62.4% Display P3 (Argyll 3D)
Gamma: 2.46
CCT: 6394 K
| Asus TUF FX705GM AU Optronics B173HAN04.0 (AUO409D), IPS, 1920x1080 | Asus Strix GL703GM-DS74 Chi Mei CMN1747 M173JJE-G32, TN LED, 1920x1080 | MSI GS73 Stealth 8RF-011 CMN N173HHE-G32 (CMN1747), TN, 1920x1080 | Schenker XMG A707 Coffee Lake LG Philips LP173WF4-SPF5 (LGD056D), IPS, 1920x1080 | Acer Predator Helios 300 PH317-52-51M6 LG Philips LP173WF4-SPF5 (LGD056D), IPS, 1920x1080 | |
|---|---|---|---|---|---|
| Display | 30% | 31% | -1% | 1% | |
| Display P3 Coverage (%) | 62.4 | 90 44% | 90.8 46% | 66.1 6% | 67.1 8% |
| sRGB Coverage (%) | 88.8 | 100 13% | 99.9 13% | 84.4 -5% | 86.1 -3% |
| AdobeRGB 1998 Coverage (%) | 63.8 | 84.8 33% | 85.8 34% | 61.7 -3% | 63 -1% |
| Response Times | 4% | 17% | -281% | -253% | |
| Response Time Grey 50% / Grey 80% * (ms) | 7.4 ? | 8.8 ? -19% | 7.8 ? -5% | 39.2 ? -430% | 36 ? -386% |
| Response Time Black / White * (ms) | 10 ? | 7.4 ? 26% | 6.2 ? 38% | 23.2 ? -132% | 22 ? -120% |
| PWM Frequency (Hz) | 25510 ? | 25510 ? | 119000 ? | 122000 ? | |
| Screen | -33% | -15% | -61% | -68% | |
| Brightness middle (cd/m²) | 234 | 297.8 27% | 262 12% | 362 55% | 365 56% |
| Brightness (cd/m²) | 228 | 285 25% | 261 14% | 350 54% | 341 50% |
| Brightness Distribution (%) | 85 | 84 -1% | 94 11% | 91 7% | 89 5% |
| Black Level * (cd/m²) | 0.2 | 0.33 -65% | 0.2 -0% | 0.29 -45% | 0.32 -60% |
| Contrast (:1) | 1170 | 902 -23% | 1310 12% | 1248 7% | 1141 -2% |
| Colorchecker dE 2000 * | 2.16 | 3.68 -70% | 3.96 -83% | 6.06 -181% | 6.51 -201% |
| Colorchecker dE 2000 max. * | 3.39 | 7.71 -127% | 7.29 -115% | 11.6 -242% | 12.32 -263% |
| Colorchecker dE 2000 calibrated * | 2.02 | 2.71 -34% | 2.18 -8% | 3.13 -55% | 2.9 -44% |
| Greyscale dE 2000 * | 2 | 5 -150% | 3.09 -55% | 7.22 -261% | 7.65 -283% |
| Gamma | 2.46 89% | 2.06 107% | 2.48 89% | 2.51 88% | 2.64 83% |
| CCT | 6394 102% | 6728 97% | 6977 93% | 7659 85% | 8066 81% |
| Color Space (Percent of AdobeRGB 1998) (%) | 58 | 84.77 46% | 76 31% | 55 -5% | 56 -3% |
| Color Space (Percent of sRGB) (%) | 89 | 99.97 12% | 100 12% | 84 -6% | 86 -3% |
| Média Total (Programa/Configurações) | 0% /
-16% | 11% /
-3% | -114% /
-77% | -107% /
-78% |
* ... menor é melhor
Exibir tempos de resposta
| ↔ Tempo de resposta preto para branco | ||
|---|---|---|
| 10 ms ... ascensão ↗ e queda ↘ combinadas | ↗ 4.8 ms ascensão | 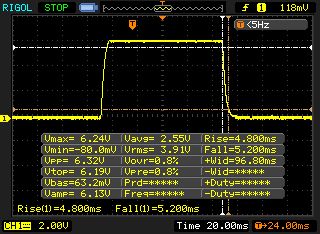 |
| ↘ 5.2 ms queda | ||
| A tela mostra boas taxas de resposta em nossos testes, mas pode ser muito lenta para jogadores competitivos. Em comparação, todos os dispositivos testados variam de 0.1 (mínimo) a 240 (máximo) ms. » 27 % de todos os dispositivos são melhores. Isso significa que o tempo de resposta medido é melhor que a média de todos os dispositivos testados (19.8 ms). | ||
| ↔ Tempo de resposta 50% cinza a 80% cinza | ||
| 7.4 ms ... ascensão ↗ e queda ↘ combinadas | ↗ 3.8 ms ascensão | 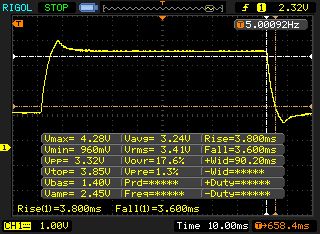 |
| ↘ 3.6 ms queda | ||
| A tela mostra taxas de resposta muito rápidas em nossos testes e deve ser muito adequada para jogos em ritmo acelerado. Em comparação, todos os dispositivos testados variam de 0.165 (mínimo) a 636 (máximo) ms. » 20 % de todos os dispositivos são melhores. Isso significa que o tempo de resposta medido é melhor que a média de todos os dispositivos testados (31 ms). | ||
Cintilação da tela / PWM (modulação por largura de pulso)
| Tela tremeluzindo / PWM não detectado | 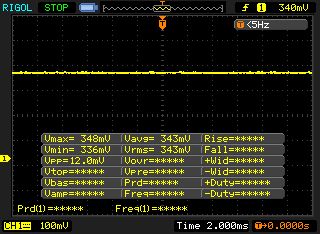 | ||
[pwm_comparison] Em comparação: 52 % de todos os dispositivos testados não usam PWM para escurecer a tela. Se PWM foi detectado, uma média de 7747 (mínimo: 5 - máximo: 343500) Hz foi medida. | |||
| Cinebench R15 | |
| CPU Single 64Bit | |
| Média da turma Gaming (188.8 - 344, n=105, últimos 2 anos) | |
| MSI GS73 Stealth 8RF-011 | |
| Asus TUF FX705GM | |
| Schenker XMG A707 Coffee Lake | |
| Acer Predator Helios 300 PH317-52-51M6 | |
| Asus Strix GL703GM-DS74 | |
| CPU Multi 64Bit | |
| Média da turma Gaming (1578 - 6271, n=104, últimos 2 anos) | |
| Asus TUF FX705GM | |
| MSI GS73 Stealth 8RF-011 | |
| Schenker XMG A707 Coffee Lake | |
| Asus Strix GL703GM-DS74 | |
| Acer Predator Helios 300 PH317-52-51M6 | |
| Cinebench R11.5 | |
| CPU Single 64Bit | |
| Média da turma Gaming (3.3 - 3.98, n=8, últimos 2 anos) | |
| Asus TUF FX705GM | |
| Schenker XMG A707 Coffee Lake | |
| MSI GS73 Stealth 8RF-011 | |
| Acer Predator Helios 300 PH317-52-51M6 | |
| Asus Strix GL703GM-DS74 | |
| CPU Multi 64Bit | |
| Média da turma Gaming (29.8 - 70.7, n=8, últimos 2 anos) | |
| Asus TUF FX705GM | |
| MSI GS73 Stealth 8RF-011 | |
| Schenker XMG A707 Coffee Lake | |
| Asus Strix GL703GM-DS74 | |
| Acer Predator Helios 300 PH317-52-51M6 | |
| PCMark 10 - Score | |
| Média da turma Gaming (5828 - 11730, n=92, últimos 2 anos) | |
| Asus Strix GL703GM-DS74 | |
| Asus TUF FX705GM | |
| Schenker XMG A707 Coffee Lake | |
| PCMark 8 | |
| Home Score Accelerated v2 | |
| Média da turma Gaming (n=1últimos 2 anos) | |
| Asus Strix GL703GM-DS74 | |
| Asus TUF FX705GM | |
| MSI GS73 Stealth 8RF-011 | |
| Acer Predator Helios 300 PH317-52-51M6 | |
| Schenker XMG A707 Coffee Lake | |
| Work Score Accelerated v2 | |
| Asus TUF FX705GM | |
| Asus Strix GL703GM-DS74 | |
| Schenker XMG A707 Coffee Lake | |
| Acer Predator Helios 300 PH317-52-51M6 | |
| MSI GS73 Stealth 8RF-011 | |
| Média da turma Gaming (n=1últimos 2 anos) | |
| PCMark 8 Home Score Accelerated v2 | 4660 pontos | |
| PCMark 8 Work Score Accelerated v2 | 5719 pontos | |
| PCMark 10 Score | 5169 pontos | |
Ajuda | ||
| Asus TUF FX705GM WDC PC SN520 SDAPNUW-256G | Asus Strix GL703GM-DS74 Samsung PM961 MZVLW256HEHP | MSI GS73 Stealth 8RF-011 Samsung PM961 MZVLW256HEHP | Schenker XMG A707 Coffee Lake Samsung SSD 970 EVO 250GB | Acer Predator Helios 300 PH317-52-51M6 Hynix HFS128G39TND | |
|---|---|---|---|---|---|
| AS SSD | 8% | 12% | 34% | -61% | |
| Seq Read (MB/s) | 1571 | 1993 27% | 1749 11% | 2589 65% | 513 -67% |
| Seq Write (MB/s) | 1236 | 1031 -17% | 1173 -5% | 1449 17% | 128.2 -90% |
| 4K Read (MB/s) | 38.49 | 35.76 -7% | 42.81 11% | 52.8 37% | 26.5 -31% |
| 4K Write (MB/s) | 101.9 | 88.4 -13% | 98.4 -3% | 112.3 10% | 62.7 -38% |
| Score Read (Points) | 913 | 1520 66% | 1456 59% | 1153 26% | 414 -55% |
| Score Write (Points) | 1082 | 825 -24% | 906 -16% | 1592 47% | 196 -82% |
| Score Total (Points) | 2458 | 3075 25% | 3083 25% | 3291 34% | 811 -67% |

| 3DMark 11 - 1280x720 Performance GPU | |
| Média da turma Gaming (21841 - 80022, n=103, últimos 2 anos) | |
| MSI GS73 Stealth 8RF-011 | |
| Asus Strix GL703GM-DS74 | |
| Asus TUF FX705GM | |
| Schenker XMG A707 Coffee Lake | |
| Acer Predator Helios 300 PH317-52-51M6 | |
| 3DMark 11 Performance | 13450 pontos | |
Ajuda | ||
| The Witcher 3 | |
| 1920x1080 High Graphics & Postprocessing (Nvidia HairWorks Off) | |
| Média da turma Gaming (n=1últimos 2 anos) | |
| MSI GS73 Stealth 8RF-011 | |
| Asus TUF FX705GM | |
| Asus Strix GL703GM-DS74 | |
| Acer Predator Helios 300 PH317-52-51M6 | |
| Schenker XMG A707 Coffee Lake | |
| 1920x1080 Ultra Graphics & Postprocessing (HBAO+) | |
| Média da turma Gaming (104.7 - 240, n=6, últimos 2 anos) | |
| MSI GS73 Stealth 8RF-011 | |
| Asus Strix GL703GM-DS74 | |
| Asus TUF FX705GM | |
| Acer Predator Helios 300 PH317-52-51M6 | |
| Schenker XMG A707 Coffee Lake | |
| baixo | média | alto | ultra | |
|---|---|---|---|---|
| The Witcher 3 (2015) | 66.2 | 36.5 | ||
| The Crew 2 (2018) | 60 | 60 | ||
| Monster Hunter World (2018) | 50.8 | 40.6 | ||
| F1 2018 (2018) | 92 | 58 | ||
| Shadow of the Tomb Raider (2018) | 53 | 47 | ||
| FIFA 19 (2018) | 205 | 203 | ||
| Forza Horizon 4 (2018) | 85 | 66 | ||
| Assassin´s Creed Odyssey (2018) | 52 | 37 | ||
| Call of Duty Black Ops 4 (2018) | 69.4 | 63.1 |
Barulho
| Ocioso |
| 32 / 33 / 44 dB |
| HDD |
| 33 dB |
| Carga |
| 46 / 50 dB |
 | ||
30 dB silencioso 40 dB(A) audível 50 dB(A) ruidosamente alto |
||
min: | ||
| Asus TUF FX705GM i7-8750H, GeForce GTX 1060 Mobile | Asus Strix GL703GM-DS74 i7-8750H, GeForce GTX 1060 Mobile | MSI GS73 Stealth 8RF-011 i7-8750H, GeForce GTX 1070 Max-Q | Schenker XMG A707 Coffee Lake i7-8750H, GeForce GTX 1050 Ti Mobile | Acer Predator Helios 300 PH317-52-51M6 i5-8300H, GeForce GTX 1050 Ti Mobile | Média da turma Gaming | |
|---|---|---|---|---|---|---|
| Noise | 8% | 6% | 4% | 7% | 14% | |
| desligado / ambiente * (dB) | 29 | 28.6 1% | 30 -3% | 29 -0% | 29 -0% | 24.1 ? 17% |
| Idle Minimum * (dB) | 32 | 29.4 8% | 30 6% | 31 3% | 29 9% | 25.9 ? 19% |
| Idle Average * (dB) | 33 | 29.4 11% | 34 -3% | 32 3% | 31 6% | 27.4 ? 17% |
| Idle Maximum * (dB) | 44 | 33.7 23% | 36 18% | 44 -0% | 33 25% | 30.1 ? 32% |
| Load Average * (dB) | 46 | 41.2 10% | 43 7% | 44 4% | 45 2% | 43.6 ? 5% |
| Witcher 3 ultra * (dB) | 48 | 47.3 1% | 45 6% | 42 12% | 45 6% | |
| Load Maximum * (dB) | 50 | 48.3 3% | 45 10% | 46 8% | 51 -2% | 54.2 ? -8% |
* ... menor é melhor
(-) A temperatura máxima no lado superior é 54 °C / 129 F, em comparação com a média de 40.4 °C / 105 F , variando de 21.2 a 68.8 °C para a classe Gaming.
(-) A parte inferior aquece até um máximo de 53 °C / 127 F, em comparação com a média de 43.2 °C / 110 F
(+) Em uso inativo, a temperatura média para o lado superior é 27.3 °C / 81 F, em comparação com a média do dispositivo de 33.9 °C / ### class_avg_f### F.
(-) Jogando The Witcher 3, a temperatura média para o lado superior é 39.8 °C / 104 F, em comparação com a média do dispositivo de 33.9 °C / ## #class_avg_f### F.
(+) Os apoios para as mãos e o touchpad são mais frios que a temperatura da pele, com um máximo de 31 °C / 87.8 F e, portanto, são frios ao toque.
(-) A temperatura média da área do apoio para as mãos de dispositivos semelhantes foi 28.8 °C / 83.8 F (-2.2 °C / -4 F).
| Asus TUF FX705GM i7-8750H, GeForce GTX 1060 Mobile | Asus Strix GL703GM-DS74 i7-8750H, GeForce GTX 1060 Mobile | MSI GS73 Stealth 8RF-011 i7-8750H, GeForce GTX 1070 Max-Q | Schenker XMG A707 Coffee Lake i7-8750H, GeForce GTX 1050 Ti Mobile | Acer Predator Helios 300 PH317-52-51M6 i5-8300H, GeForce GTX 1050 Ti Mobile | Média da turma Gaming | |
|---|---|---|---|---|---|---|
| Heat | -3% | -8% | -4% | -0% | 2% | |
| Maximum Upper Side * (°C) | 54 | 54.6 -1% | 58 -7% | 55 -2% | 50 7% | 45.2 ? 16% |
| Maximum Bottom * (°C) | 53 | 41.2 22% | 63 -19% | 49 8% | 52 2% | 48.2 ? 9% |
| Idle Upper Side * (°C) | 30 | 35 -17% | 32 -7% | 32 -7% | 33 -10% | 31 ? -3% |
| Idle Bottom * (°C) | 30 | 35.2 -17% | 30 -0% | 34 -13% | 30 -0% | 34.3 ? -14% |
* ... menor é melhor
Asus TUF FX705GM análise de áudio
(±) | o volume do alto-falante é médio, mas bom (###valor### dB)
Graves 100 - 315Hz
(-) | quase nenhum baixo - em média 16.1% menor que a mediana
(±) | a linearidade dos graves é média (11.5% delta para a frequência anterior)
Médios 400 - 2.000 Hz
(+) | médios equilibrados - apenas 4% longe da mediana
(+) | médios são lineares (5.7% delta para frequência anterior)
Altos 2 - 16 kHz
(±) | máximos mais altos - em média 5.1% maior que a mediana
(+) | os máximos são lineares (4.6% delta da frequência anterior)
Geral 100 - 16.000 Hz
(±) | a linearidade do som geral é média (21.6% diferença em relação à mediana)
Comparado com a mesma classe
» 77% de todos os dispositivos testados nesta classe foram melhores, 5% semelhantes, 18% piores
» O melhor teve um delta de 6%, a média foi 18%, o pior foi 132%
Comparado com todos os dispositivos testados
» 61% de todos os dispositivos testados foram melhores, 7% semelhantes, 32% piores
» O melhor teve um delta de 4%, a média foi 23%, o pior foi 134%
Asus Strix GL703GM-DS74 análise de áudio
(-) | alto-falantes não muito altos (###valor### dB)
Graves 100 - 315Hz
(±) | graves reduzidos - em média 7.3% menor que a mediana
(±) | a linearidade dos graves é média (10.8% delta para a frequência anterior)
Médios 400 - 2.000 Hz
(+) | médios equilibrados - apenas 2.2% longe da mediana
(+) | médios são lineares (5.6% delta para frequência anterior)
Altos 2 - 16 kHz
(+) | agudos equilibrados - apenas 4.2% longe da mediana
(±) | a linearidade dos máximos é média (13.1% delta para frequência anterior)
Geral 100 - 16.000 Hz
(±) | a linearidade do som geral é média (15.6% diferença em relação à mediana)
Comparado com a mesma classe
» 36% de todos os dispositivos testados nesta classe foram melhores, 6% semelhantes, 58% piores
» O melhor teve um delta de 6%, a média foi 18%, o pior foi 132%
Comparado com todos os dispositivos testados
» 23% de todos os dispositivos testados foram melhores, 5% semelhantes, 72% piores
» O melhor teve um delta de 4%, a média foi 23%, o pior foi 134%
| desligado | |
| Ocioso | |
| Carga |
|
Key:
min: | |
| Asus TUF FX705GM i7-8750H, GeForce GTX 1060 Mobile | Asus Strix GL703GM-DS74 i7-8750H, GeForce GTX 1060 Mobile | MSI GS73 Stealth 8RF-011 i7-8750H, GeForce GTX 1070 Max-Q | Schenker XMG A707 Coffee Lake i7-8750H, GeForce GTX 1050 Ti Mobile | Acer Predator Helios 300 PH317-52-51M6 i5-8300H, GeForce GTX 1050 Ti Mobile | Média da turma Gaming | |
|---|---|---|---|---|---|---|
| Power Consumption | -18% | 10% | 20% | 36% | -12% | |
| Idle Minimum * (Watt) | 13 | 18.88 -45% | 8 38% | 11 15% | 6 54% | 13 ? -0% |
| Idle Average * (Watt) | 17 | 24.36 -43% | 14 18% | 14 18% | 9 47% | 18.7 ? -10% |
| Idle Maximum * (Watt) | 24 | 32.27 -34% | 22 8% | 20 17% | 13 46% | 24.3 ? -1% |
| Load Average * (Watt) | 106 | 107.74 -2% | 92 13% | 96 9% | 95 10% | 110.2 ? -4% |
| Witcher 3 ultra * (Watt) | 151 | 142 6% | 154 -2% | 97 36% | 102 32% | |
| Load Maximum * (Watt) | 179 | 160.28 10% | 207 -16% | 136 24% | 134 25% | 258 ? -44% |
* ... menor é melhor
| Asus TUF FX705GM i7-8750H, GeForce GTX 1060 Mobile, 64 Wh | Asus Strix GL703GM-DS74 i7-8750H, GeForce GTX 1060 Mobile, 74 Wh | MSI GS73 Stealth 8RF-011 i7-8750H, GeForce GTX 1070 Max-Q, 51 Wh | Schenker XMG A707 Coffee Lake i7-8750H, GeForce GTX 1050 Ti Mobile, 62 Wh | Acer Predator Helios 300 PH317-52-51M6 i5-8300H, GeForce GTX 1050 Ti Mobile, 48 Wh | Média da turma Gaming | |
|---|---|---|---|---|---|---|
| Duração da bateria | -20% | -24% | 59% | 41% | 48% | |
| Reader / Idle (h) | 6.3 | 5.3 -16% | 5.8 -8% | 11.7 86% | 11.8 87% | 8.71 ? 38% |
| H.264 (h) | 4.3 | 8.64 ? 101% | ||||
| WiFi v1.3 (h) | 4.5 | 3.6 -20% | 3.3 -27% | 6.3 40% | 5.9 31% | 7.15 ? 59% |
| Load (h) | 1.6 | 1.2 -25% | 1 -37% | 2.4 50% | 1.7 6% | 1.502 ? -6% |
Pro
Contra
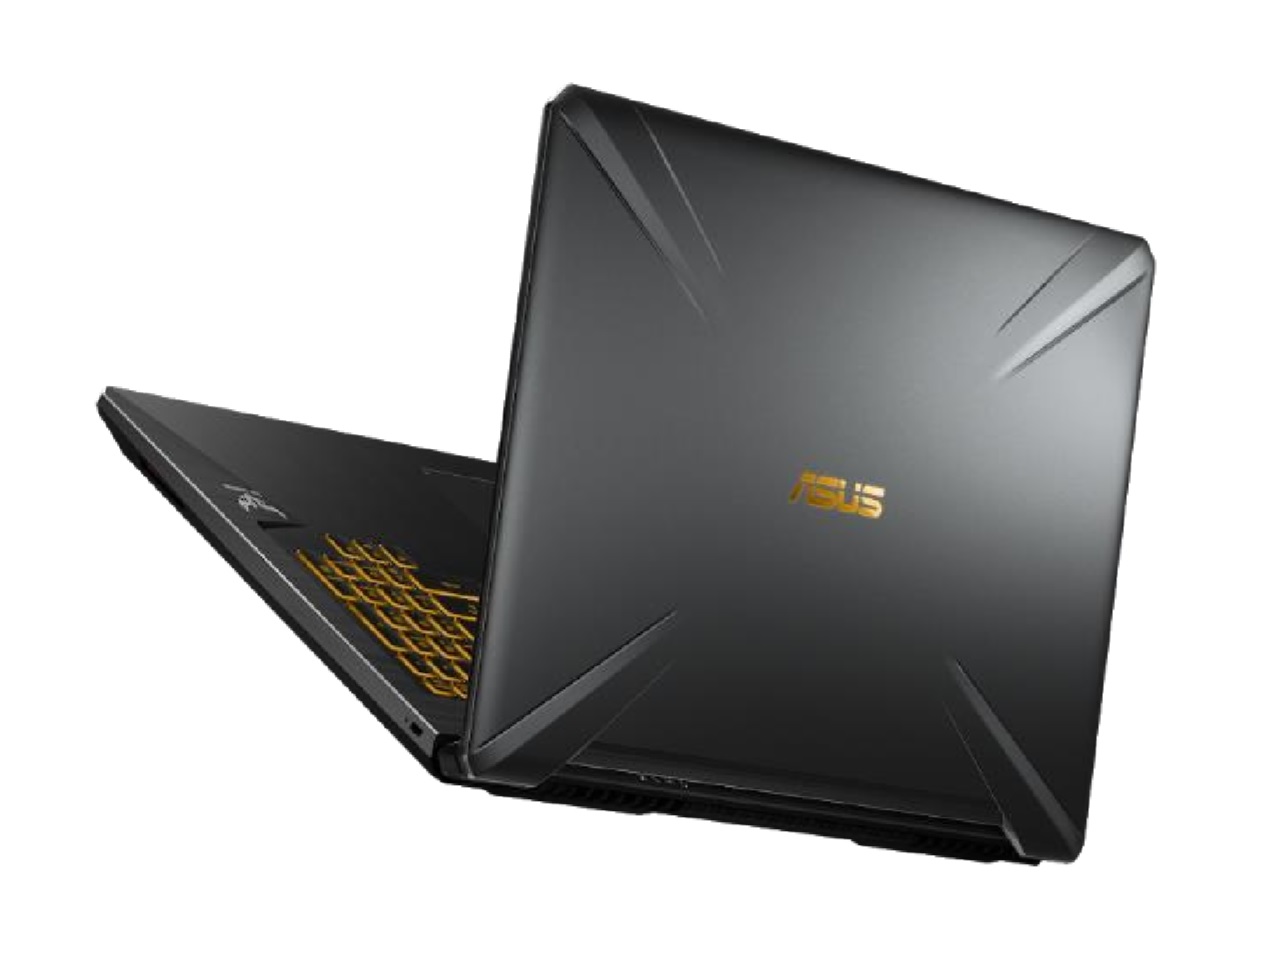
Com a série TUF, a Asus mostra que portáteis de jogos potentes não precisam ser escandalosamente caros.
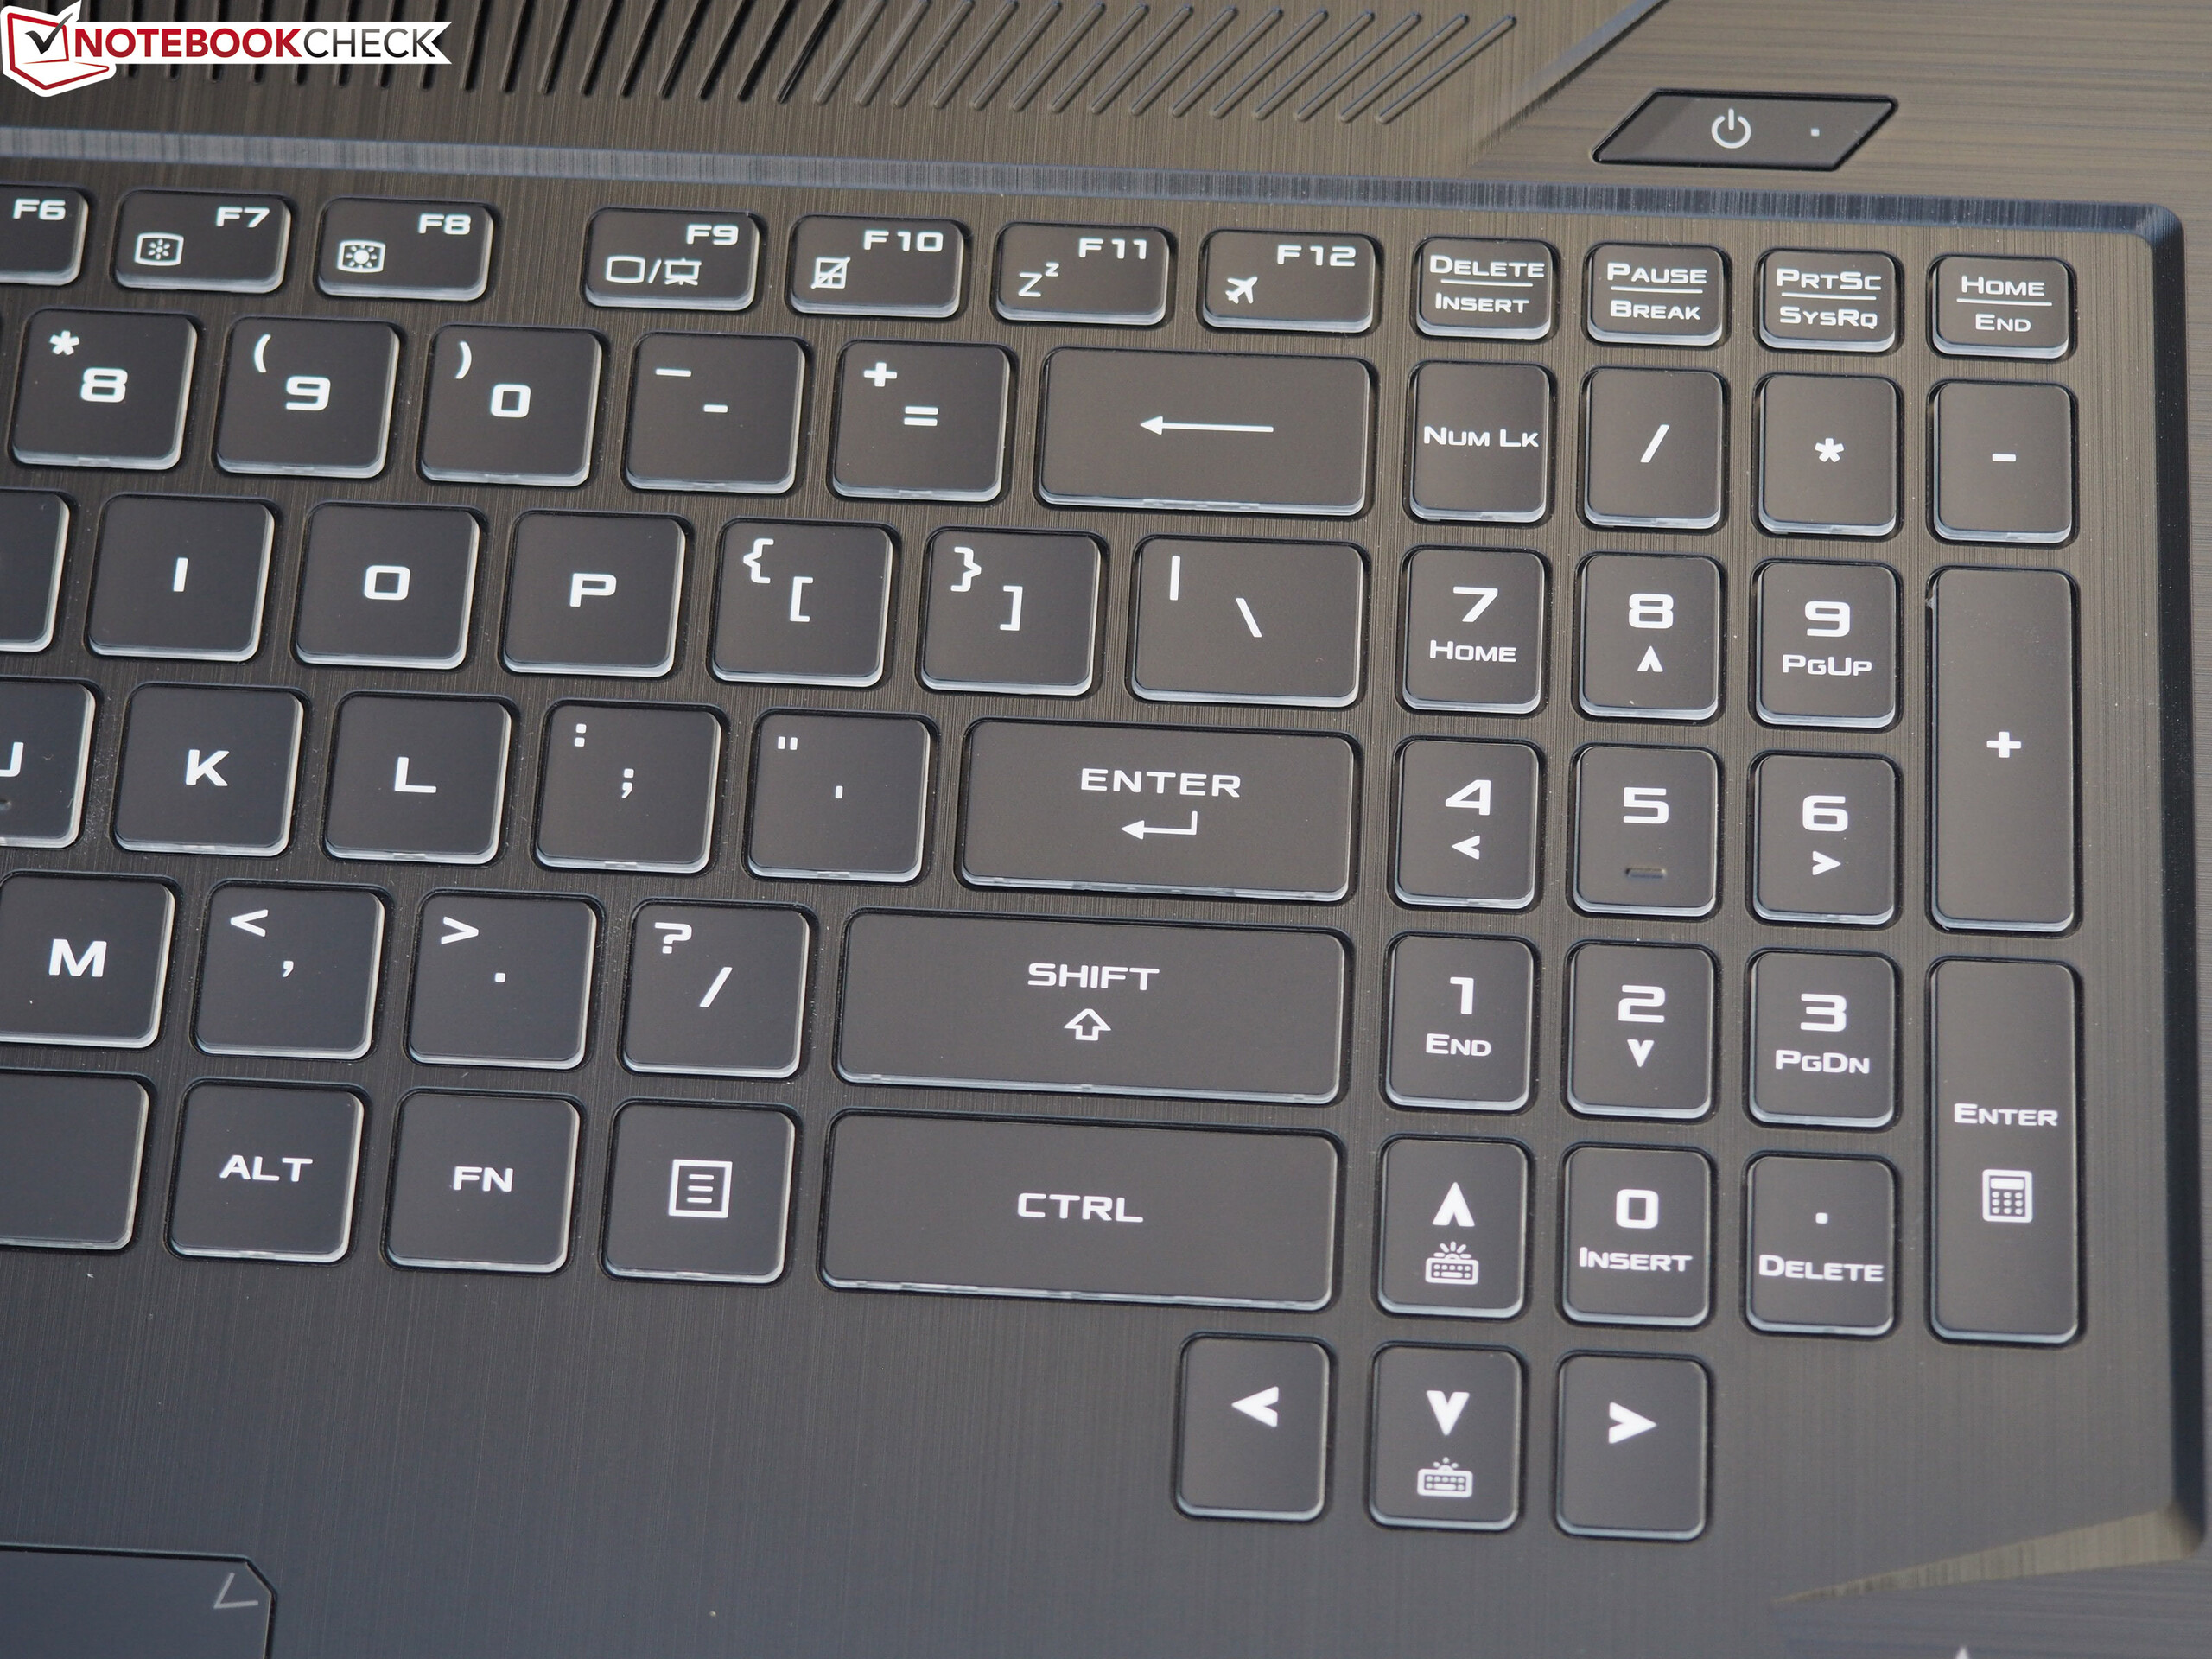
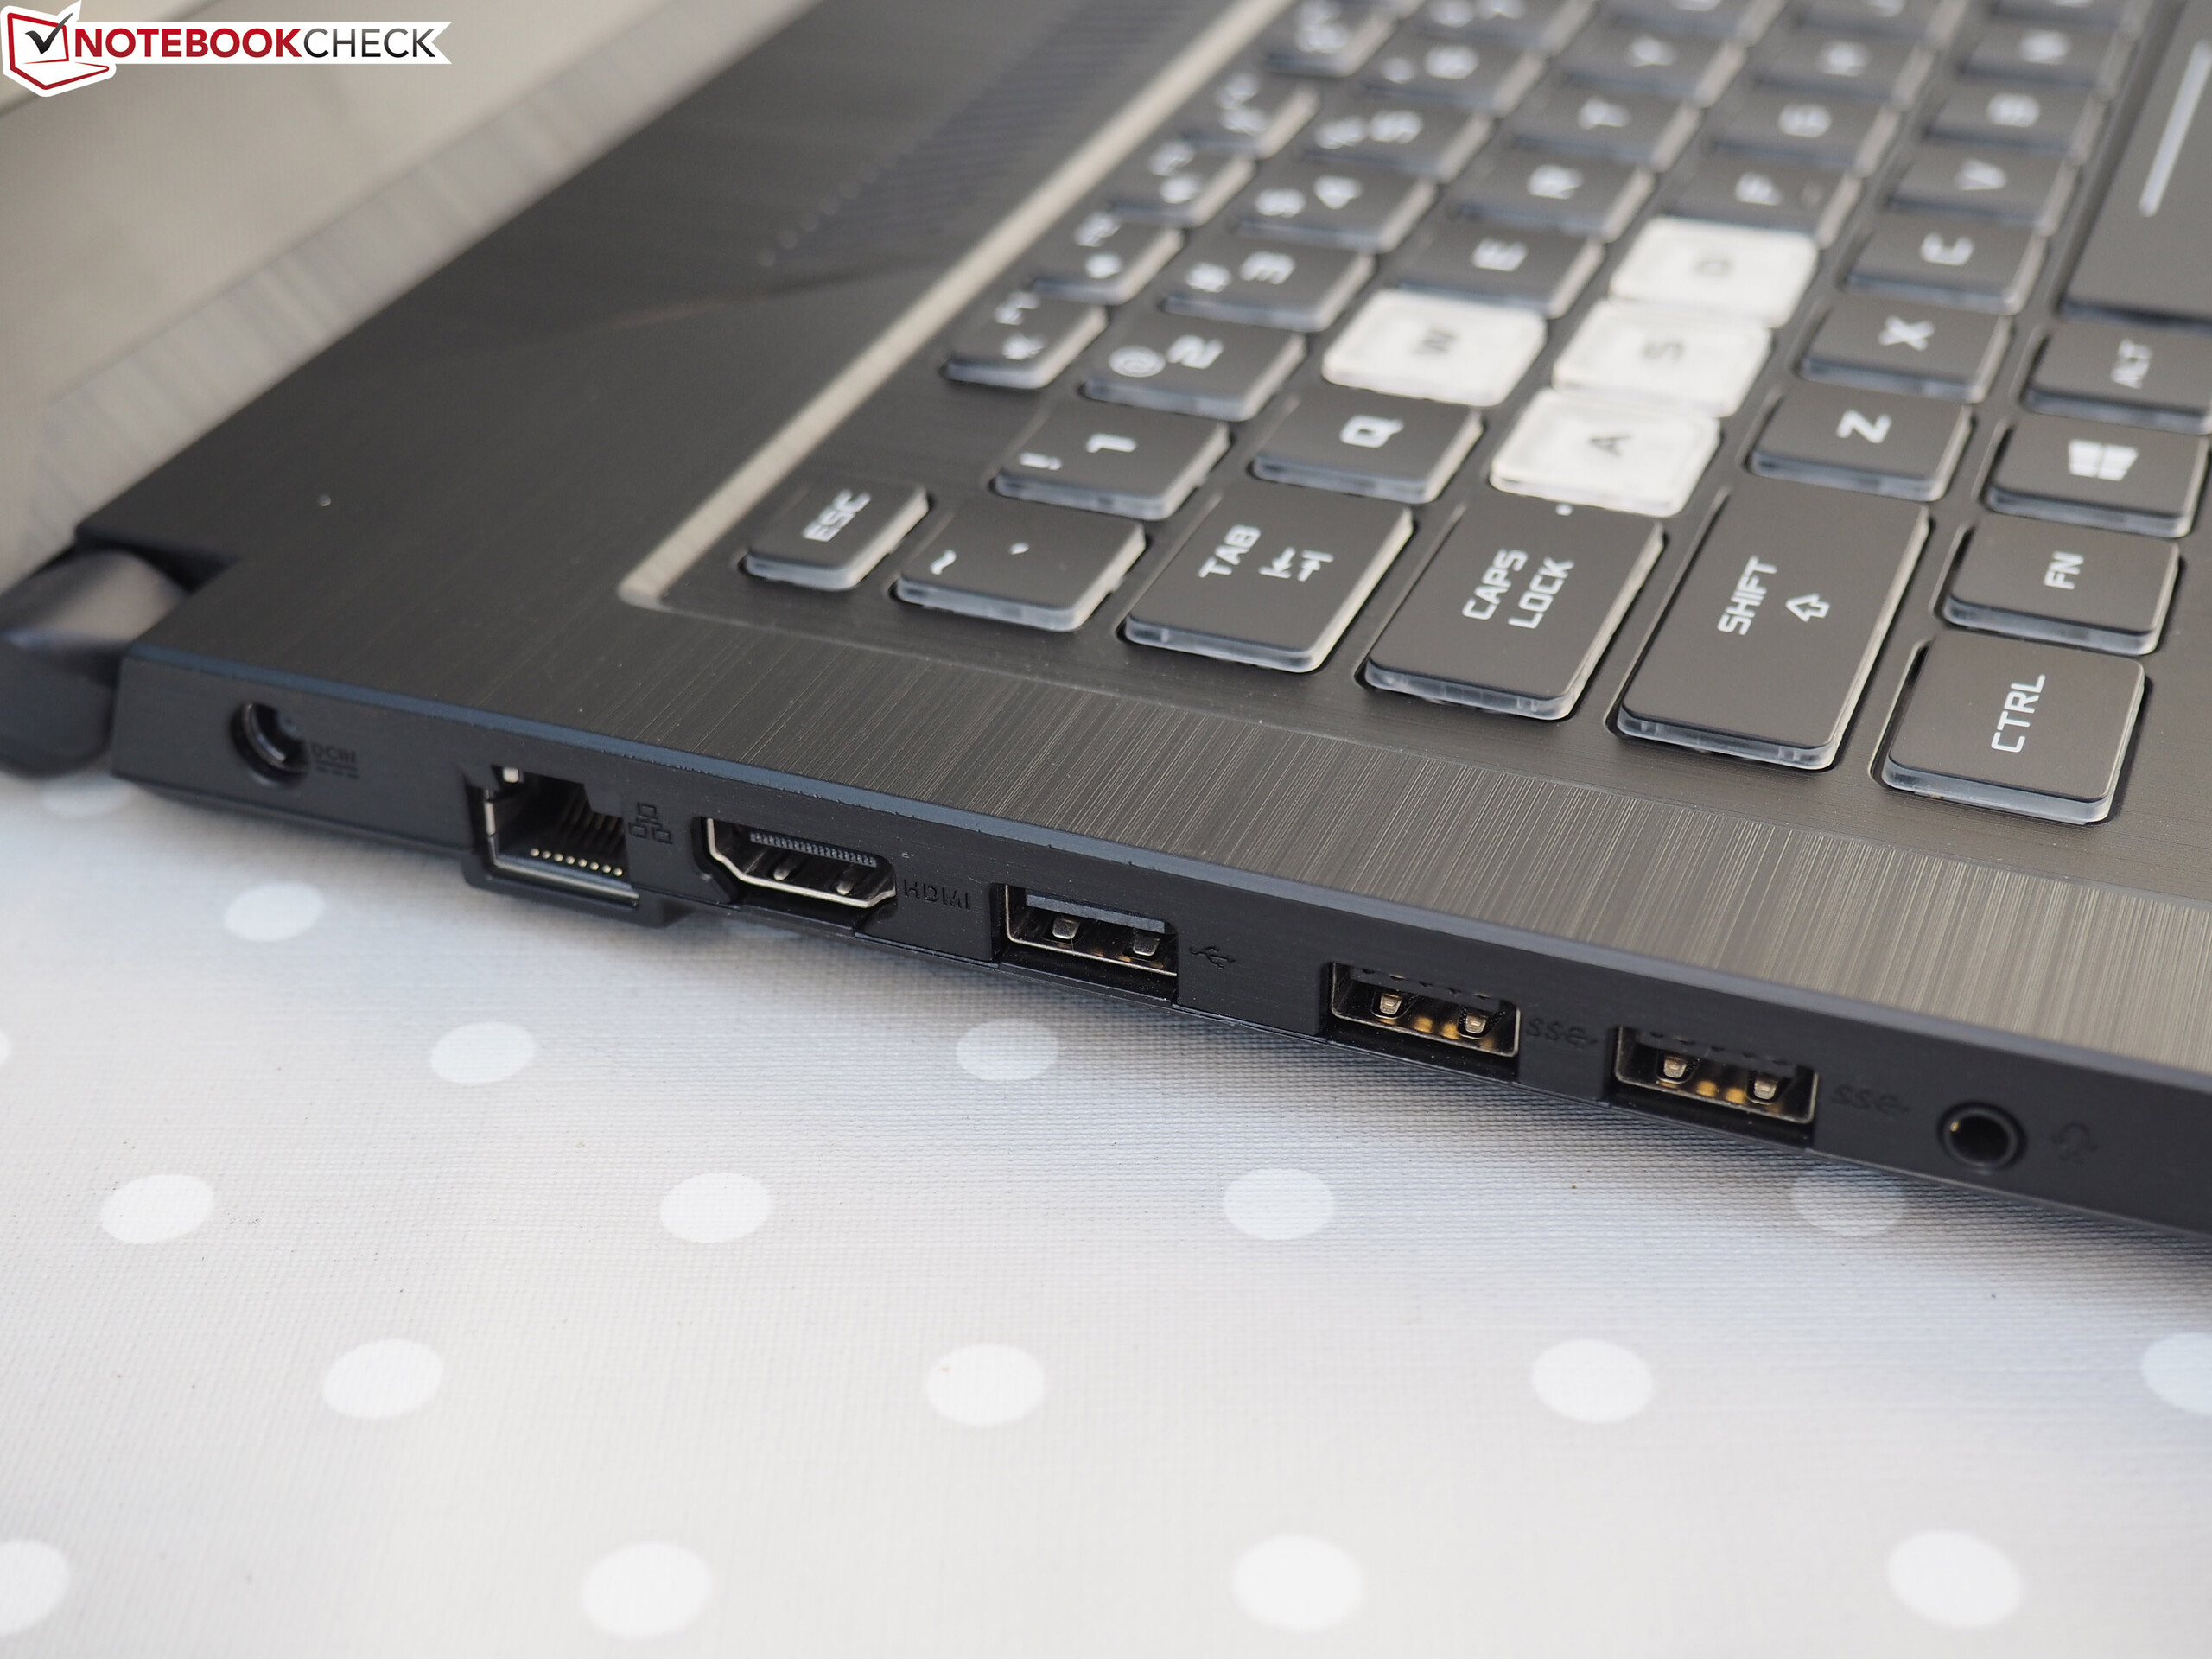
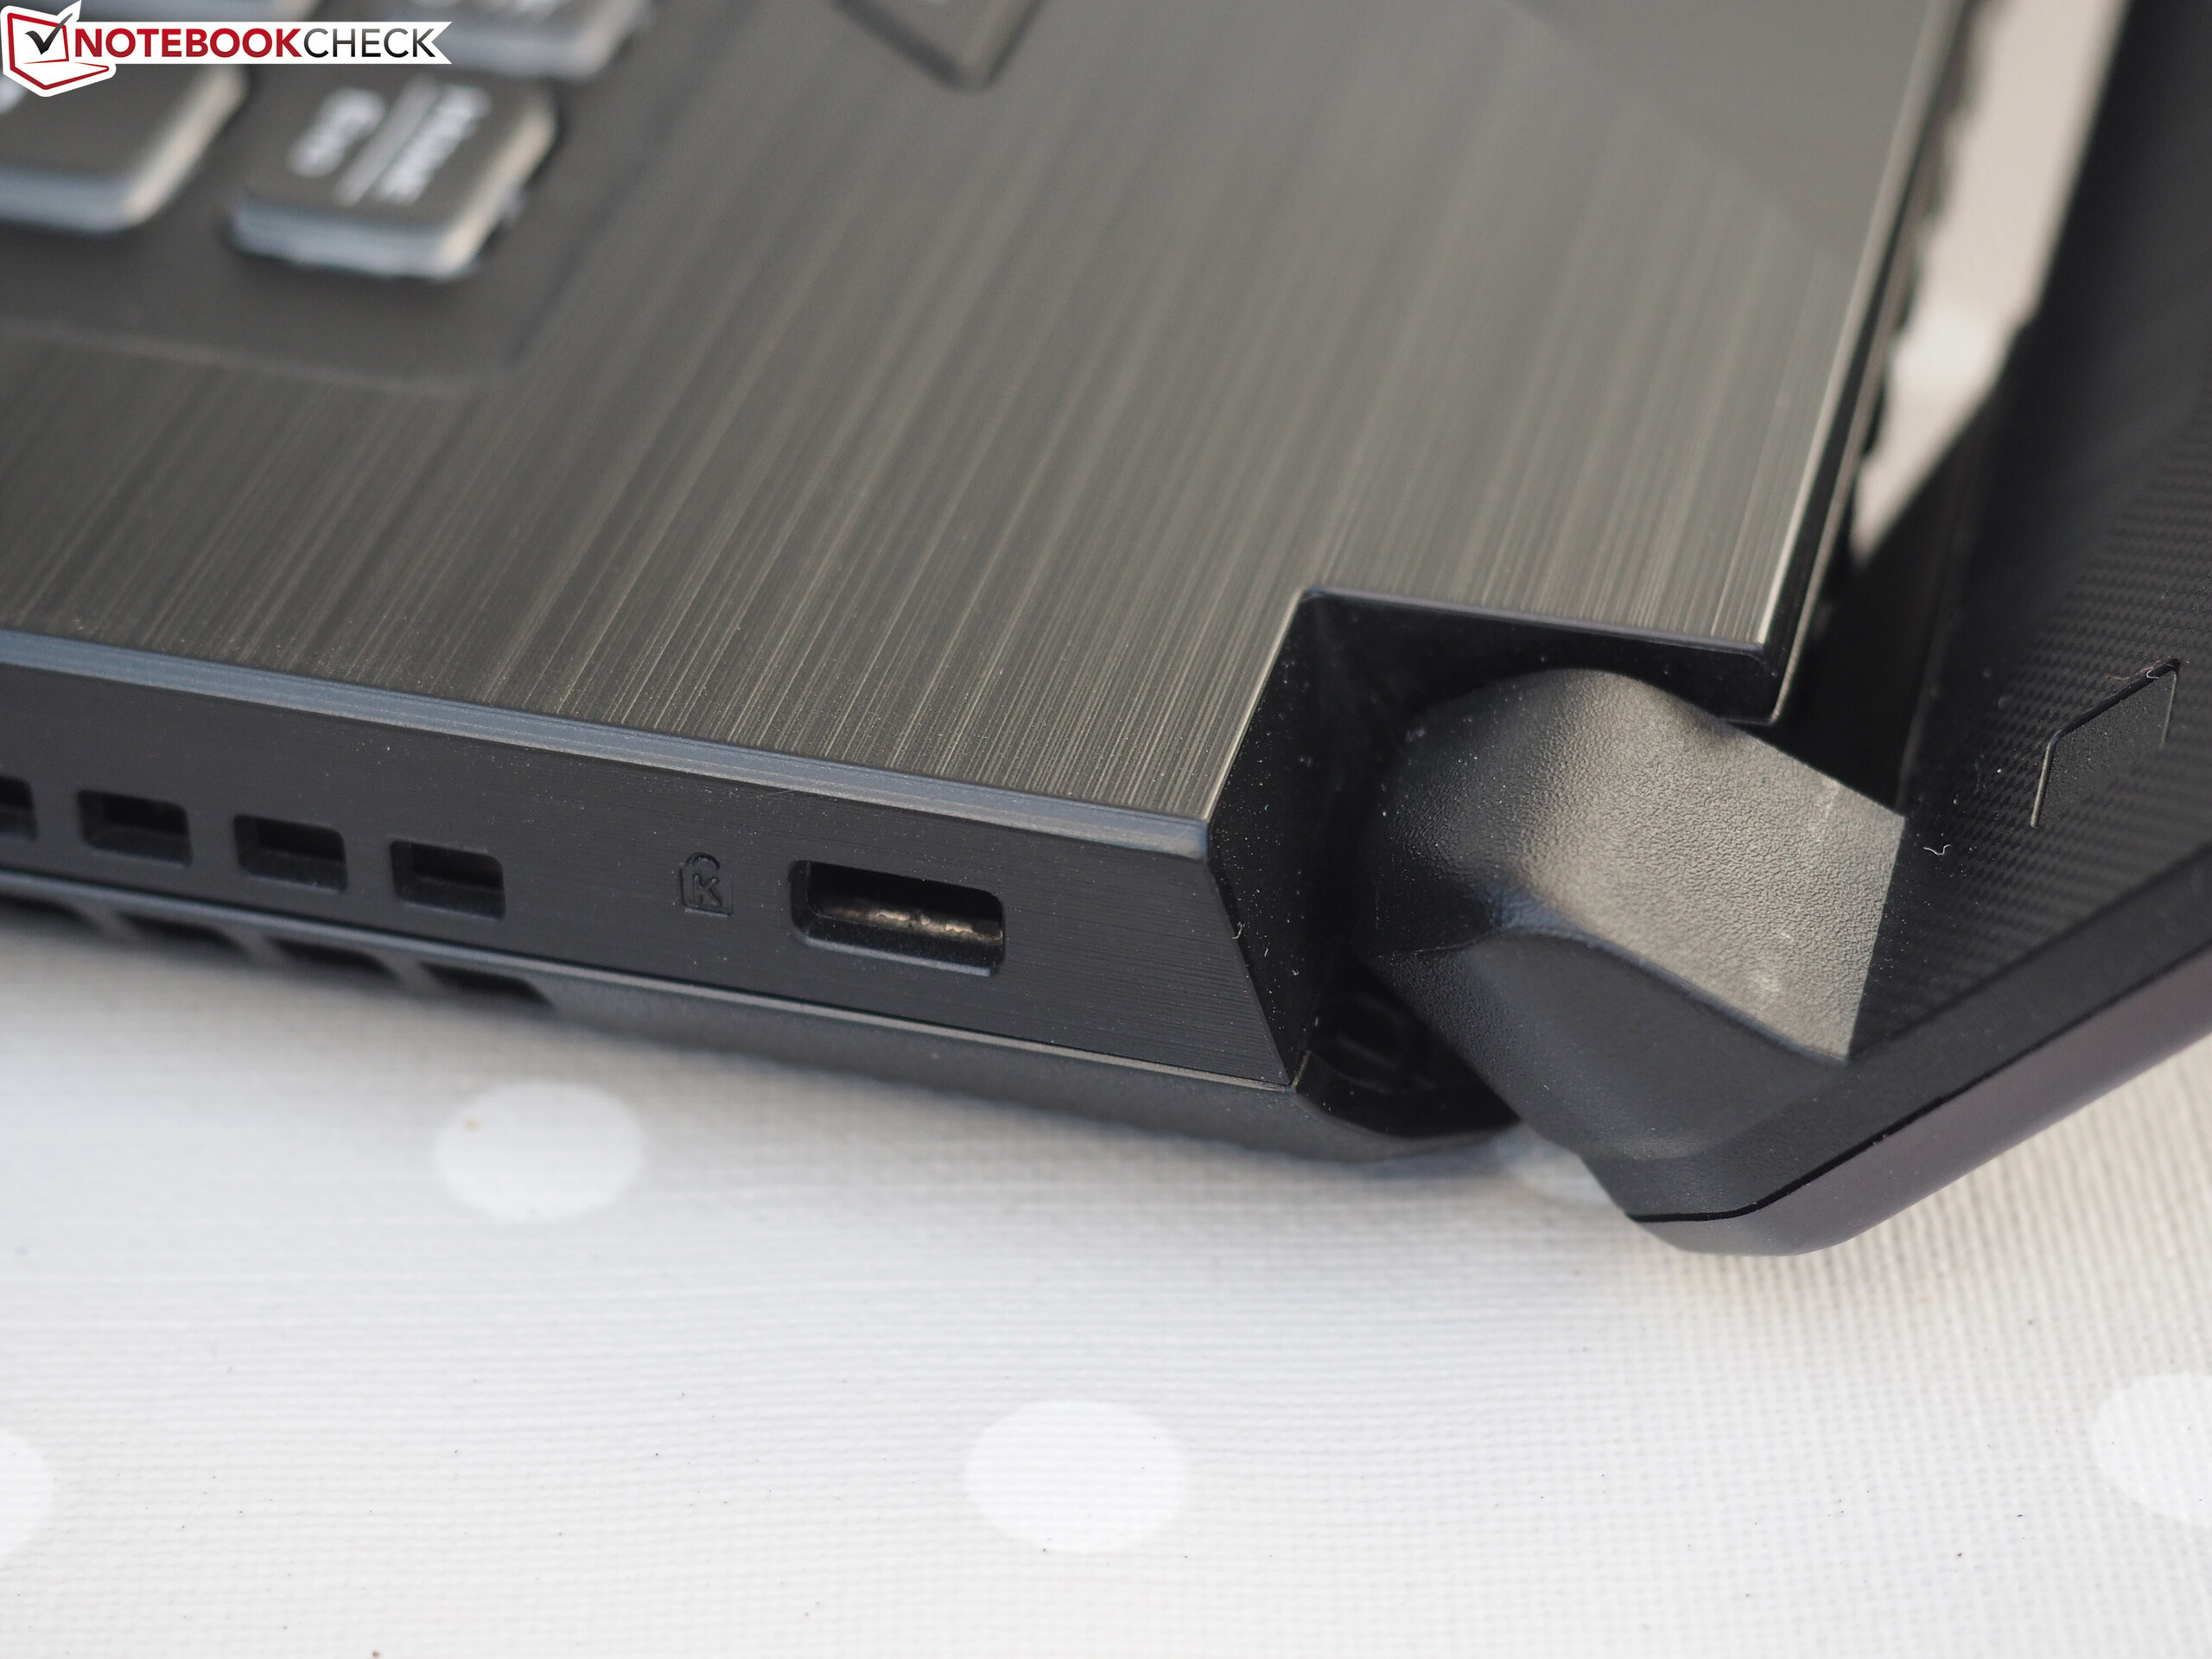
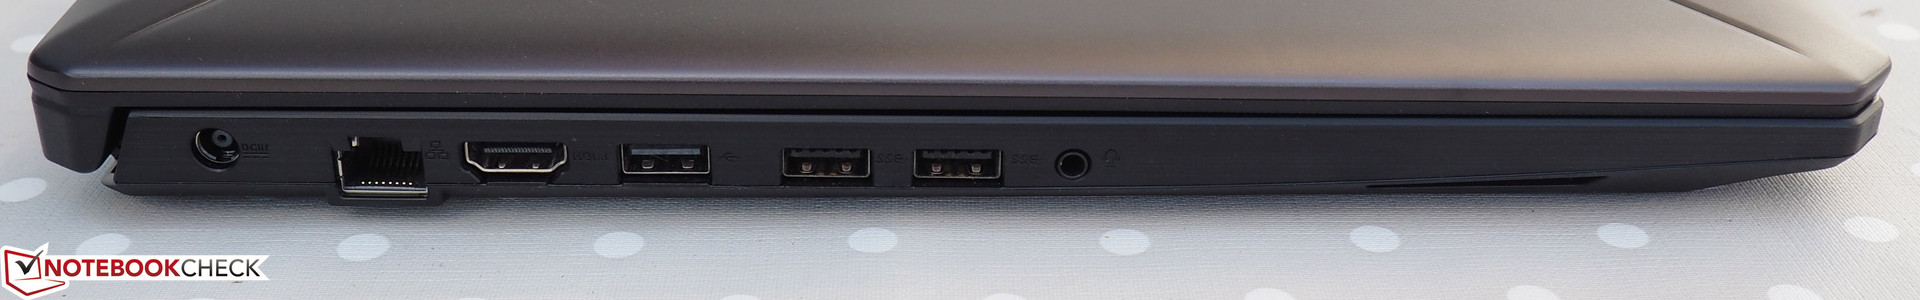
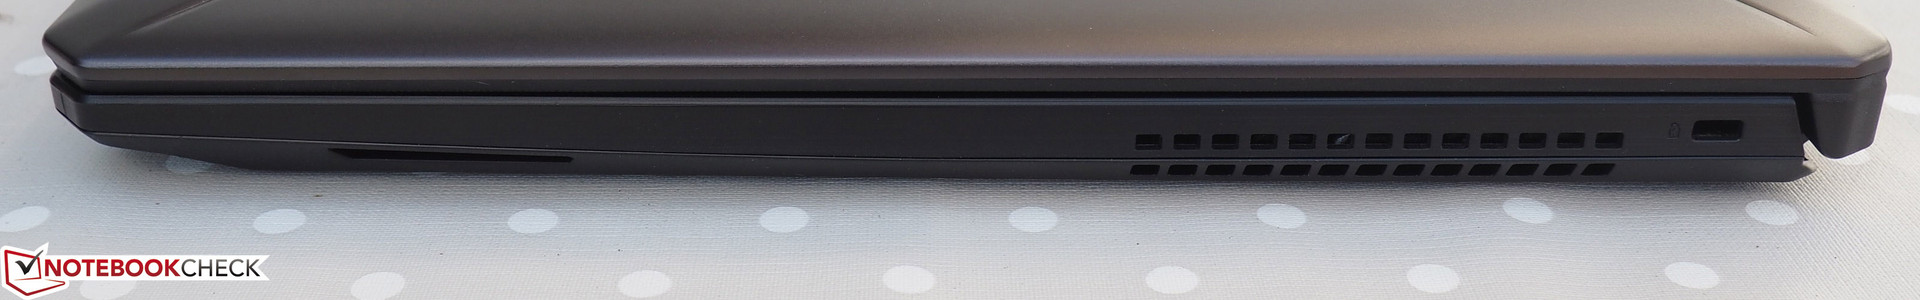
Além da escassa seleção de portas (sem leitor de cartões, sem Thunderbolt 3, sem USB 3.1 Gen2) e o som medíocre, o FX705 não deixa muitas coisas a desejar. O modelo de 17 polegadas brilha com sua tela de 144 Hz com alta taxa de contraste e alta velocidade, que é impulsionado por um processador de seis núcleos e a GeForce GTX 1060 de alto desempenho.
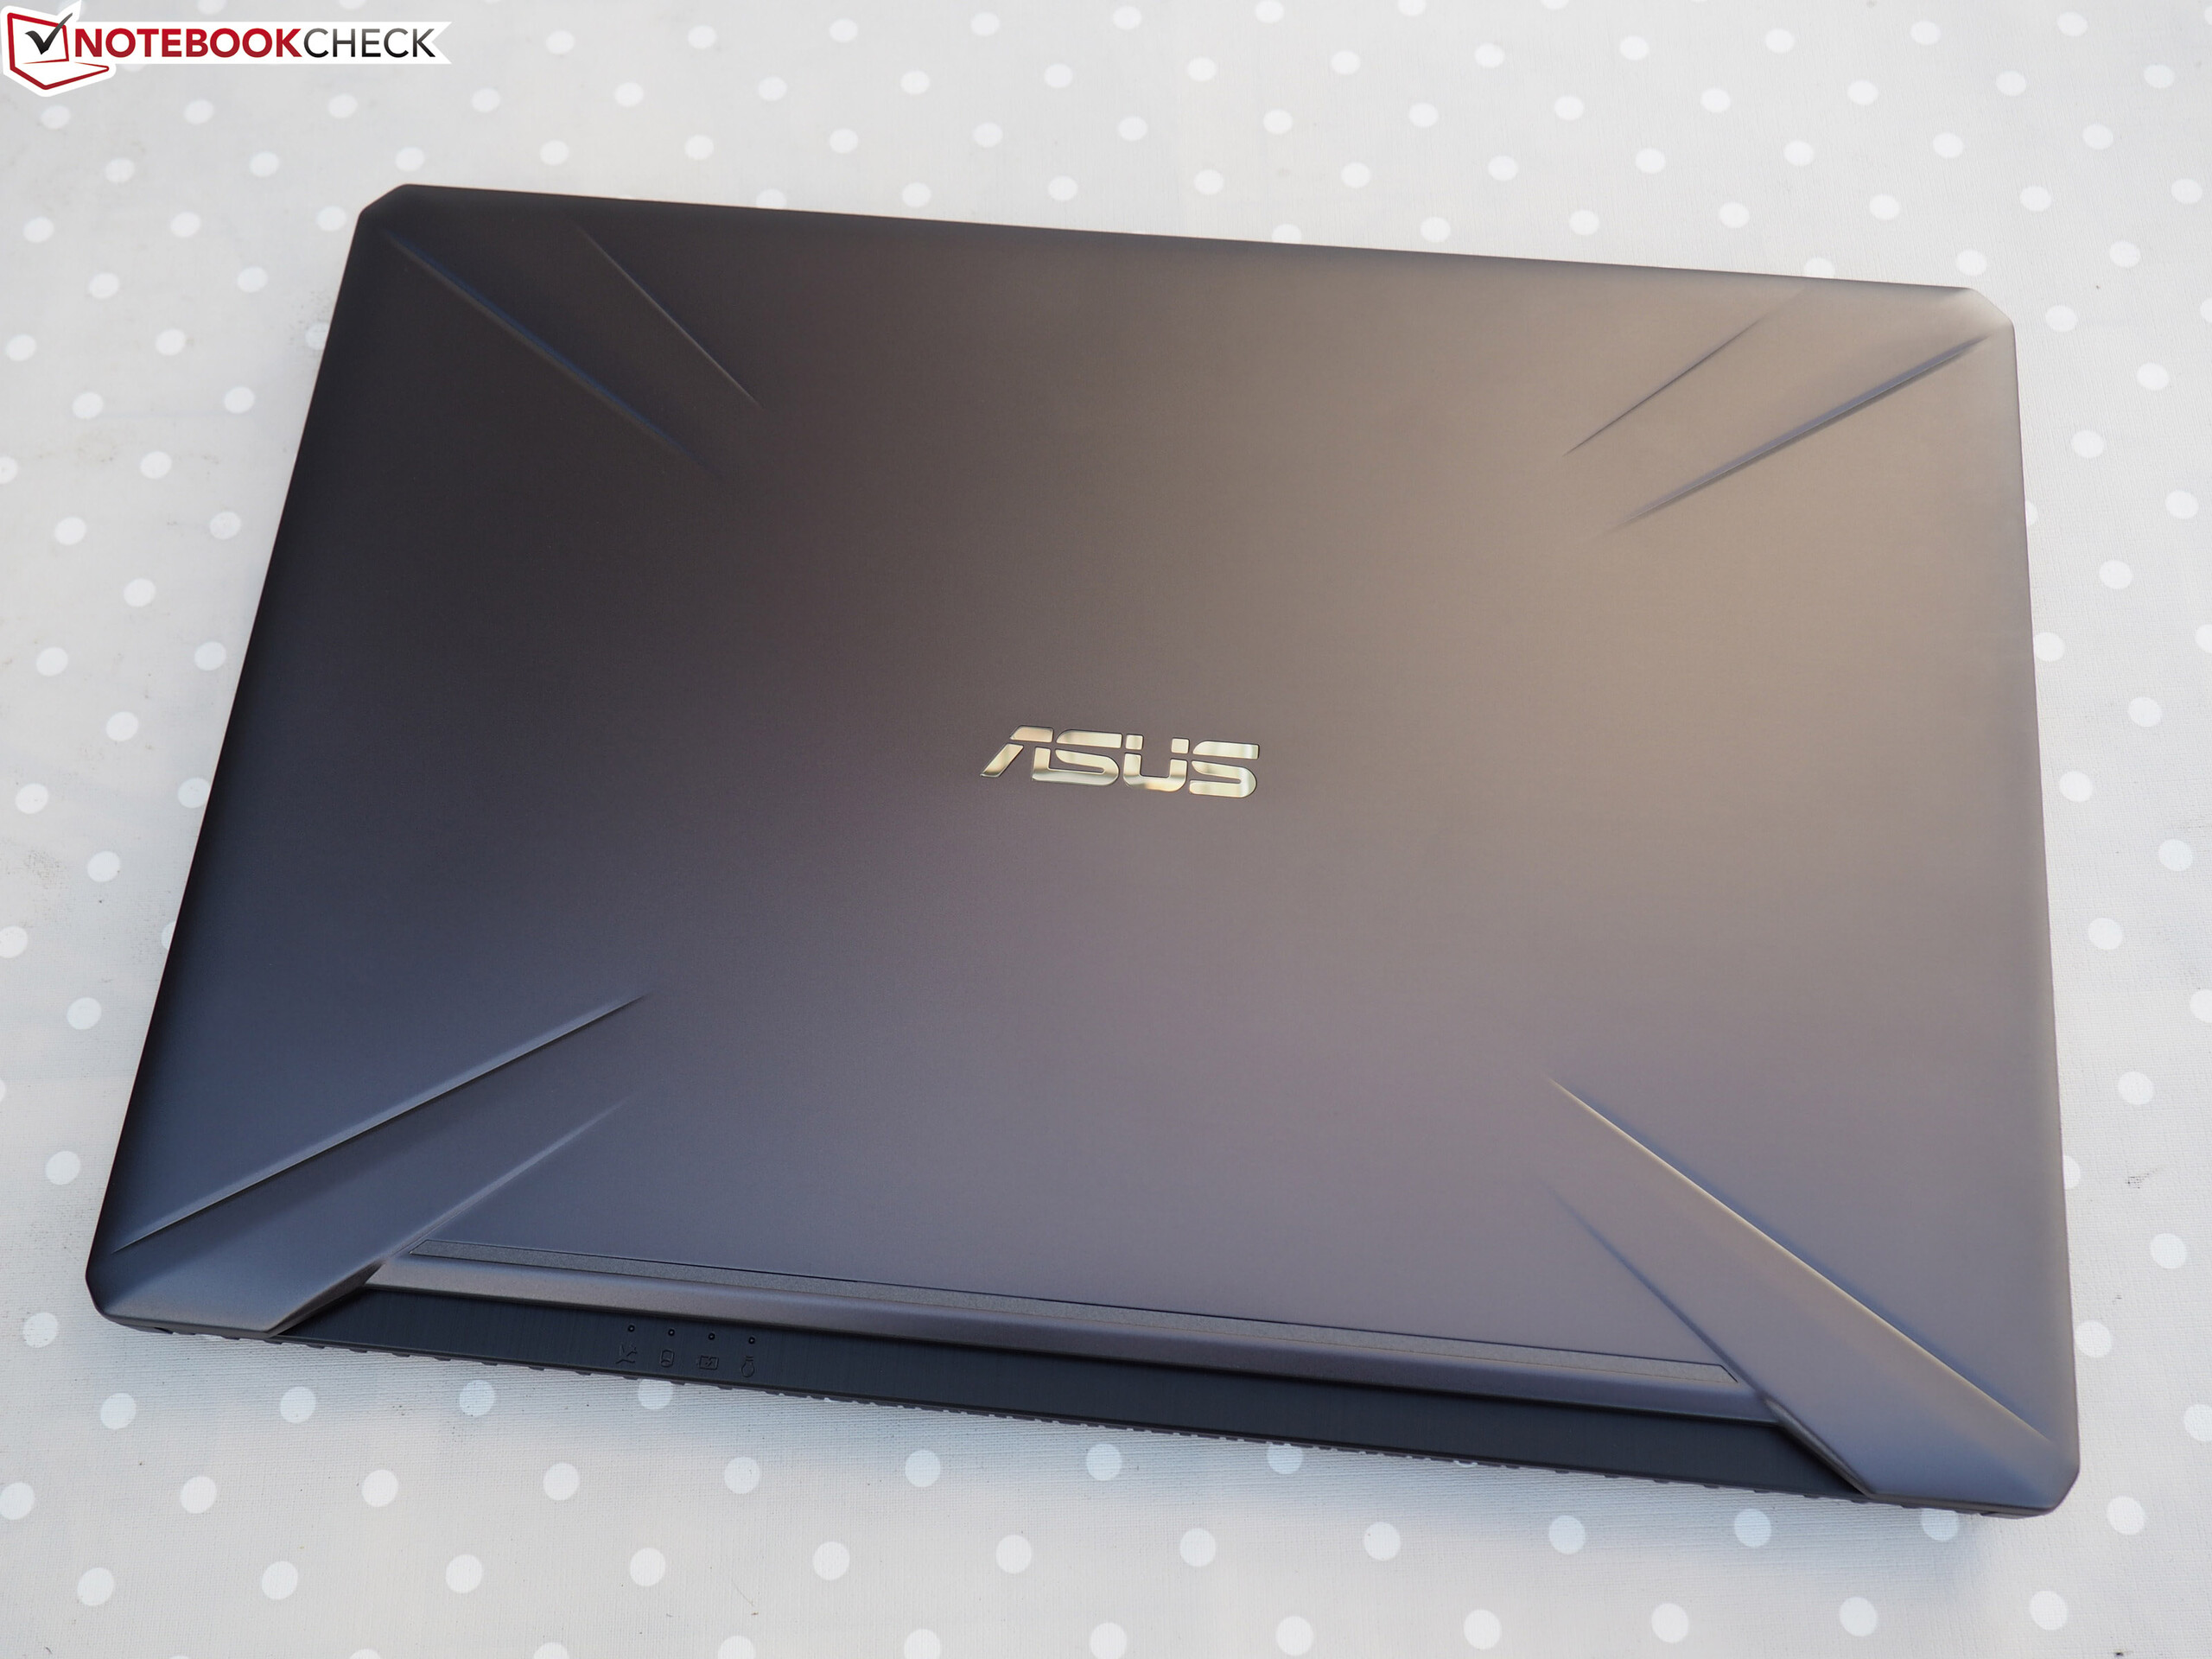
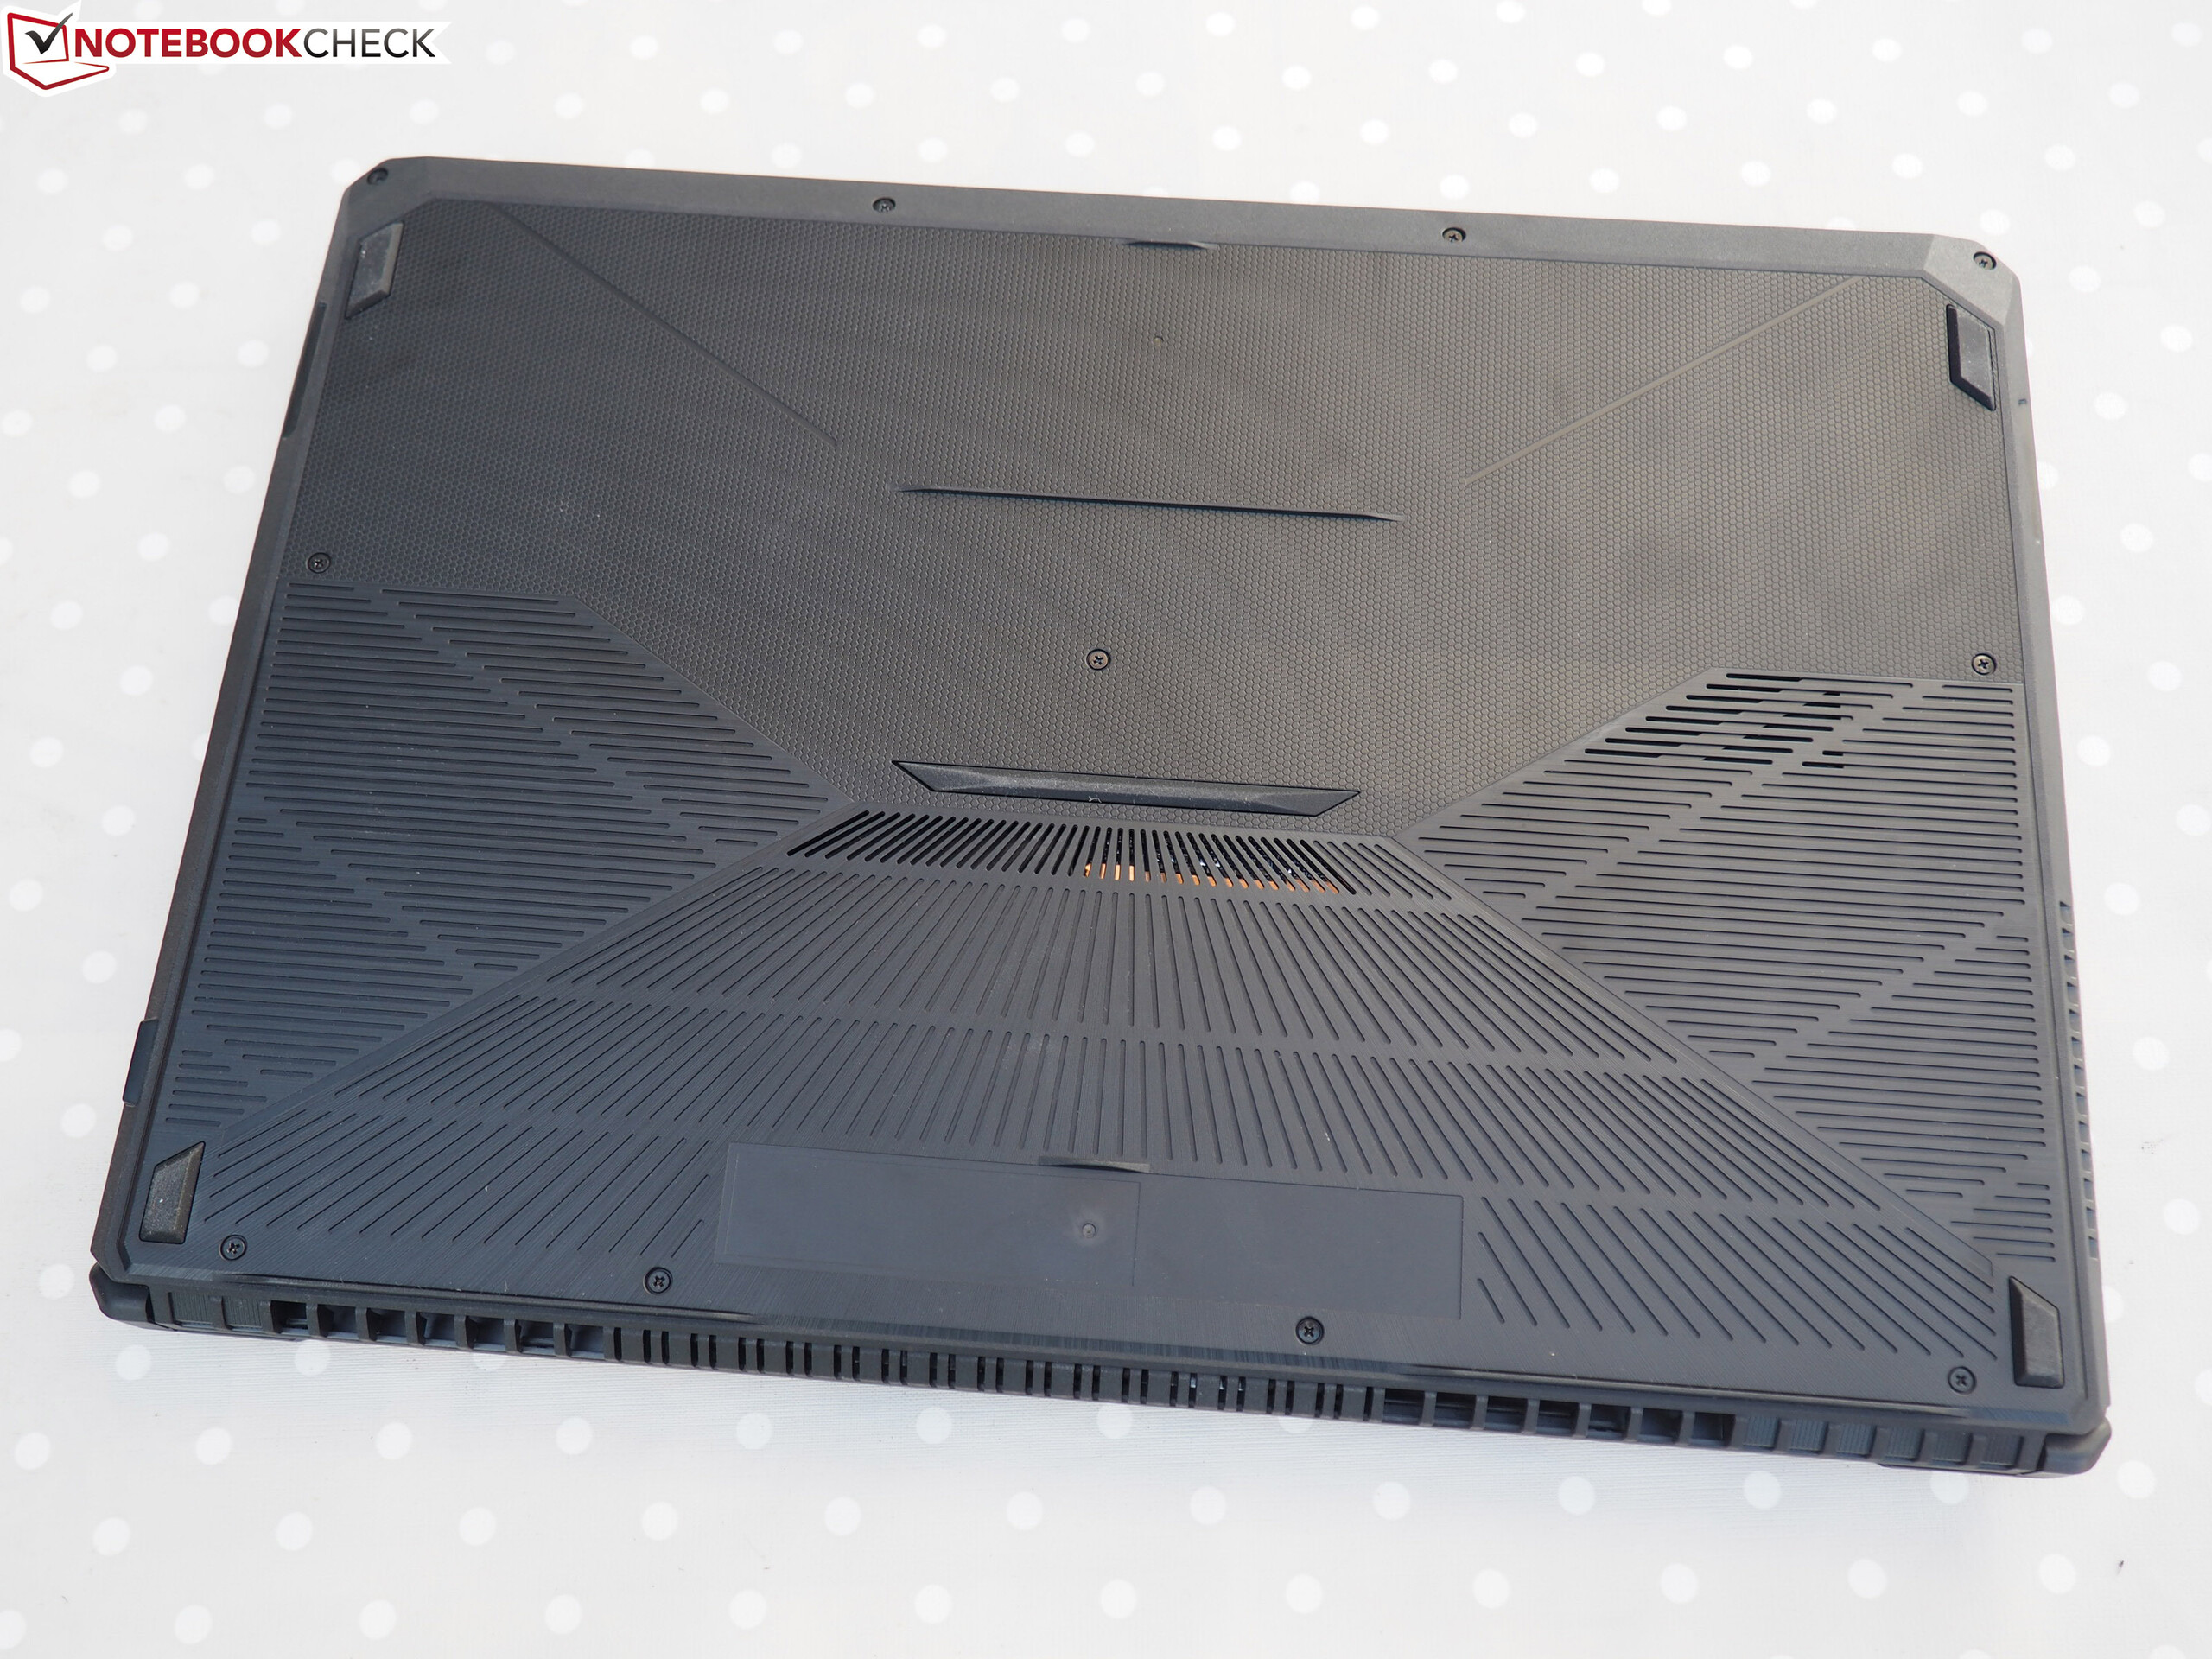
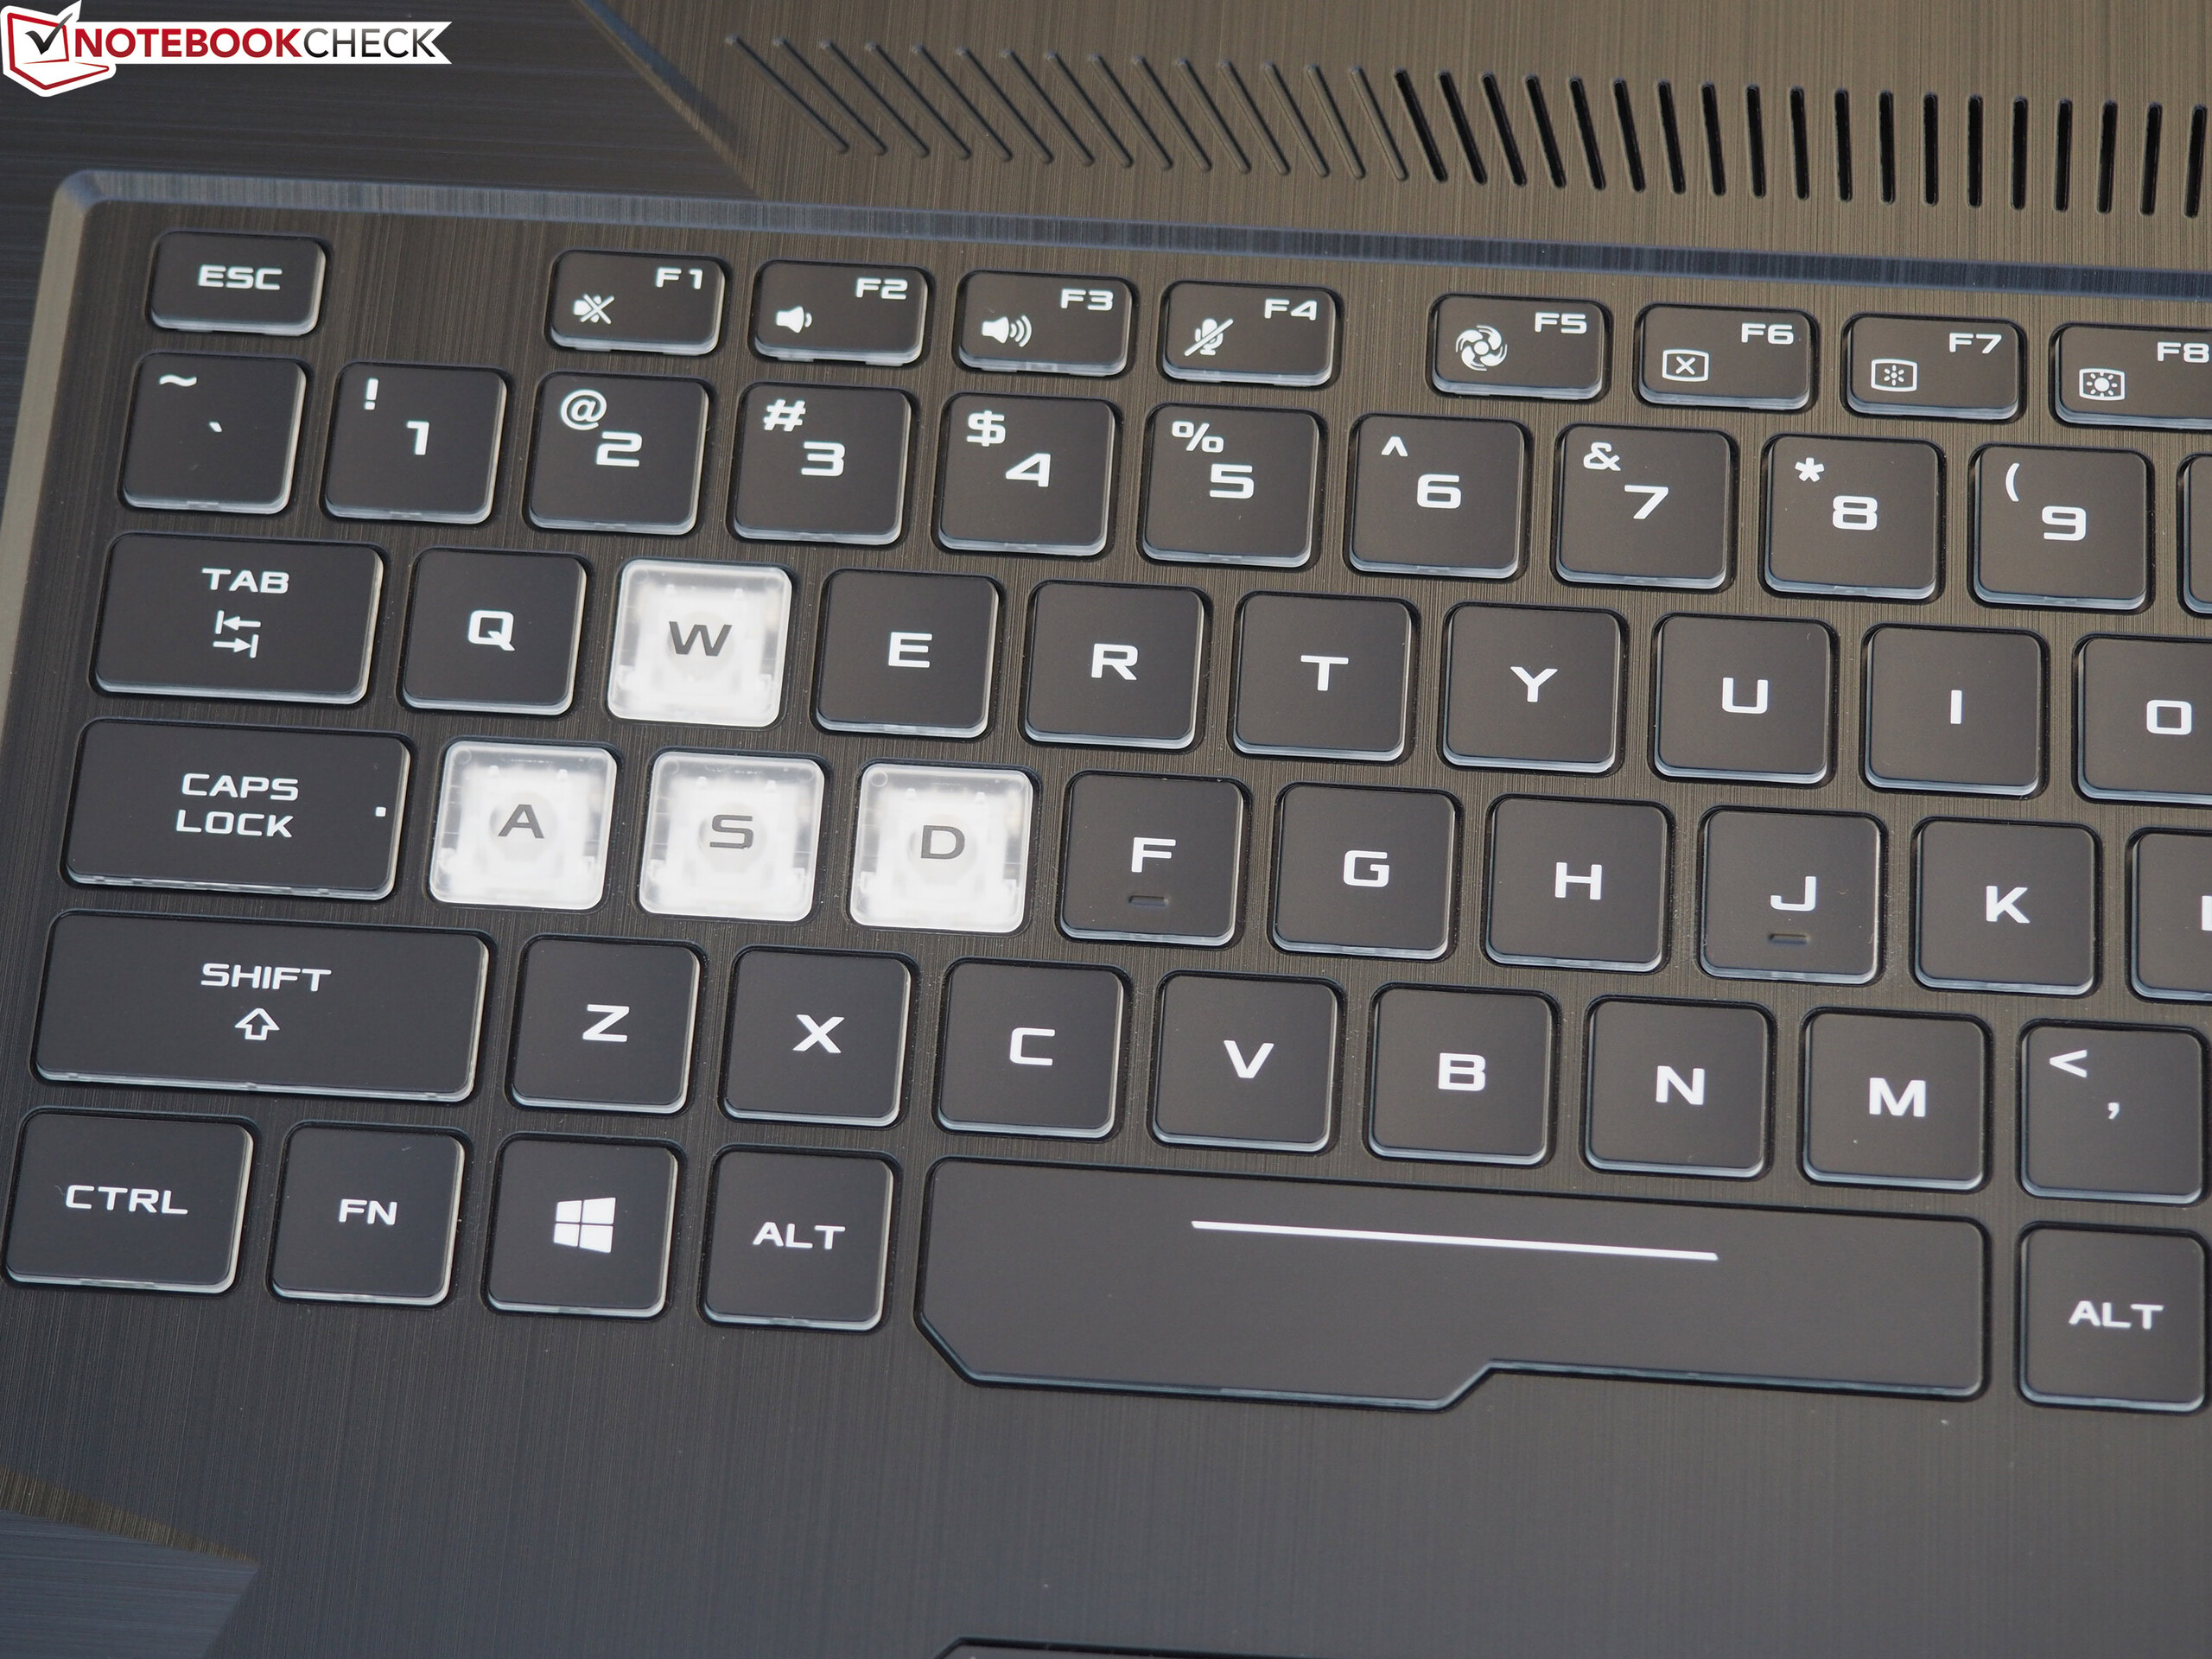
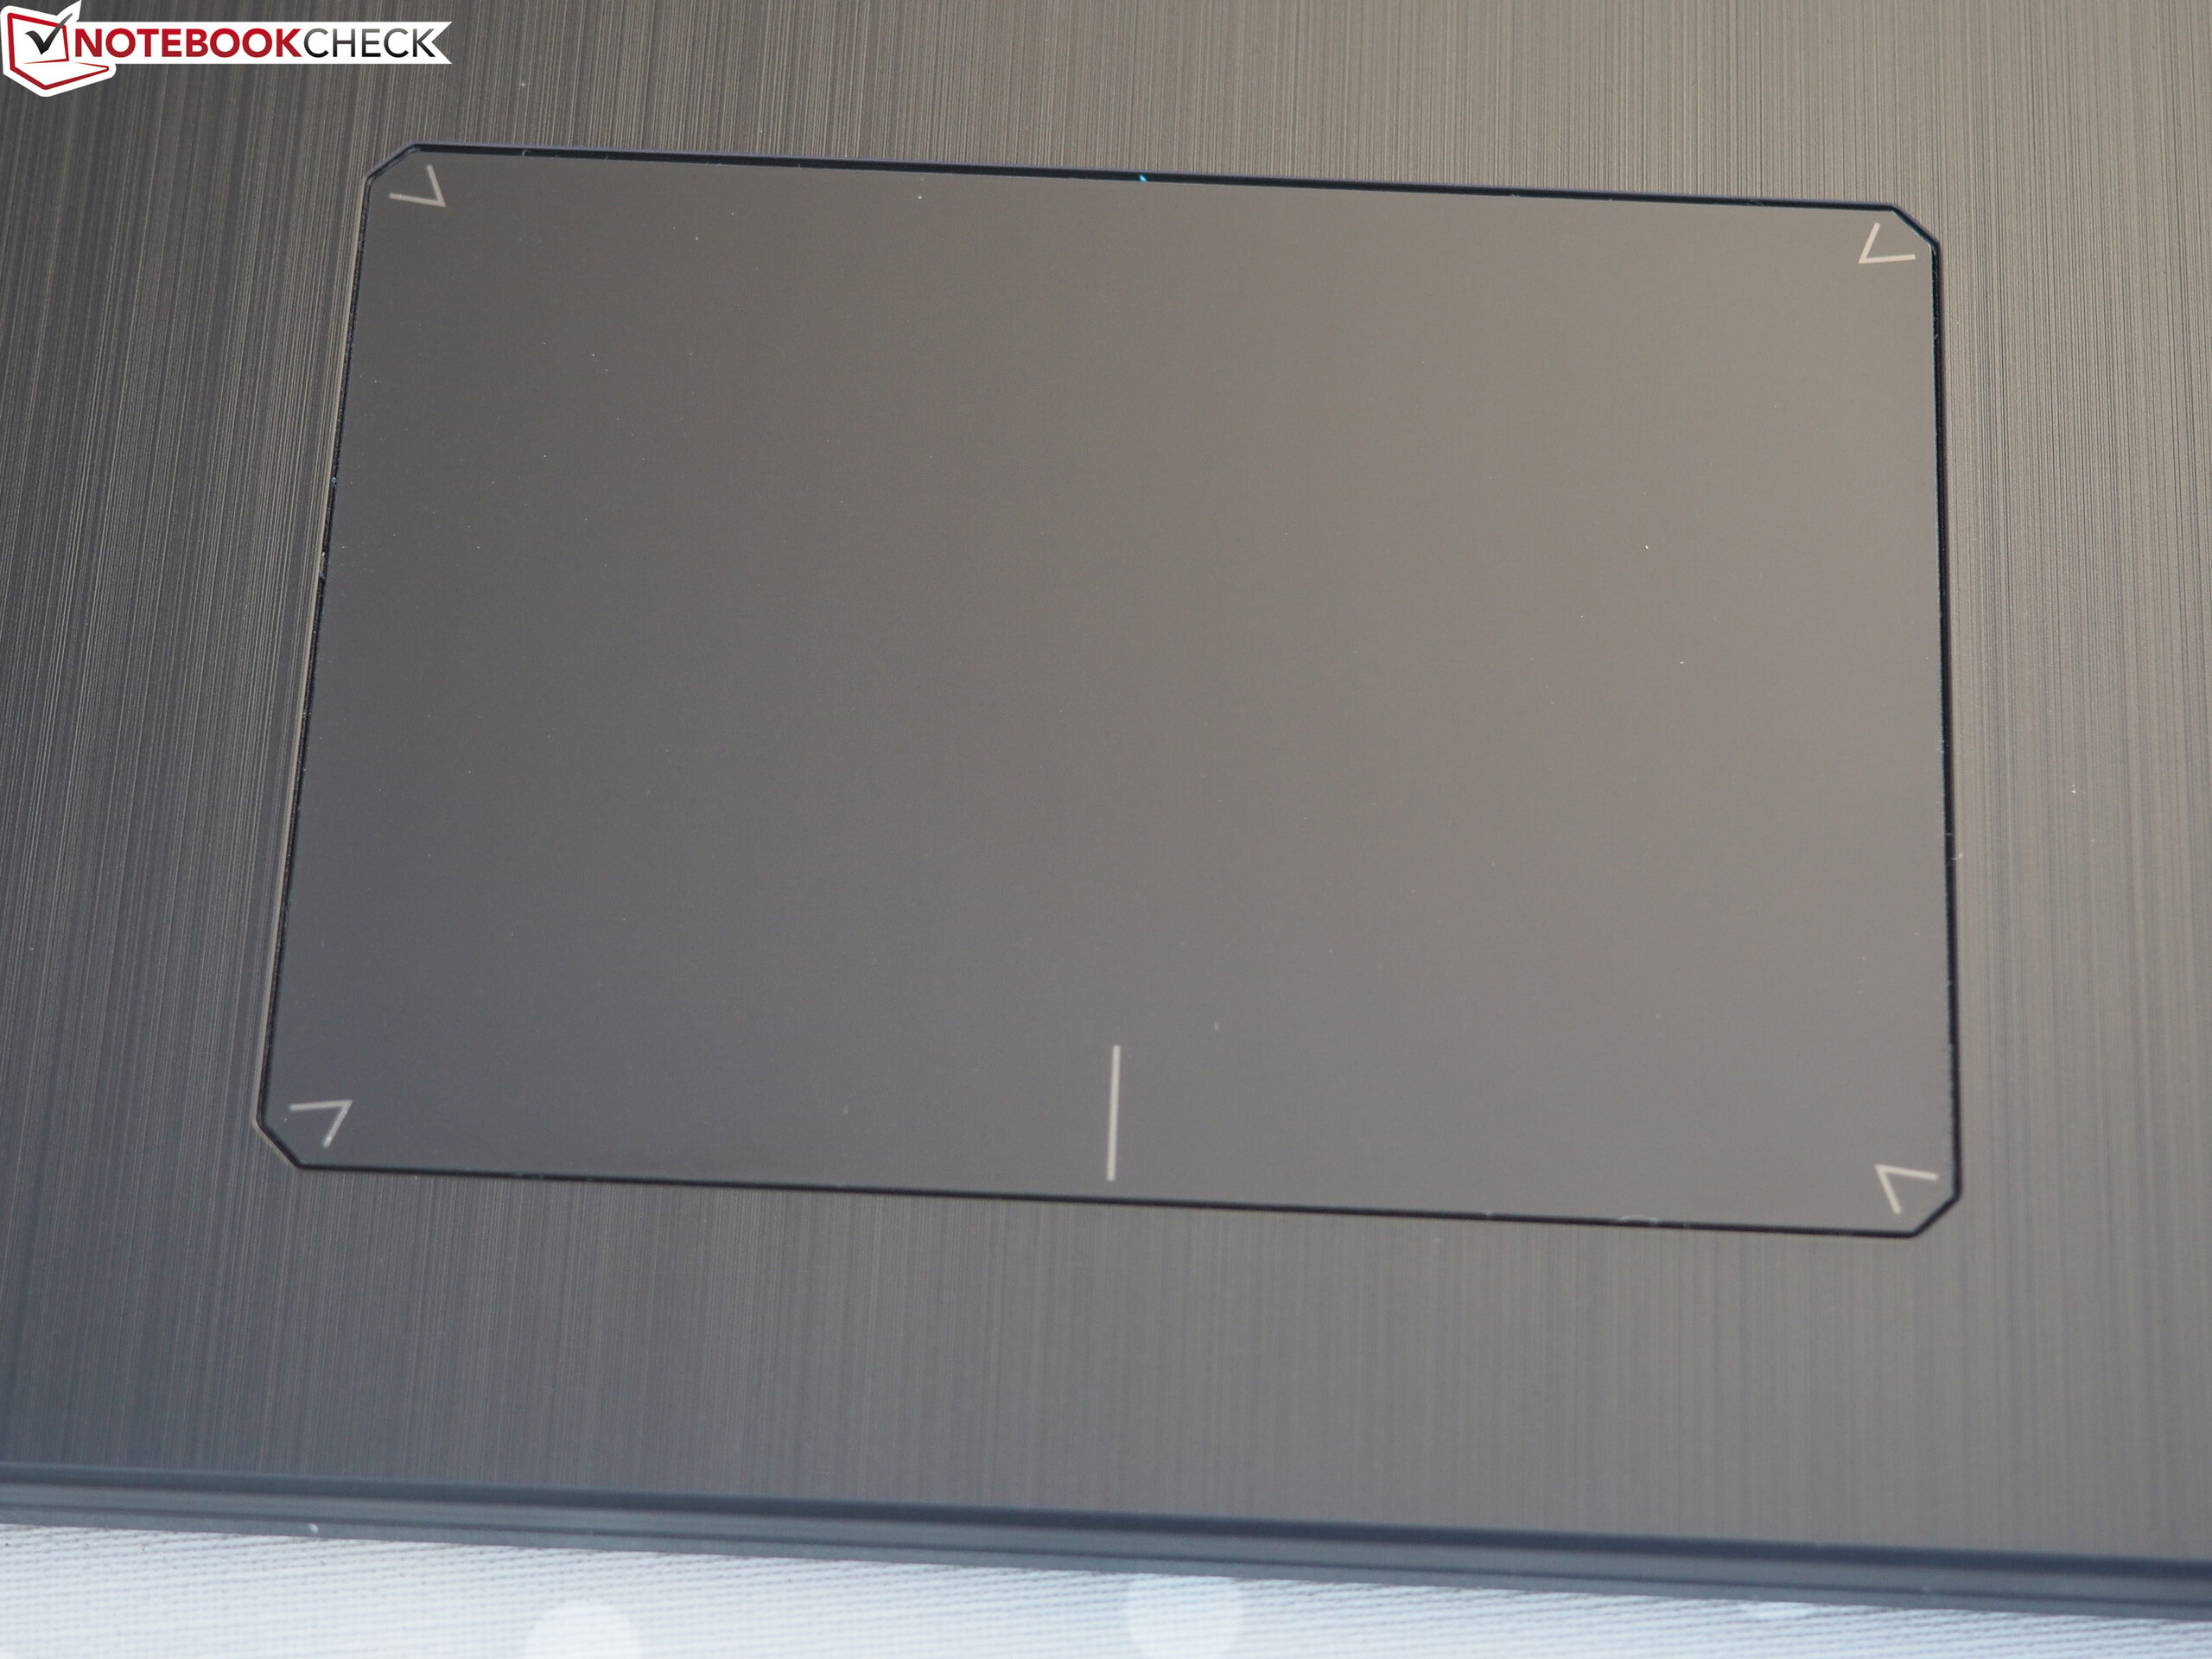
A carcaça e a duração da bateria também não são muito ruins. A qualidade do chassi deve agradar a maioria dos compradores. Além disso, os jogadores ficarão felizes com a iluminação RGB (Cuidado: Existem duas variantes da carcaça com várias diferenças; Veja acima)
No entanto, há uma quantidade saudável de competição no setor de 17 polegadas, como o MSI GS73, o Schenker XMG A707 e o Acer Predator Helios 300. Enquanto os dois últimos desses portáteis ficaram ligeiramente para trás em termos de pontuação (82 em vez de 83%), o MSI alcançou uma avaliação geral um pouco melhor.
Asus TUF FX705GM
- 10/19/2018 v6 (old)
Florian Glaser
Price comparison