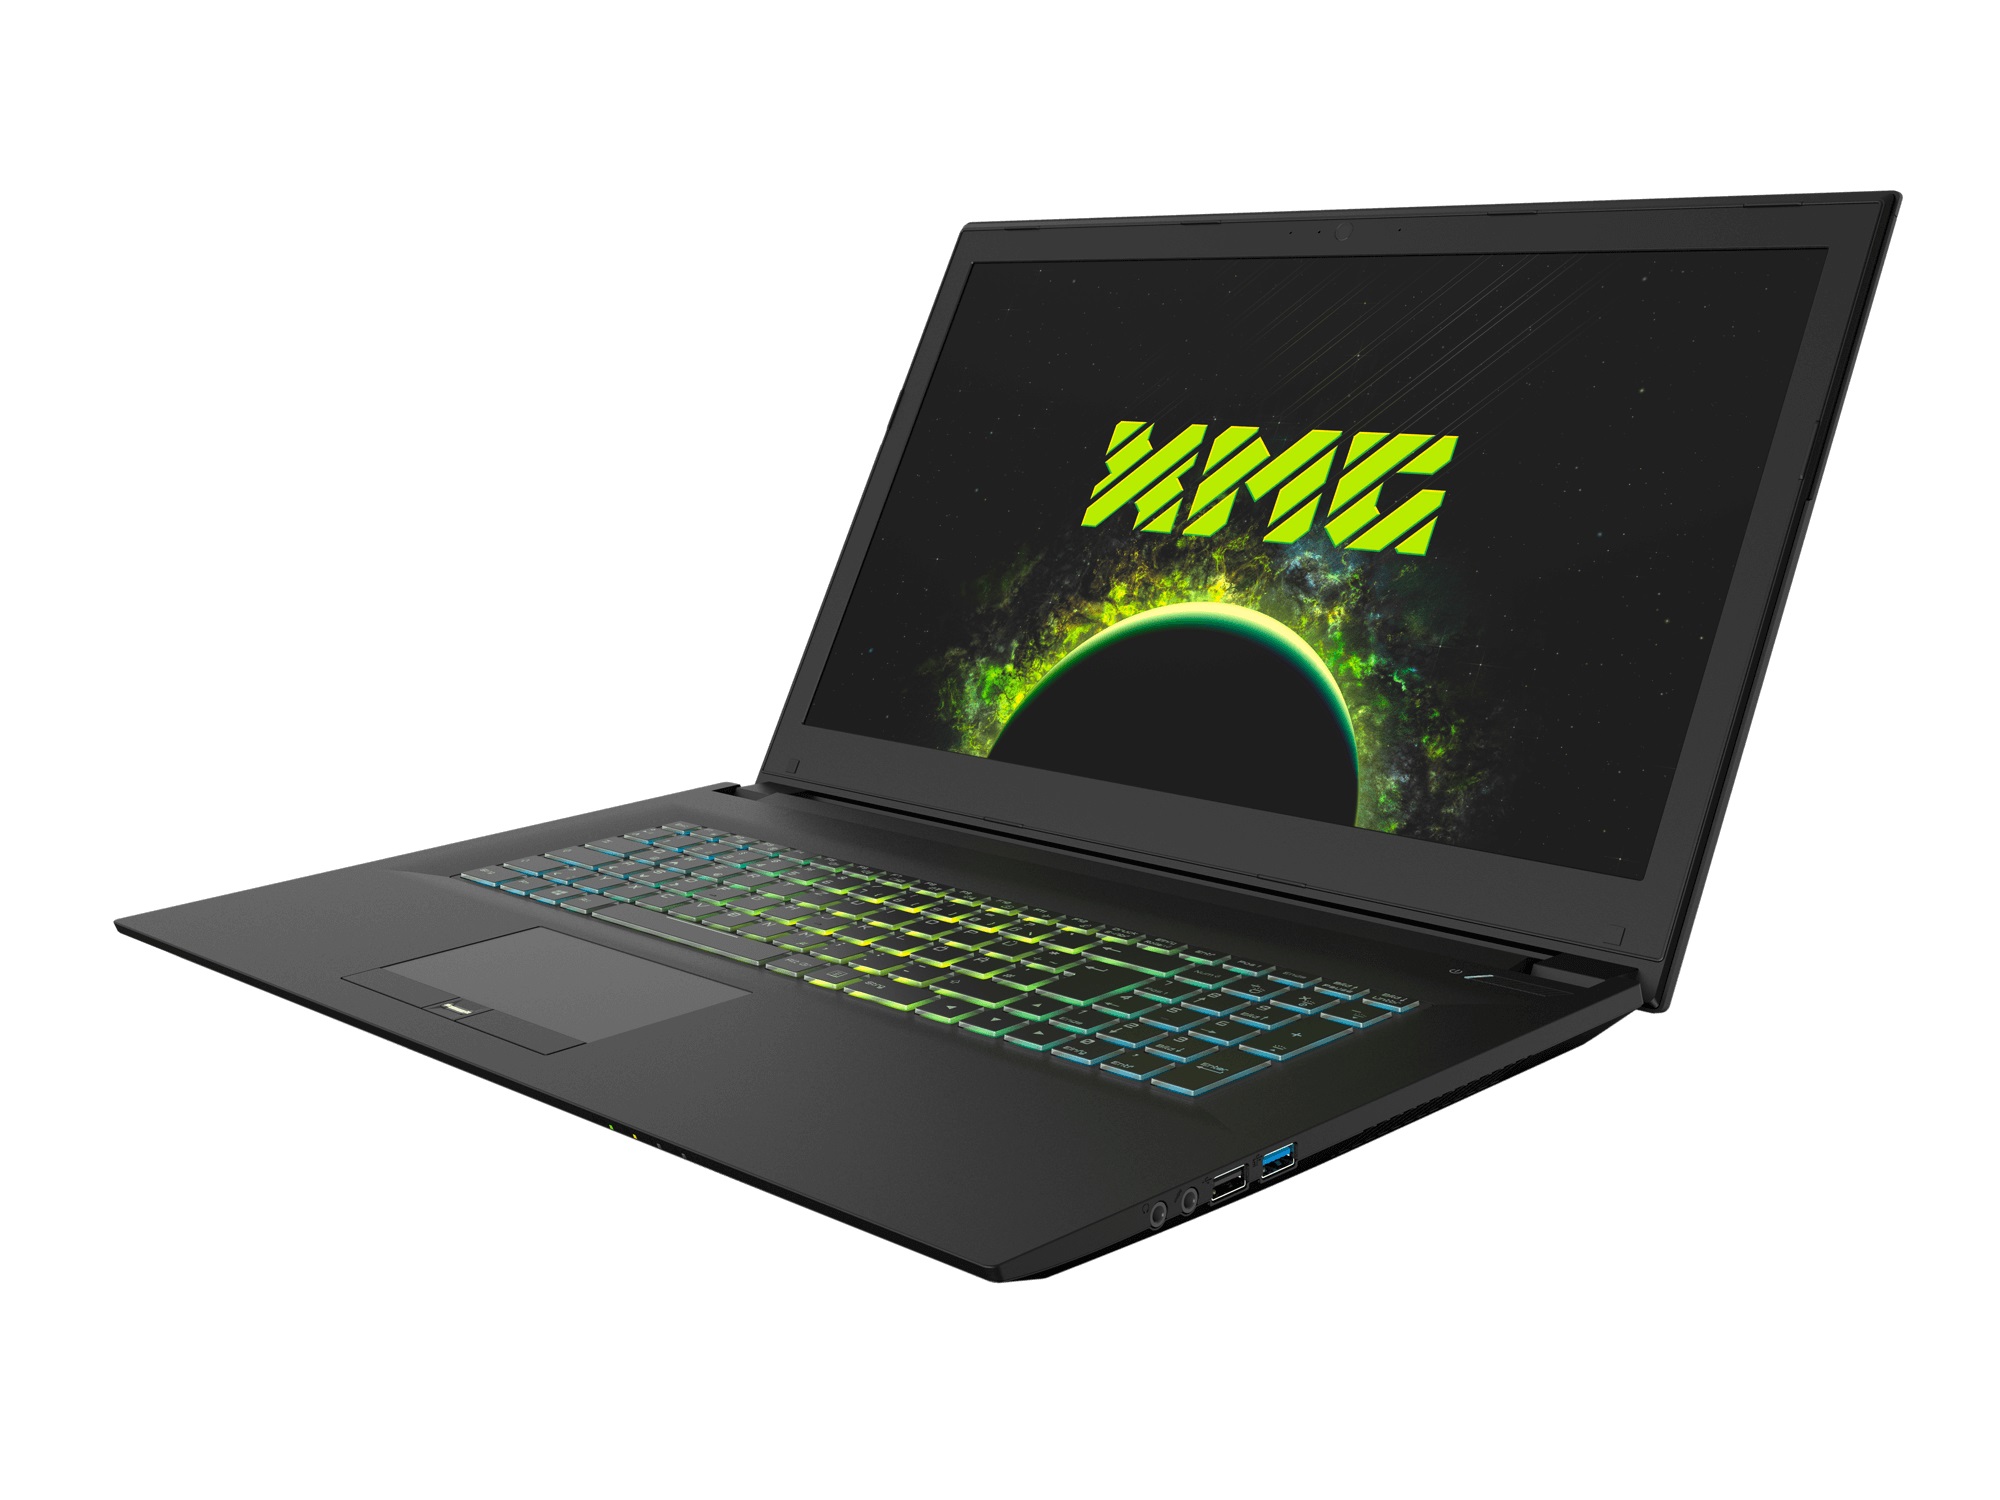
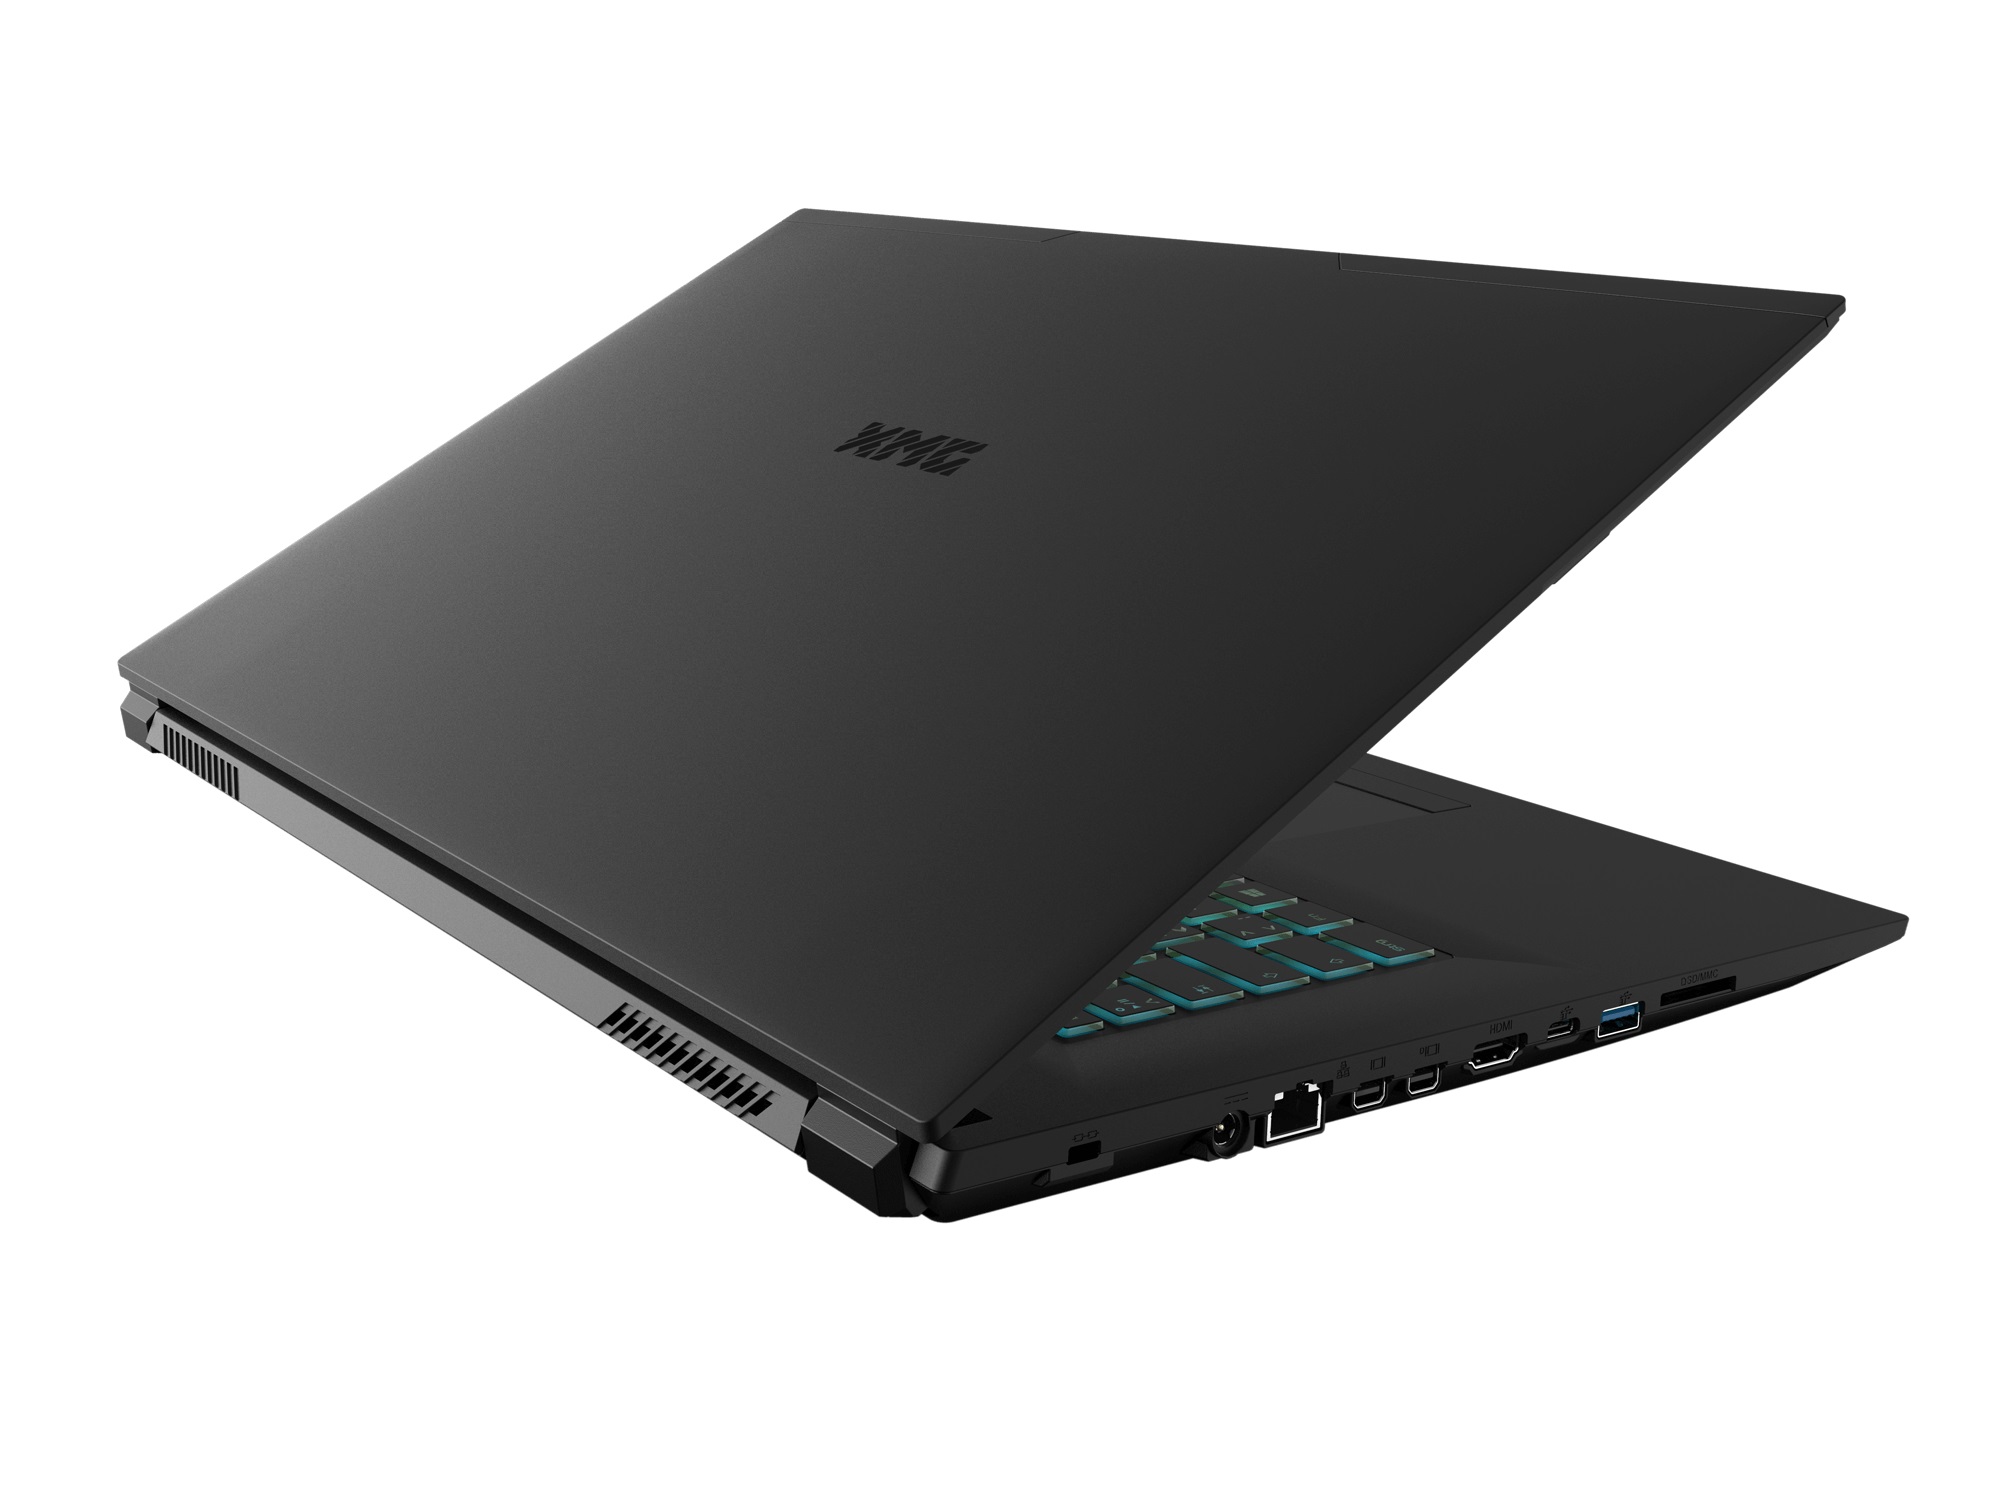
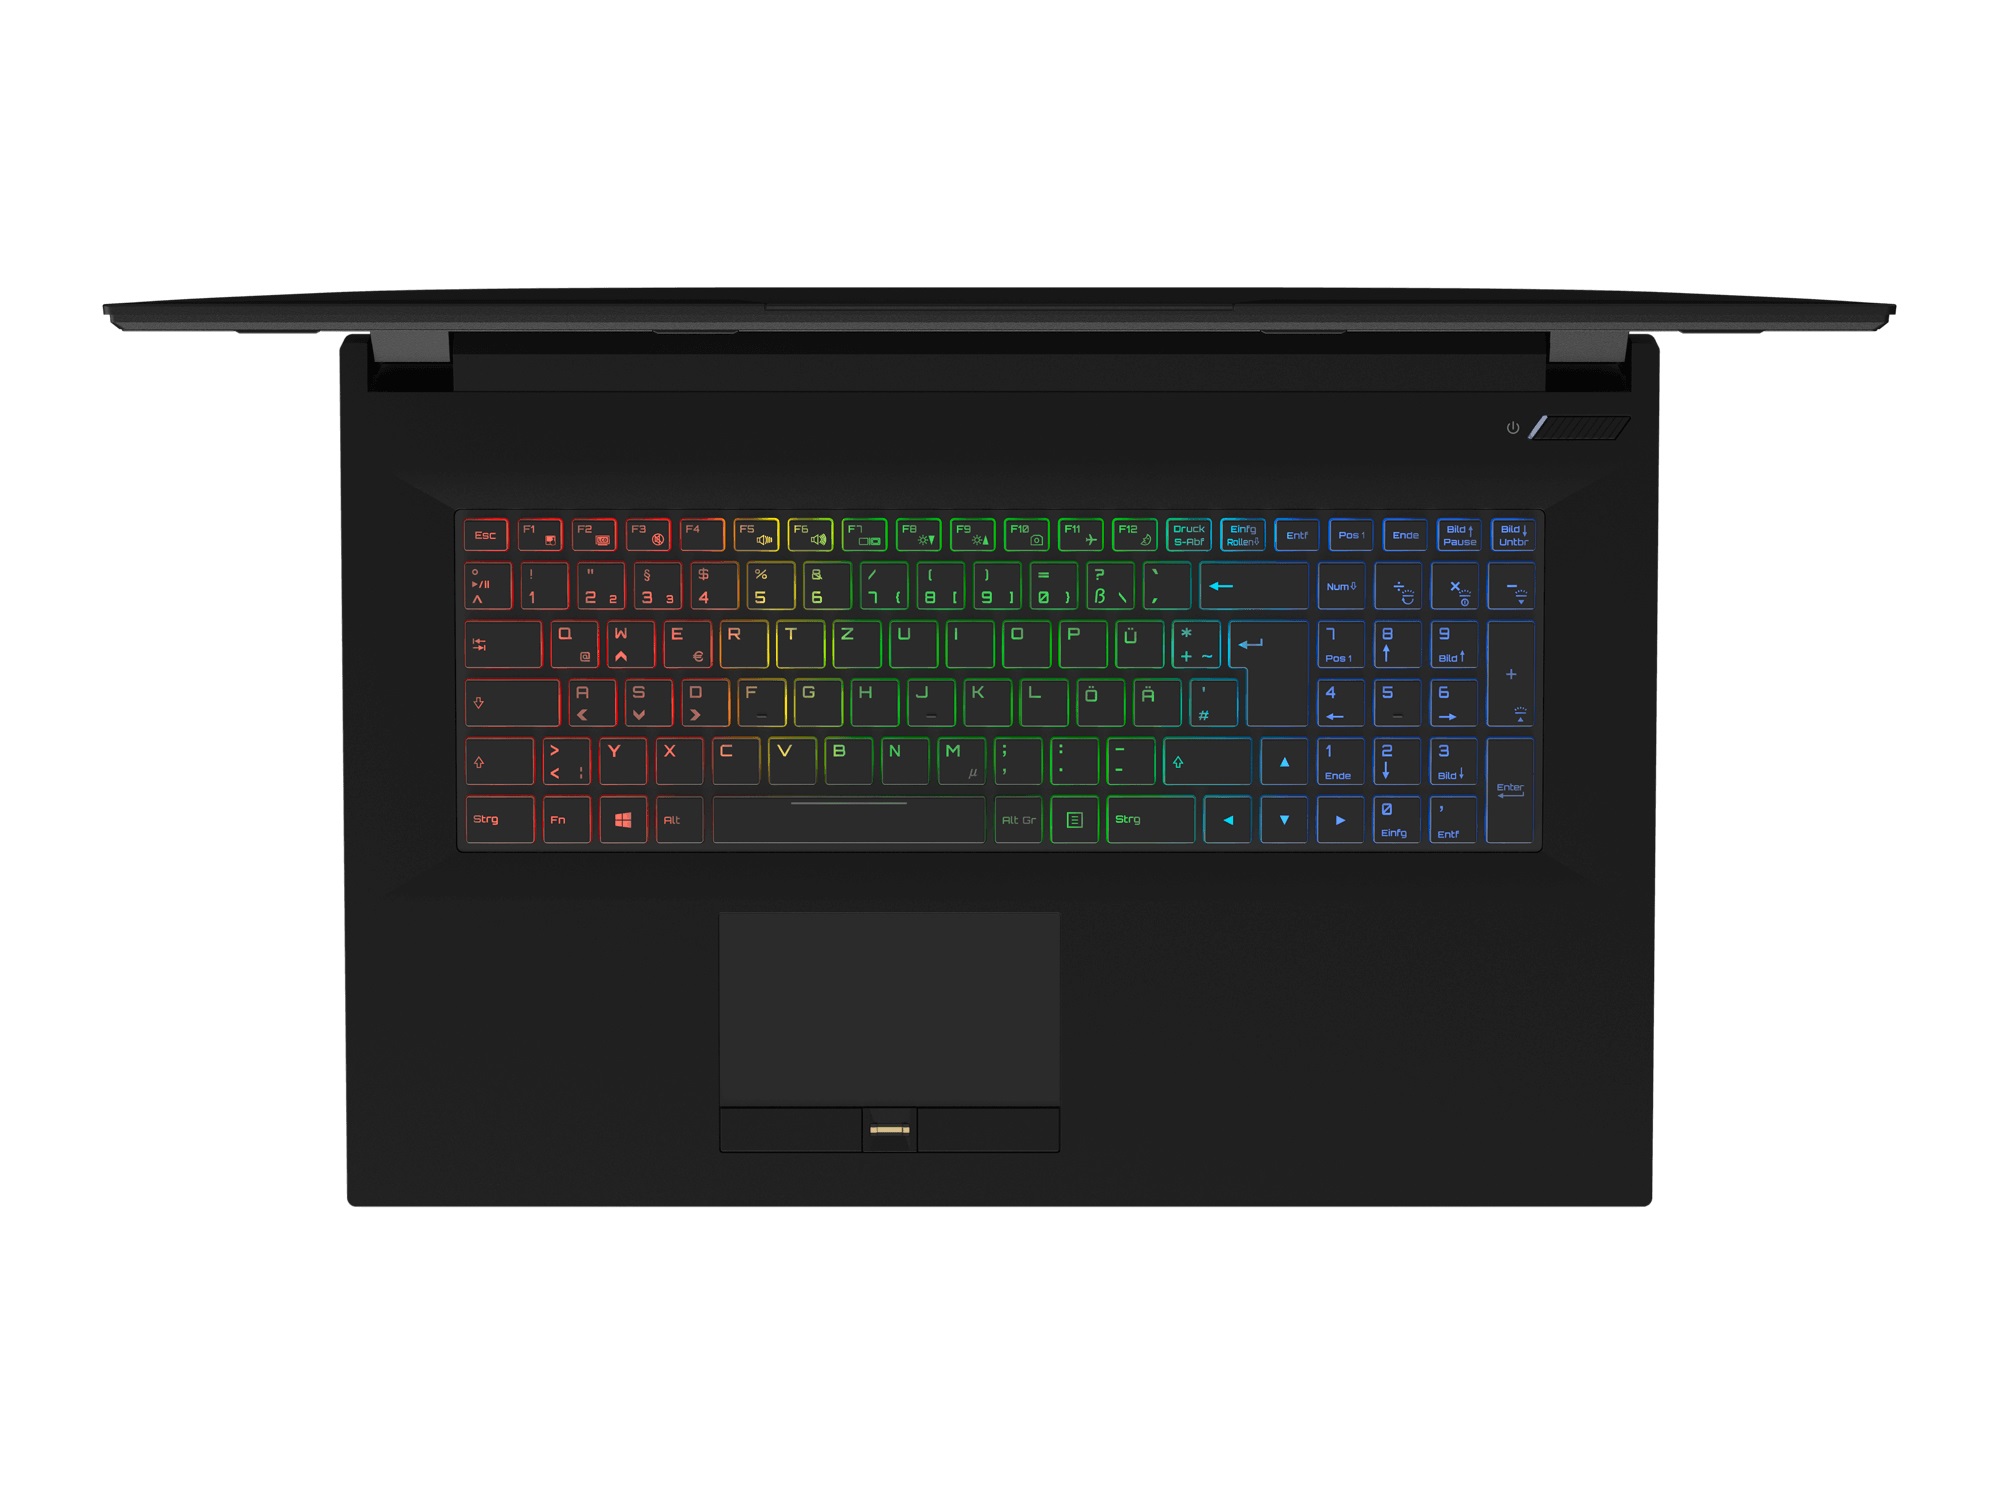
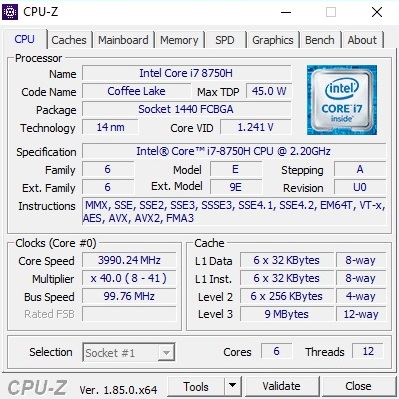
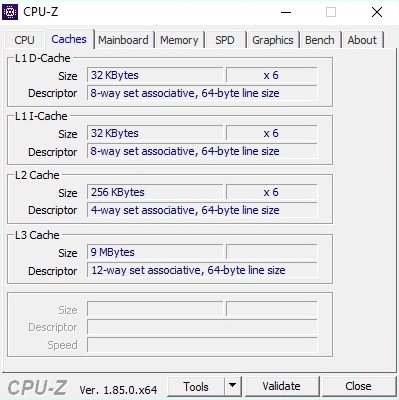
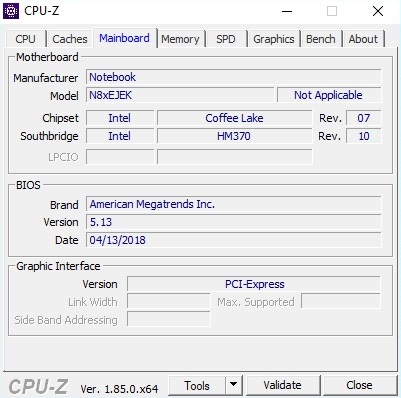
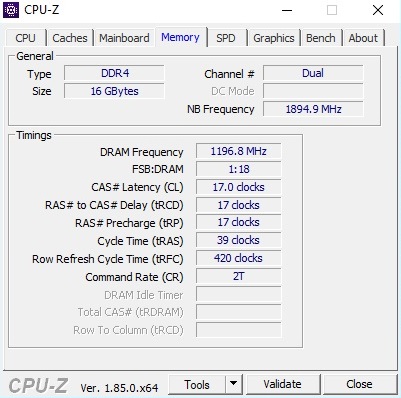
Breve Análise do Portátil Schenker XMG A707 (Clevo N871EK1)
| SD Card Reader | |
| average JPG Copy Test (av. of 3 runs) | |
| Média da turma Gaming (20.9 - 210, n=54, últimos 2 anos) | |
| Asus GL703GE-ES73 (Toshiba Exceria Pro SDXC 64 GB UHS-II) | |
| Nexoc G739 (Toshiba Exceria Pro SDXC 64 GB UHS-II) | |
| Acer Predator Helios 300 PH317-52-51M6 (Toshiba Exceria Pro SDXC 64 GB UHS-II) | |
| Schenker XMG A707 Coffee Lake (Toshiba Exceria Pro SDXC 64 GB UHS-II) | |
| maximum AS SSD Seq Read Test (1GB) | |
| Média da turma Gaming (25.5 - 261, n=51, últimos 2 anos) | |
| Asus GL703GE-ES73 (Toshiba Exceria Pro SDXC 64 GB UHS-II) | |
| Nexoc G739 (Toshiba Exceria Pro SDXC 64 GB UHS-II) | |
| Acer Predator Helios 300 PH317-52-51M6 (Toshiba Exceria Pro SDXC 64 GB UHS-II) | |
| Schenker XMG A707 Coffee Lake (Toshiba Exceria Pro SDXC 64 GB UHS-II) | |
| Networking | |
| iperf3 transmit AX12 | |
| Schenker XMG A707 Coffee Lake | |
| Acer Predator Helios 300 PH317-52-51M6 | |
| Asus GL703GE-ES73 | |
| Nexoc G739 | |
| iperf3 receive AX12 | |
| Schenker XMG A707 Coffee Lake | |
| Acer Predator Helios 300 PH317-52-51M6 | |
| Asus GL703GE-ES73 | |
| Nexoc G739 | |
| |||||||||||||||||||||||||
iluminação: 91 %
iluminação com acumulador: 362 cd/m²
Contraste: 1248:1 (Preto: 0.29 cd/m²)
ΔE ColorChecker Calman: 6.06 | ∀{0.5-29.43 Ø4.71}
calibrated: 3.13
ΔE Greyscale Calman: 7.22 | ∀{0.09-98 Ø4.96}
84% sRGB (Argyll 1.6.3 3D)
55% AdobeRGB 1998 (Argyll 1.6.3 3D)
61.7% AdobeRGB 1998 (Argyll 3D)
84.4% sRGB (Argyll 3D)
66.1% Display P3 (Argyll 3D)
Gamma: 2.51
CCT: 7659 K
| Schenker XMG A707 Coffee Lake LG Philips LP173WF4-SPF5 (LGD056D), IPS, 1920x1080 | Nexoc G739 CMN1738, IPS, 1920x1080 | Acer Predator Helios 300 PH317-52-51M6 LG Philips LP173WF4-SPF5 (LGD056D), IPS, 1920x1080 | Asus GL703GE-ES73 Chi Mei CMN1747, TN, 1920x1080 | |
|---|---|---|---|---|
| Display | 6% | 2% | 30% | |
| Display P3 Coverage (%) | 66.1 | 66.7 1% | 67.1 2% | 90.1 36% |
| sRGB Coverage (%) | 84.4 | 91 8% | 86.1 2% | 99.8 18% |
| AdobeRGB 1998 Coverage (%) | 61.7 | 66.4 8% | 63 2% | 83.1 35% |
| Response Times | -18% | 7% | 66% | |
| Response Time Grey 50% / Grey 80% * (ms) | 39.2 ? | 45 ? -15% | 36 ? 8% | 11.6 ? 70% |
| Response Time Black / White * (ms) | 23.2 ? | 28 ? -21% | 22 ? 5% | 8.8 ? 62% |
| PWM Frequency (Hz) | 119000 ? | 450 ? | 122000 ? | 26040 ? |
| Screen | 12% | -3% | 15% | |
| Brightness middle (cd/m²) | 362 | 312 -14% | 365 1% | 331.1 -9% |
| Brightness (cd/m²) | 350 | 304 -13% | 341 -3% | 312 -11% |
| Brightness Distribution (%) | 91 | 85 -7% | 89 -2% | 86 -5% |
| Black Level * (cd/m²) | 0.29 | 0.23 21% | 0.32 -10% | 0.31 -7% |
| Contrast (:1) | 1248 | 1357 9% | 1141 -9% | 1068 -14% |
| Colorchecker dE 2000 * | 6.06 | 4.19 31% | 6.51 -7% | 2.86 53% |
| Colorchecker dE 2000 max. * | 11.6 | 8.7 25% | 12.32 -6% | 6.35 45% |
| Colorchecker dE 2000 calibrated * | 3.13 | 2.9 7% | 2.66 15% | |
| Greyscale dE 2000 * | 7.22 | 3.72 48% | 7.65 -6% | 4.3 40% |
| Gamma | 2.51 88% | 2.29 96% | 2.64 83% | 2.268 97% |
| CCT | 7659 85% | 7104 91% | 8066 81% | 7034 92% |
| Color Space (Percent of AdobeRGB 1998) (%) | 55 | 59 7% | 56 2% | 75 36% |
| Color Space (Percent of sRGB) (%) | 84 | 91 8% | 86 2% | 100 19% |
| Média Total (Programa/Configurações) | 0% /
6% | 2% /
-1% | 37% /
24% |
* ... menor é melhor
Exibir tempos de resposta
| ↔ Tempo de resposta preto para branco | ||
|---|---|---|
| 23.2 ms ... ascensão ↗ e queda ↘ combinadas | ↗ 10.8 ms ascensão | 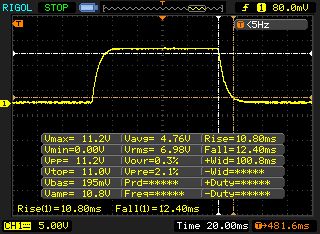 |
| ↘ 12.4 ms queda | ||
| A tela mostra boas taxas de resposta em nossos testes, mas pode ser muito lenta para jogadores competitivos. Em comparação, todos os dispositivos testados variam de 0.1 (mínimo) a 240 (máximo) ms. » 53 % de todos os dispositivos são melhores. Isso significa que o tempo de resposta medido é pior que a média de todos os dispositivos testados (19.8 ms). | ||
| ↔ Tempo de resposta 50% cinza a 80% cinza | ||
| 39.2 ms ... ascensão ↗ e queda ↘ combinadas | ↗ 20.4 ms ascensão | 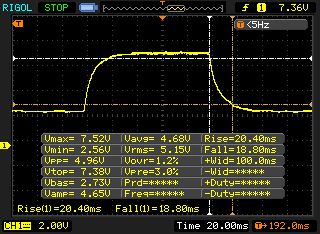 |
| ↘ 18.8 ms queda | ||
| A tela mostra taxas de resposta lentas em nossos testes e será insatisfatória para os jogadores. Em comparação, todos os dispositivos testados variam de 0.165 (mínimo) a 636 (máximo) ms. » 60 % de todos os dispositivos são melhores. Isso significa que o tempo de resposta medido é pior que a média de todos os dispositivos testados (30.9 ms). | ||
Cintilação da tela / PWM (modulação por largura de pulso)
| Tela tremeluzindo/PWM detectado | 119000 Hz | ≤ 90 % configuração de brilho | 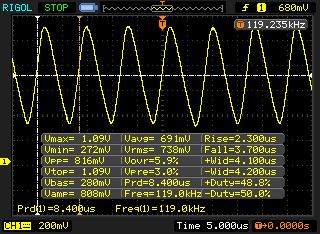 |
A luz de fundo da tela pisca em 119000 Hz (pior caso, por exemplo, utilizando PWM) Cintilação detectada em uma configuração de brilho de 90 % e abaixo. Não deve haver cintilação ou PWM acima desta configuração de brilho. A frequência de 119000 Hz é bastante alta, então a maioria dos usuários sensíveis ao PWM não deve notar nenhuma oscilação. [pwm_comparison] Em comparação: 52 % de todos os dispositivos testados não usam PWM para escurecer a tela. Se PWM foi detectado, uma média de 7744 (mínimo: 5 - máximo: 343500) Hz foi medida. | |||
| PCMark 10 - Score | |
| Média da turma Gaming (5828 - 12414, n=93, últimos 2 anos) | |
| Schenker XMG A707 Coffee Lake | |
| Asus GL703GE-ES73 | |
| PCMark 8 | |
| Home Score Accelerated v2 | |
| Média da turma Gaming (n=1últimos 2 anos) | |
| Nexoc G739 | |
| Acer Predator Helios 300 PH317-52-51M6 | |
| Schenker XMG A707 Coffee Lake | |
| Asus GL703GE-ES73 | |
| Work Score Accelerated v2 | |
| Schenker XMG A707 Coffee Lake | |
| Acer Predator Helios 300 PH317-52-51M6 | |
| Asus GL703GE-ES73 | |
| Nexoc G739 | |
| Média da turma Gaming (n=1últimos 2 anos) | |
| PCMark 8 Home Score Accelerated v2 | 4196 pontos | |
| PCMark 8 Work Score Accelerated v2 | 5389 pontos | |
| PCMark 10 Score | 4734 pontos | |
Ajuda | ||
| Schenker XMG A707 Coffee Lake Samsung SSD 970 EVO 250GB | Nexoc G739 Samsung PM961 MZVLW256HEHP | Acer Predator Helios 300 PH317-52-51M6 Hynix HFS128G39TND | Asus GL703GE-ES73 Kingston RBUSNS8154P3128GJ | |
|---|---|---|---|---|
| AS SSD | -3% | -70% | -71% | |
| Seq Read (MB/s) | 2589 | 2628 2% | 513 -80% | 993 -62% |
| Seq Write (MB/s) | 1449 | 1164 -20% | 128.2 -91% | 212.8 -85% |
| 4K Read (MB/s) | 52.8 | 47.68 -10% | 26.5 -50% | 18.93 -64% |
| 4K Write (MB/s) | 112.3 | 148.5 32% | 62.7 -44% | 59.1 -47% |
| Score Read (Points) | 1153 | 1619 40% | 414 -64% | 311 -73% |
| Score Write (Points) | 1592 | 651 -59% | 196 -88% | 196 -88% |
| Score Total (Points) | 3291 | 3031 -8% | 811 -75% | 634 -81% |

| 3DMark - 1920x1080 Fire Strike Graphics | |
| Média da turma Gaming (18629 - 62849, n=112, últimos 2 anos) | |
| Nexoc G739 | |
| Asus GL703GE-ES73 | |
| Schenker XMG A707 Coffee Lake | |
| Acer Predator Helios 300 PH317-52-51M6 | |
| 3DMark 11 - 1280x720 Performance GPU | |
| Média da turma Gaming (21841 - 80022, n=103, últimos 2 anos) | |
| Nexoc G739 | |
| Schenker XMG A707 Coffee Lake | |
| Acer Predator Helios 300 PH317-52-51M6 | |
| Asus GL703GE-ES73 | |
| 3DMark 11 Performance | 9585 pontos | |
| 3DMark Cloud Gate Standard Score | 27238 pontos | |
| 3DMark Fire Strike Score | 6956 pontos | |
Ajuda | ||
| The Witcher 3 | |
| 1920x1080 Ultra Graphics & Postprocessing (HBAO+) | |
| Média da turma Gaming (104.7 - 240, n=7, últimos 2 anos) | |
| Nexoc G739 | |
| Asus GL703GE-ES73 | |
| Acer Predator Helios 300 PH317-52-51M6 | |
| Schenker XMG A707 Coffee Lake | |
| 1920x1080 High Graphics & Postprocessing (Nvidia HairWorks Off) | |
| Média da turma Gaming (341 - 404, n=2, últimos 2 anos) | |
| Nexoc G739 | |
| Acer Predator Helios 300 PH317-52-51M6 | |
| Schenker XMG A707 Coffee Lake | |
| baixo | média | alto | ultra | |
|---|---|---|---|---|
| The Witcher 3 (2015) | 44.6 | 24.7 | ||
| The Division (2016) | 43.7 | 33.5 | ||
| Mirror's Edge Catalyst (2016) | 49.3 | 44.9 | ||
| Dishonored 2 (2016) | 47 | 41.2 | ||
| Watch Dogs 2 (2016) | 40.1 | 27.9 | ||
| FIFA 18 (2017) | 205 | 194 | ||
| Wolfenstein II: The New Colossus (2017) | 54.4 | |||
| Need for Speed Payback (2017) | 56.1 | 51.2 | ||
| Star Wars Battlefront 2 (2017) | 50.3 | 40.8 | ||
| The Crew 2 (2018) | 46.7 | 42.2 |
Barulho
| Ocioso |
| 31 / 32 / 44 dB |
| HDD |
| 32 dB |
| Carga |
| 44 / 46 dB |
 | ||
30 dB silencioso 40 dB(A) audível 50 dB(A) ruidosamente alto |
||
min: | ||
| Schenker XMG A707 Coffee Lake i7-8750H, GeForce GTX 1050 Ti Mobile | Nexoc G739 i7-7700HQ, GeForce GTX 1050 Ti Mobile | Acer Predator Helios 300 PH317-52-51M6 i5-8300H, GeForce GTX 1050 Ti Mobile | Asus GL703GE-ES73 i7-8750H, GeForce GTX 1050 Ti Mobile | Média da turma Gaming | |
|---|---|---|---|---|---|
| Noise | 0% | 2% | 6% | 10% | |
| desligado / ambiente * (dB) | 29 | 30 -3% | 29 -0% | 28.2 3% | 24.1 ? 17% |
| Idle Minimum * (dB) | 31 | 31 -0% | 29 6% | 28.2 9% | 25.9 ? 16% |
| Idle Average * (dB) | 32 | 32 -0% | 31 3% | 30 6% | 27.4 ? 14% |
| Idle Maximum * (dB) | 44 | 38 14% | 33 25% | 32 27% | 30.1 ? 32% |
| Load Average * (dB) | 44 | 44 -0% | 45 -2% | 36 18% | 43.7 ? 1% |
| Witcher 3 ultra * (dB) | 42 | 45 -7% | 48.8 -16% | ||
| Load Maximum * (dB) | 46 | 50 -9% | 51 -11% | 48.8 -6% | 54.3 ? -18% |
* ... menor é melhor
(-) A temperatura máxima no lado superior é 55 °C / 131 F, em comparação com a média de 40.4 °C / 105 F , variando de 21.2 a 68.8 °C para a classe Gaming.
(-) A parte inferior aquece até um máximo de 49 °C / 120 F, em comparação com a média de 43.2 °C / 110 F
(+) Em uso inativo, a temperatura média para o lado superior é 27.9 °C / 82 F, em comparação com a média do dispositivo de 33.9 °C / ### class_avg_f### F.
(-) Jogando The Witcher 3, a temperatura média para o lado superior é 42.1 °C / 108 F, em comparação com a média do dispositivo de 33.9 °C / ## #class_avg_f### F.
(±) Os apoios para as mãos e o touchpad podem ficar muito quentes ao toque, com um máximo de 39 °C / 102.2 F.
(-) A temperatura média da área do apoio para as mãos de dispositivos semelhantes foi 28.8 °C / 83.8 F (-10.2 °C / -18.4 F).
| Schenker XMG A707 Coffee Lake i7-8750H, GeForce GTX 1050 Ti Mobile | Nexoc G739 i7-7700HQ, GeForce GTX 1050 Ti Mobile | Acer Predator Helios 300 PH317-52-51M6 i5-8300H, GeForce GTX 1050 Ti Mobile | Asus GL703GE-ES73 i7-8750H, GeForce GTX 1050 Ti Mobile | Média da turma Gaming | |
|---|---|---|---|---|---|
| Heat | 9% | 3% | -12% | 6% | |
| Maximum Upper Side * (°C) | 55 | 50.6 8% | 50 9% | 58.6 -7% | 45.1 ? 18% |
| Maximum Bottom * (°C) | 49 | 50.8 -4% | 52 -6% | 59.4 -21% | 48.1 ? 2% |
| Idle Upper Side * (°C) | 32 | 28.7 10% | 33 -3% | 35 -9% | 31 ? 3% |
| Idle Bottom * (°C) | 34 | 27.1 20% | 30 12% | 37 -9% | 34.2 ? -1% |
* ... menor é melhor
Schenker XMG A707 Coffee Lake análise de áudio
(±) | o volume do alto-falante é médio, mas bom (###valor### dB)
Graves 100 - 315Hz
(-) | quase nenhum baixo - em média 26.4% menor que a mediana
(±) | a linearidade dos graves é média (12.6% delta para a frequência anterior)
Médios 400 - 2.000 Hz
(±) | médios mais altos - em média 6.9% maior que a mediana
(±) | a linearidade dos médios é média (9.4% delta para frequência anterior)
Altos 2 - 16 kHz
(±) | máximos mais altos - em média 6.4% maior que a mediana
(±) | a linearidade dos máximos é média (8.5% delta para frequência anterior)
Geral 100 - 16.000 Hz
(-) | o som geral não é linear (31.1% diferença em relação à mediana)
Comparado com a mesma classe
» 97% de todos os dispositivos testados nesta classe foram melhores, 2% semelhantes, 2% piores
» O melhor teve um delta de 6%, a média foi 18%, o pior foi 132%
Comparado com todos os dispositivos testados
» 90% de todos os dispositivos testados foram melhores, 2% semelhantes, 8% piores
» O melhor teve um delta de 4%, a média foi 23%, o pior foi 134%
Acer Predator Helios 300 PH317-52-51M6 análise de áudio
(+) | os alto-falantes podem tocar relativamente alto (###valor### dB)
Graves 100 - 315Hz
(±) | graves reduzidos - em média 10.8% menor que a mediana
(-) | graves não são lineares (15.2% delta para frequência anterior)
Médios 400 - 2.000 Hz
(±) | médios mais altos - em média 9.7% maior que a mediana
(+) | médios são lineares (6.7% delta para frequência anterior)
Altos 2 - 16 kHz
(+) | agudos equilibrados - apenas 3.2% longe da mediana
(+) | os máximos são lineares (5.6% delta da frequência anterior)
Geral 100 - 16.000 Hz
(±) | a linearidade do som geral é média (18.4% diferença em relação à mediana)
Comparado com a mesma classe
» 59% de todos os dispositivos testados nesta classe foram melhores, 9% semelhantes, 32% piores
» O melhor teve um delta de 6%, a média foi 18%, o pior foi 132%
Comparado com todos os dispositivos testados
» 41% de todos os dispositivos testados foram melhores, 8% semelhantes, 51% piores
» O melhor teve um delta de 4%, a média foi 23%, o pior foi 134%
| desligado | |
| Ocioso | |
| Carga |
|
Key:
min: | |
| Schenker XMG A707 Coffee Lake i7-8750H, GeForce GTX 1050 Ti Mobile | Nexoc G739 i7-7700HQ, GeForce GTX 1050 Ti Mobile | Acer Predator Helios 300 PH317-52-51M6 i5-8300H, GeForce GTX 1050 Ti Mobile | Asus GL703GE-ES73 i7-8750H, GeForce GTX 1050 Ti Mobile | Média da turma Gaming | |
|---|---|---|---|---|---|
| Power Consumption | 3% | 19% | -14% | -37% | |
| Idle Minimum * (Watt) | 11 | 7 36% | 6 45% | 12.8 -16% | 13.1 ? -19% |
| Idle Average * (Watt) | 14 | 14 -0% | 9 36% | 18.1 -29% | 19 ? -36% |
| Idle Maximum * (Watt) | 20 | 23 -15% | 13 35% | 24.7 -23% | 24.6 ? -23% |
| Load Average * (Watt) | 96 | 82 15% | 95 1% | 98.4 -3% | 111.3 ? -16% |
| Witcher 3 ultra * (Watt) | 97 | 102 -5% | 122.5 -26% | ||
| Load Maximum * (Watt) | 136 | 163 -20% | 134 1% | 114.6 16% | 260 ? -91% |
* ... menor é melhor
| Schenker XMG A707 Coffee Lake i7-8750H, GeForce GTX 1050 Ti Mobile, 62 Wh | Nexoc G739 i7-7700HQ, GeForce GTX 1050 Ti Mobile, 62 Wh | Acer Predator Helios 300 PH317-52-51M6 i5-8300H, GeForce GTX 1050 Ti Mobile, 48 Wh | Asus GL703GE-ES73 i7-8750H, GeForce GTX 1050 Ti Mobile, 64 Wh | Média da turma Gaming | |
|---|---|---|---|---|---|
| Duração da bateria | -16% | -11% | -47% | -20% | |
| Reader / Idle (h) | 11.7 | 10.2 -13% | 11.8 1% | 5.8 -50% | 7.84 ? -33% |
| WiFi v1.3 (h) | 6.3 | 4.8 -24% | 5.9 -6% | 4.8 -24% | 7.08 ? 12% |
| Load (h) | 2.4 | 2.1 -12% | 1.7 -29% | 0.8 -67% | 1.496 ? -38% |
| H.264 (h) | 5.4 | 8.27 ? |
Pro
Contra
Schenker XMG A707 Coffee Lake
- 07/07/2018 v6 (old)
Florian Glaser
Price comparison