Breve Análise do Portátil Dell Vostro 15 5568 (Core i5, Full-HD)
| SD Card Reader | |
| average JPG Copy Test (av. of 3 runs) | |
| HP ProBook 450 G4 Y8B60EA | |
| Acer TravelMate P259-MG-71UU | |
| Lenovo ThinkPad E570-20H6S00000 | |
| Dell Vostro 15-5568 | |
| maximum AS SSD Seq Read Test (1GB) | |
| HP ProBook 450 G4 Y8B60EA | |
| Lenovo ThinkPad E570-20H6S00000 | |
| Dell Vostro 15-5568 | |
| Networking | |
| iperf3 transmit AX12 | |
| Acer TravelMate P259-MG-71UU | |
| Lenovo ThinkPad E570-20H6S00000 | |
| Dell Vostro 15-5568 | |
| iperf3 receive AX12 | |
| Acer TravelMate P259-MG-71UU | |
| Lenovo ThinkPad E570-20H6S00000 | |
| Dell Vostro 15-5568 | |
| |||||||||||||||||||||||||
iluminação: 82 %
iluminação com acumulador: 231 cd/m²
Contraste: 409:1 (Preto: 0.56 cd/m²)
ΔE ColorChecker Calman: 10.36 | ∀{0.5-29.43 Ø4.71}
ΔE Greyscale Calman: 10.9 | ∀{0.09-98 Ø4.96}
57.92% sRGB (Argyll 1.6.3 3D)
37.69% AdobeRGB 1998 (Argyll 1.6.3 3D)
Gamma: 2.21
CCT: 10084 K
| Dell Vostro 15-5568 Chi Mei CMN154C-8KV42 , , 1920x1080, 15.6" | Lenovo ThinkPad E570-20H6S00000 AUO B156HAN04.4, , 1920x1080, 15.6" | HP ProBook 450 G4 Y8B60EA Chi Mei CMN15C4, , 1920x1080, 15.6" | Acer TravelMate P259-MG-71UU BOE NT156FHM-N41, , 1920x1080, 15.6" | |
|---|---|---|---|---|
| Display | ||||
| Display P3 Coverage (%) | 38.65 | 39.89 | 38.58 | |
| sRGB Coverage (%) | 58 | 59.5 | 58 | |
| AdobeRGB 1998 Coverage (%) | 39.94 | 41.24 | 39.85 | |
| Response Times | 6% | -9% | 15% | |
| Response Time Grey 50% / Grey 80% * (ms) | 47.6 ? | 44.8 ? 6% | 51 ? -7% | 43 ? 10% |
| Response Time Black / White * (ms) | 27.2 ? | 25.6 ? 6% | 30 ? -10% | 22 ? 19% |
| PWM Frequency (Hz) | 50 ? | |||
| Screen | 37% | -0% | -3% | |
| Brightness middle (cd/m²) | 229 | 242 6% | 214 -7% | 180 -21% |
| Brightness (cd/m²) | 222 | 243 9% | 201 -9% | 178 -20% |
| Brightness Distribution (%) | 82 | 75 -9% | 77 -6% | 93 13% |
| Black Level * (cd/m²) | 0.56 | 0.24 57% | 0.43 23% | 0.45 20% |
| Contrast (:1) | 409 | 1008 146% | 498 22% | 400 -2% |
| Colorchecker dE 2000 * | 10.36 | 4.65 55% | 10.68 -3% | 9.91 4% |
| Colorchecker dE 2000 max. * | 14.95 | 9.64 36% | 18.07 -21% | 18.19 -22% |
| Greyscale dE 2000 * | 10.9 | 3.39 69% | 11.32 -4% | 11.25 -3% |
| Gamma | 2.21 100% | 2.7 81% | 2.26 97% | 2.35 94% |
| CCT | 10084 64% | 6246 104% | 12204 53% | 12115 54% |
| Color Space (Percent of AdobeRGB 1998) (%) | 37.69 | 36.69 -3% | 38 1% | 37 -2% |
| Color Space (Percent of sRGB) (%) | 57.92 | 57.66 0% | 59 2% | 58 0% |
| Média Total (Programa/Configurações) | 22% /
32% | -5% /
-2% | 6% /
-0% |
* ... menor é melhor
Exibir tempos de resposta
| ↔ Tempo de resposta preto para branco | ||
|---|---|---|
| 27.2 ms ... ascensão ↗ e queda ↘ combinadas | ↗ 10 ms ascensão | 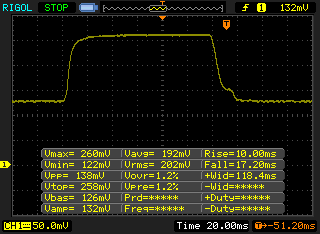 |
| ↘ 17.2 ms queda | ||
| A tela mostra taxas de resposta relativamente lentas em nossos testes e pode ser muito lenta para os jogadores. Em comparação, todos os dispositivos testados variam de 0.1 (mínimo) a 240 (máximo) ms. » 69 % de todos os dispositivos são melhores. Isso significa que o tempo de resposta medido é pior que a média de todos os dispositivos testados (19.8 ms). | ||
| ↔ Tempo de resposta 50% cinza a 80% cinza | ||
| 47.6 ms ... ascensão ↗ e queda ↘ combinadas | ↗ 24.4 ms ascensão | 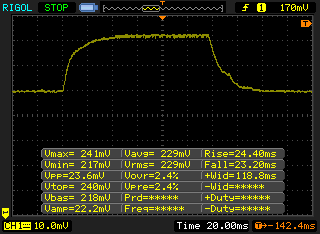 |
| ↘ 23.2 ms queda | ||
| A tela mostra taxas de resposta lentas em nossos testes e será insatisfatória para os jogadores. Em comparação, todos os dispositivos testados variam de 0.165 (mínimo) a 636 (máximo) ms. » 82 % de todos os dispositivos são melhores. Isso significa que o tempo de resposta medido é pior que a média de todos os dispositivos testados (30.9 ms). | ||
Cintilação da tela / PWM (modulação por largura de pulso)
| Tela tremeluzindo / PWM não detectado | ||
[pwm_comparison] Em comparação: 52 % de todos os dispositivos testados não usam PWM para escurecer a tela. Se PWM foi detectado, uma média de 7744 (mínimo: 5 - máximo: 343500) Hz foi medida. | ||
| PCMark 8 | |
| Home Score Accelerated v2 | |
| Acer TravelMate P259-MG-71UU | |
| Lenovo ThinkPad E570-20H6S00000 | |
| Dell Vostro 15-5568 | |
| HP ProBook 450 G4 Y8B60EA | |
| Work Score Accelerated v2 | |
| HP ProBook 450 G4 Y8B60EA | |
| Acer TravelMate P259-MG-71UU | |
| Lenovo ThinkPad E570-20H6S00000 | |
| Dell Vostro 15-5568 | |
| PCMark 7 Score | 5113 pontos | |
| PCMark 8 Home Score Accelerated v2 | 3331 pontos | |
| PCMark 8 Creative Score Accelerated v2 | 4276 pontos | |
| PCMark 8 Work Score Accelerated v2 | 4573 pontos | |
Ajuda | ||
| Dell Vostro 15-5568 SanDisk X400 256GB, SATA (SD8SB8U-256G) | Lenovo ThinkPad E570-20H6S00000 Toshiba THNSF5256GPUK | HP ProBook 450 G4 Y8B60EA SanDisk SD8SNAT256G1002 | Acer TravelMate P259-MG-71UU Liteonit CV3-8D256 | |
|---|---|---|---|---|
| AS SSD | 66% | -5% | -3% | |
| Seq Read (MB/s) | 502 | 1227 144% | 493.8 -2% | 402.9 -20% |
| Seq Write (MB/s) | 465.2 | 636 37% | 315.9 -32% | 333.5 -28% |
| 4K Read (MB/s) | 26.84 | 37.12 38% | 17.96 -33% | 29.56 10% |
| 4K Write (MB/s) | 50.3 | 73.1 45% | 73.4 46% | 62.9 25% |

| 3DMark 11 - 1280x720 Performance GPU | |
| Lenovo ThinkPad E570-20H6S00000 | |
| Acer TravelMate P259-MG-71UU | |
| HP ProBook 450 G4 Y8B60EA | |
| Acer Swift 5 SF514-51-59AV | |
| HP ProBook 430 G4-Y8B47EA | |
| Dell Vostro 15-5568 | |
| 3DMark | |
| 1280x720 Cloud Gate Standard Graphics | |
| Lenovo ThinkPad E570-20H6S00000 | |
| Acer TravelMate P259-MG-71UU | |
| HP ProBook 450 G4 Y8B60EA | |
| Acer Swift 5 SF514-51-59AV | |
| HP ProBook 430 G4-Y8B47EA | |
| Dell Vostro 15-5568 | |
| 1920x1080 Fire Strike Graphics | |
| Lenovo ThinkPad E570-20H6S00000 | |
| Acer TravelMate P259-MG-71UU | |
| HP ProBook 450 G4 Y8B60EA | |
| HP ProBook 430 G4-Y8B47EA | |
| Dell Vostro 15-5568 | |
| 3DMark 11 Performance | 1490 pontos | |
| 3DMark Cloud Gate Standard Score | 5503 pontos | |
| 3DMark Fire Strike Score | 716 pontos | |
Ajuda | ||
| baixo | média | alto | ultra | |
|---|---|---|---|---|
| Tomb Raider (2013) | 61.5 | 32.2 | 17.9 | 8.9 |
| BioShock Infinite (2013) | 39.9 | 23 | 18.8 | 6 |
| The Witcher 3 (2015) | 12.3 |
Barulho
| Ocioso |
| 29 / 29 / 29 dB |
| Carga |
| 33.9 / 37 dB |
 | ||
30 dB silencioso 40 dB(A) audível 50 dB(A) ruidosamente alto |
||
min: | ||
(+) A temperatura máxima no lado superior é 38 °C / 100 F, em comparação com a média de 34.3 °C / 94 F , variando de 21.2 a 62.5 °C para a classe Office.
(+) A parte inferior aquece até um máximo de 39 °C / 102 F, em comparação com a média de 36.8 °C / 98 F
(+) Em uso inativo, a temperatura média para o lado superior é 23.6 °C / 74 F, em comparação com a média do dispositivo de 29.5 °C / ### class_avg_f### F.
(+) Os apoios para as mãos e o touchpad são mais frios que a temperatura da pele, com um máximo de 25.6 °C / 78.1 F e, portanto, são frios ao toque.
(±) A temperatura média da área do apoio para as mãos de dispositivos semelhantes foi 27.6 °C / 81.7 F (+2 °C / 3.6 F).
| Dell Vostro 15-5568 HD Graphics 620, i5-7200U, SanDisk X400 256GB, SATA (SD8SB8U-256G) | Lenovo ThinkPad E570-20H6S00000 GeForce GTX 950M, i5-7200U, Toshiba THNSF5256GPUK | HP ProBook 450 G4 Y8B60EA GeForce 930MX, i7-7500U, SanDisk SD8SNAT256G1002 | Acer TravelMate P259-MG-71UU GeForce 940MX, 6500U, Liteonit CV3-8D256 | |
|---|---|---|---|---|
| Heat | -5% | -7% | 1% | |
| Maximum Upper Side * (°C) | 38 | 46.6 -23% | 44.3 -17% | 35.1 8% |
| Maximum Bottom * (°C) | 39 | 49.1 -26% | 46.3 -19% | 46.7 -20% |
| Idle Upper Side * (°C) | 25.7 | 24.6 4% | 27.8 -8% | 27 -5% |
| Idle Bottom * (°C) | 33.8 | 25.1 26% | 27.7 18% | 27.4 19% |
* ... menor é melhor
Dell Vostro 15-5568 análise de áudio
(+) | os alto-falantes podem tocar relativamente alto (###valor### dB)
Graves 100 - 315Hz
(-) | quase nenhum baixo - em média 16.9% menor que a mediana
(-) | graves não são lineares (16.4% delta para frequência anterior)
Médios 400 - 2.000 Hz
(±) | médios mais altos - em média 9% maior que a mediana
(±) | a linearidade dos médios é média (9.4% delta para frequência anterior)
Altos 2 - 16 kHz
(+) | agudos equilibrados - apenas 4.8% longe da mediana
(+) | os máximos são lineares (6.6% delta da frequência anterior)
Geral 100 - 16.000 Hz
(±) | a linearidade do som geral é média (23.6% diferença em relação à mediana)
Comparado com a mesma classe
» 67% de todos os dispositivos testados nesta classe foram melhores, 8% semelhantes, 25% piores
» O melhor teve um delta de 7%, a média foi 21%, o pior foi 53%
Comparado com todos os dispositivos testados
» 71% de todos os dispositivos testados foram melhores, 6% semelhantes, 23% piores
» O melhor teve um delta de 4%, a média foi 23%, o pior foi 134%
Lenovo ThinkPad E570-20H6S00000 análise de áudio
(±) | o volume do alto-falante é médio, mas bom (###valor### dB)
Graves 100 - 315Hz
(-) | quase nenhum baixo - em média 16.8% menor que a mediana
(-) | graves não são lineares (16.4% delta para frequência anterior)
Médios 400 - 2.000 Hz
(±) | médios mais altos - em média 5.1% maior que a mediana
(±) | a linearidade dos médios é média (9.5% delta para frequência anterior)
Altos 2 - 16 kHz
(+) | agudos equilibrados - apenas 2.7% longe da mediana
(+) | os máximos são lineares (6.5% delta da frequência anterior)
Geral 100 - 16.000 Hz
(±) | a linearidade do som geral é média (19.6% diferença em relação à mediana)
Comparado com a mesma classe
» 64% de todos os dispositivos testados nesta classe foram melhores, 7% semelhantes, 29% piores
» O melhor teve um delta de 5%, a média foi 17%, o pior foi 45%
Comparado com todos os dispositivos testados
» 49% de todos os dispositivos testados foram melhores, 7% semelhantes, 44% piores
» O melhor teve um delta de 4%, a média foi 23%, o pior foi 134%
| desligado | |
| Ocioso | |
| Carga |
|
Key:
min: | |
| Dell Vostro 15-5568 i5-7200U, HD Graphics 620, SanDisk X400 256GB, SATA (SD8SB8U-256G), TN LED, 1920x1080, 15.6" | Lenovo ThinkPad E570-20H6S00000 i5-7200U, GeForce GTX 950M, Toshiba THNSF5256GPUK, IPS LED, 1920x1080, 15.6" | HP ProBook 450 G4 Y8B60EA i7-7500U, GeForce 930MX, SanDisk SD8SNAT256G1002, TN LED, 1920x1080, 15.6" | Acer TravelMate P259-MG-71UU 6500U, GeForce 940MX, Liteonit CV3-8D256, TN LED, 1920x1080, 15.6" | |
|---|---|---|---|---|
| Power Consumption | -22% | -19% | -45% | |
| Idle Minimum * (Watt) | 3.3 | 2.8 15% | 3.8 -15% | 7 -112% |
| Idle Average * (Watt) | 6.8 | 6.3 7% | 6.6 3% | 8 -18% |
| Idle Maximum * (Watt) | 7.7 | 6.9 10% | 11.3 -47% | 10.6 -38% |
| Load Average * (Watt) | 30.9 | 51.6 -67% | 38 -23% | 39.7 -28% |
| Load Maximum * (Watt) | 40.3 | 69.7 -73% | 45 -12% | 51.9 -29% |
* ... menor é melhor
| Dell Vostro 15-5568 i5-7200U, HD Graphics 620, 42 Wh | Lenovo ThinkPad E570-20H6S00000 i5-7200U, GeForce GTX 950M, 41 Wh | HP ProBook 450 G4 Y8B60EA i7-7500U, GeForce 930MX, 45 Wh | Acer TravelMate P259-MG-71UU 6500U, GeForce 940MX, 41 Wh | |
|---|---|---|---|---|
| Duração da bateria | 12% | 11% | -41% | |
| Reader / Idle (h) | 16.9 | 14.7 -13% | 12.4 -27% | 10.3 -39% |
| H.264 (h) | 8.5 | 4.1 -52% | ||
| WiFi v1.3 (h) | 6 | 7.7 28% | 8.6 43% | 4.7 -22% |
| Load (h) | 1.8 | 2.2 22% | 2.1 17% | 0.9 -50% |
Pro
Contra
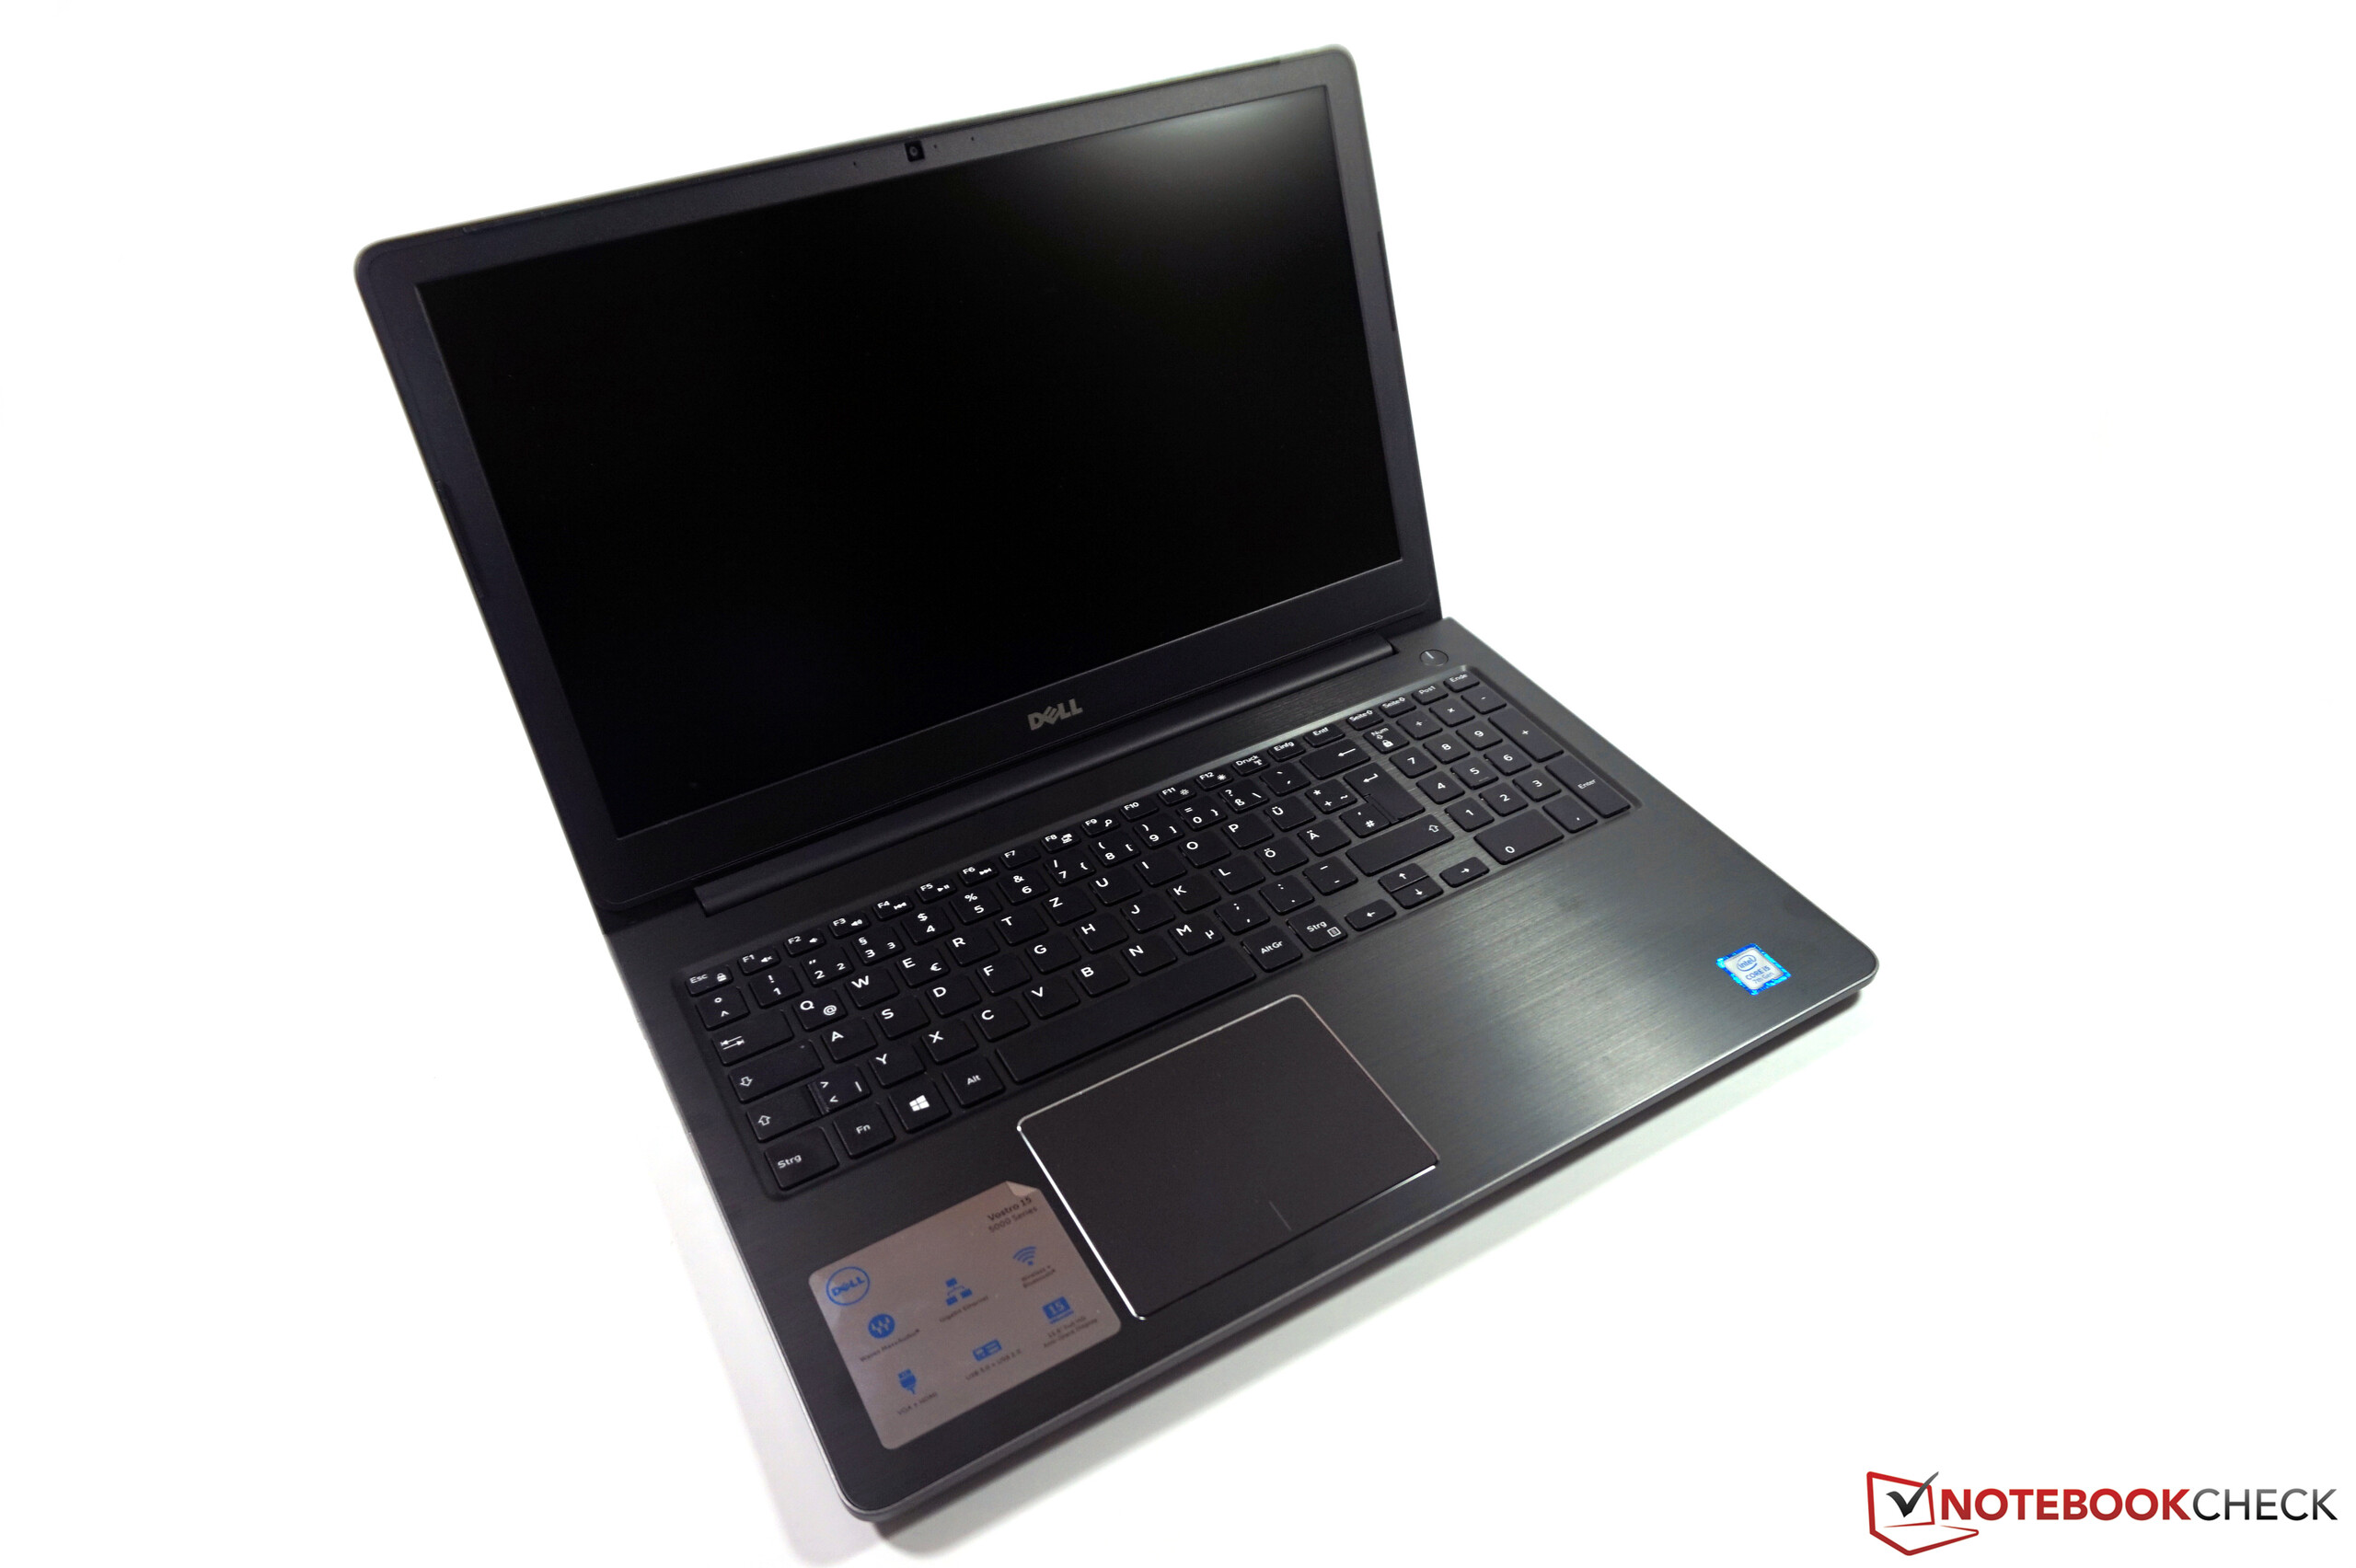
O Dell Vostro 15 é um bom portátil de escritório Que haja alguns compromissos em comparação com portáteis empresariais mais caros não deveria ser uma surpresa. No entanto, não existem problemas sérios que nos fariam desistir de comprá-lo. É claro que a tela TN FHD é afetada pelos altos desvios das cores e uma forte tonalidade azul de fábrica, mas certamente isto não nos faria desistir para as típicas tarefas de escritório (correios, folhas eletrônicas, apresentações, vídeo conferências, etc.). Nos também testamos os paineis TN com ângulos de visão piores.
Existem outras desvantagens como os medíocres dispositivos de entrada, as taxas de transferência bastante lentas do WLAN, os recursos de segurança e os alto falantes pobres. Alguns destes aspectos podem ser melhorados com atualizações opcionais (iluminação do teclado, sensor de digitais, outro módulo WLAN).
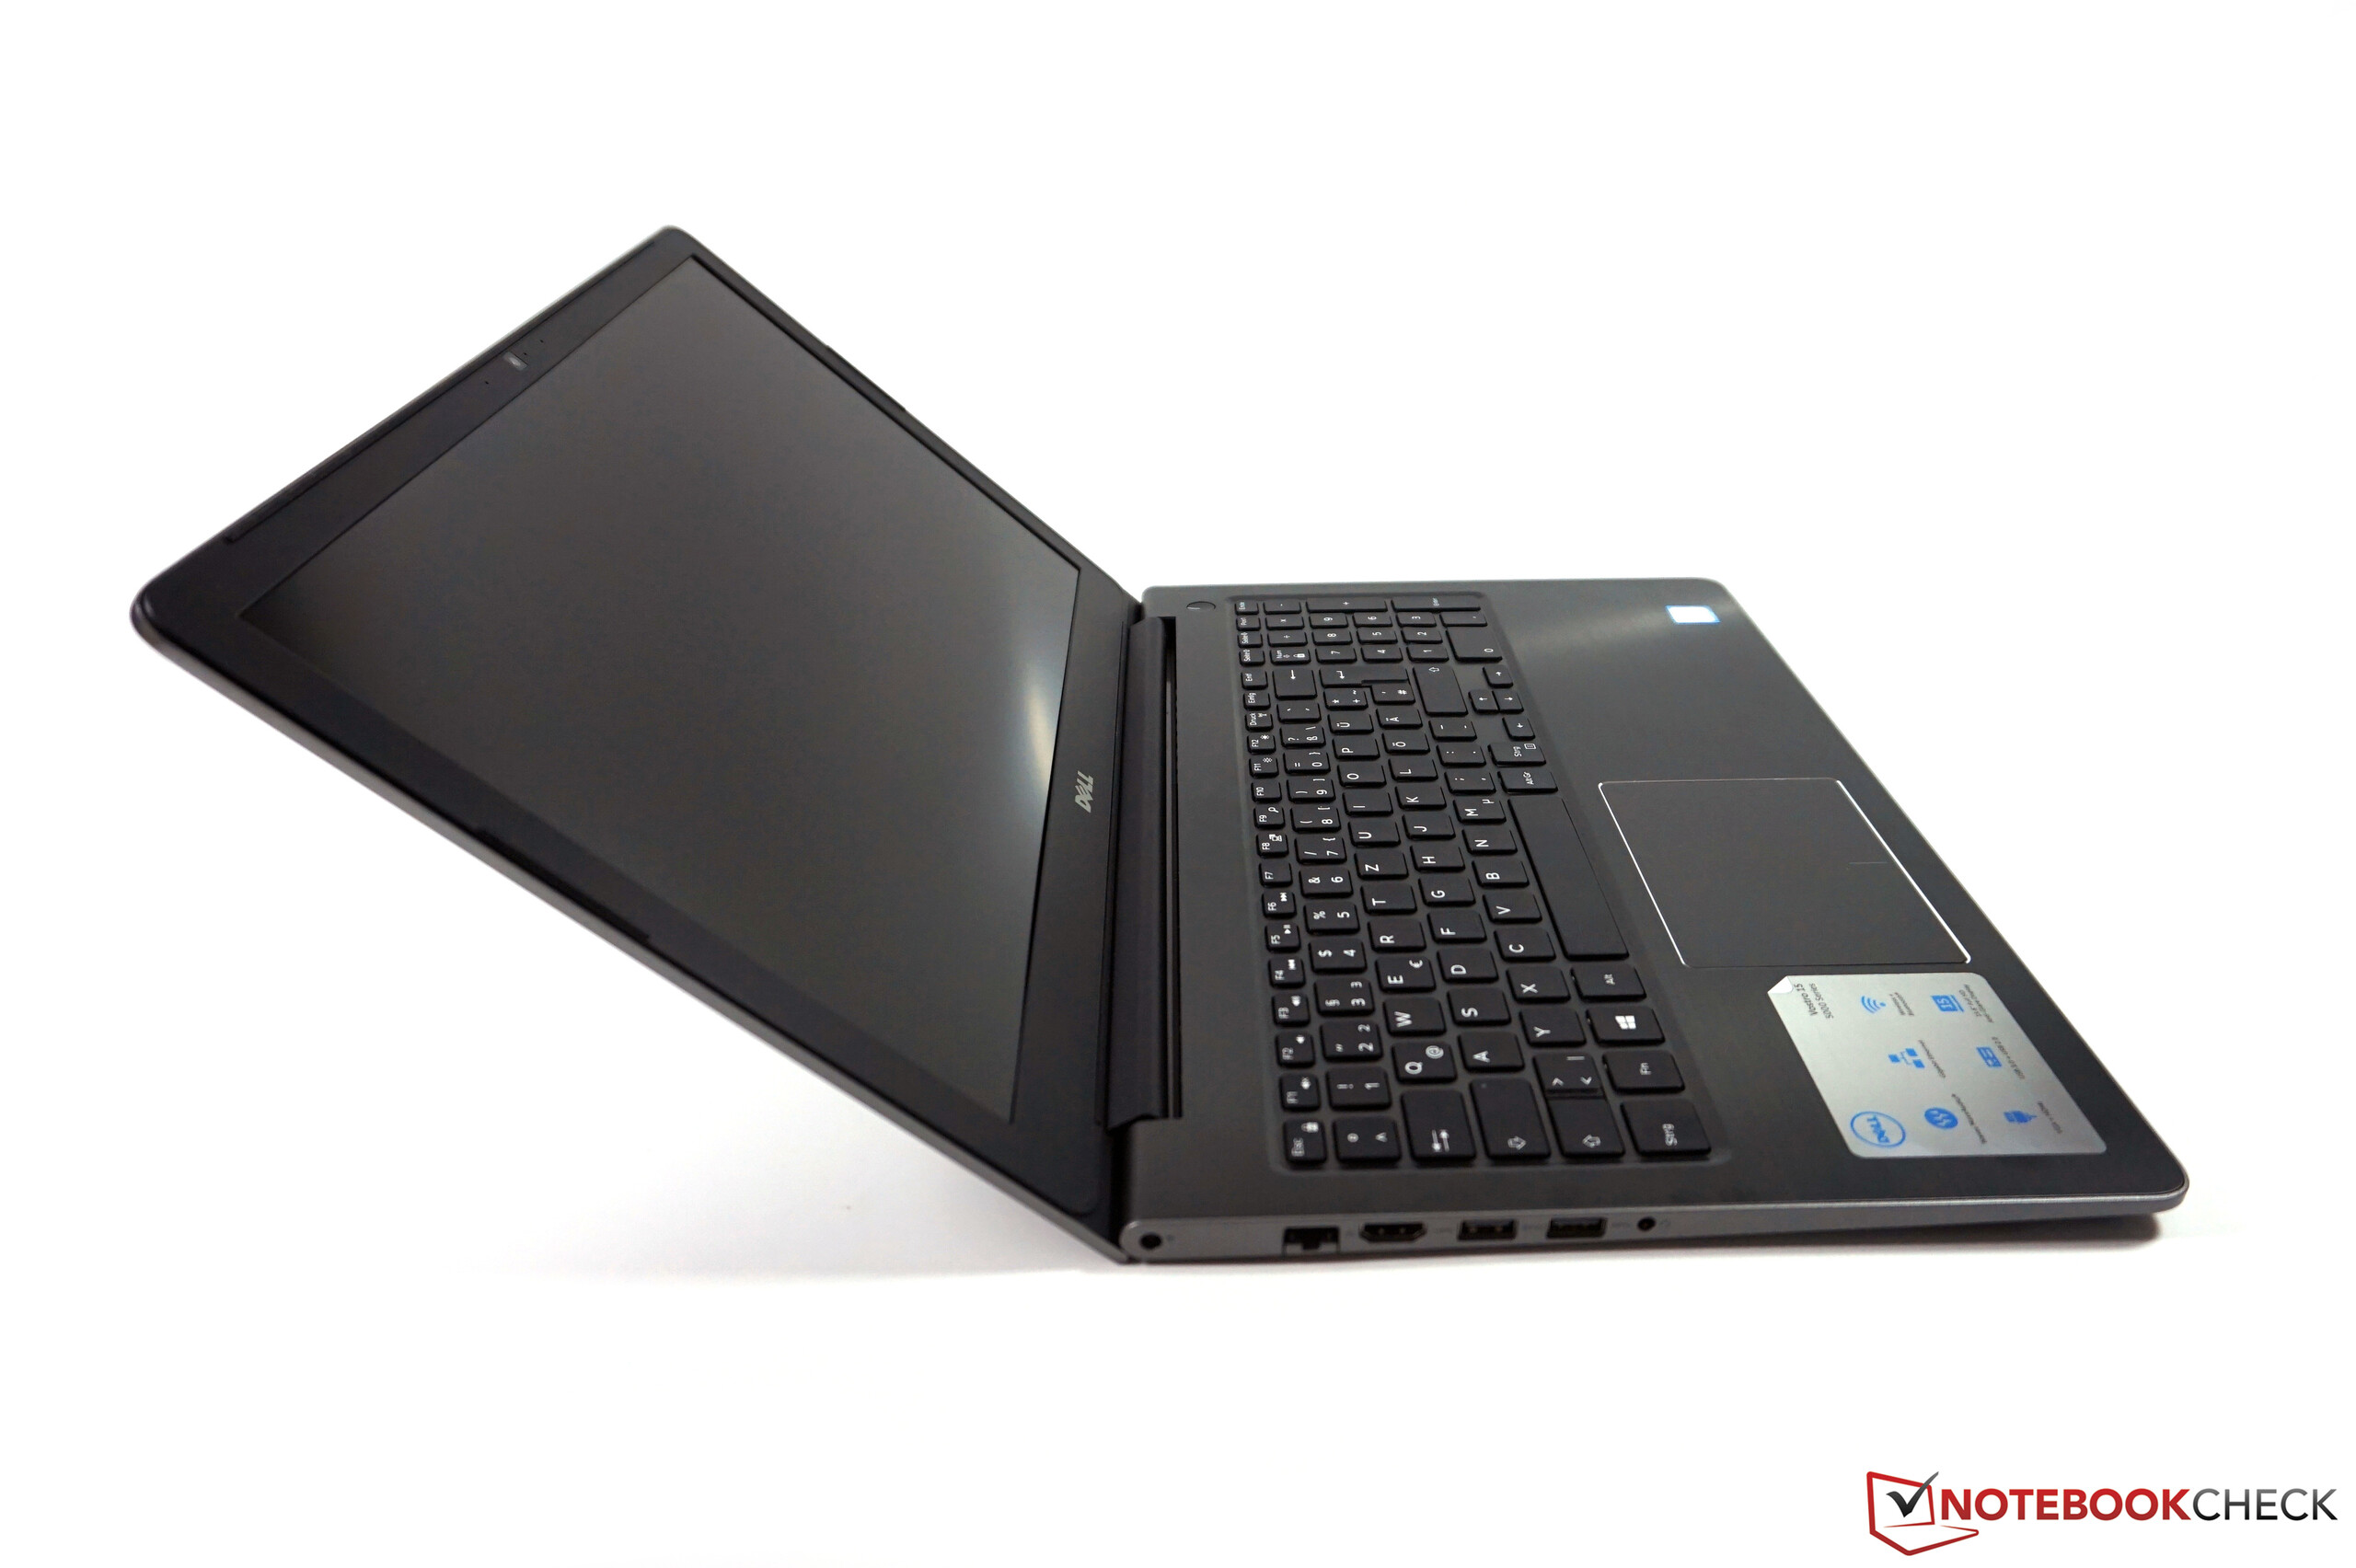
O Dell Vostro 15 é um portátil de escritório caro com bom desempenho e uma bela carcaça. Uma tela IPS opcional seria uma bela adição.
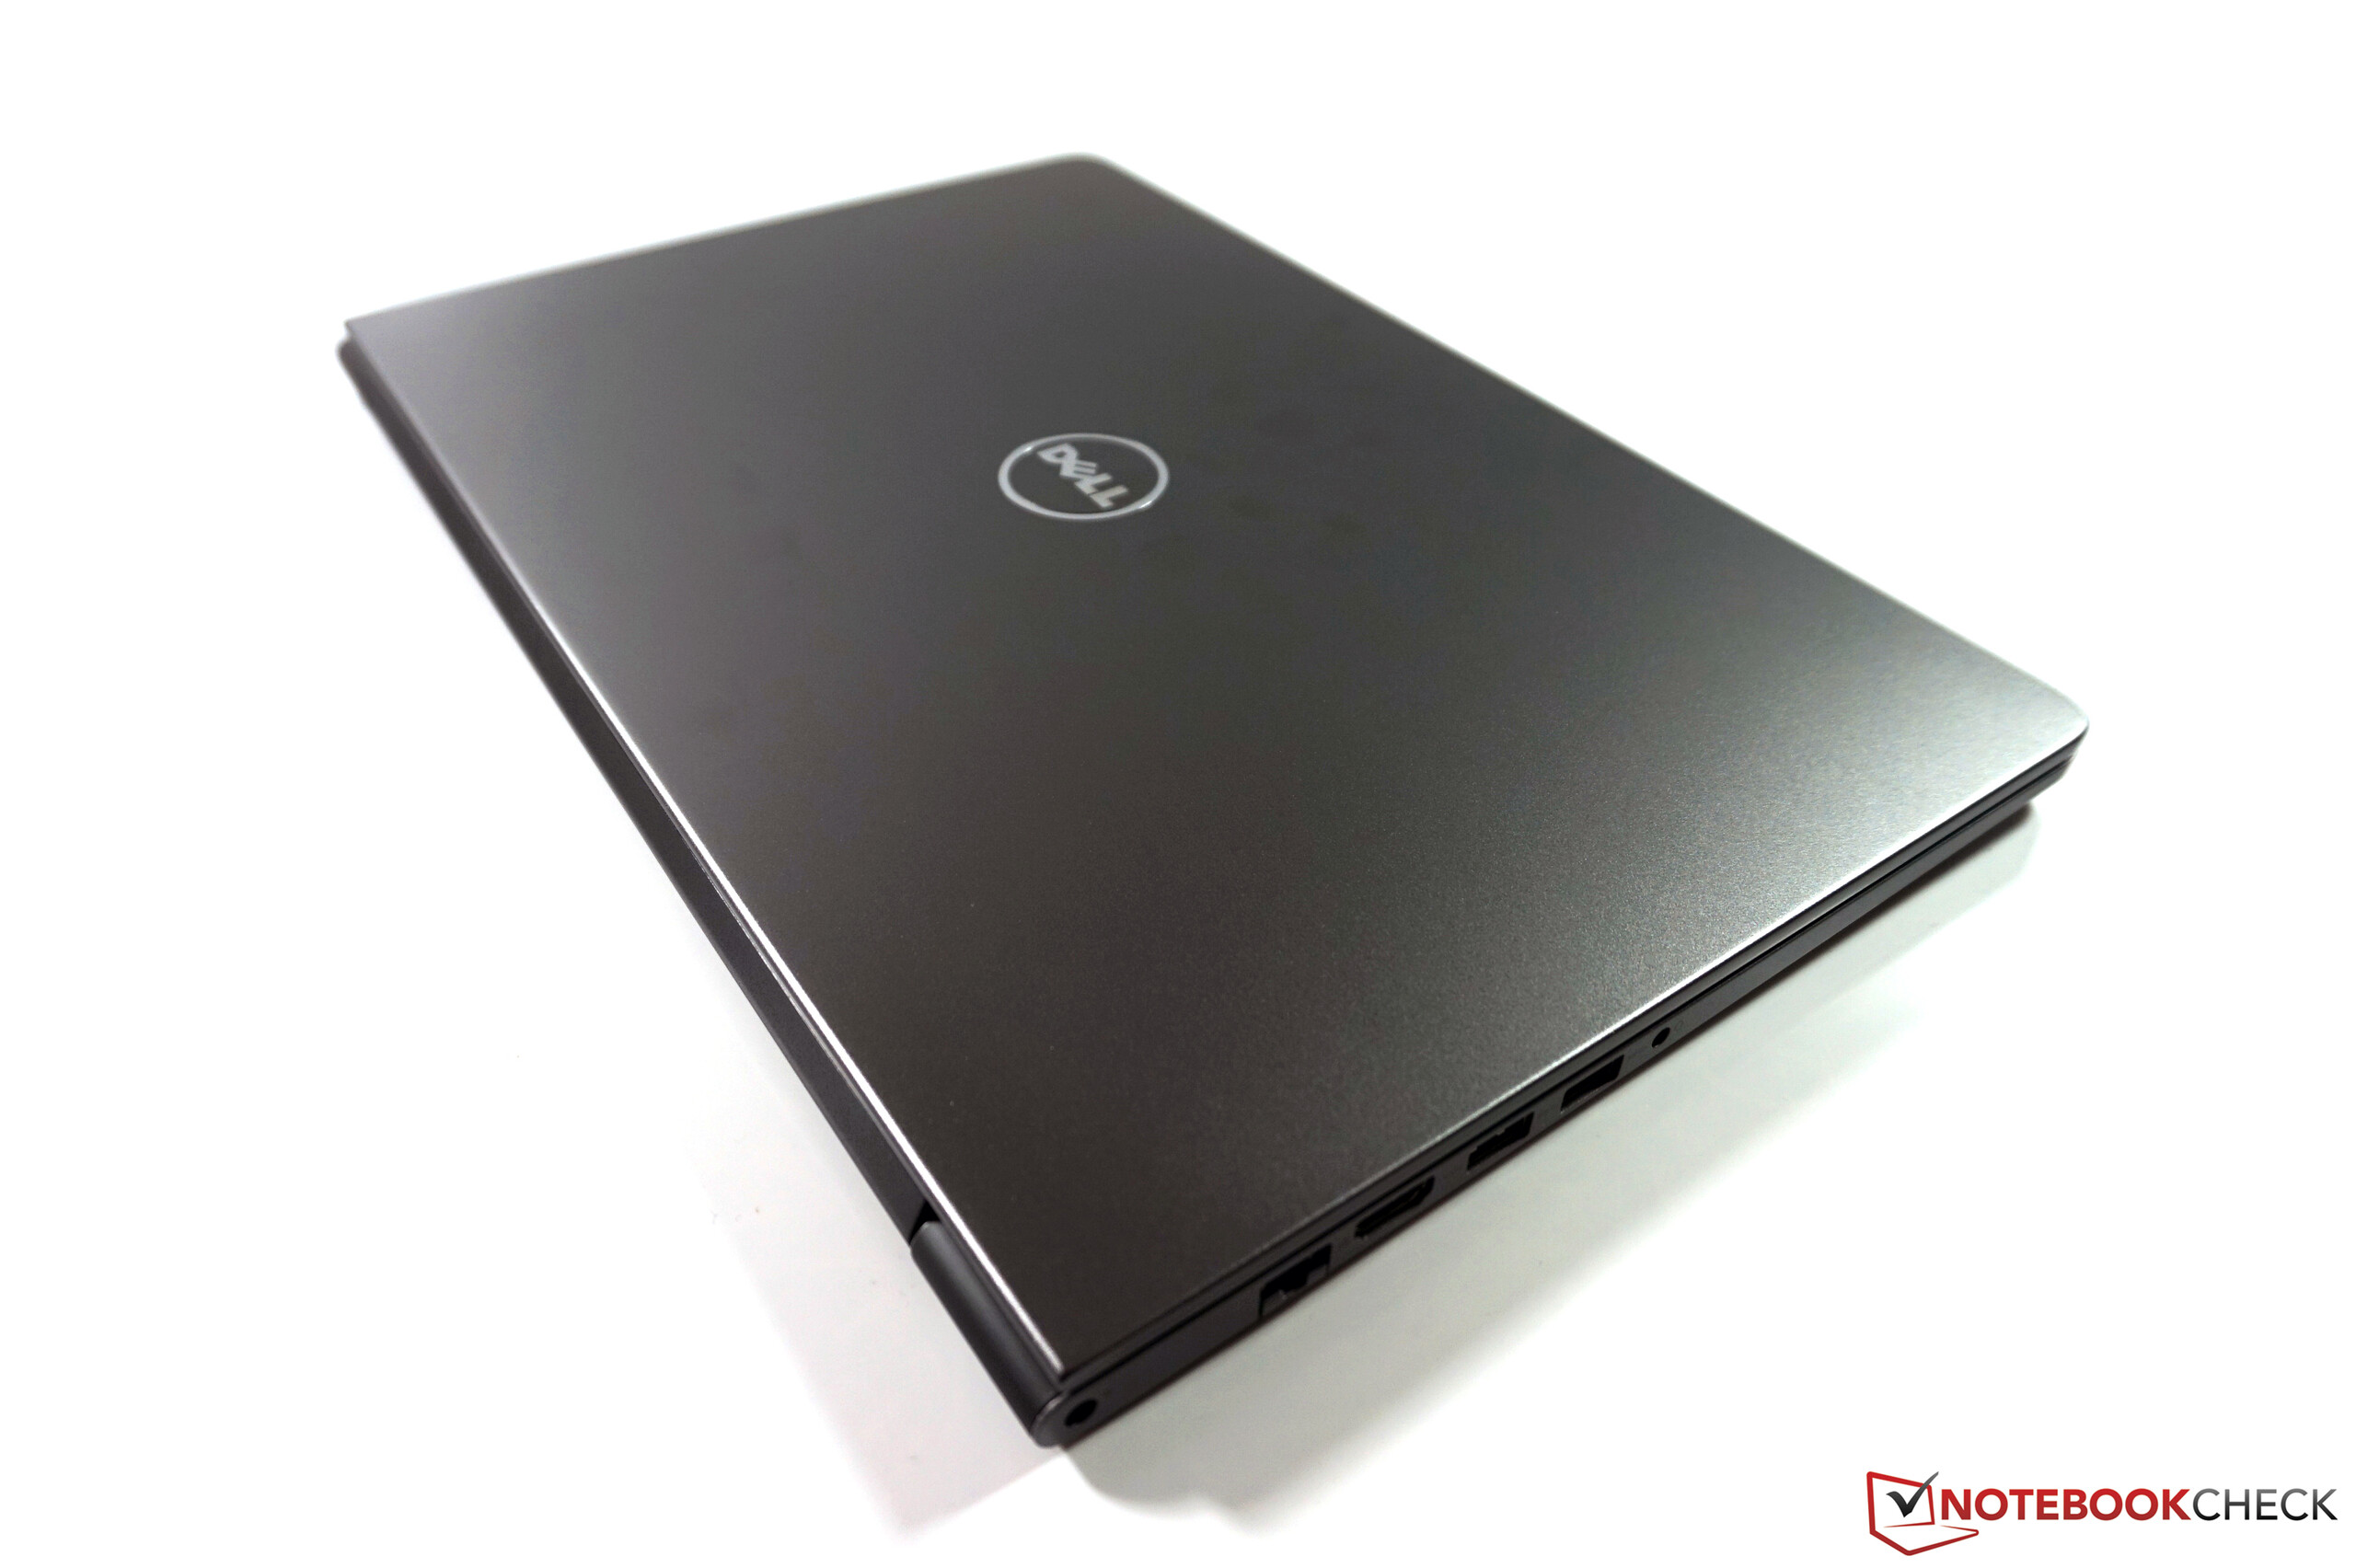
Gostamos do bom desempenho, a operação silenciosa e o belo chassi, que não revela o preço de nível de entrada baixo. O Vostro 15 não tem que se esconder atrás de sistemas mais caros, em termos de estabilidade. Primeiramente gostaríamos de ver uma teclado melhor, bem como uma tela IPS, pelo menos como uma opção.
Tanto o HP ProBook 450 G4 como o Acer Travelmate P259 sofrem com telas fracas. Estamos analisando o recém-chegado Lenovo ThinkPad E570, que poderia ser um concorrente muito forte, baseado nos resultados dos nossos testes iniciais (FHD-IPS).
Dell Vostro 15-5568
- 01/31/2017 v6 (old)
Andreas Osthoff
Price comparison
