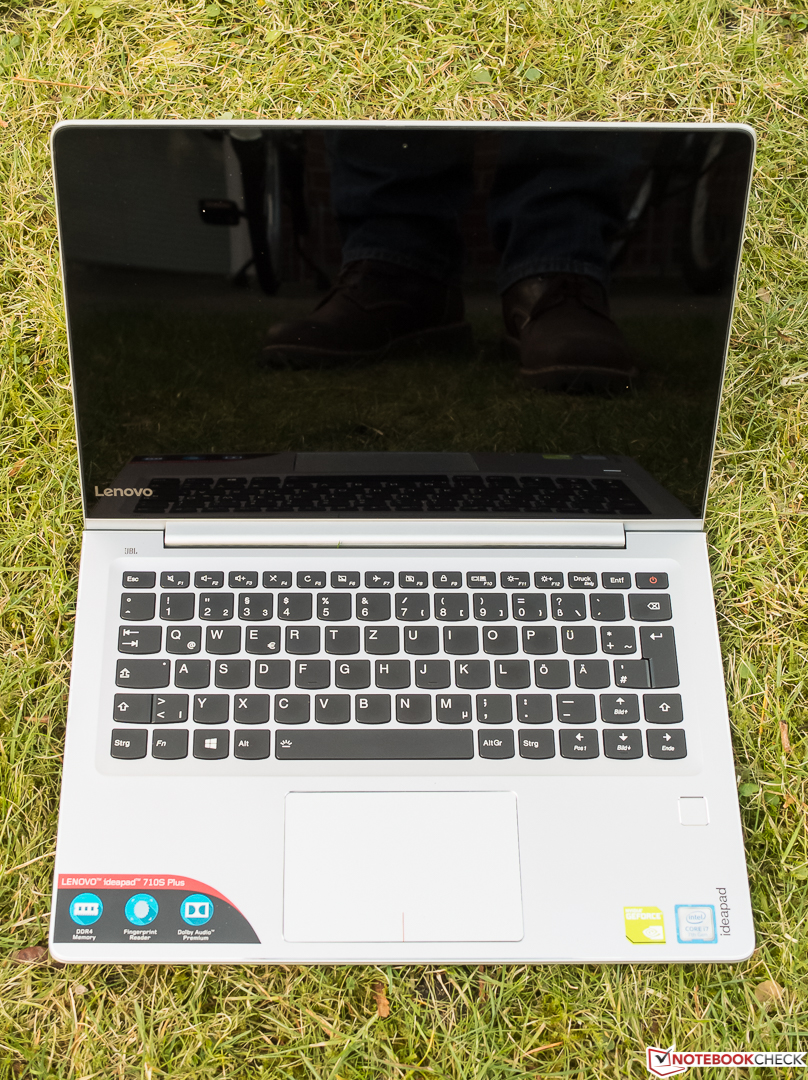
Breve Análise do Subportátil Lenovo IdeaPad 710S Plus (Core i7)


| SD Card Reader | |
| average JPG Copy Test (av. of 3 runs) | |
| Dell XPS 13 9360 FHD i5 | |
| Lenovo IdeaPad 710S Plus-13IKB | |
| maximum AS SSD Seq Read Test (1GB) | |
| Dell XPS 13 9360 FHD i5 | |
| Lenovo IdeaPad 710S Plus-13IKB | |
| Networking | |
| iperf3 transmit AX12 | |
| Lenovo IdeaPad 710S Plus-13IKB | |
| Dell XPS 13 9360 FHD i5 | |
| iperf3 receive AX12 | |
| Lenovo IdeaPad 710S Plus-13IKB | |
| Dell XPS 13 9360 FHD i5 | |
| |||||||||||||||||||||||||
iluminação: 81 %
iluminação com acumulador: 343 cd/m²
Contraste: 1143:1 (Preto: 0.3 cd/m²)
ΔE ColorChecker Calman: 4.73 | ∀{0.5-29.43 Ø4.71}
ΔE Greyscale Calman: 3.29 | ∀{0.09-98 Ø4.96}
83% sRGB (Argyll 1.6.3 3D)
54% AdobeRGB 1998 (Argyll 1.6.3 3D)
60.6% AdobeRGB 1998 (Argyll 3D)
82.9% sRGB (Argyll 3D)
65.3% Display P3 (Argyll 3D)
Gamma: 2.36
CCT: 6437 K
| Lenovo IdeaPad 710S Plus-13IKB LG Philips LP133WF4-SPB1 (LGD04EF), , 1920x1080, 13.3" | Acer Swift 7 SF713-51 Chimei Innolux, N133HCE-GP1, , 1920x1080, 13.3" | HP EliteBook Folio G1 V1C37EA AUO226D, , 1920x1080, 12.5" | Dell XPS 13 9360 FHD i5 Sharp SHP1449 LQ133M1, , 1920x1080, 13.3" | |
|---|---|---|---|---|
| Display | 4% | -26% | -18% | |
| Display P3 Coverage (%) | 65.3 | 64.6 -1% | 44.45 -32% | 48.94 -25% |
| sRGB Coverage (%) | 82.9 | 89.1 7% | 65.2 -21% | 73.3 -12% |
| AdobeRGB 1998 Coverage (%) | 60.6 | 64.8 7% | 45.96 -24% | 50.5 -17% |
| Response Times | 19% | 23% | 7% | |
| Response Time Grey 50% / Grey 80% * (ms) | 45 ? | 31 ? 31% | 32 ? 29% | 32.8 ? 27% |
| Response Time Black / White * (ms) | 29 ? | 27 ? 7% | 24 ? 17% | 33.2 ? -14% |
| PWM Frequency (Hz) | ||||
| Screen | 3% | -9% | -7% | |
| Brightness middle (cd/m²) | 343 | 359 5% | 289 -16% | 351.2 2% |
| Brightness (cd/m²) | 306 | 344 12% | 298 -3% | 325 6% |
| Brightness Distribution (%) | 81 | 92 14% | 87 7% | 89 10% |
| Black Level * (cd/m²) | 0.3 | 0.25 17% | 0.27 10% | 0.195 35% |
| Contrast (:1) | 1143 | 1436 26% | 1070 -6% | 1801 58% |
| Colorchecker dE 2000 * | 4.73 | 4.57 3% | 4.82 -2% | 7.4 -56% |
| Colorchecker dE 2000 max. * | 9.05 | 9.25 -2% | 10.73 -19% | 9.08 -0% |
| Greyscale dE 2000 * | 3.29 | 5.2 -58% | 3.84 -17% | 6.71 -104% |
| Gamma | 2.36 93% | 2.47 89% | 2.41 91% | 2.74 80% |
| CCT | 6437 101% | 6887 94% | 6492 100% | 7222 90% |
| Color Space (Percent of AdobeRGB 1998) (%) | 54 | 58 7% | 42.03 -22% | 50.48 -7% |
| Color Space (Percent of sRGB) (%) | 83 | 89 7% | 64.8 -22% | 73.31 -12% |
| Média Total (Programa/Configurações) | 9% /
5% | -4% /
-8% | -6% /
-7% |
* ... menor é melhor
Exibir tempos de resposta
| ↔ Tempo de resposta preto para branco | ||
|---|---|---|
| 29 ms ... ascensão ↗ e queda ↘ combinadas | ↗ 6 ms ascensão | 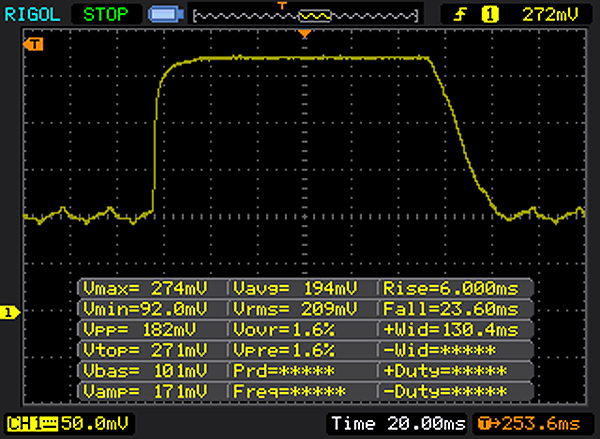 |
| ↘ 23 ms queda | ||
| A tela mostra taxas de resposta relativamente lentas em nossos testes e pode ser muito lenta para os jogadores. Em comparação, todos os dispositivos testados variam de 0.1 (mínimo) a 240 (máximo) ms. » 77 % de todos os dispositivos são melhores. Isso significa que o tempo de resposta medido é pior que a média de todos os dispositivos testados (19.8 ms). | ||
| ↔ Tempo de resposta 50% cinza a 80% cinza | ||
| 45 ms ... ascensão ↗ e queda ↘ combinadas | ↗ 12 ms ascensão | 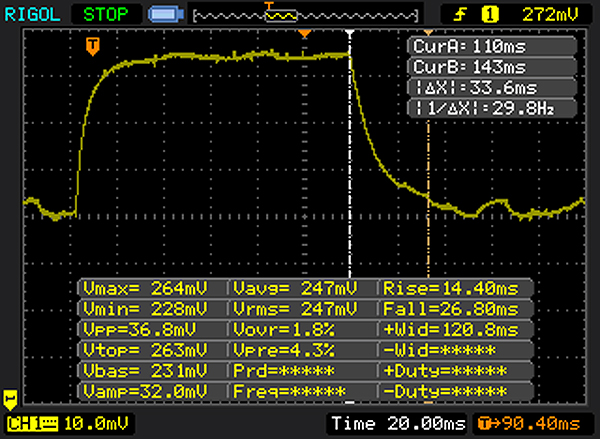 |
| ↘ 33 ms queda | ||
| A tela mostra taxas de resposta lentas em nossos testes e será insatisfatória para os jogadores. Em comparação, todos os dispositivos testados variam de 0.165 (mínimo) a 636 (máximo) ms. » 77 % de todos os dispositivos são melhores. Isso significa que o tempo de resposta medido é pior que a média de todos os dispositivos testados (31 ms). | ||
Cintilação da tela / PWM (modulação por largura de pulso)
| Tela tremeluzindo / PWM não detectado | ||
[pwm_comparison] Em comparação: 52 % de todos os dispositivos testados não usam PWM para escurecer a tela. Se PWM foi detectado, uma média de 7757 (mínimo: 5 - máximo: 343500) Hz foi medida. | ||
| PCMark 8 | |
| Home Score Accelerated v2 | |
| Dell XPS 13 9360 FHD i5 | |
| Lenovo IdeaPad 710S Plus-13IKB | |
| Acer Swift 7 SF713-51 | |
| HP EliteBook Folio G1 V1C37EA | |
| Work Score Accelerated v2 | |
| Dell XPS 13 9360 FHD i5 | |
| Lenovo IdeaPad 710S Plus-13IKB | |
| HP EliteBook Folio G1 V1C37EA | |
| PCMark 8 Home Score Accelerated v2 | 3147 pontos | |
| PCMark 8 Work Score Accelerated v2 | 4184 pontos | |
Ajuda | ||
| Lenovo IdeaPad 710S Plus-13IKB Samsung PM961 NVMe MZVLW512HMJP | Acer Swift 7 SF713-51 Kingston RBU-SNS4180S3256GG | HP EliteBook Folio G1 V1C37EA Samsung SM951 MZVPV256 m.2 | Dell XPS 13 9360 FHD i5 Toshiba NVMe THNSN5256GPUK | |
|---|---|---|---|---|
| CrystalDiskMark 3.0 | -48% | -6% | -27% | |
| Read Seq (MB/s) | 1577 | 431.2 -73% | 1482 -6% | 1233 -22% |
| Write Seq (MB/s) | 1472 | 401 -73% | 1232 -16% | 733 -50% |
| Read 512 (MB/s) | 1165 | 283.7 -76% | 1191 2% | 1036 -11% |
| Write 512 (MB/s) | 1244 | 313.6 -75% | 1220 -2% | 439.9 -65% |
| Read 4k (MB/s) | 54.8 | 36.62 -33% | 46.96 -14% | 29.31 -47% |
| Write 4k (MB/s) | 121.5 | 76.1 -37% | 100.7 -17% | 116.9 -4% |
| Read 4k QD32 (MB/s) | 407.5 | 329.4 -19% | 464 14% | 479.2 18% |
| Write 4k QD32 (MB/s) | 321.4 | 325.6 1% | 292.1 -9% | 218.3 -32% |

| 3DMark 11 - 1280x720 Performance GPU | |
| Lenovo IdeaPad 710S Plus-13IKB | |
| Dell XPS 13 9360 FHD i5 | |
| HP EliteBook Folio G1 V1C37EA | |
| Acer Swift 7 SF713-51 | |
| 3DMark | |
| 1280x720 Cloud Gate Standard Graphics | |
| Lenovo IdeaPad 710S Plus-13IKB | |
| Dell XPS 13 9360 FHD i5 | |
| HP EliteBook Folio G1 V1C37EA | |
| Acer Swift 7 SF713-51 | |
| 1920x1080 Fire Strike Graphics | |
| Lenovo IdeaPad 710S Plus-13IKB | |
| Dell XPS 13 9360 FHD i5 | |
| HP EliteBook Folio G1 V1C37EA | |
| Acer Swift 7 SF713-51 | |
| 3DMark 11 Performance | 2589 pontos | |
| 3DMark Cloud Gate Standard Score | 7123 pontos | |
| 3DMark Fire Strike Score | 1794 pontos | |
Ajuda | ||
| baixo | média | alto | ultra | |
|---|---|---|---|---|
| The Witcher 3 (2015) | 38.6 | 22.4 | ||
| Far Cry Primal (2016) | 36 | 16 | ||
| Farming Simulator 17 (2016) | 94.1 | 40 | 26.8 |
Barulho
| Ocioso |
| 30.6 / 30.6 / 30.6 dB |
| Carga |
| 36.2 / 37.2 dB |
 | ||
30 dB silencioso 40 dB(A) audível 50 dB(A) ruidosamente alto |
||
min: | ||
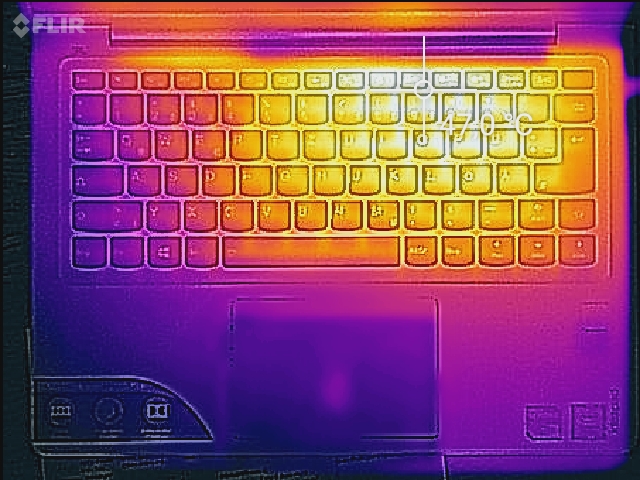
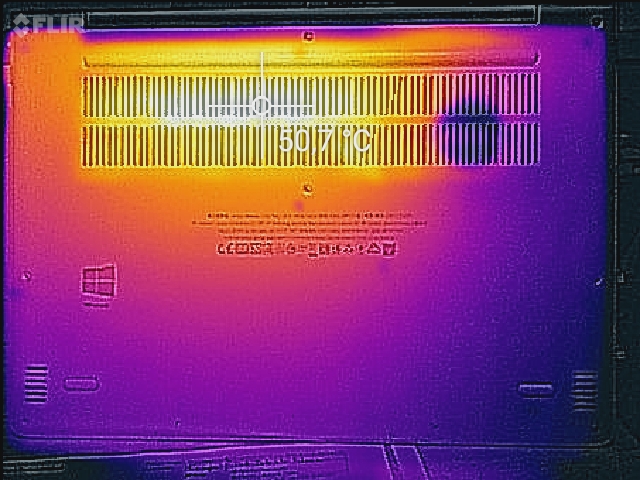
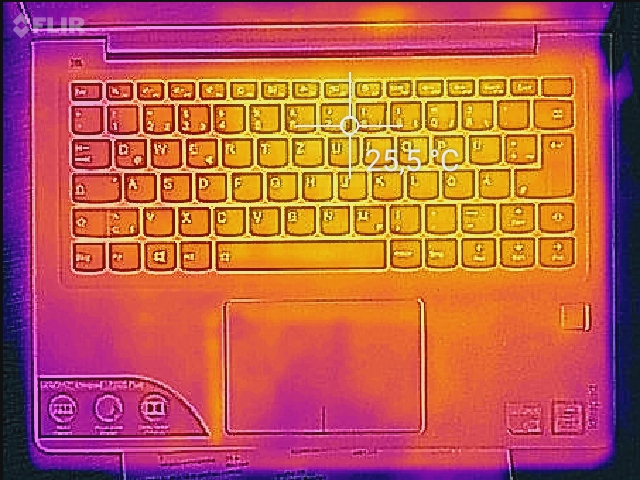
(±) A temperatura máxima no lado superior é 43.2 °C / 110 F, em comparação com a média de 35.9 °C / 97 F , variando de 21.4 a 59 °C para a classe Subnotebook.
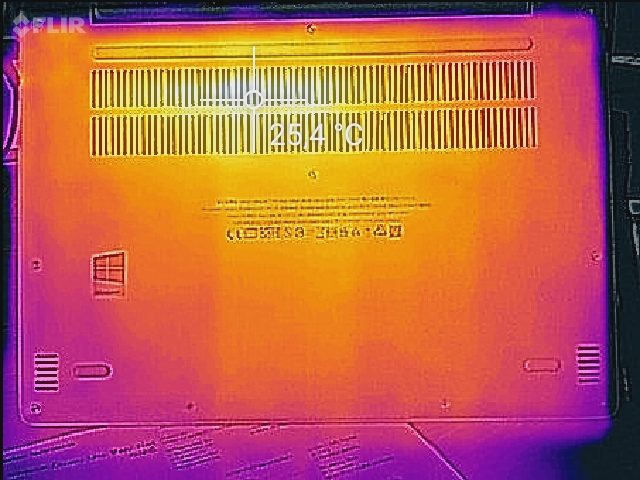
(-) A parte inferior aquece até um máximo de 45.3 °C / 114 F, em comparação com a média de 39.2 °C / 103 F
(+) Em uso inativo, a temperatura média para o lado superior é 23.8 °C / 75 F, em comparação com a média do dispositivo de 30.8 °C / ### class_avg_f### F.
(+) Os apoios para as mãos e o touchpad são mais frios que a temperatura da pele, com um máximo de 30.4 °C / 86.7 F e, portanto, são frios ao toque.
(-) A temperatura média da área do apoio para as mãos de dispositivos semelhantes foi 28.2 °C / 82.8 F (-2.2 °C / -3.9 F).
Lenovo IdeaPad 710S Plus-13IKB análise de áudio
(±) | o volume do alto-falante é médio, mas bom (###valor### dB)
Graves 100 - 315Hz
(-) | quase nenhum baixo - em média 21.4% menor que a mediana
(±) | a linearidade dos graves é média (12.2% delta para a frequência anterior)
Médios 400 - 2.000 Hz
(±) | médios mais altos - em média 6.7% maior que a mediana
(±) | a linearidade dos médios é média (10.6% delta para frequência anterior)
Altos 2 - 16 kHz
(+) | agudos equilibrados - apenas 2.2% longe da mediana
(+) | os máximos são lineares (6.9% delta da frequência anterior)
Geral 100 - 16.000 Hz
(±) | a linearidade do som geral é média (24.4% diferença em relação à mediana)
Comparado com a mesma classe
» 82% de todos os dispositivos testados nesta classe foram melhores, 4% semelhantes, 13% piores
» O melhor teve um delta de 5%, a média foi 18%, o pior foi 53%
Comparado com todos os dispositivos testados
» 74% de todos os dispositivos testados foram melhores, 6% semelhantes, 20% piores
» O melhor teve um delta de 4%, a média foi 23%, o pior foi 134%
Acer Swift 7 SF713-51 análise de áudio
(-) | alto-falantes não muito altos (###valor### dB)
Graves 100 - 315Hz
(±) | graves reduzidos - em média 11.9% menor que a mediana
(±) | a linearidade dos graves é média (12.6% delta para a frequência anterior)
Médios 400 - 2.000 Hz
(±) | médios mais altos - em média 5.4% maior que a mediana
(+) | médios são lineares (6.3% delta para frequência anterior)
Altos 2 - 16 kHz
(+) | agudos equilibrados - apenas 2.4% longe da mediana
(±) | a linearidade dos máximos é média (8.3% delta para frequência anterior)
Geral 100 - 16.000 Hz
(±) | a linearidade do som geral é média (18.5% diferença em relação à mediana)
Comparado com a mesma classe
» 55% de todos os dispositivos testados nesta classe foram melhores, 7% semelhantes, 38% piores
» O melhor teve um delta de 5%, a média foi 18%, o pior foi 53%
Comparado com todos os dispositivos testados
» 42% de todos os dispositivos testados foram melhores, 8% semelhantes, 51% piores
» O melhor teve um delta de 4%, a média foi 23%, o pior foi 134%
HP EliteBook Folio G1 V1C37EA análise de áudio
(+) | os alto-falantes podem tocar relativamente alto (###valor### dB)
Graves 100 - 315Hz
(-) | quase nenhum baixo - em média 17% menor que a mediana
(±) | a linearidade dos graves é média (12.4% delta para a frequência anterior)
Médios 400 - 2.000 Hz
(+) | médios equilibrados - apenas 4.7% longe da mediana
(+) | médios são lineares (4.4% delta para frequência anterior)
Altos 2 - 16 kHz
(±) | máximos mais altos - em média 5.4% maior que a mediana
(+) | os máximos são lineares (5.3% delta da frequência anterior)
Geral 100 - 16.000 Hz
(±) | a linearidade do som geral é média (19.8% diferença em relação à mediana)
Comparado com a mesma classe
» 63% de todos os dispositivos testados nesta classe foram melhores, 7% semelhantes, 31% piores
» O melhor teve um delta de 5%, a média foi 18%, o pior foi 53%
Comparado com todos os dispositivos testados
» 51% de todos os dispositivos testados foram melhores, 7% semelhantes, 42% piores
» O melhor teve um delta de 4%, a média foi 23%, o pior foi 134%
Dell XPS 13 9360 FHD i5 análise de áudio
(-) | alto-falantes não muito altos (###valor### dB)
Graves 100 - 315Hz
(±) | graves reduzidos - em média 6.9% menor que a mediana
(±) | a linearidade dos graves é média (10.5% delta para a frequência anterior)
Médios 400 - 2.000 Hz
(+) | médios equilibrados - apenas 3.7% longe da mediana
(+) | médios são lineares (4% delta para frequência anterior)
Altos 2 - 16 kHz
(+) | agudos equilibrados - apenas 2% longe da mediana
(±) | a linearidade dos máximos é média (10.3% delta para frequência anterior)
Geral 100 - 16.000 Hz
(±) | a linearidade do som geral é média (18.3% diferença em relação à mediana)
Comparado com a mesma classe
» 53% de todos os dispositivos testados nesta classe foram melhores, 7% semelhantes, 40% piores
» O melhor teve um delta de 5%, a média foi 18%, o pior foi 53%
Comparado com todos os dispositivos testados
» 40% de todos os dispositivos testados foram melhores, 8% semelhantes, 52% piores
» O melhor teve um delta de 4%, a média foi 23%, o pior foi 134%
| desligado | |
| Ocioso | |
| Carga |
|
Key:
min: | |
| Lenovo IdeaPad 710S Plus-13IKB i7-7500U, GeForce 940MX, Samsung PM961 NVMe MZVLW512HMJP, IPS, 1920x1080, 13.3" | Acer Swift 7 SF713-51 i5-7Y54, HD Graphics 615, Kingston RBU-SNS4180S3256GG, IPS, WLED, 1920x1080, 13.3" | HP EliteBook Folio G1 V1C37EA 6Y54, HD Graphics 515, Samsung SM951 MZVPV256 m.2, IPS, 1920x1080, 12.5" | Dell XPS 13 9360 FHD i5 i5-7200U, HD Graphics 620, Toshiba NVMe THNSN5256GPUK, IPS, 1920x1080, 13.3" | |
|---|---|---|---|---|
| Power Consumption | 28% | 20% | 30% | |
| Idle Minimum * (Watt) | 3.6 | 4.1 -14% | 4.3 -19% | 4.1 -14% |
| Idle Average * (Watt) | 7.4 | 6.4 14% | 6 19% | 4.2 43% |
| Idle Maximum * (Watt) | 8.7 | 6.8 22% | 6.4 26% | 5.1 41% |
| Load Average * (Watt) | 43 | 16 63% | 22.7 47% | 22.1 49% |
| Load Maximum * (Watt) | 42 | 18.7 55% | 31.2 26% | 29.4 30% |
* ... menor é melhor
| Lenovo IdeaPad 710S Plus-13IKB i7-7500U, GeForce 940MX, 46 Wh | Acer Swift 7 SF713-51 i5-7Y54, HD Graphics 615, 41.58 Wh | HP EliteBook Folio G1 V1C37EA 6Y54, HD Graphics 515, 38 Wh | Dell XPS 13 9360 FHD i5 i5-7200U, HD Graphics 620, 60 Wh | |
|---|---|---|---|---|
| Duração da bateria | 66% | 28% | 117% | |
| Reader / Idle (h) | 7.8 | 13.2 69% | 8.8 13% | 21.6 177% |
| WiFi v1.3 (h) | 5.6 | 7.3 30% | 5.9 5% | 11.3 102% |
| Load (h) | 1.5 | 3 100% | 2.5 67% | 2.6 73% |
| H.264 (h) | 6.8 | 6.9 |
Pro
Contra
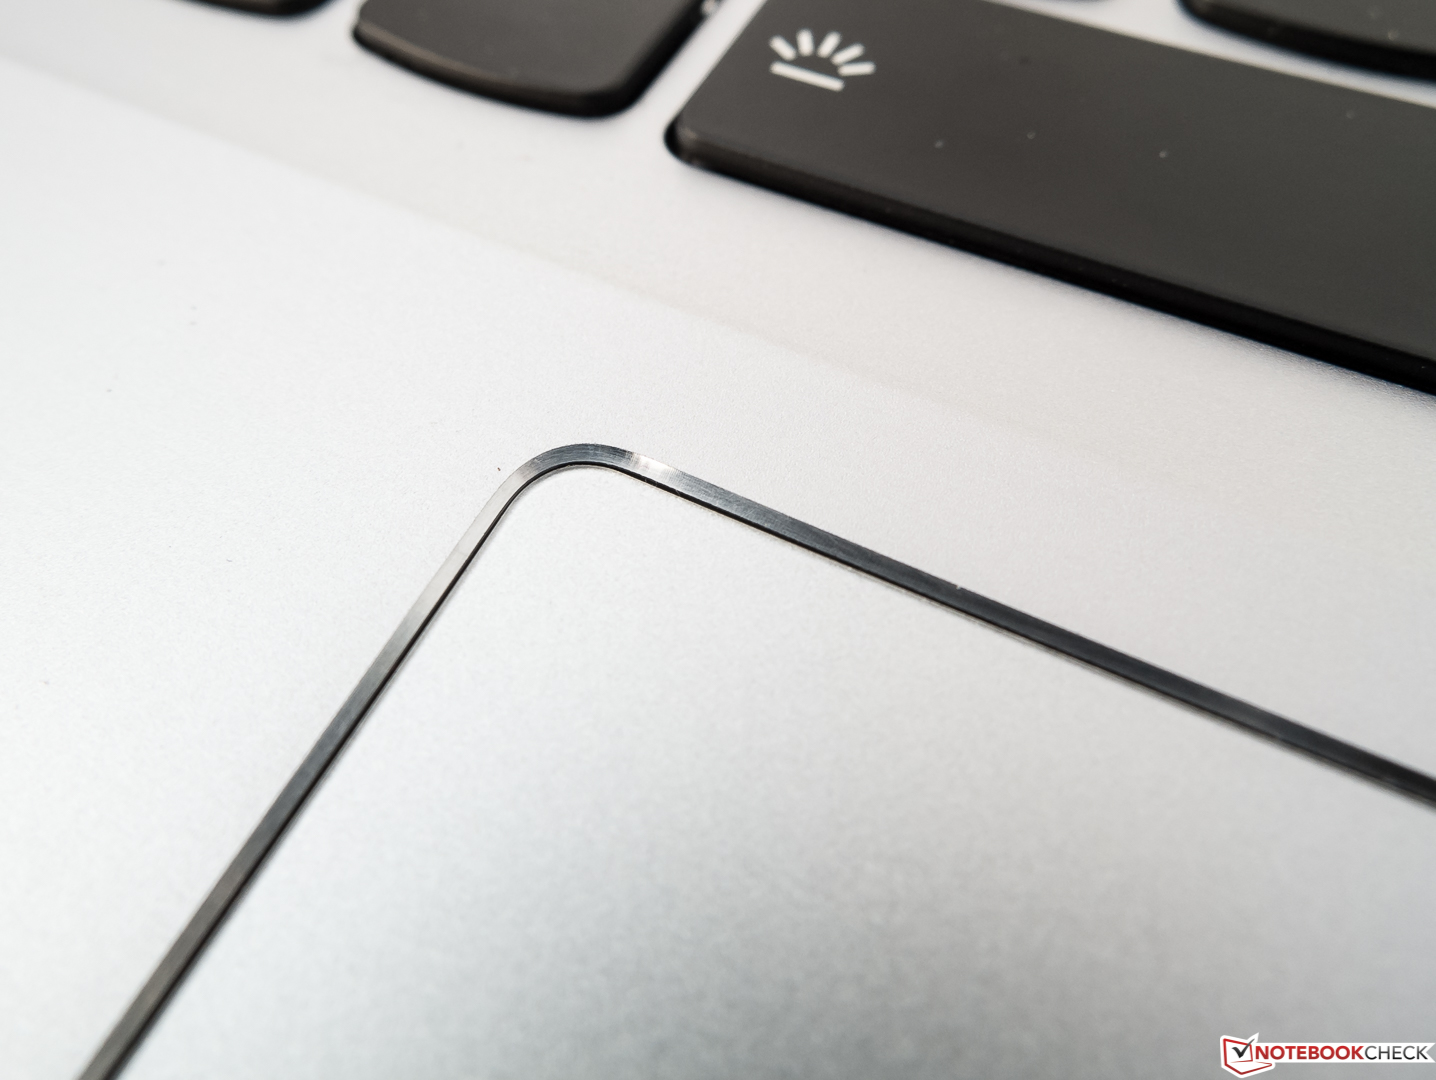
À diferença de seu predecessor quase perfeito, descobrimos algumas falhas menores na construção no novo IdeaPad 710S Plus da Lenovo. No entanto, somente o touchpad pobremente instalado será significante aqui. A excelente tela teria sido ainda melhor com uma superfície mate e um espaço de cores maior. Embora ter poucas interfaces sejam padrão em subportáteis, teria havido espaço para um saída de vídeo reduzida, como HDMI ou DP. A duração da bateria também não cumpre totalmente com a necessidade de mobilidade. A única desvantagem que poderia colocar em perigo uma recomendação de compra é o irritante assobio ocasional da ventoinha, embora isso não aconteça durante velocidades lentas da ventoinha, o qual seria o caso mais comum, e que isto também poderia ser um caso individual (!) relacionado apenas com o nosso modelo de teste.
A mobilidade e versatilidade são as propriedades mais importantes do, no geral, muito convincente Lenovo IdeaPad 710S Plus. No entanto, os compradores potenciais devem estar atentos a possíveis assobios da ventoinha.
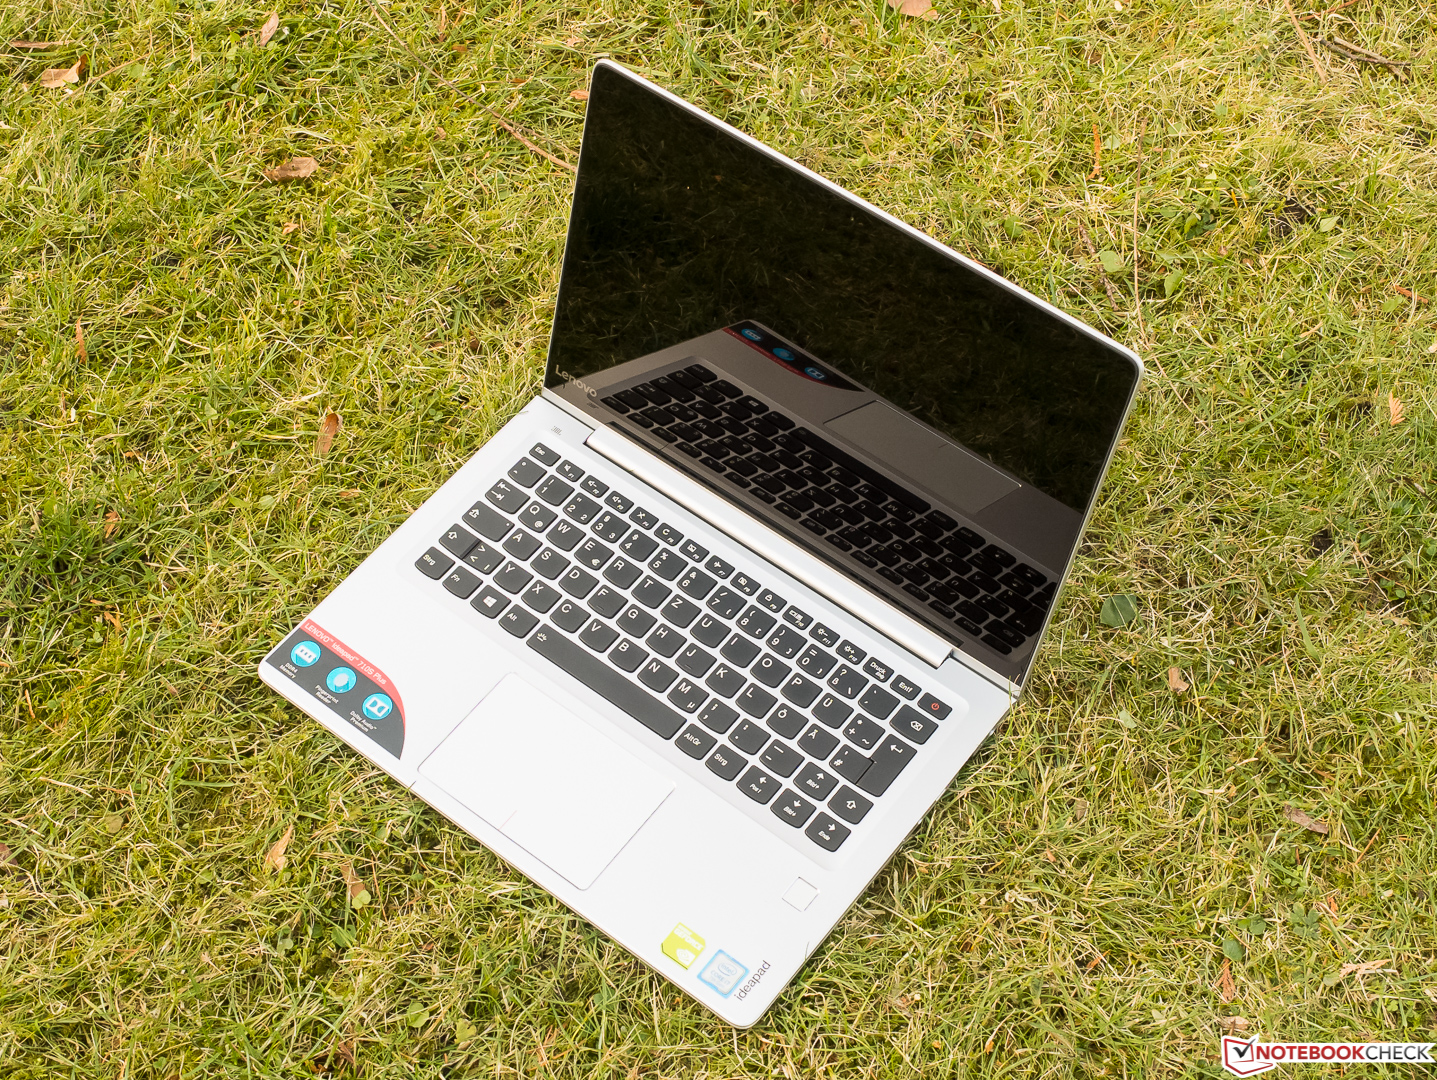
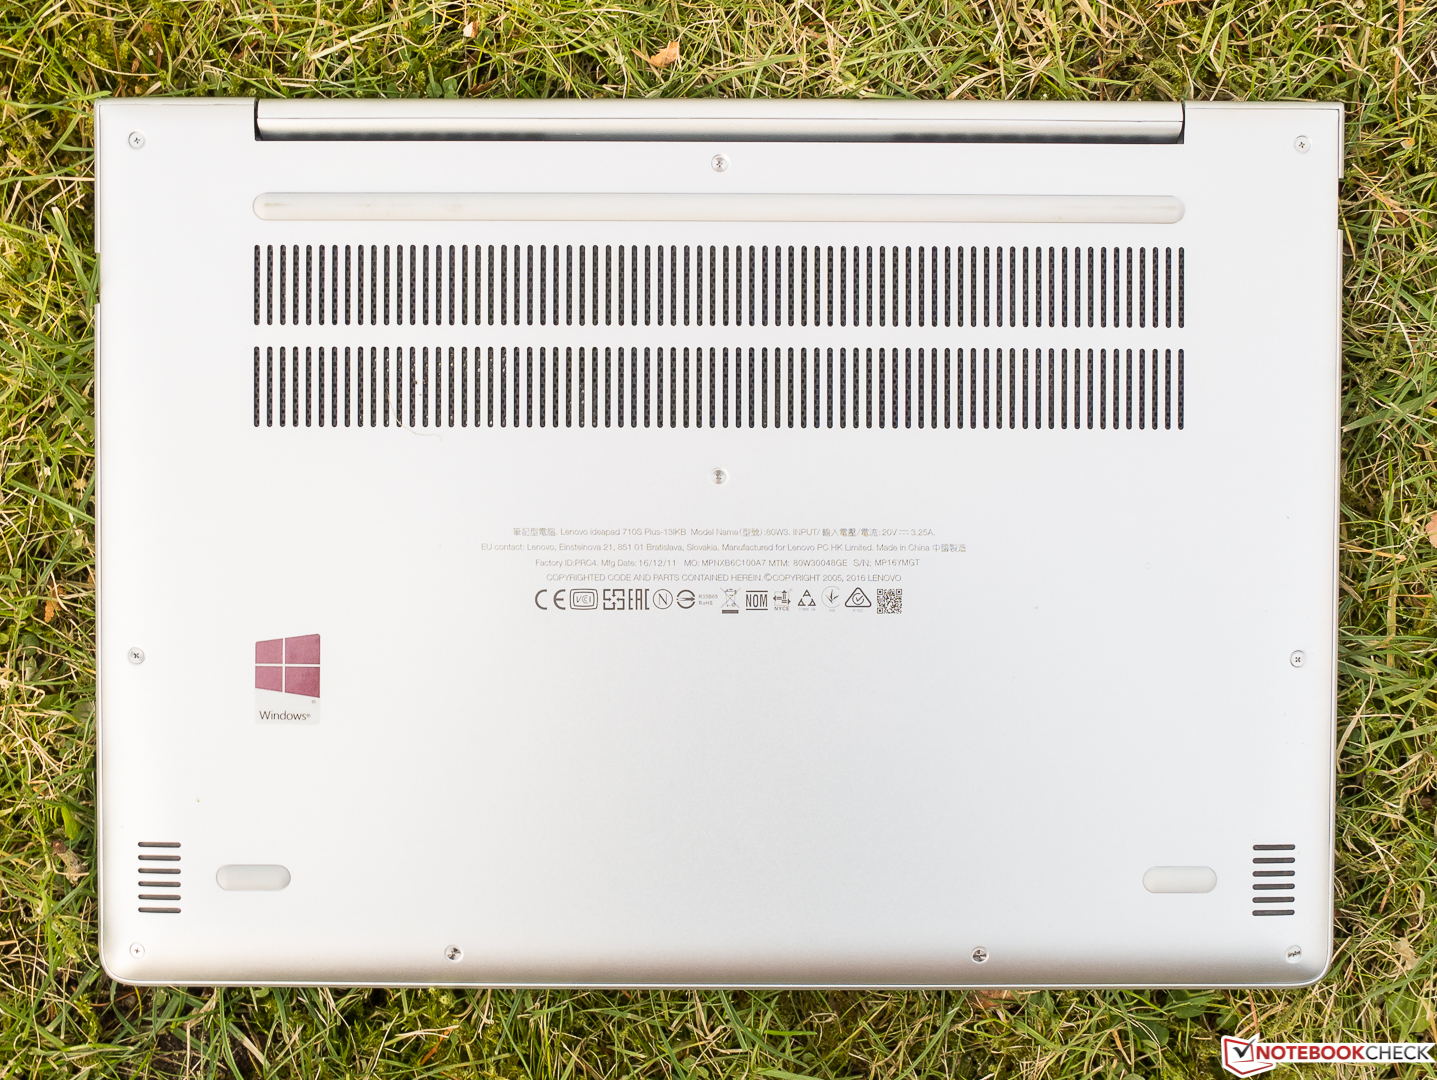
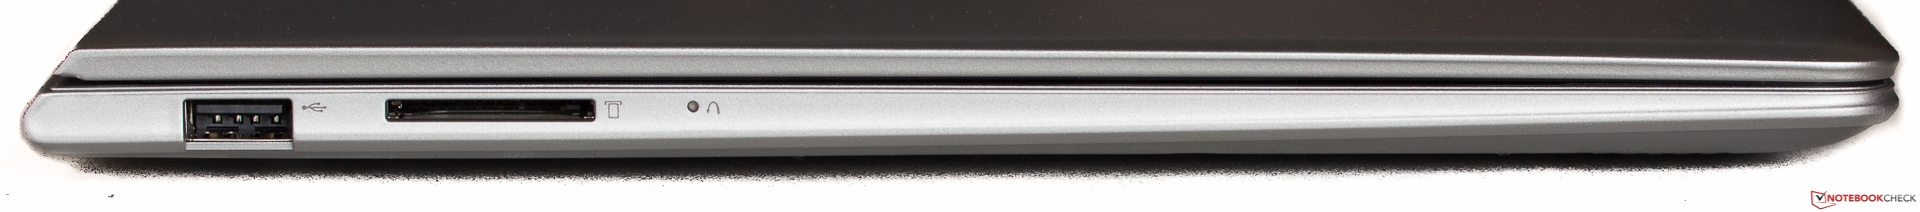
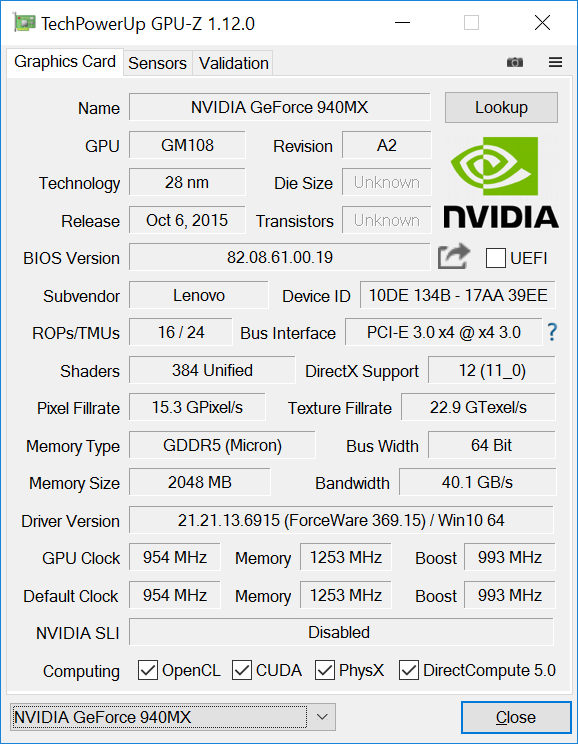
É claro que a carcaça leve, porém, rígida e muito atraente, deve ser listada no lado dos pros. Os dispositivos de entrada devem atender as necessidades da maioria dos usuários. O TPM e o leitor de digitais satisfará os usuários que se preocupam com a segurança, e a GeForce 940MX com memória GDDR5 agradará os gamers casuais. Em contraste com o predecessor, o PWM não é utilizado, o grande SSD é muito veloz, e ninguém irá reclamar do desempenho do Wi-Fi. Em total, não queremos negar à atualização do 710S uma recomendação de compra, mas recomendamos que o escute durante o uso intenso, antes da compra. Os usuários que não desejem jogar provavelmente estarão melhor com a versão mais econômica baseada no i5-7200U.
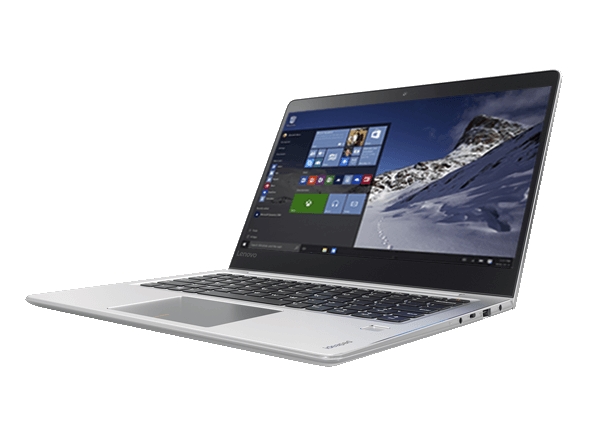
Lenovo IdeaPad 710S Plus-13IKB
- 02/01/2017 v6 (old)
Sven Kloevekorn