Breve Análise do Portátil Dell XPS 15 7590: O modelo básico com Core i5 e painel FHD é suficiente?

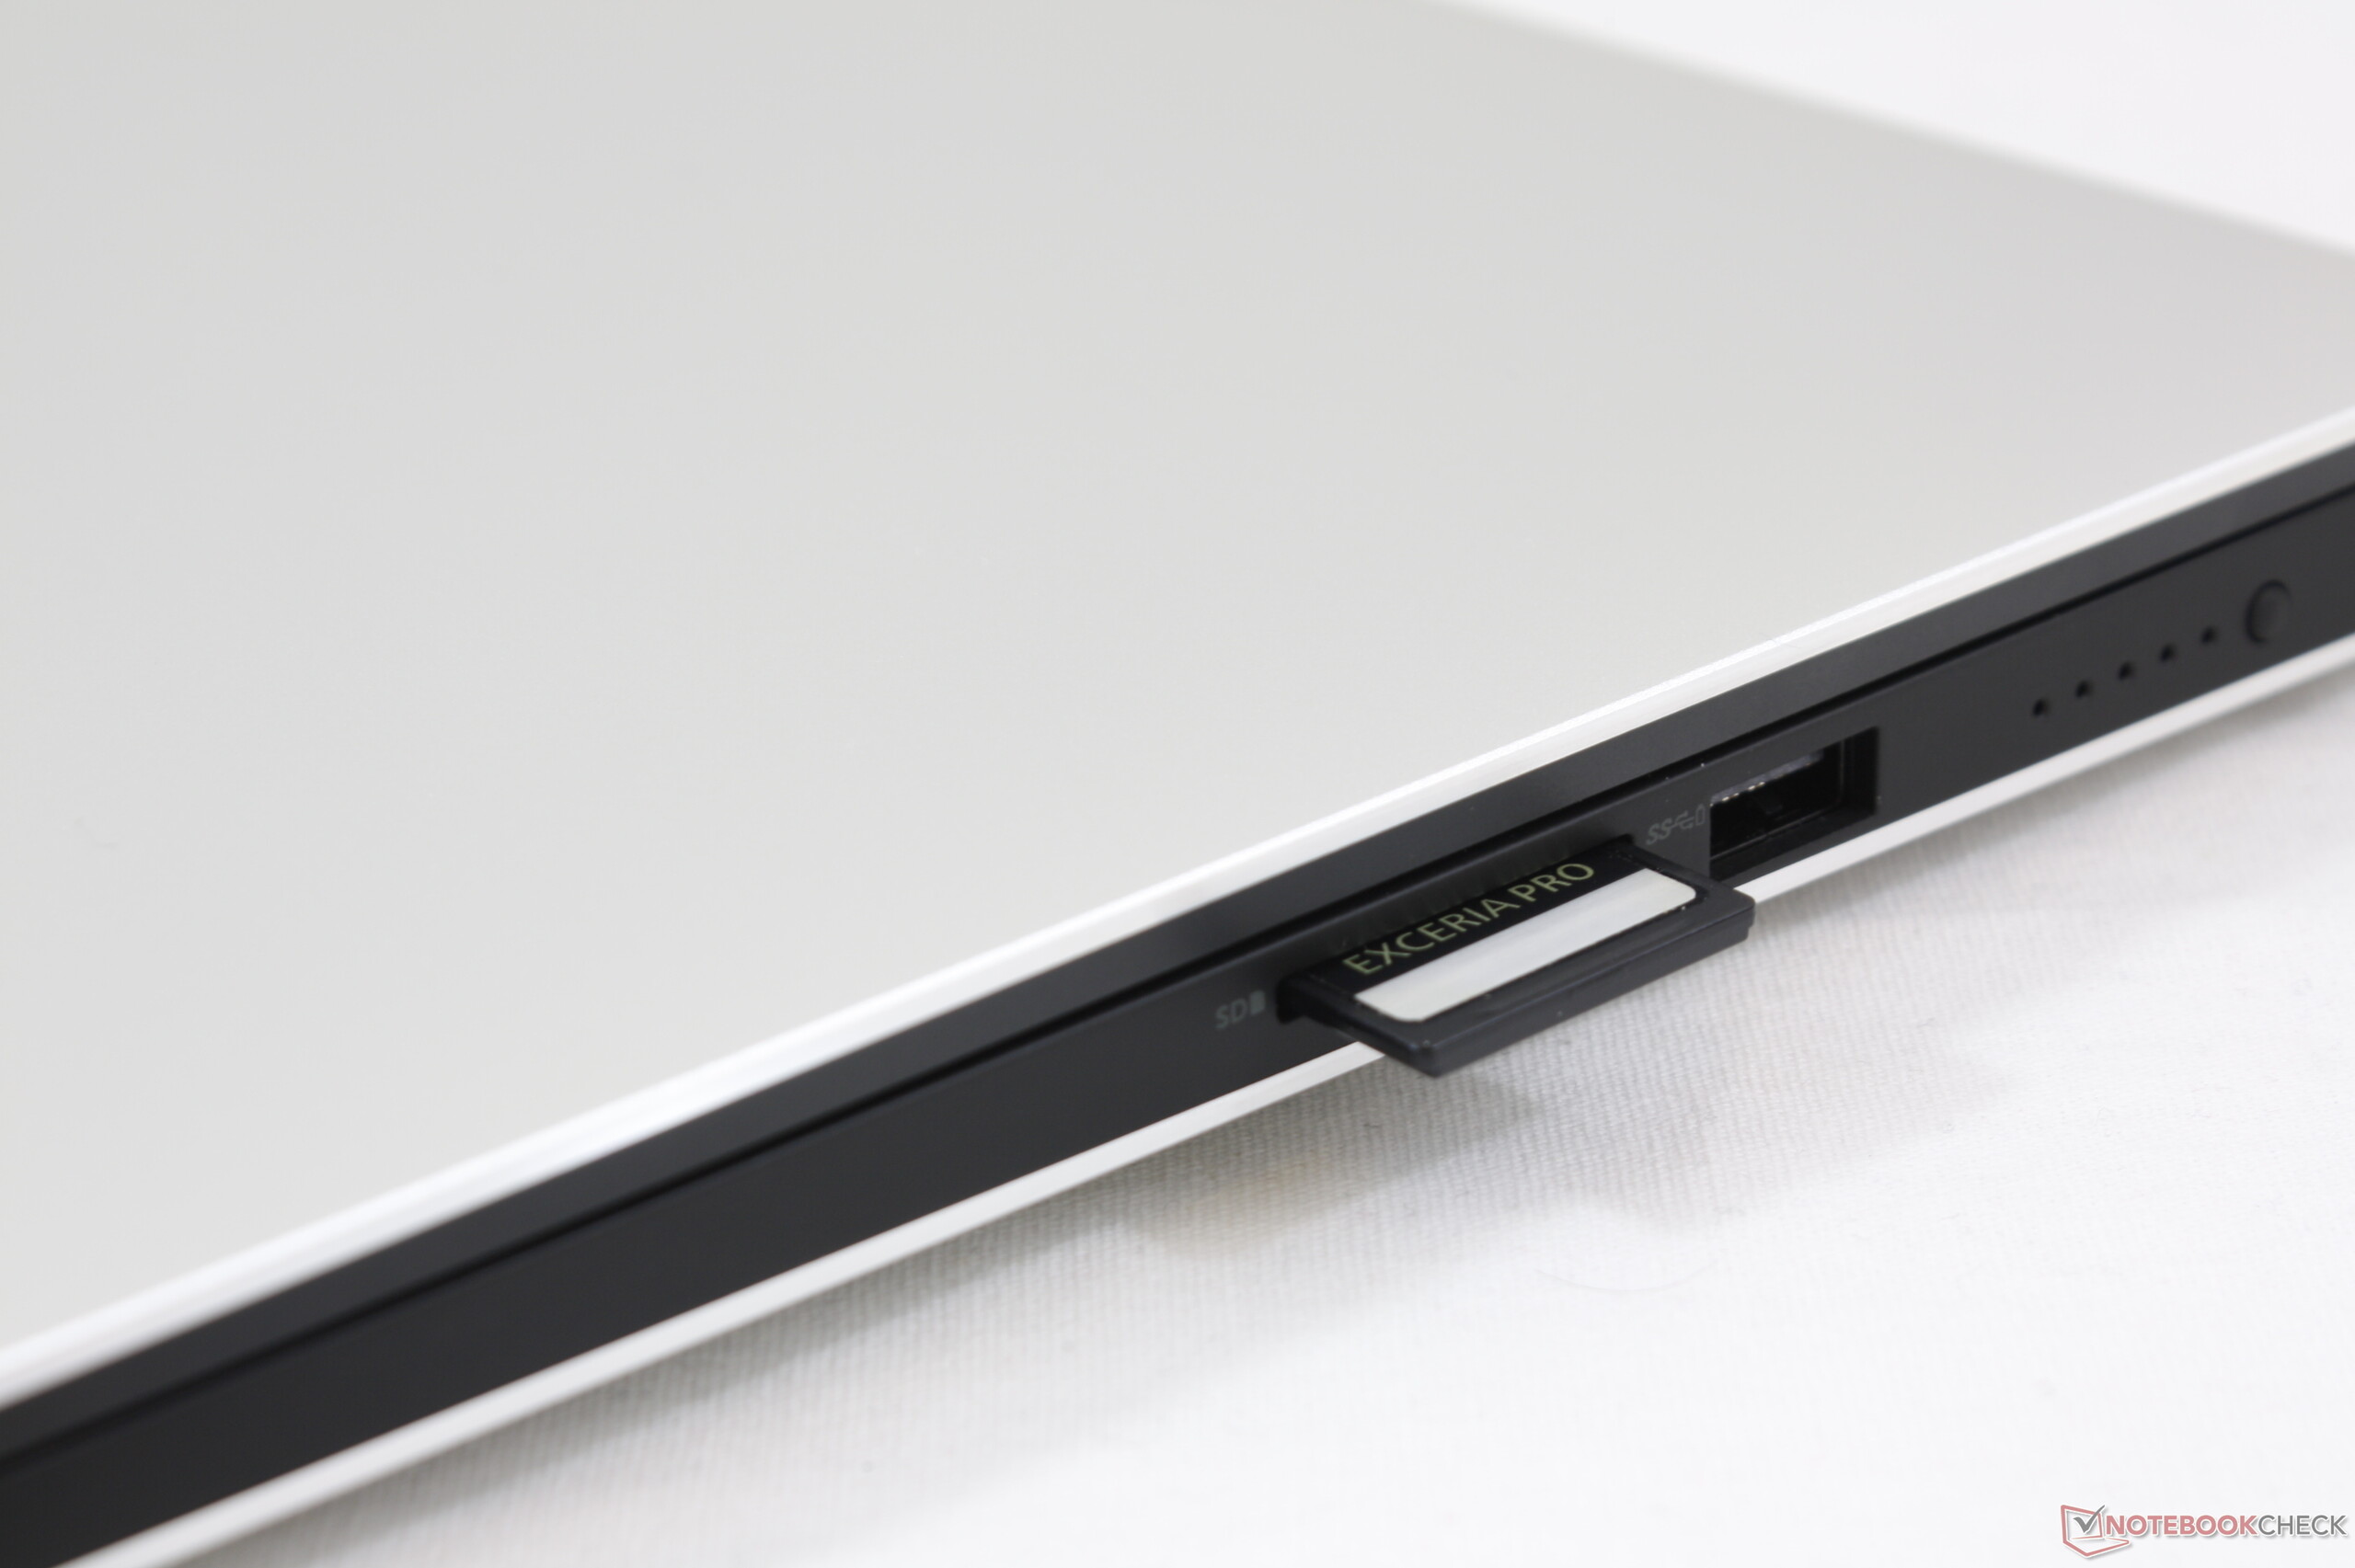
| SD Card Reader | |
| average JPG Copy Test (av. of 3 runs) | |
| Dell XPS 15 7590 i5 iGPU FHD (Toshiba Exceria Pro SDXC 64 GB UHS-II) | |
| Dell XPS 15 9570 i7 UHD (Toshiba Exceria Pro SDXC 64 GB UHS-II) | |
| Dell XPS 15 7590 9980HK GTX 1650 (Toshiba Exceria Pro SDXC 64 GB UHS-II) | |
| Média da turma Multimedia (23 - 531, n=43, últimos 2 anos) | |
| maximum AS SSD Seq Read Test (1GB) | |
| Dell XPS 15 7590 9980HK GTX 1650 (Toshiba Exceria Pro SDXC 64 GB UHS-II) | |
| Dell XPS 15 9570 i7 UHD (Toshiba Exceria Pro SDXC 64 GB UHS-II) | |
| Média da turma Multimedia (27.9 - 1455, n=42, últimos 2 anos) | |
| Dell XPS 15 7590 i5 iGPU FHD (Toshiba Exceria Pro SDXC 64 GB UHS-II) | |
| Networking | |
| iperf3 transmit AX12 | |
| Dell XPS 15 7590 i5 iGPU FHD | |
| Dell XPS 15 9570 Core i9 UHD | |
| Dell XPS 15 7590 9980HK GTX 1650 | |
| iperf3 receive AX12 | |
| Dell XPS 15 7590 9980HK GTX 1650 | |
| Dell XPS 15 9570 Core i9 UHD | |
| Dell XPS 15 7590 i5 iGPU FHD | |
| |||||||||||||||||||||||||
iluminação: 89 %
iluminação com acumulador: 586 cd/m²
Contraste: 1470:1 (Preto: 0.4 cd/m²)
ΔE ColorChecker Calman: 2.5 | ∀{0.5-29.43 Ø4.73}
calibrated: 0.6
ΔE Greyscale Calman: 4.5 | ∀{0.09-98 Ø4.97}
98% sRGB (Argyll 1.6.3 3D)
63.2% AdobeRGB 1998 (Argyll 1.6.3 3D)
68.4% AdobeRGB 1998 (Argyll 3D)
98% sRGB (Argyll 3D)
66.5% Display P3 (Argyll 3D)
Gamma: 2.2
CCT: 6836 K
| Dell XPS 15 7590 i5 iGPU FHD LQ156M1, , 1920x1080, 15.6" | Dell XPS 15 7590 9980HK GTX 1650 Samsung 156WR04, SDCA029, , 3840x2160, 15.6" | Dell XPS 15 9570 Core i9 UHD LQ156D1, , 3840x2160, 15.6" | Dell XPS 15 9570 i7 UHD LQ156D1, , 3840x2160, 15.6" | Dell XPS 15 2017 9560 (7300HQ, Full-HD) Sharp SHP1453 LQ156M1, , 1920x1080, 15.6" | |
|---|---|---|---|---|---|
| Display | 23% | 12% | 12% | 3% | |
| Display P3 Coverage (%) | 66.5 | 88.1 32% | 79.6 20% | 79.1 19% | 68.9 4% |
| sRGB Coverage (%) | 98 | 99.6 2% | 98.4 0% | 98.8 1% | 98.9 1% |
| AdobeRGB 1998 Coverage (%) | 68.4 | 91.8 34% | 79.7 17% | 79.2 16% | 70.9 4% |
| Response Times | 94% | 1% | 6% | -33% | |
| Response Time Grey 50% / Grey 80% * (ms) | 52.8 ? | 2.3 ? 96% | 52.4 ? 1% | 46.4 ? 12% | 54 ? -2% |
| Response Time Black / White * (ms) | 32 ? | 2.4 ? 92% | 31.6 ? 1% | 32 ? -0% | 52.4 ? -64% |
| PWM Frequency (Hz) | 1020 ? | 59.5 ? | 1000 ? | 980 ? | |
| Screen | -26% | -71% | -25% | -25% | |
| Brightness middle (cd/m²) | 588 | 421.2 -28% | 451.9 -23% | 494 -16% | 400 -32% |
| Brightness (cd/m²) | 555 | 417 -25% | 414 -25% | 457 -18% | 392 -29% |
| Brightness Distribution (%) | 89 | 94 6% | 81 -9% | 88 -1% | 89 0% |
| Black Level * (cd/m²) | 0.4 | 0.36 10% | 0.34 15% | 0.26 35% | |
| Contrast (:1) | 1470 | 1255 -15% | 1453 -1% | 1538 5% | |
| Colorchecker dE 2000 * | 2.5 | 6.06 -142% | 5.62 -125% | 5.2 -108% | 4.9 -96% |
| Colorchecker dE 2000 max. * | 6.3 | 11.89 -89% | 19.1 -203% | 17.5 -178% | 11 -75% |
| Colorchecker dE 2000 calibrated * | 0.6 | 2.69 -348% | |||
| Greyscale dE 2000 * | 4.5 | 2.8 38% | 6.9 -53% | 2.7 40% | 7.2 -60% |
| Gamma | 2.2 100% | 2.15 102% | 2.2 100% | 2.1 105% | 2.11 104% |
| CCT | 6836 95% | 6235 104% | 6254 104% | 7038 92% | 6911 94% |
| Color Space (Percent of AdobeRGB 1998) (%) | 63.2 | 81 28% | 71.8 14% | 71.2 13% | 64.2 2% |
| Color Space (Percent of sRGB) (%) | 98 | 99.6 2% | 98.5 1% | 98.8 1% | 98.9 1% |
| Média Total (Programa/Configurações) | 30% /
4% | -19% /
-46% | -2% /
-14% | -18% /
-20% |
* ... menor é melhor
Exibir tempos de resposta
| ↔ Tempo de resposta preto para branco | ||
|---|---|---|
| 32 ms ... ascensão ↗ e queda ↘ combinadas | ↗ 16.4 ms ascensão | 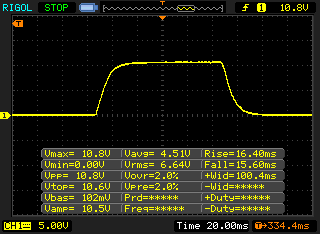 |
| ↘ 15.6 ms queda | ||
| A tela mostra taxas de resposta lentas em nossos testes e será insatisfatória para os jogadores. Em comparação, todos os dispositivos testados variam de 0.1 (mínimo) a 240 (máximo) ms. » 86 % de todos os dispositivos são melhores. Isso significa que o tempo de resposta medido é pior que a média de todos os dispositivos testados (19.9 ms). | ||
| ↔ Tempo de resposta 50% cinza a 80% cinza | ||
| 52.8 ms ... ascensão ↗ e queda ↘ combinadas | ↗ 25.6 ms ascensão | 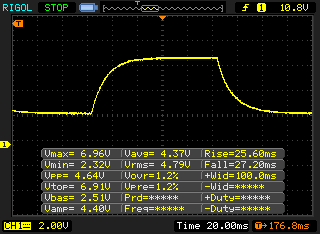 |
| ↘ 27.2 ms queda | ||
| A tela mostra taxas de resposta lentas em nossos testes e será insatisfatória para os jogadores. Em comparação, todos os dispositivos testados variam de 0.165 (mínimo) a 636 (máximo) ms. » 89 % de todos os dispositivos são melhores. Isso significa que o tempo de resposta medido é pior que a média de todos os dispositivos testados (31.1 ms). | ||
Cintilação da tela / PWM (modulação por largura de pulso)
| Tela tremeluzindo/PWM detectado | 1020 Hz | ≤ 25 % configuração de brilho | 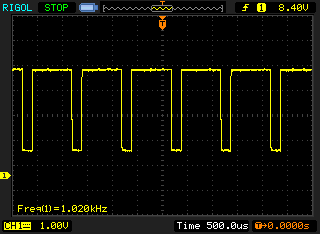 |
A luz de fundo da tela pisca em 1020 Hz (pior caso, por exemplo, utilizando PWM) Cintilação detectada em uma configuração de brilho de 25 % e abaixo. Não deve haver cintilação ou PWM acima desta configuração de brilho. A frequência de 1020 Hz é bastante alta, então a maioria dos usuários sensíveis ao PWM não deve notar nenhuma oscilação. [pwm_comparison] Em comparação: 52 % de todos os dispositivos testados não usam PWM para escurecer a tela. Se PWM foi detectado, uma média de 7784 (mínimo: 5 - máximo: 343500) Hz foi medida. | |||

| PCMark 8 Home Score Accelerated v2 | 4175 pontos | |
| PCMark 8 Creative Score Accelerated v2 | 5022 pontos | |
| PCMark 8 Work Score Accelerated v2 | 5070 pontos | |
| PCMark 10 Score | 4105 pontos | |
Ajuda | ||

| 3DMark 11 Performance | 1989 pontos | |
| 3DMark Cloud Gate Standard Score | 9545 pontos | |
| 3DMark Fire Strike Score | 1100 pontos | |
| 3DMark Time Spy Score | 441 pontos | |
Ajuda | ||
| baixo | média | alto | ultra | 4K | |
|---|---|---|---|---|---|
| BioShock Infinite (2013) | 58.7 | 34.7 | 29.9 | 9.8 | |
| Dota 2 Reborn (2015) | 78 | 49.5 | 20.2 | 17.9 | 6.5 |
| X-Plane 11.11 (2018) | 24.5 | 15.1 | 13.3 |
Barulho
| Ocioso |
| 29.3 / 29.3 / 29.8 dB |
| Carga |
| 32.4 / 37.2 dB |
 | ||
30 dB silencioso 40 dB(A) audível 50 dB(A) ruidosamente alto |
||
min: | ||
| Dell XPS 15 7590 i5 iGPU FHD UHD Graphics 630, i5-9300H, Toshiba XG6 KXG60ZNV512G | Dell XPS 15 7590 9980HK GTX 1650 GeForce GTX 1650 Mobile, i9-9980HK, Toshiba XG6 KXG60ZNV1T02 | Dell XPS 15 9570 i7 UHD GeForce GTX 1050 Ti Max-Q, i7-8750H, Toshiba XG5 KXG50ZNV512G | Dell XPS 15 9570 Core i9 UHD GeForce GTX 1050 Ti Max-Q, i9-8950HK, Samsung SSD PM981 MZVLB1T0HALR | Dell XPS 15 2017 9560 (7300HQ, Full-HD) GeForce GTX 1050 Mobile, i5-7300HQ, WDC WD10SPCX-75KHST0 + SanDisk Z400s M.2 2242 32 GB Cache | |
|---|---|---|---|---|---|
| Noise | -9% | -5% | -5% | -18% | |
| desligado / ambiente * (dB) | 29.3 | 28.2 4% | 29.9 -2% | 28.2 4% | 30.3 -3% |
| Idle Minimum * (dB) | 29.3 | 28.2 4% | 29.9 -2% | 28.5 3% | 31.6 -8% |
| Idle Average * (dB) | 29.3 | 28.2 4% | 29.9 -2% | 28.6 2% | 31.6 -8% |
| Idle Maximum * (dB) | 29.8 | 30.4 -2% | 30.3 -2% | 28.8 3% | 33.4 -12% |
| Load Average * (dB) | 32.4 | 43.8 -35% | 36.5 -13% | 36.2 -12% | 47.8 -48% |
| Load Maximum * (dB) | 37.2 | 47.2 -27% | 40.4 -9% | 47.6 -28% | 47.8 -28% |
| Witcher 3 ultra * (dB) | 47.2 | 40.4 | 47.6 |
* ... menor é melhor
(±) A temperatura máxima no lado superior é 44.6 °C / 112 F, em comparação com a média de 36.8 °C / 98 F , variando de 21 a 71 °C para a classe Multimedia.
(+) A parte inferior aquece até um máximo de 39 °C / 102 F, em comparação com a média de 39.1 °C / 102 F
(+) Em uso inativo, a temperatura média para o lado superior é 23.1 °C / 74 F, em comparação com a média do dispositivo de 31.3 °C / ### class_avg_f### F.
(+) Os apoios para as mãos e o touchpad são mais frios que a temperatura da pele, com um máximo de 28.9 °C / 84 F e, portanto, são frios ao toque.
(±) A temperatura média da área do apoio para as mãos de dispositivos semelhantes foi 28.7 °C / 83.7 F (-0.2 °C / -0.3 F).
Dell XPS 15 7590 i5 iGPU FHD análise de áudio
(±) | o volume do alto-falante é médio, mas bom (###valor### dB)
Graves 100 - 315Hz
(-) | quase nenhum baixo - em média 26.4% menor que a mediana
(±) | a linearidade dos graves é média (12.1% delta para a frequência anterior)
Médios 400 - 2.000 Hz
(+) | médios equilibrados - apenas 4.5% longe da mediana
(±) | a linearidade dos médios é média (8% delta para frequência anterior)
Altos 2 - 16 kHz
(+) | agudos equilibrados - apenas 1.4% longe da mediana
(+) | os máximos são lineares (2.8% delta da frequência anterior)
Geral 100 - 16.000 Hz
(±) | a linearidade do som geral é média (21.2% diferença em relação à mediana)
Comparado com a mesma classe
» 73% de todos os dispositivos testados nesta classe foram melhores, 7% semelhantes, 20% piores
» O melhor teve um delta de 5%, a média foi 17%, o pior foi 45%
Comparado com todos os dispositivos testados
» 59% de todos os dispositivos testados foram melhores, 7% semelhantes, 34% piores
» O melhor teve um delta de 4%, a média foi 24%, o pior foi 134%
| desligado | |
| Ocioso | |
| Carga |
|
Key:
min: | |
| Dell XPS 15 7590 i5 iGPU FHD i5-9300H, UHD Graphics 630, IPS, 1920x1080 | Dell XPS 15 7590 9980HK GTX 1650 i9-9980HK, GeForce GTX 1650 Mobile, OLED, 3840x2160 | Dell XPS 15 9570 i7 UHD i7-8750H, GeForce GTX 1050 Ti Max-Q, IPS, 3840x2160 | Dell XPS 15 9570 Core i9 UHD i9-8950HK, GeForce GTX 1050 Ti Max-Q, IPS, 3840x2160 | Dell XPS 15 2017 9560 (7300HQ, Full-HD) i5-7300HQ, GeForce GTX 1050 Mobile, LED IGZO IPS InfinityEdge, 1920x1080 | |
|---|---|---|---|---|---|
| Power Consumption | -65% | -87% | -65% | -33% | |
| Idle Minimum * (Watt) | 3.79 | 6.2 -64% | 9.48 -150% | 7.1 -87% | 6.6 -74% |
| Idle Average * (Watt) | 6.9 | 9.6 -39% | 16.1 -133% | 13.6 -97% | 9 -30% |
| Idle Maximum * (Watt) | 9.2 | 21.2 -130% | 16.9 -84% | 14.1 -53% | 10.7 -16% |
| Load Average * (Watt) | 62 | 104.3 -68% | 90.8 -46% | 103.9 -68% | 77.5 -25% |
| Load Maximum * (Watt) | 108 | 135.3 -25% | 134.4 -24% | 130.9 -21% | 130 -20% |
| Witcher 3 ultra * (Watt) | 91.7 | 103 |
* ... menor é melhor
| Dell XPS 15 7590 i5 iGPU FHD i5-9300H, UHD Graphics 630, 97 Wh | Dell XPS 15 7590 9980HK GTX 1650 i9-9980HK, GeForce GTX 1650 Mobile, 97 Wh | Dell XPS 15 9570 i7 UHD i7-8750H, GeForce GTX 1050 Ti Max-Q, 97 Wh | Dell XPS 15 9570 Core i9 UHD i9-8950HK, GeForce GTX 1050 Ti Max-Q, 97 Wh | Dell XPS 15 2017 9560 (7300HQ, Full-HD) i5-7300HQ, GeForce GTX 1050 Mobile, 56 Wh | Média da turma Multimedia | |
|---|---|---|---|---|---|---|
| Duração da bateria | 25% | -29% | -40% | -39% | -8% | |
| H.264 (h) | 17.6 | 12.3 -30% | 16.4 ? -7% | |||
| WiFi v1.3 (h) | 14.1 | 7.8 -45% | 9.6 -32% | 8.6 -39% | 5.6 -60% | 12 ? -15% |
| Load (h) | 1.7 | 3.3 94% | 1.3 -24% | 1 -41% | 1.4 -18% | 1.675 ? -1% |
| Witcher 3 ultra (h) | 1 |
Pro
Contra
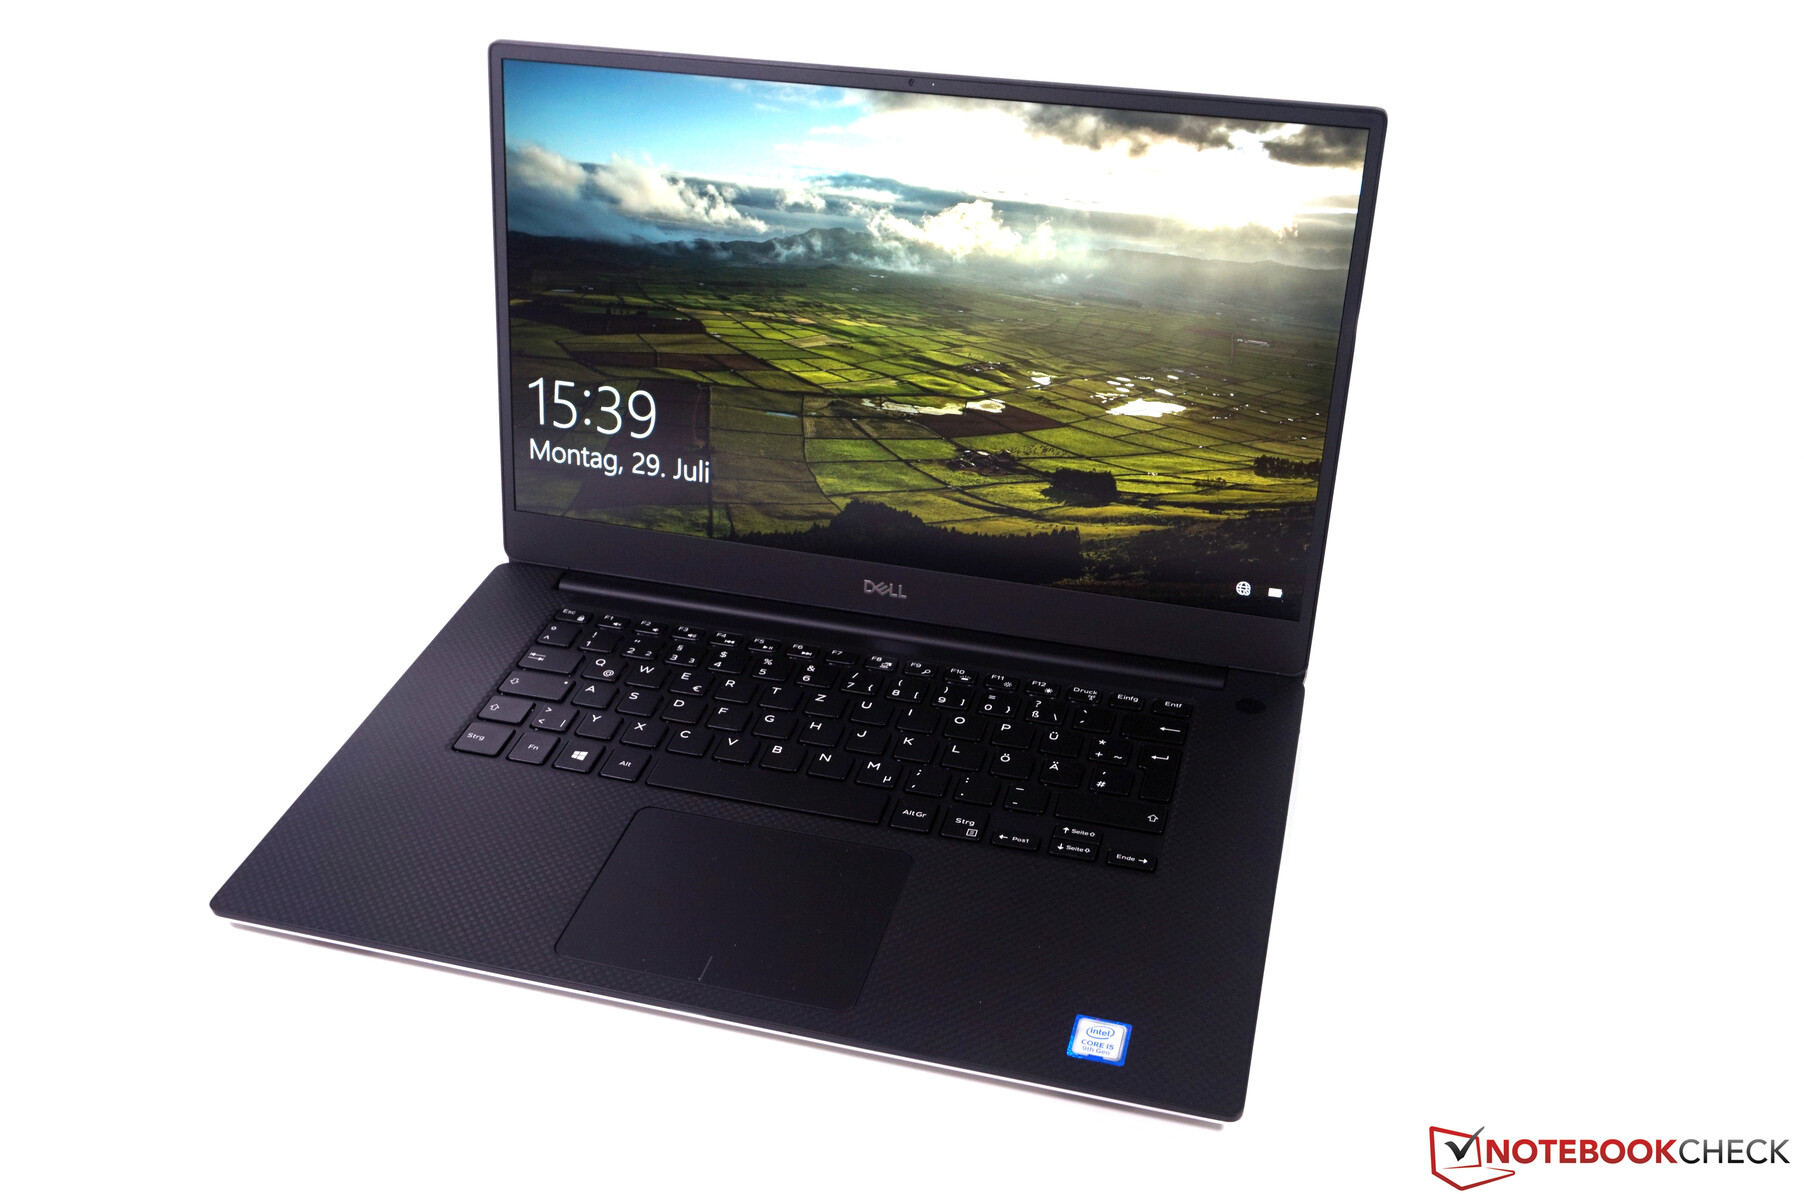
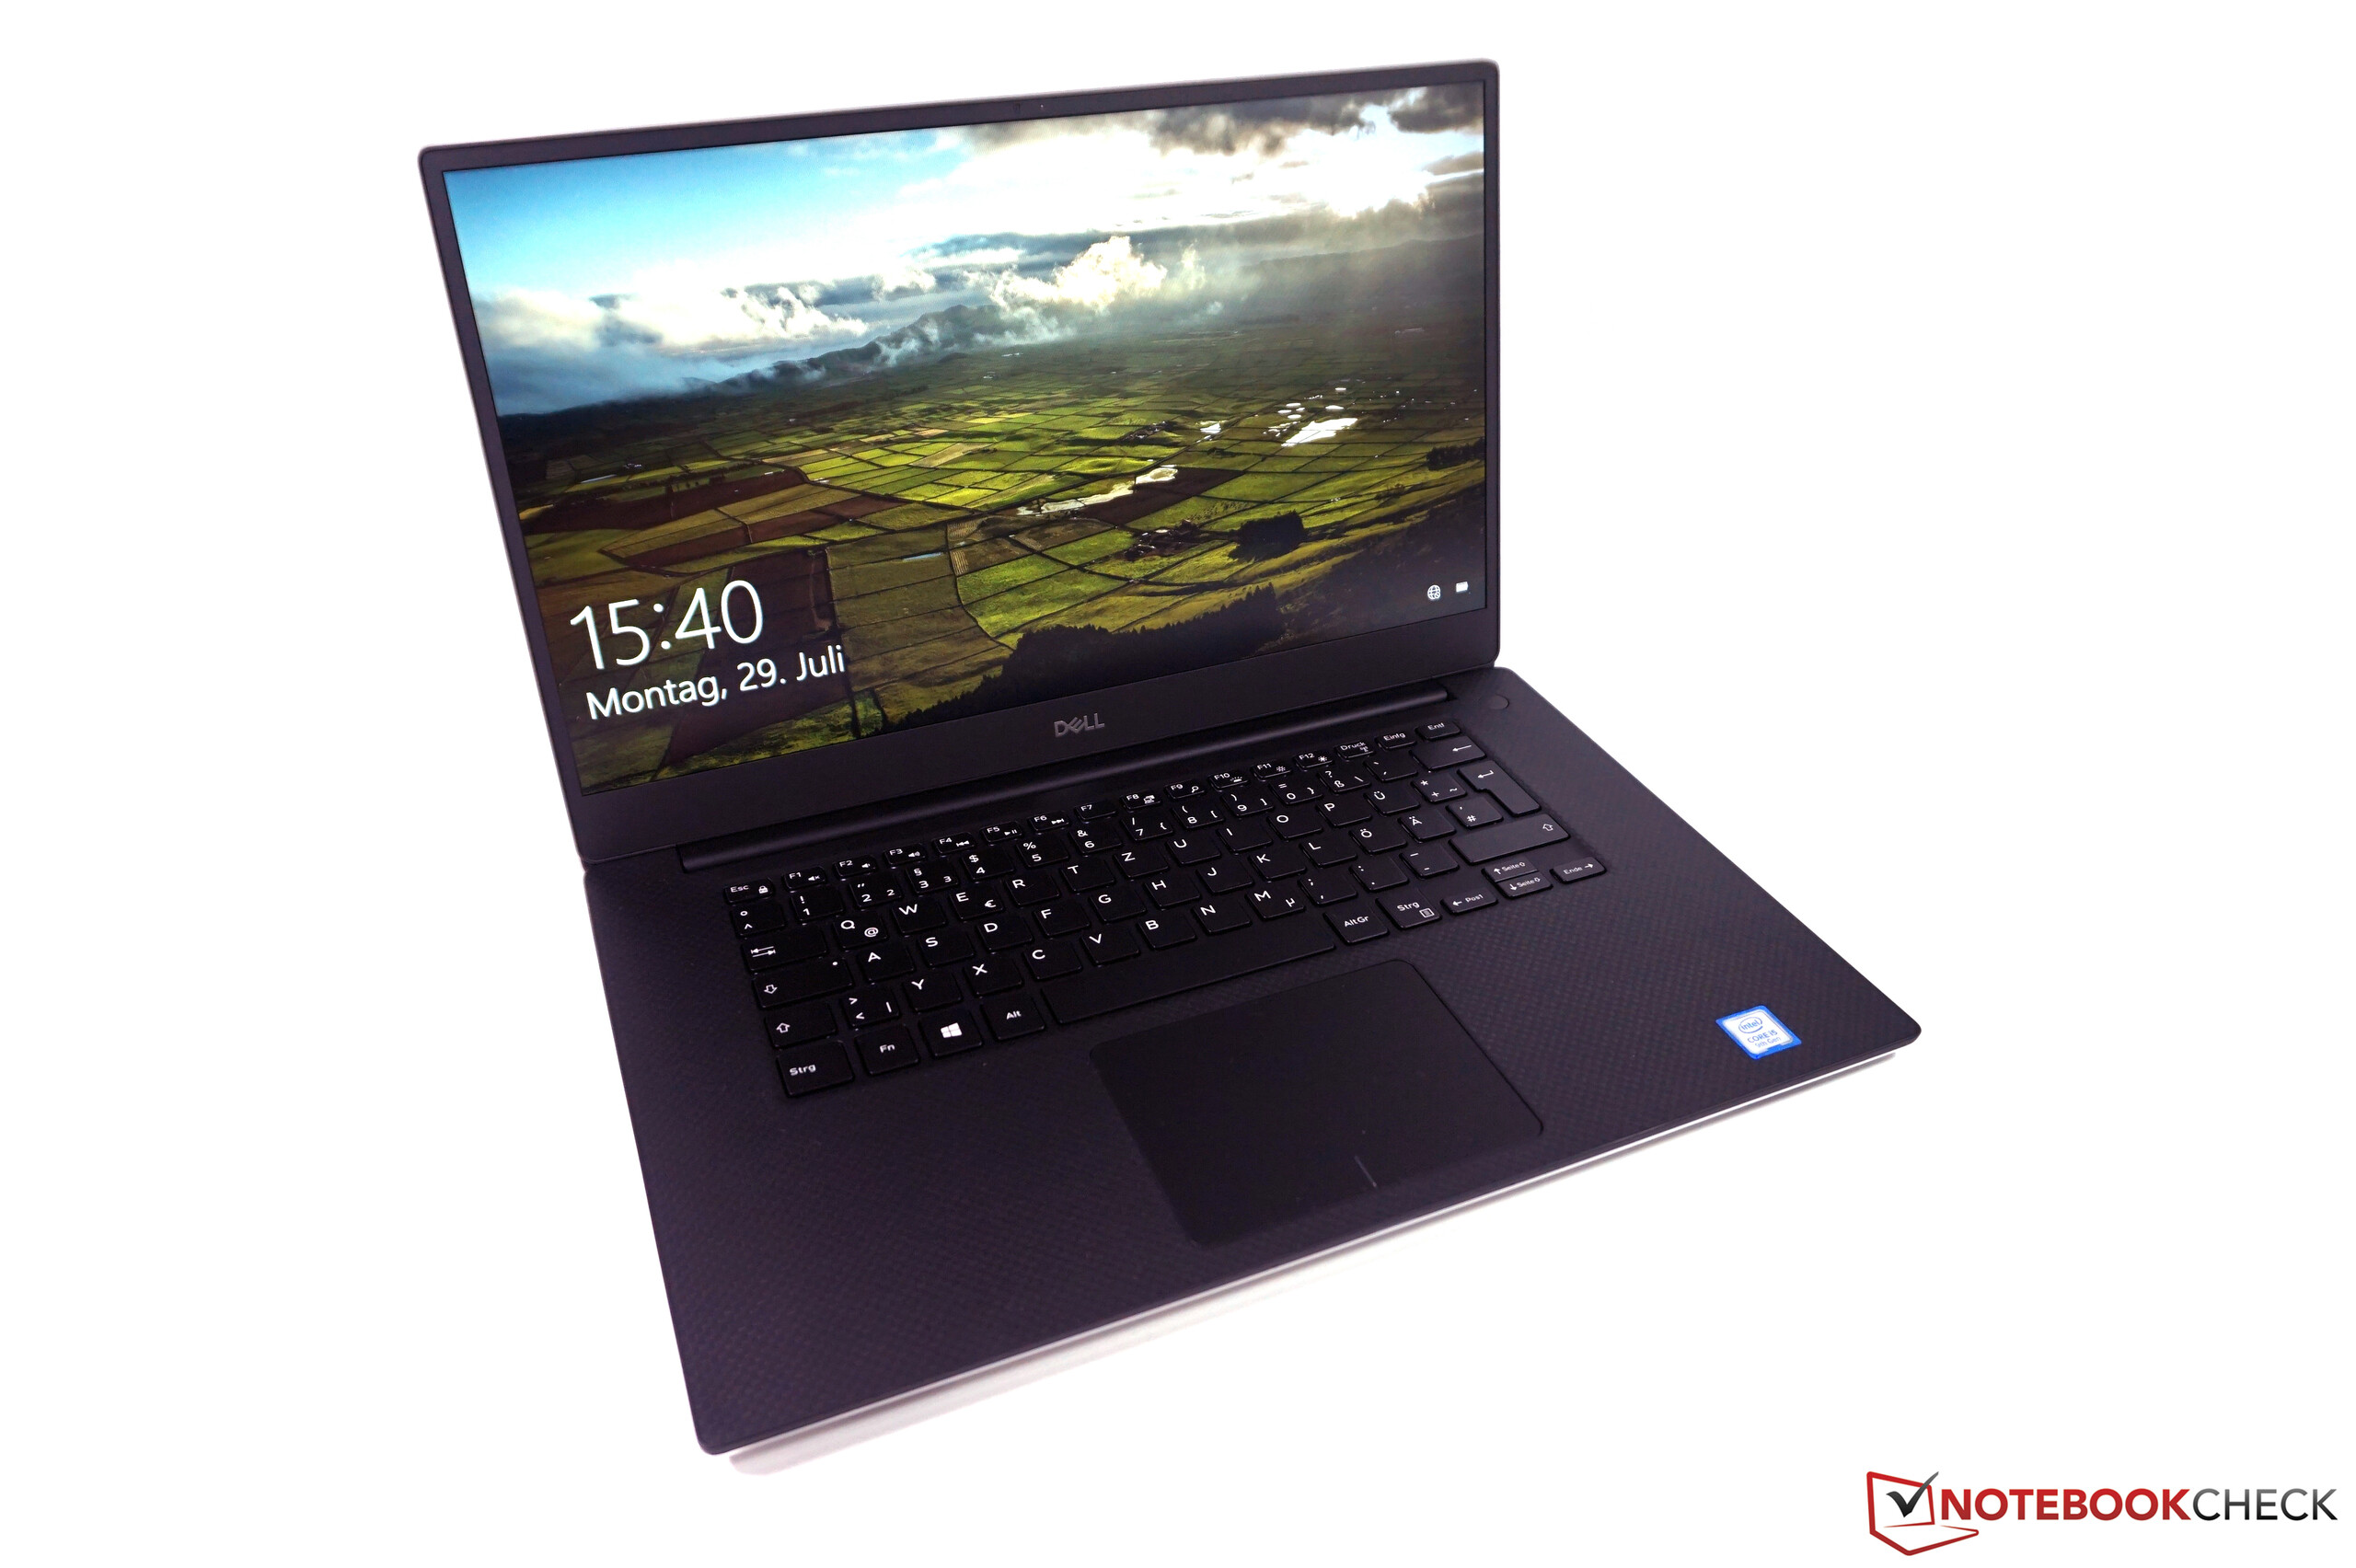
Mesmo sem uma placa gráfica GeForce dedicada, o Dell XPS 15 é um bom portátil multimídia. Aqueles que não querem jogar jogos para celular ou planejam usar uma placa de vídeo externa em sua mesa em casa estão melhor servidos com a versão iGPU. Particularmente em termos de emissões (temperatura e ruído) e preço, existem algumas vantagens claras. Para a maioria dos usuários, o restante do equipamento da configuração básica é certamente suficiente no uso diário.
Aqueles que não jogam jogos para celular e apenas querem um portátil multimídia de alta qualidade com uma muito boa tela de 1080p definitivamente não errarão com a versão básica do atual Dell XPS 15 7590. Existem ainda algumas vantagens, como a melhor usabilidade em exteriores e a excelente duração da bateria que você não obterá com as versões 4K do XPS 15.
A tela Full HD mate é uma opção muito boa e ainda possui vantagens em comparação com os painéis 4K em termos de brilho máximo. Em combinação com a superfície mate e o baixo consumo de energia, é claramente a melhor opção se você costuma trabalhar em movimento. Você também pode se beneficiar da duração extremamente longa da bateria, que não é possível com as versões 4K (independentemente do IPS ou OLED) do XPS 15.
Dell XPS 15 7590 i5 iGPU FHD
- 09/26/2019 v7 (old)
Andreas Osthoff
Price comparison
