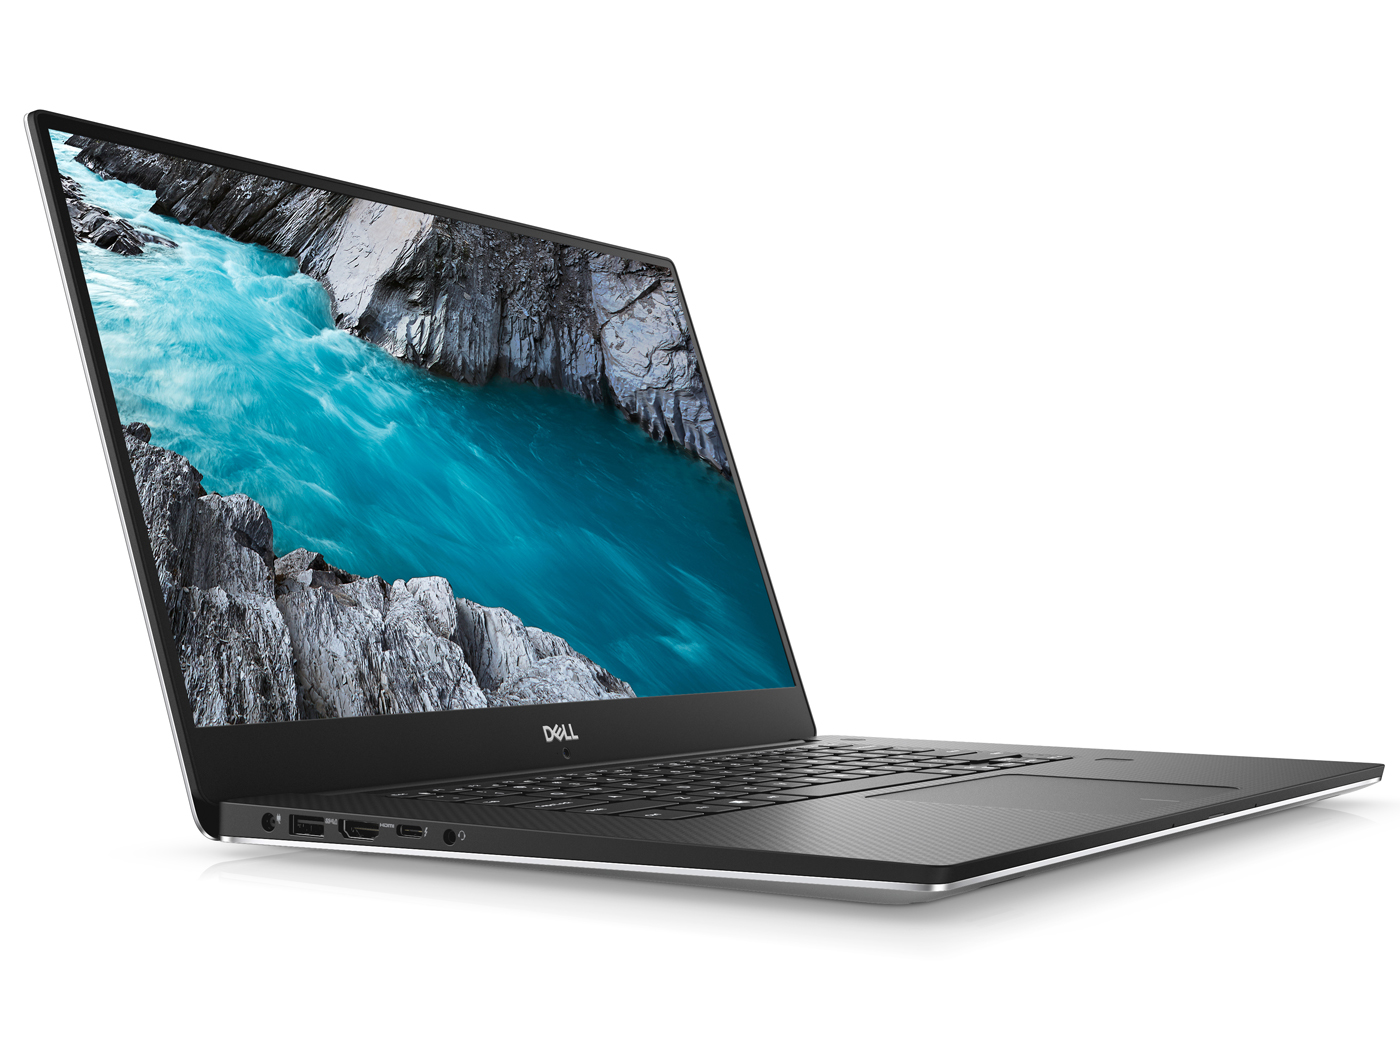
Breve Análise do Portátil Dell XPS 15 9570 (i7, UHD, GTX 1050 Ti Max-Q)
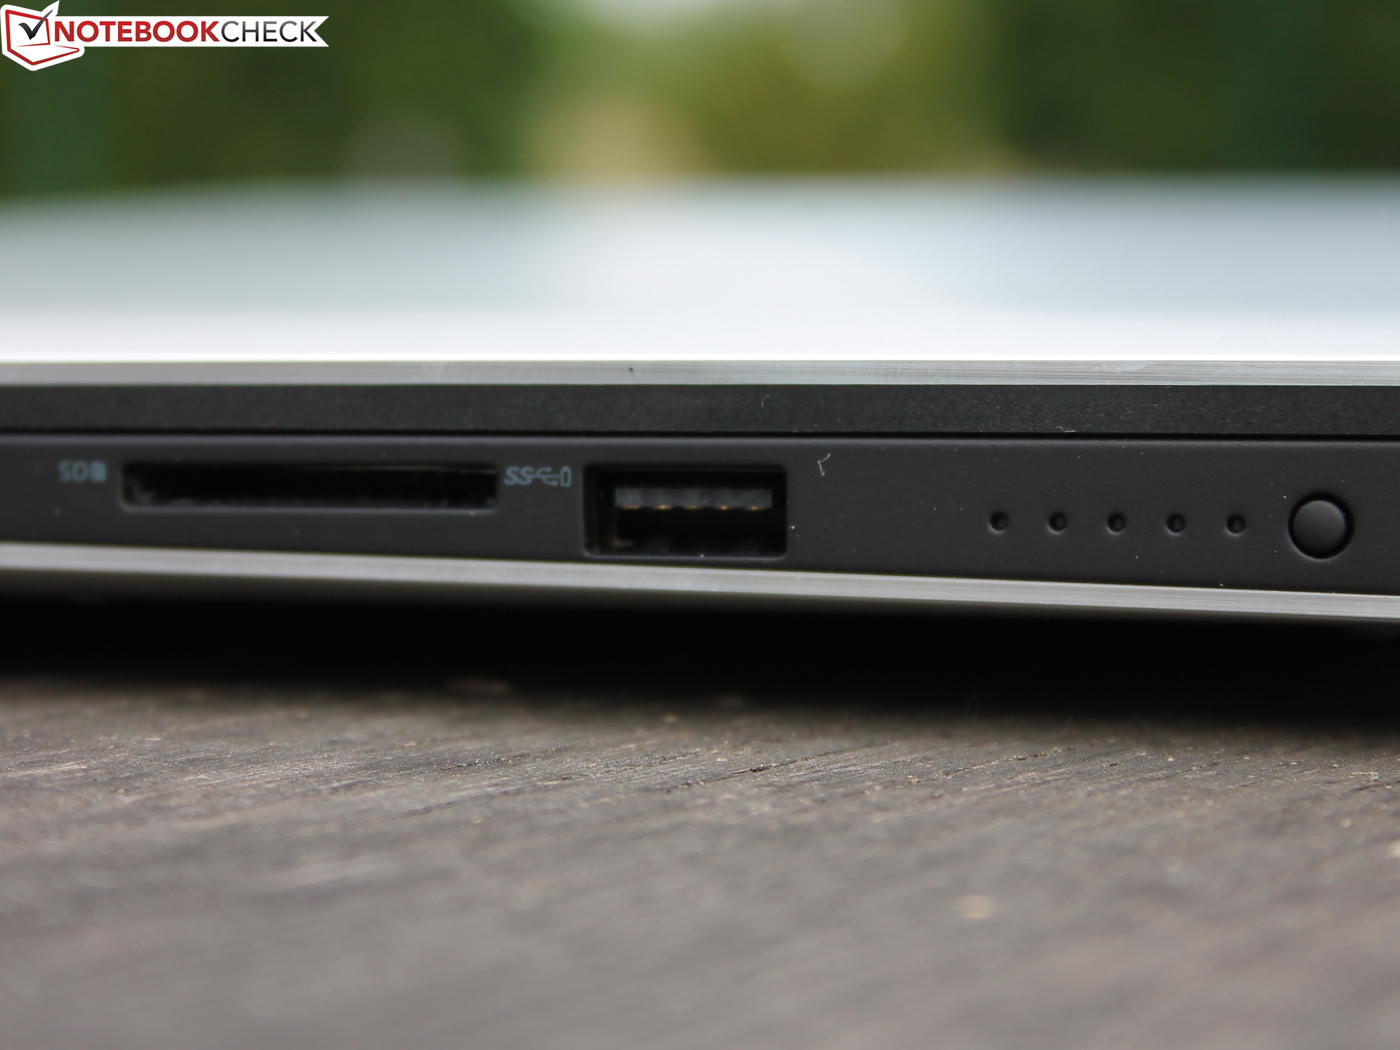
| SD Card Reader | |
| average JPG Copy Test (av. of 3 runs) | |
| Dell XPS 15 9570 i7 UHD (Toshiba Exceria Pro SDXC 64 GB UHS-II) | |
| HP EliteBook 1050 G1-4QY20EA (Toshiba Exceria Pro SDXC 64 GB UHS-II) | |
| Média da turma Multimedia (23 - 531, n=43, últimos 2 anos) | |
| Asus ZenBook Pro 15 UX580GE (Toshiba Exceria Pro M501 UHS-II) | |
| maximum AS SSD Seq Read Test (1GB) | |
| HP EliteBook 1050 G1-4QY20EA (Toshiba Exceria Pro SDXC 64 GB UHS-II) | |
| Dell XPS 15 9570 i7 UHD (Toshiba Exceria Pro SDXC 64 GB UHS-II) | |
| Média da turma Multimedia (27.9 - 1455, n=42, últimos 2 anos) | |
| |||||||||||||||||||||||||
iluminação: 88 %
iluminação com acumulador: 489 cd/m²
Contraste: 1453:1 (Preto: 0.34 cd/m²)
ΔE ColorChecker Calman: 5.2 | ∀{0.5-29.43 Ø4.72}
ΔE Greyscale Calman: 2.7 | ∀{0.09-98 Ø4.97}
98.8% sRGB (Argyll 1.6.3 3D)
71.2% AdobeRGB 1998 (Argyll 1.6.3 3D)
79.2% AdobeRGB 1998 (Argyll 3D)
98.8% sRGB (Argyll 3D)
79.1% Display P3 (Argyll 3D)
Gamma: 2.1
CCT: 7038 K
| Dell XPS 15 9570 i7 UHD LQ156D1, , 3840x2160, 15.6" | Dell XPS 15 2018 i5 FHD 97Wh Sharp SHP149A LQ156M1, , 1920x1080, 15.6" | Apple MacBook Pro 15 2018 (2.6 GHz, 560X) APPA040, , 2880x1800, 15.4" | HP EliteBook 1050 G1-4QY20EA AUO30EB, , 3840x2160, 15.6" | Asus ZenBook Pro 15 UX580GE AU Optronics B156ZAN03.1, , 3840x2160, 15.6" | Razer Blade 15 GTX 1060 LGD05C0, , 1920x1080, 15.6" | |
|---|---|---|---|---|---|---|
| Display | -12% | 12% | -11% | 12% | -14% | |
| Display P3 Coverage (%) | 79.1 | 66 -17% | 98.7 25% | 67.8 -14% | 85.9 9% | 64.4 -19% |
| sRGB Coverage (%) | 98.8 | 96.5 -2% | 99.9 1% | 94.1 -5% | 100 1% | 93.4 -5% |
| AdobeRGB 1998 Coverage (%) | 79.2 | 66.7 -16% | 86.6 9% | 67.9 -14% | 99.1 25% | 65.5 -17% |
| Response Times | 0% | 5% | -6% | 17% | 67% | |
| Response Time Grey 50% / Grey 80% * (ms) | 46.4 ? | 49 ? -6% | 43.2 ? 7% | 56 ? -21% | 44 ? 5% | 13.6 ? 71% |
| Response Time Black / White * (ms) | 32 ? | 30 ? 6% | 31.2 ? 2% | 29 ? 9% | 22.8 ? 29% | 12 ? 62% |
| PWM Frequency (Hz) | 980 ? | 961 ? | 117000 ? | |||
| Screen | 10% | 26% | -8% | 3% | 4% | |
| Brightness middle (cd/m²) | 494 | 413 -16% | 520 5% | 440 -11% | 357.6 -28% | 304.3 -38% |
| Brightness (cd/m²) | 457 | 378 -17% | 492 8% | 389 -15% | 350 -23% | 293 -36% |
| Brightness Distribution (%) | 88 | 86 -2% | 88 0% | 83 -6% | 85 -3% | 80 -9% |
| Black Level * (cd/m²) | 0.34 | 0.29 15% | 0.39 -15% | 0.34 -0% | 0.35 -3% | 0.38 -12% |
| Contrast (:1) | 1453 | 1424 -2% | 1333 -8% | 1294 -11% | 1022 -30% | 801 -45% |
| Colorchecker dE 2000 * | 5.2 | 2.44 53% | 1.2 77% | 5.04 3% | 4.12 21% | 1.79 66% |
| Colorchecker dE 2000 max. * | 17.5 | 4.46 75% | 2.3 87% | 6.99 60% | 9.91 43% | 3.69 79% |
| Greyscale dE 2000 * | 2.7 | 2.48 8% | 1.3 52% | 4.98 -84% | 1.8 33% | 1.1 59% |
| Gamma | 2.1 105% | 2.43 91% | 2.18 101% | 2.48 89% | 2.17 101% | 2.27 97% |
| CCT | 7038 92% | 7006 93% | 6738 96% | 7777 84% | 6613 98% | 6665 98% |
| Color Space (Percent of AdobeRGB 1998) (%) | 71.2 | 62 -13% | 61 -14% | 87.5 23% | 59.8 -16% | |
| Color Space (Percent of sRGB) (%) | 98.8 | 96 -3% | 94 -5% | 100 1% | 92.8 -6% | |
| Colorchecker dE 2000 calibrated * | 2.48 | 2.04 | 4.23 | |||
| Média Total (Programa/Configurações) | -1% /
4% | 14% /
19% | -8% /
-9% | 11% /
7% | 19% /
9% |
* ... menor é melhor
Exibir tempos de resposta
| ↔ Tempo de resposta preto para branco | ||
|---|---|---|
| 32 ms ... ascensão ↗ e queda ↘ combinadas | ↗ 18 ms ascensão | 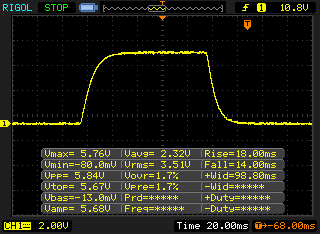 |
| ↘ 14 ms queda | ||
| A tela mostra taxas de resposta lentas em nossos testes e será insatisfatória para os jogadores. Em comparação, todos os dispositivos testados variam de 0.1 (mínimo) a 240 (máximo) ms. » 86 % de todos os dispositivos são melhores. Isso significa que o tempo de resposta medido é pior que a média de todos os dispositivos testados (19.8 ms). | ||
| ↔ Tempo de resposta 50% cinza a 80% cinza | ||
| 46.4 ms ... ascensão ↗ e queda ↘ combinadas | ↗ 22.8 ms ascensão | 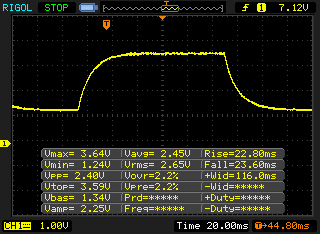 |
| ↘ 23.6 ms queda | ||
| A tela mostra taxas de resposta lentas em nossos testes e será insatisfatória para os jogadores. Em comparação, todos os dispositivos testados variam de 0.165 (mínimo) a 636 (máximo) ms. » 80 % de todos os dispositivos são melhores. Isso significa que o tempo de resposta medido é pior que a média de todos os dispositivos testados (31 ms). | ||
Cintilação da tela / PWM (modulação por largura de pulso)
| Tela tremeluzindo/PWM detectado | 980 Hz | ≤ 25 % configuração de brilho | 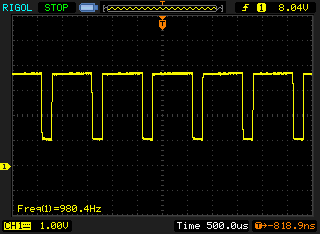 |
A luz de fundo da tela pisca em 980 Hz (pior caso, por exemplo, utilizando PWM) Cintilação detectada em uma configuração de brilho de 25 % e abaixo. Não deve haver cintilação ou PWM acima desta configuração de brilho. A frequência de 980 Hz é bastante alta, então a maioria dos usuários sensíveis ao PWM não deve notar nenhuma oscilação. [pwm_comparison] Em comparação: 52 % de todos os dispositivos testados não usam PWM para escurecer a tela. Se PWM foi detectado, uma média de 7763 (mínimo: 5 - máximo: 343500) Hz foi medida. | |||

| PCMark 8 Home Score Accelerated v2 | 3631 pontos | |
| PCMark 8 Creative Score Accelerated v2 | 5284 pontos | |
| PCMark 8 Work Score Accelerated v2 | 4418 pontos | |
| PCMark 10 Score | 4966 pontos | |
Ajuda | ||
| Dell XPS 15 9570 i7 UHD Toshiba XG5 KXG50ZNV512G | Dell XPS 15 2018 i5 FHD 97Wh Lite-On CA3-8D256-Q11 | HP EliteBook 1050 G1-4QY20EA Toshiba XG5-P KXG50PNV2T04 | Asus ZenBook Pro 15 UX580GE Samsung SSD PM961 1TB M.2 PCIe 3.0 x4 NVMe (MZVLW1T0) | Razer Blade 15 GTX 1060 Samsung SSD PM981 MZVLB512HAJQ | Média Toshiba XG5 KXG50ZNV512G | |
|---|---|---|---|---|---|---|
| CrystalDiskMark 5.2 / 6 | -5% | -6% | 27% | 17% | 4% | |
| Write 4K (MB/s) | 79.1 | 89.4 13% | 94.8 20% | 125 58% | 97.9 24% | 114 ? 44% |
| Read 4K (MB/s) | 37.89 | 44.64 18% | 26.45 -30% | 44.68 18% | 41.32 9% | 35.6 ? -6% |
| Write Seq (MB/s) | 1119 | 830 -26% | 1037 -7% | 1059 -5% | 1594 42% | 684 ? -39% |
| Read Seq (MB/s) | 1852 | 1774 -4% | 1280 -31% | 772 -58% | 1353 -27% | 1612 ? -13% |
| Write 4K Q32T1 (MB/s) | 361.1 | 310.6 -14% | 277.6 -23% | 507 40% | 305.6 -15% | 401 ? 11% |
| Read 4K Q32T1 (MB/s) | 257.9 | 266.4 3% | 333.9 29% | 614 138% | 354.1 37% | 427 ? 66% |
| Write Seq Q32T1 (MB/s) | 1131 | 831 -27% | 1037 -8% | 1763 56% | 2033 80% | 830 ? -27% |
| Read Seq Q32T1 (MB/s) | 3096 | 2962 -4% | 3135 1% | 2171 -30% | 2543 -18% | 2950 ? -5% |

| 3DMark 06 1024x768 Score | 34786 pontos | |
| 3DMark Vantage P Result | 34180 pontos | |
| 3DMark 11 Performance | 9414 pontos | |
| 3DMark Ice Storm Standard Score | 41456 pontos | |
| 3DMark Fire Strike Score | 6753 pontos | |
| 3DMark Fire Strike Extreme Score | 3431 pontos | |
| 3DMark Time Spy Score | 2513 pontos | |
Ajuda | ||
| baixo | média | alto | ultra | 4K | |
|---|---|---|---|---|---|
| BioShock Infinite (2013) | 297 | 214 | 187.8 | 74.6 | |
| The Witcher 3 (2015) | 130.9 | 87.2 | 48.2 | 26 | 17.1 |
| Rainbow Six Siege (2015) | 263.6 | 162.2 | 92.7 | 62.5 | 29.3 |
| Rise of the Tomb Raider (2016) | 99.9 | 73.6 | 47.3 | 39.9 | 16.8 |
| The Division (2016) | 114.2 | 83.4 | 42.5 | 34.8 | 15.7 |
| Battlefield 1 (2016) | 89.5 | 85.2 | 51.7 | 49.8 | 21.1 |
| For Honor (2017) | 113.6 | 63.8 | 65.5 | 49.5 | 19.2 |
| Ghost Recon Wildlands (2017) | 68.6 | 42.7 | 40 | 23.4 | 14.5 |
| Assassin´s Creed Origins (2017) | 58 | 41 | 33 | 27 | 13 |
| Star Wars Battlefront 2 (2017) | 92.3 | 42 | 34.3 | 30.4 | |
| Far Cry 5 (2018) | 91 | 48 | 44 | 38 | 13 |
| The Crew 2 (2018) | 60 | 49.1 | 45.3 | 42 | 14 |
Barulho
| Ocioso |
| 29.9 / 29.9 / 30.3 dB |
| Carga |
| 36.5 / 40.4 dB |
 | ||
30 dB silencioso 40 dB(A) audível 50 dB(A) ruidosamente alto |
||
min: | ||
| Dell XPS 15 9570 i7 UHD GeForce GTX 1050 Ti Max-Q, i7-8750H, Toshiba XG5 KXG50ZNV512G | Dell XPS 15 2018 i5 FHD 97Wh GeForce GTX 1050 Mobile, i5-8300H, Lite-On CA3-8D256-Q11 | Apple MacBook Pro 15 2018 (2.6 GHz, 560X) Radeon Pro 560X, i7-8850H, Apple SSD AP0512 | HP EliteBook 1050 G1-4QY20EA GeForce GTX 1050 Max-Q, i7-8750H, Toshiba XG5-P KXG50PNV2T04 | Asus ZenBook Pro 15 UX580GE GeForce GTX 1050 Ti Mobile, i9-8950HK, Samsung SSD PM961 1TB M.2 PCIe 3.0 x4 NVMe (MZVLW1T0) | Razer Blade 15 GTX 1060 GeForce GTX 1060 Max-Q, i7-8750H, Samsung SSD PM981 MZVLB512HAJQ | Dell XPS 15 9560 (i7-7700HQ, UHD) GeForce GTX 1050 Mobile, i7-7700HQ, Lite-On CX2-8B512-Q11 | |
|---|---|---|---|---|---|---|---|
| Noise | -3% | -5% | -6% | -4% | -7% | -10% | |
| desligado / ambiente * (dB) | 29.9 | 30.3 -1% | 29.6 1% | 30.25 -1% | 28 6% | 28.1 6% | 28.4 5% |
| Idle Minimum * (dB) | 29.9 | 30.3 -1% | 30.1 -1% | 30.25 -1% | 28.6 4% | 28.1 6% | 29 3% |
| Idle Average * (dB) | 29.9 | 30.3 -1% | 30.1 -1% | 30.25 -1% | 29.9 -0% | 33 -10% | 29 3% |
| Idle Maximum * (dB) | 30.3 | 30.3 -0% | 30.1 1% | 31.8 -5% | 30.5 -1% | 33.5 -11% | 32.2 -6% |
| Load Average * (dB) | 36.5 | 37.1 -2% | 46.8 -28% | 44.7 -22% | 42.5 -16% | 42.2 -16% | 47.1 -29% |
| Witcher 3 ultra * (dB) | 40.4 | 43.3 -7% | 36 11% | 44.8 -11% | 45.3 -12% | 52 -29% | |
| Load Maximum * (dB) | 40.4 | 43 -6% | 46.8 -16% | 42 -4% | 44.8 -11% | 45.7 -13% | 47.1 -17% |
* ... menor é melhor
(-) A temperatura máxima no lado superior é 55.7 °C / 132 F, em comparação com a média de 36.8 °C / 98 F , variando de 21 a 71 °C para a classe Multimedia.
(-) A parte inferior aquece até um máximo de 48.5 °C / 119 F, em comparação com a média de 39.1 °C / 102 F
(+) Em uso inativo, a temperatura média para o lado superior é 24.1 °C / 75 F, em comparação com a média do dispositivo de 31.3 °C / ### class_avg_f### F.
(±) Jogando The Witcher 3, a temperatura média para o lado superior é 38 °C / 100 F, em comparação com a média do dispositivo de 31.3 °C / ## #class_avg_f### F.
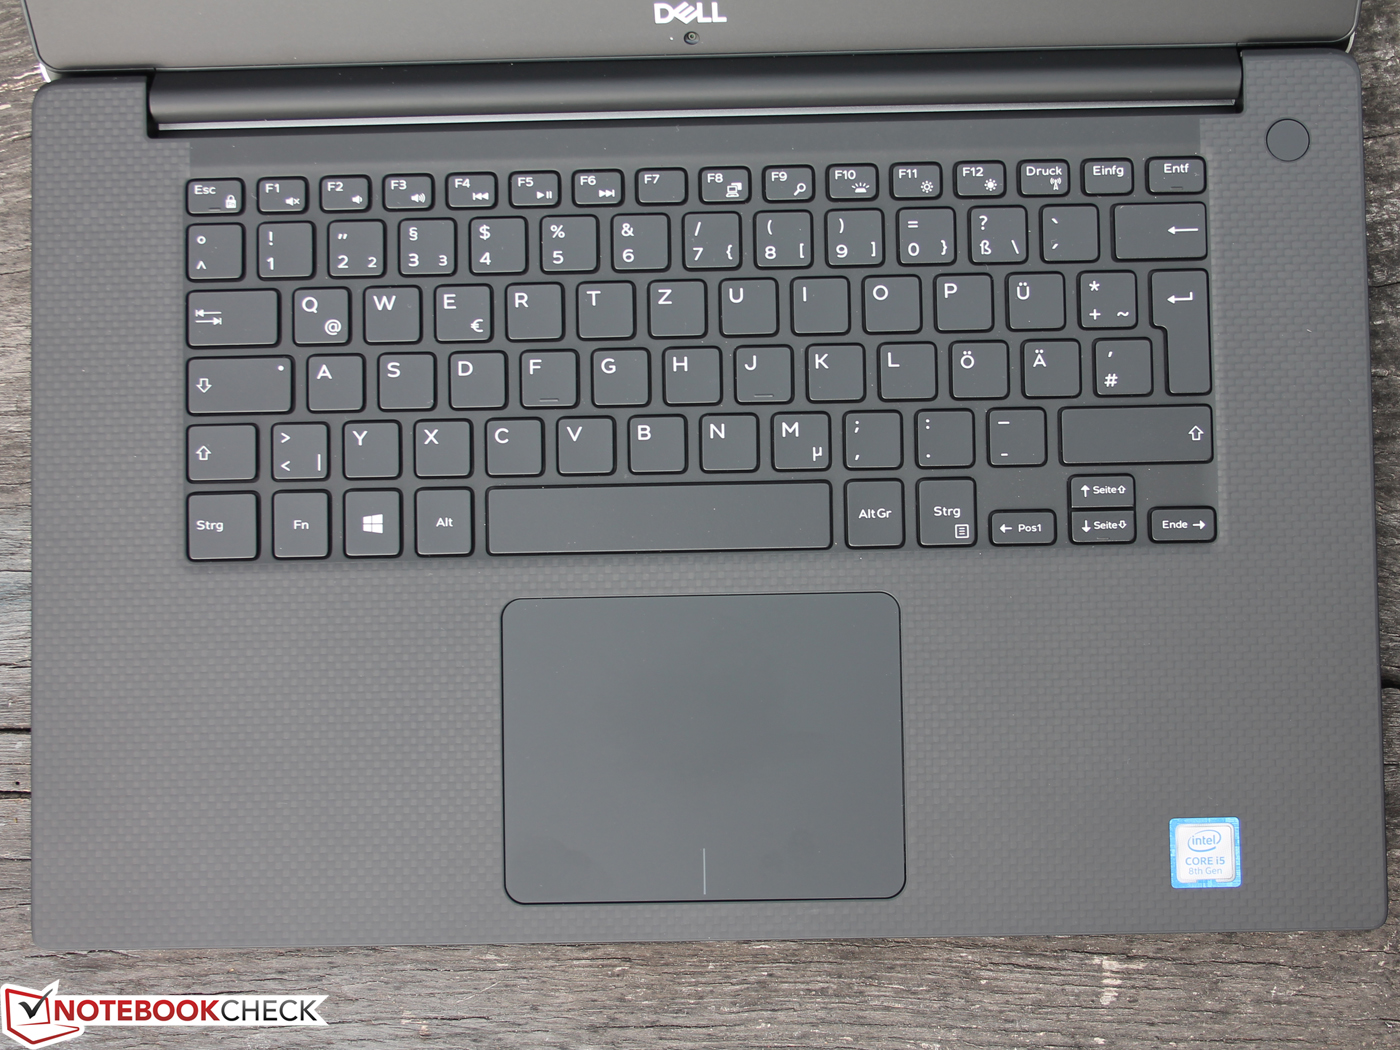
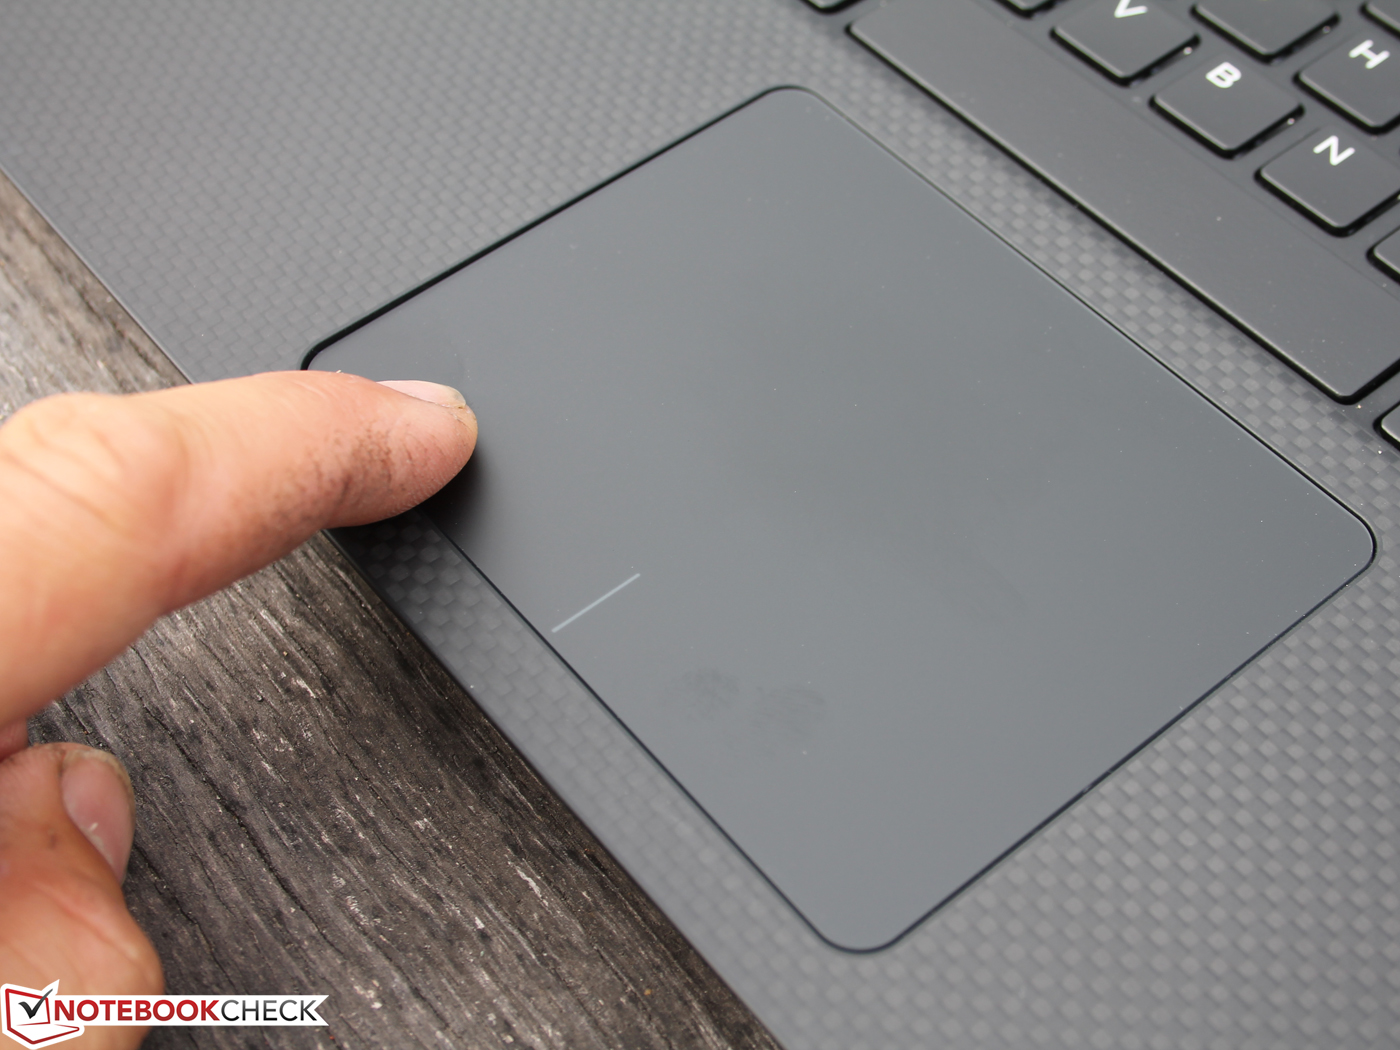
(+) Os apoios para as mãos e o touchpad estão atingindo a temperatura máxima da pele (34.6 °C / 94.3 F) e, portanto, não estão quentes.
(-) A temperatura média da área do apoio para as mãos de dispositivos semelhantes foi 28.7 °C / 83.7 F (-5.9 °C / -10.6 F).
| desligado | |
| Ocioso | |
| Carga |
|
Key:
min: | |
| Dell XPS 15 9570 i7 UHD i7-8750H, GeForce GTX 1050 Ti Max-Q, Toshiba XG5 KXG50ZNV512G, IPS, 3840x2160, 15.6" | Dell XPS 15 2018 i5 FHD 97Wh i5-8300H, GeForce GTX 1050 Mobile, Lite-On CA3-8D256-Q11, LED IGZO IPS InfinityEdge, 1920x1080, 15.6" | Apple MacBook Pro 15 2018 (2.6 GHz, 560X) i7-8850H, Radeon Pro 560X, Apple SSD AP0512, IPS, 2880x1800, 15.4" | HP EliteBook 1050 G1-4QY20EA i7-8750H, GeForce GTX 1050 Max-Q, Toshiba XG5-P KXG50PNV2T04, IPS LED, 3840x2160, 15.6" | Asus ZenBook Pro 15 UX580GE i9-8950HK, GeForce GTX 1050 Ti Mobile, Samsung SSD PM961 1TB M.2 PCIe 3.0 x4 NVMe (MZVLW1T0), IPS, 3840x2160, 15.6" | Razer Blade 15 GTX 1060 i7-8750H, GeForce GTX 1060 Max-Q, Samsung SSD PM981 MZVLB512HAJQ, IPS, 1920x1080, 15.6" | Média NVIDIA GeForce GTX 1050 Ti Max-Q | Média da turma Multimedia | |
|---|---|---|---|---|---|---|---|---|
| Power Consumption | 45% | 31% | 23% | -13% | -19% | 20% | 30% | |
| Idle Minimum * (Watt) | 9.48 | 2.9 69% | 3.4 64% | 6.1 36% | 11.7 -23% | 14.9 -57% | 5.8 ? 39% | 5.65 ? 40% |
| Idle Average * (Watt) | 16.1 | 5.8 64% | 11 32% | 10.2 37% | 18.5 -15% | 17.5 -9% | 11.2 ? 30% | 10 ? 38% |
| Idle Maximum * (Watt) | 16.9 | 7.5 56% | 14.9 12% | 13.4 21% | 22.8 -35% | 19.2 -14% | 13.5 ? 20% | 12.3 ? 27% |
| Load Average * (Watt) | 90.8 | 77.5 15% | 78.9 13% | 82 10% | 97.5 -7% | 103.2 -14% | 86.9 ? 4% | 65.1 ? 28% |
| Load Maximum * (Watt) | 134.4 | 107 20% | 91.2 32% | 122 9% | 111.1 17% | 132.7 1% | 122.4 ? 9% | 112.5 ? 16% |
| Witcher 3 ultra * (Watt) | 84 | 102.9 | 123.1 |
* ... menor é melhor
| Dell XPS 15 9570 i7 UHD i7-8750H, GeForce GTX 1050 Ti Max-Q, 97 Wh | Dell XPS 15 2018 i5 FHD 97Wh i5-8300H, GeForce GTX 1050 Mobile, 97 Wh | Apple MacBook Pro 15 2018 (2.6 GHz, 560X) i7-8850H, Radeon Pro 560X, 83 Wh | HP EliteBook 1050 G1-4QY20EA i7-8750H, GeForce GTX 1050 Max-Q, 96 Wh | Asus ZenBook Pro 15 UX580GE i9-8950HK, GeForce GTX 1050 Ti Mobile, 71 Wh | Razer Blade 15 GTX 1060 i7-8750H, GeForce GTX 1060 Max-Q, 80 Wh | Média da turma Multimedia | |
|---|---|---|---|---|---|---|---|
| Duração da bateria | 37% | 17% | 11% | -17% | -30% | 28% | |
| H.264 (h) | 12.3 | 11.7 -5% | 9.7 -21% | 16.2 ? 32% | |||
| WiFi v1.3 (h) | 9.6 | 15.7 64% | 10.2 6% | 8.7 -9% | 6.3 -34% | 6.7 -30% | 12 ? 25% |
| Witcher 3 ultra (h) | 1 | 1 0% | 1.5 50% | ||||
| Load (h) | 1.3 | 1.9 46% | 2.1 62% | 1.3 0% | 1.669 ? 28% |
Pro
Contra
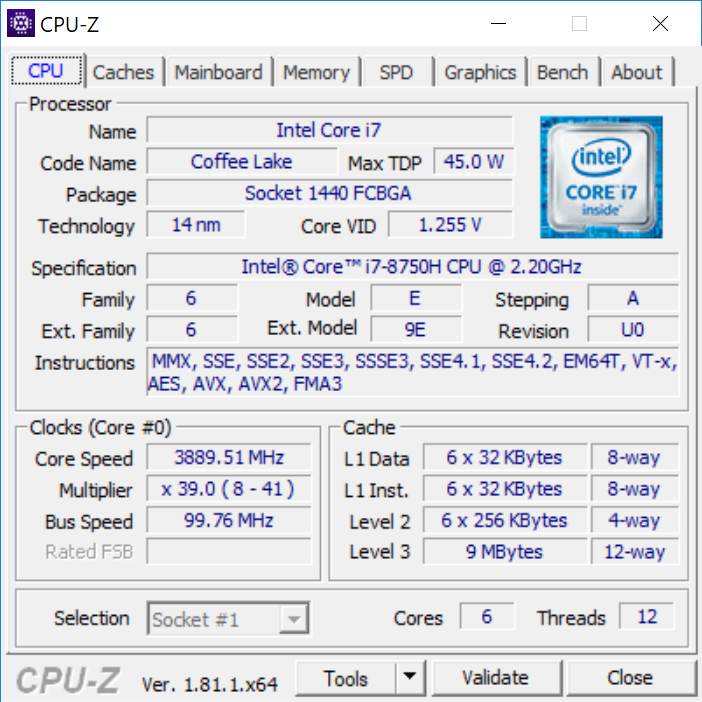
Mais núcleos de CPU, gráficos mais rápidos e mais pixels - será que a especificação mais cara do XPS 15 9570 é a melhor opção? Não, pelo menos não para todos os usuários. A boa utilização do desempenho da CPU e GPU é definitivamente um aspecto positivo, o que nem sempre é o caso dos dispositivos finos. Você também pode otimizar ainda mais o desempenho da CPU, de modo que a opção Core i7 não é um problema se você precisar de muita energia da CPU. A escolha da GPU também não é tão difícil, porque a GeForce GTX 1050 Ti Max-Q é um pouco mais rápida e mais preparada para o futuro.
A escolha da tela é um problema maior. A tela táctil 4K UHD opcional é um pouco mais brilhante e suporta entradas tácteis (se isto é uma vantagem, depende de suas preferências pessoais), mas é refletiva e estamos surpreendidos com os elevados desvios de cor, que melhoram apenas um pouco com uma calibração. A tela 4K, portanto, não é a melhor opção para a edição de imagens/vídeo. Também aumenta um pouco o peso e consome muito mais energia, de modo que o tempo de duração da bateria é muito menor. Aproximadamente 9,5 horas não são ruins para um sistema de 15 polegadas, mas o XPS 15 com a tela mate de 1080p dura muito mais tempo. As outras medições da tela de 1080p (brilho, contraste, etc.) também são boas, então a versão mais barata é provavelmente a melhor escolha para muitos usuários.
O desempenho adicional do processador e da placa gráfica é definitivamente uma vantagem, mas a tela táctil 4K opcional deixa impressões mistas. Ele consome muita energia e desvios de cor maciços impedem uma melhor pontuação.
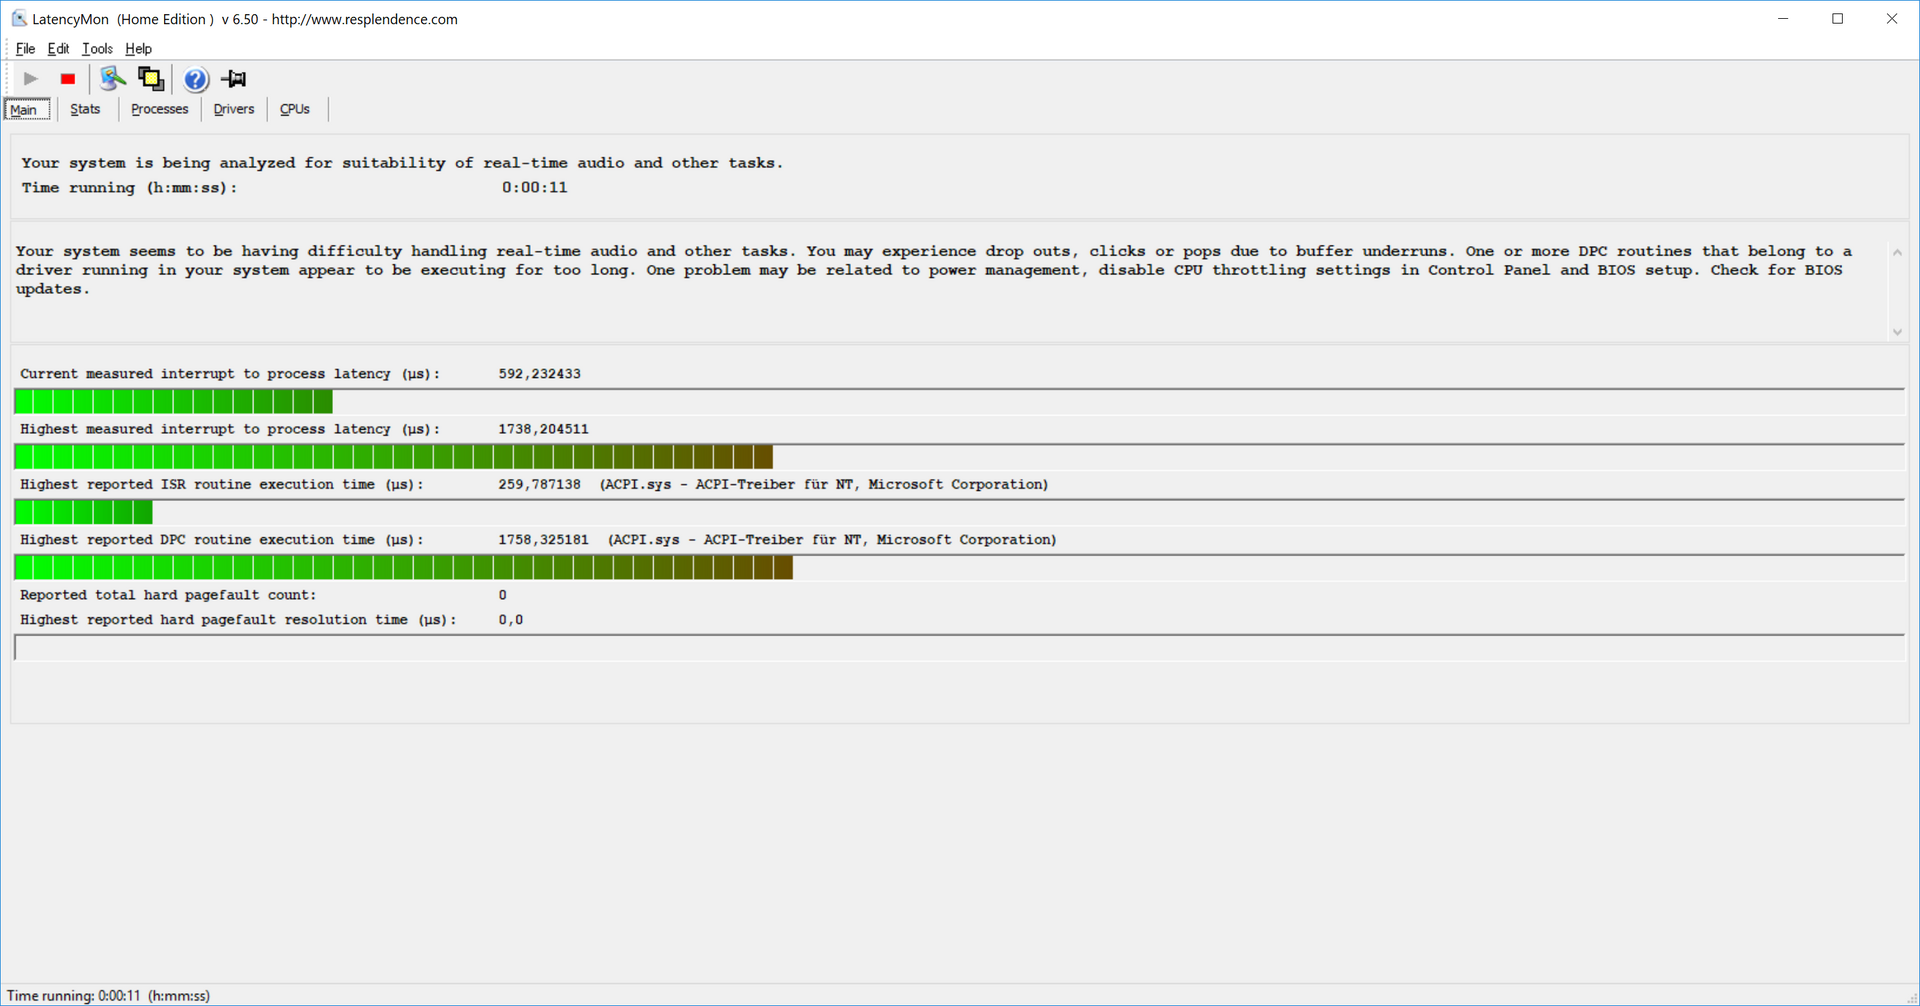
Nosso modelo de teste também sofreu com o ruído da bobina e os ventiladores tendem a pulsar durante cargas de trabalho médias. No geral, este XPS 15 SKU ainda é um portátil multimídia muito bom, mas o modelo base foi um pacote mais equilibrado e obteve uma pontuação geral mais alta como resultado. A melhor configuração é provavelmente com a tela FHD em combinação com o Core i7 e a GTX 1050 Ti. Vamos ter uma análise separada do modelo Core i9 e verificar se o preço adicional vale a pena.
Dell XPS 15 9570 i7 UHD
- 09/17/2018 v6 (old)
Andreas Osthoff
Price comparison
