Breve Análise do Portátil Dell XPS 15 9570 (i9-8950HK, 4K UHD, GTX 1050 Ti Max-Q)
| SD Card Reader | |
| average JPG Copy Test (av. of 3 runs) | |
| Lenovo ThinkPad X1 Extreme-20MF000XGE (Toshiba Exceria Pro SDXC 64 GB UHS-II) | |
| Dell XPS 15 9570 Core i9 UHD (Toshiba Exceria Pro SDXC 64 GB UHS-II) | |
| HP Spectre x360 15-ch011nr (Toshiba Exceria Pro SDXC 64 GB UHS-II) | |
| Dell XPS 15 9575 i7-8705G (Toshiba Exceria Pro M501 UHS-II) | |
| Asus ZenBook Pro 15 UX580GE (Toshiba Exceria Pro M501 UHS-II) | |
| maximum AS SSD Seq Read Test (1GB) | |
| Lenovo ThinkPad X1 Extreme-20MF000XGE (Toshiba Exceria Pro SDXC 64 GB UHS-II) | |
| HP Spectre x360 15-ch011nr (Toshiba Exceria Pro SDXC 64 GB UHS-II) | |
| Dell XPS 15 9570 Core i9 UHD (Toshiba Exceria Pro SDXC 64 GB UHS-II) | |
| Dell XPS 15 9575 i7-8705G (Toshiba Exceria Pro M501 UHS-II) | |
| |||||||||||||||||||||||||
iluminação: 81 %
iluminação com acumulador: 430.4 cd/m²
Contraste: 1255:1 (Preto: 0.36 cd/m²)
ΔE ColorChecker Calman: 5.62 | ∀{0.5-29.43 Ø4.71}
calibrated: 2.69
ΔE Greyscale Calman: 6.9 | ∀{0.09-98 Ø4.96}
98.5% sRGB (Argyll 1.6.3 3D)
71.8% AdobeRGB 1998 (Argyll 1.6.3 3D)
79.7% AdobeRGB 1998 (Argyll 3D)
98.4% sRGB (Argyll 3D)
79.6% Display P3 (Argyll 3D)
Gamma: 2.2
CCT: 6254 K
| Dell XPS 15 9570 Core i9 UHD LQ156D1, IPS, 15.6", 3840x2160 | Asus ZenBook Pro 15 UX580GE AU Optronics B156ZAN03.1, IPS, 15.6", 3840x2160 | Lenovo ThinkPad X1 Extreme-20MF000XGE B156ZAN03.2, IPS, 15.6", 3840x2160 | Dell XPS 15 9575 i7-8705G Sharp SHP148D, IPS, 15.6", 3840x2160 | HP Spectre x360 15-ch011nr BOE0730, IPS, 15.6", 3840x2160 | Razer Blade 15 Base Model BOE NV156FHM-N61, IPS, 15.6", 1920x1080 | |
|---|---|---|---|---|---|---|
| Display | 11% | 12% | -1% | -13% | -17% | |
| Display P3 Coverage (%) | 79.6 | 85.9 8% | 86.3 8% | 78.7 -1% | 68.5 -14% | 66.3 -17% |
| sRGB Coverage (%) | 98.4 | 100 2% | 100 2% | 97.9 -1% | 90.7 -8% | 86.6 -12% |
| AdobeRGB 1998 Coverage (%) | 79.7 | 99.1 24% | 99.4 25% | 79.2 -1% | 66.3 -17% | 63.3 -21% |
| Response Times | 22% | -10% | -1% | 20% | 7% | |
| Response Time Grey 50% / Grey 80% * (ms) | 52.4 ? | 44 ? 16% | 61.6 ? -18% | 48.4 ? 8% | 38 ? 27% | 39.2 ? 25% |
| Response Time Black / White * (ms) | 31.6 ? | 22.8 ? 28% | 32 ? -1% | 34.8 ? -10% | 27.6 ? 13% | 35.2 ? -11% |
| PWM Frequency (Hz) | 1000 ? | 1000 ? | 943 ? | 21190 ? | ||
| Screen | 6% | 20% | 21% | -6% | 2% | |
| Brightness middle (cd/m²) | 451.9 | 357.6 -21% | 396 -12% | 488 8% | 329.3 -27% | 273.6 -39% |
| Brightness (cd/m²) | 414 | 350 -15% | 380 -8% | 440 6% | 316 -24% | 262 -37% |
| Brightness Distribution (%) | 81 | 85 5% | 90 11% | 81 0% | 84 4% | 86 6% |
| Black Level * (cd/m²) | 0.36 | 0.35 3% | 0.28 22% | 0.3 17% | 0.31 14% | 0.3 17% |
| Contrast (:1) | 1255 | 1022 -19% | 1414 13% | 1627 30% | 1062 -15% | 912 -27% |
| Colorchecker dE 2000 * | 5.62 | 4.12 27% | 4 29% | 3.16 44% | 4.78 15% | 3.22 43% |
| Colorchecker dE 2000 max. * | 19.1 | 9.91 48% | 7.6 60% | 8.8 54% | 11.75 38% | 7.61 60% |
| Colorchecker dE 2000 calibrated * | 2.69 | 4.23 -57% | 0.9 67% | 3.51 -30% | 4.1 -52% | |
| Greyscale dE 2000 * | 6.9 | 1.8 74% | 6.1 12% | 3.3 52% | 7.9 -14% | 1.4 80% |
| Gamma | 2.2 100% | 2.17 101% | 2.25 98% | 2.178 101% | 2.24 98% | 2.24 98% |
| CCT | 6254 104% | 6613 98% | 7786 83% | 6811 95% | 8323 78% | 6636 98% |
| Color Space (Percent of AdobeRGB 1998) (%) | 71.8 | 87.5 22% | 88.5 23% | 71.7 0% | 58.8 -18% | 56.4 -21% |
| Color Space (Percent of sRGB) (%) | 98.5 | 100 2% | 100 2% | 97.9 -1% | 90.4 -8% | 86.2 -12% |
| Média Total (Programa/Configurações) | 13% /
9% | 7% /
15% | 6% /
14% | 0% /
-4% | -3% /
-1% |
* ... menor é melhor
Exibir tempos de resposta
| ↔ Tempo de resposta preto para branco | ||
|---|---|---|
| 31.6 ms ... ascensão ↗ e queda ↘ combinadas | ↗ 18 ms ascensão | 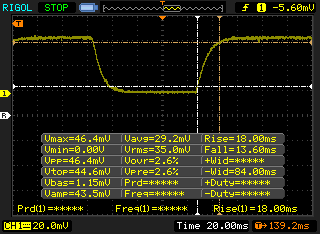 |
| ↘ 13.6 ms queda | ||
| A tela mostra taxas de resposta lentas em nossos testes e será insatisfatória para os jogadores. Em comparação, todos os dispositivos testados variam de 0.1 (mínimo) a 240 (máximo) ms. » 85 % de todos os dispositivos são melhores. Isso significa que o tempo de resposta medido é pior que a média de todos os dispositivos testados (19.8 ms). | ||
| ↔ Tempo de resposta 50% cinza a 80% cinza | ||
| 52.4 ms ... ascensão ↗ e queda ↘ combinadas | ↗ 27.6 ms ascensão | 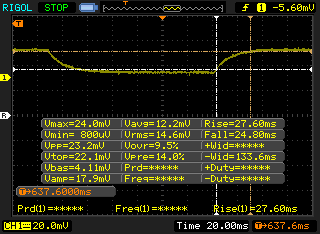 |
| ↘ 24.8 ms queda | ||
| A tela mostra taxas de resposta lentas em nossos testes e será insatisfatória para os jogadores. Em comparação, todos os dispositivos testados variam de 0.165 (mínimo) a 636 (máximo) ms. » 89 % de todos os dispositivos são melhores. Isso significa que o tempo de resposta medido é pior que a média de todos os dispositivos testados (30.9 ms). | ||
Cintilação da tela / PWM (modulação por largura de pulso)
| Tela tremeluzindo/PWM detectado | 1000 Hz | ≤ 25 % configuração de brilho | 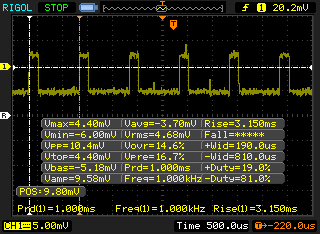 |
A luz de fundo da tela pisca em 1000 Hz (pior caso, por exemplo, utilizando PWM) Cintilação detectada em uma configuração de brilho de 25 % e abaixo. Não deve haver cintilação ou PWM acima desta configuração de brilho. A frequência de 1000 Hz é bastante alta, então a maioria dos usuários sensíveis ao PWM não deve notar nenhuma oscilação. [pwm_comparison] Em comparação: 52 % de todos os dispositivos testados não usam PWM para escurecer a tela. Se PWM foi detectado, uma média de 7748 (mínimo: 5 - máximo: 343500) Hz foi medida. | |||
| Cinebench R11.5 | |
| CPU Single 64Bit | |
| MSI GT75 8RG-090 Titan | |
| Média Intel Core i9-8950HK (2.1 - 2.34, n=7) | |
| Eurocom Sky X4C | |
| Dell XPS 15 9575 i7-8705G | |
| AMD Radeon RX Vega 64 | |
| Dell XPS 13 9370 i7 UHD | |
| Dell XPS 15 9560 (i7-7700HQ, UHD) | |
| CPU Multi 64Bit | |
| AMD Radeon RX Vega 64 | |
| MSI GT75 8RG-090 Titan | |
| Eurocom Sky X4C | |
| Média Intel Core i9-8950HK (12 - 15.1, n=7) | |
| Dell XPS 15 9560 (i7-7700HQ, UHD) | |
| Dell XPS 15 9575 i7-8705G | |
| Dell XPS 13 9370 i7 UHD | |
| Cinebench R10 | |
| Rendering Multiple CPUs 32Bit | |
| Eurocom Sky X4C | |
| Média Intel Core i9-8950HK (32438 - 39380, n=5) | |
| AMD Radeon RX Vega 64 | |
| Dell XPS 15 9575 i7-8705G | |
| Dell XPS 15 9560 (i7-7700HQ, UHD) | |
| Dell XPS 13 9370 i7 UHD | |
| Rendering Single 32Bit | |
| Média Intel Core i9-8950HK (6978 - 7735, n=5) | |
| Eurocom Sky X4C | |
| Dell XPS 15 9575 i7-8705G | |
| Dell XPS 13 9370 i7 UHD | |
| Dell XPS 15 9560 (i7-7700HQ, UHD) | |
| AMD Radeon RX Vega 64 | |
| wPrime 2.10 - 1024m | |
| Dell XPS 13 9370 i7 UHD | |
| Média Intel Core i9-8950HK (n=1) | |
| Dell XPS 15 9560 (i7-7700HQ, UHD) | |
| Dell XPS 15 9575 i7-8705G | |
| Eurocom Sky X4C | |
| AMD Radeon RX Vega 64 | |
* ... menor é melhor
| PCMark 8 Home Score Accelerated v2 | 3840 pontos | |
| PCMark 8 Work Score Accelerated v2 | 4620 pontos | |
| PCMark 10 Score | 5059 pontos | |
Ajuda | ||
| Dell XPS 15 9570 Core i9 UHD Samsung SSD PM981 MZVLB1T0HALR | Asus ZenBook Pro 15 UX580GE Samsung SSD PM961 1TB M.2 PCIe 3.0 x4 NVMe (MZVLW1T0) | Lenovo ThinkPad X1 Extreme-20MF000XGE Samsung SSD PM981 MZVLB1T0HALR | Dell XPS 15 9575 i7-8705G SK hynix PC401 NVMe 500 GB | HP Spectre x360 15-ch011nr SK hynix PC401 NVMe 500 GB | Razer Blade 15 Base Model Samsung SSD PM981 MZVLB256HAHQ | |
|---|---|---|---|---|---|---|
| AS SSD | -1% | 40% | -19% | -22% | -17% | |
| Seq Read (MB/s) | 1320 | 2099 59% | 2703 105% | 2302 74% | 1739 32% | 1803 37% |
| Seq Write (MB/s) | 1500 | 1729 15% | 2336 56% | 752 -50% | 1189 -21% | 1367 -9% |
| 4K Read (MB/s) | 30.73 | 37.78 23% | 56.8 85% | 41.38 35% | 38.76 26% | 40.75 33% |
| 4K Write (MB/s) | 94.4 | 100.9 7% | 130.9 39% | 94.3 0% | 93.2 -1% | 93 -1% |
| 4K-64 Read (MB/s) | 1453 | 1431 -2% | 1805 24% | 649 -55% | 646 -56% | 749 -48% |
| 4K-64 Write (MB/s) | 1815 | 1273 -30% | 1782 -2% | 637 -65% | 545 -70% | 1270 -30% |
| Access Time Read * (ms) | 0.061 | 0.04 34% | 0.034 44% | 0.044 28% | 0.054 11% | 0.113 -85% |
| Access Time Write * (ms) | 0.044 | 0.036 18% | 0.028 36% | 0.051 -16% | 0.051 -16% | 0.04 9% |
| Score Read (Points) | 1616 | 1679 4% | 2132 32% | 921 -43% | 859 -47% | 970 -40% |
| Score Write (Points) | 2059 | 1547 -25% | 2147 4% | 807 -61% | 757 -63% | 1499 -27% |
| Score Total (Points) | 4507 | 4065 -10% | 5355 19% | 2132 -53% | 2037 -55% | 2952 -35% |
| Copy ISO MB/s (MB/s) | 2577 | 1045 -59% | 1523 -41% | 1668 -35% | 1892 -27% | |
| Copy Program MB/s (MB/s) | 515 | 430.9 -16% | 487.9 -5% | 486.8 -5% | 495.5 -4% | |
| Copy Game MB/s (MB/s) | 1120 | 728 -35% | 944 -16% | 1042 -7% | 1070 -4% |
* ... menor é melhor

| 3DMark 11 Performance | 9373 pontos | |
| 3DMark Cloud Gate Standard Score | 24948 pontos | |
| 3DMark Fire Strike Score | 6688 pontos | |
Ajuda | ||
| baixo | média | alto | ultra | |
|---|---|---|---|---|
| BioShock Infinite (2013) | 298.2 | 208.7 | 181.3 | 71.8 |
| The Witcher 3 (2015) | 122 | 73.2 | 42.6 | 23.5 |
| Rise of the Tomb Raider (2016) | 141.1 | 82.9 | 47.7 | 39.5 |
Barulho
| Ocioso |
| 28.5 / 28.6 / 28.8 dB |
| Carga |
| 36.2 / 47.6 dB |
 | ||
30 dB silencioso 40 dB(A) audível 50 dB(A) ruidosamente alto |
||
min: | ||
| Dell XPS 15 9570 Core i9 UHD GeForce GTX 1050 Ti Max-Q, i9-8950HK, Samsung SSD PM981 MZVLB1T0HALR | Dell XPS 15 9570 i7 UHD GeForce GTX 1050 Ti Max-Q, i7-8750H, Toshiba XG5 KXG50ZNV512G | Razer Blade 15 Base Model GeForce GTX 1060 Max-Q, i7-8750H, Samsung SSD PM981 MZVLB256HAHQ | Dell XPS 15 9575 i7-8705G Vega M GL / 870, i7-8705G, SK hynix PC401 NVMe 500 GB | Asus ZenBook Pro 15 UX580GE GeForce GTX 1050 Ti Mobile, i9-8950HK, Samsung SSD PM961 1TB M.2 PCIe 3.0 x4 NVMe (MZVLW1T0) | |
|---|---|---|---|---|---|
| Noise | 1% | -8% | 4% | -2% | |
| desligado / ambiente * (dB) | 28.2 | 29.9 -6% | 27.8 1% | 28.2 -0% | 28 1% |
| Idle Minimum * (dB) | 28.5 | 29.9 -5% | 31 -9% | 28.2 1% | 28.6 -0% |
| Idle Average * (dB) | 28.6 | 29.9 -5% | 31.2 -9% | 28.2 1% | 29.9 -5% |
| Idle Maximum * (dB) | 28.8 | 30.3 -5% | 31.3 -9% | 28.2 2% | 30.5 -6% |
| Load Average * (dB) | 36.2 | 36.5 -1% | 47.2 -30% | 29 20% | 42.5 -17% |
| Witcher 3 ultra * (dB) | 47.6 | 40.4 15% | 51.3 -8% | 44.7 6% | 44.8 6% |
| Load Maximum * (dB) | 47.6 | 40.4 15% | 44.3 7% | 47.4 -0% | 44.8 6% |
* ... menor é melhor
(-) A temperatura máxima no lado superior é 53.6 °C / 128 F, em comparação com a média de 36.8 °C / 98 F , variando de 21 a 71 °C para a classe Multimedia.
(-) A parte inferior aquece até um máximo de 49 °C / 120 F, em comparação com a média de 39.1 °C / 102 F
(+) Em uso inativo, a temperatura média para o lado superior é 27.1 °C / 81 F, em comparação com a média do dispositivo de 31.3 °C / ### class_avg_f### F.
(±) Jogando The Witcher 3, a temperatura média para o lado superior é 35.4 °C / 96 F, em comparação com a média do dispositivo de 31.3 °C / ## #class_avg_f### F.
(+) Os apoios para as mãos e o touchpad são mais frios que a temperatura da pele, com um máximo de 28.2 °C / 82.8 F e, portanto, são frios ao toque.
(±) A temperatura média da área do apoio para as mãos de dispositivos semelhantes foi 28.7 °C / 83.7 F (+0.5 °C / 0.9 F).
Dell XPS 15 9570 Core i9 UHD análise de áudio
(±) | o volume do alto-falante é médio, mas bom (###valor### dB)
Graves 100 - 315Hz
(-) | quase nenhum baixo - em média 17.9% menor que a mediana
(±) | a linearidade dos graves é média (8.4% delta para a frequência anterior)
Médios 400 - 2.000 Hz
(±) | médios mais altos - em média 7.2% maior que a mediana
(±) | a linearidade dos médios é média (12.1% delta para frequência anterior)
Altos 2 - 16 kHz
(+) | agudos equilibrados - apenas 4.6% longe da mediana
(±) | a linearidade dos máximos é média (9.8% delta para frequência anterior)
Geral 100 - 16.000 Hz
(±) | a linearidade do som geral é média (20.9% diferença em relação à mediana)
Comparado com a mesma classe
» 71% de todos os dispositivos testados nesta classe foram melhores, 8% semelhantes, 21% piores
» O melhor teve um delta de 5%, a média foi 17%, o pior foi 45%
Comparado com todos os dispositivos testados
» 57% de todos os dispositivos testados foram melhores, 8% semelhantes, 35% piores
» O melhor teve um delta de 4%, a média foi 23%, o pior foi 134%
Apple MacBook 12 (Early 2016) 1.1 GHz análise de áudio
(+) | os alto-falantes podem tocar relativamente alto (###valor### dB)
Graves 100 - 315Hz
(±) | graves reduzidos - em média 11.3% menor que a mediana
(±) | a linearidade dos graves é média (14.2% delta para a frequência anterior)
Médios 400 - 2.000 Hz
(+) | médios equilibrados - apenas 2.4% longe da mediana
(+) | médios são lineares (5.5% delta para frequência anterior)
Altos 2 - 16 kHz
(+) | agudos equilibrados - apenas 2% longe da mediana
(+) | os máximos são lineares (4.5% delta da frequência anterior)
Geral 100 - 16.000 Hz
(+) | o som geral é linear (10.2% diferença em relação à mediana)
Comparado com a mesma classe
» 7% de todos os dispositivos testados nesta classe foram melhores, 2% semelhantes, 90% piores
» O melhor teve um delta de 5%, a média foi 18%, o pior foi 53%
Comparado com todos os dispositivos testados
» 5% de todos os dispositivos testados foram melhores, 1% semelhantes, 94% piores
» O melhor teve um delta de 4%, a média foi 23%, o pior foi 134%
| desligado | |
| Ocioso | |
| Carga |
|
Key:
min: | |
| Dell XPS 15 9570 Core i9 UHD i9-8950HK, GeForce GTX 1050 Ti Max-Q, Samsung SSD PM981 MZVLB1T0HALR, IPS, 3840x2160, 15.6" | Dell XPS 15 9570 i7 UHD i7-8750H, GeForce GTX 1050 Ti Max-Q, Toshiba XG5 KXG50ZNV512G, IPS, 3840x2160, 15.6" | Asus ZenBook Pro 15 UX580GE i9-8950HK, GeForce GTX 1050 Ti Mobile, Samsung SSD PM961 1TB M.2 PCIe 3.0 x4 NVMe (MZVLW1T0), IPS, 3840x2160, 15.6" | Lenovo ThinkPad X1 Extreme-20MF000XGE i7-8750H, GeForce GTX 1050 Ti Max-Q, Samsung SSD PM981 MZVLB1T0HALR, IPS, 3840x2160, 15.6" | Dell XPS 15 9575 i7-8705G i7-8705G, Vega M GL / 870, SK hynix PC401 NVMe 500 GB, IPS, 3840x2160, 15.6" | Razer Blade 15 Base Model i7-8750H, GeForce GTX 1060 Max-Q, Samsung SSD PM981 MZVLB256HAHQ, IPS, 1920x1080, 15.6" | |
|---|---|---|---|---|---|---|
| Power Consumption | -12% | -24% | 0% | 15% | -12% | |
| Idle Minimum * (Watt) | 7.1 | 9.48 -34% | 11.7 -65% | 7.6 -7% | 6.2 13% | 10.2 -44% |
| Idle Average * (Watt) | 13.6 | 16.1 -18% | 18.5 -36% | 14.8 -9% | 12.9 5% | 13.2 3% |
| Idle Maximum * (Watt) | 14.1 | 16.9 -20% | 22.8 -62% | 17.6 -25% | 13.6 4% | 17.6 -25% |
| Load Average * (Watt) | 103.9 | 90.8 13% | 97.5 6% | 86 17% | 76.1 27% | 99.5 4% |
| Witcher 3 ultra * (Watt) | 103 | 102.9 -0% | 85 17% | 84.3 18% | 113.6 -10% | |
| Load Maximum * (Watt) | 130.9 | 134.4 -3% | 111.1 15% | 118.9 9% | 99.4 24% | 133.3 -2% |
* ... menor é melhor
| Dell XPS 15 9570 Core i9 UHD i9-8950HK, GeForce GTX 1050 Ti Max-Q, 97 Wh | Dell XPS 15 9570 i7 UHD i7-8750H, GeForce GTX 1050 Ti Max-Q, 97 Wh | Asus ZenBook Pro 15 UX580GE i9-8950HK, GeForce GTX 1050 Ti Mobile, 71 Wh | Lenovo ThinkPad X1 Extreme-20MF000XGE i7-8750H, GeForce GTX 1050 Ti Max-Q, 80 Wh | Dell XPS 15 9575 i7-8705G i7-8705G, Vega M GL / 870, 75 Wh | HP Spectre x360 15-ch011nr i5-8550U, GeForce MX150, 84 Wh | Razer Blade 15 Base Model i7-8750H, GeForce GTX 1060 Max-Q, 65 Wh | |
|---|---|---|---|---|---|---|---|
| Duração da bateria | 21% | -1% | 17% | -11% | 51% | -3% | |
| Reader / Idle (h) | 15 | 14 -7% | 11.5 -23% | 11.2 -25% | 15.5 3% | 11.5 -23% | |
| WiFi v1.3 (h) | 8.6 | 9.6 12% | 6.3 -27% | 6.4 -26% | 7 -19% | 10.4 21% | 5.5 -36% |
| Load (h) | 1 | 1.3 30% | 1.3 30% | 2 100% | 1.1 10% | 2.3 130% | 1.5 50% |
| Witcher 3 ultra (h) | 1 | 1.1 |
Pro
Contra
Há uma razão pela qual o mesmo Core i9-8950HK funciona muito mais rápido no grosso e pesado MSI GT75. Para tirar o máximo proveito da CPU Core i9, a solução de resfriamento deve ser capaz de manter velocidades Turbo Boost mais rápidas a temperaturas razoáveis.
Para o nosso XPS 15 i9, este parece ser o caso clássico de colocar um processador Core i9 muito potente em um chassi mais apropriado para um Core i7. Já vimos isto antes, no ZenBook UX580 i9 e no Eurocom Q8 i9 e o XPS 15 i9 não é diferente. O i9-8950HK é totalmente capaz de rodar 25% mais rápido do que o i7-8750H, mas os proprietários do XPS 15 i9 perceberão um aumento de apenas 10% na melhor das hipóteses, comparado a 50% entre o i5 XPS 15 e i7 XPS 15.
Até o momento, o SKU XPS 15 i9 é $250 USD mais caro do que o XPS 15 i7. Recomendamos que chegue ao Core i7 e, em seguida, invista em RAM, armazenamento, tela e/ou gráficos para obter um aumento de desempenho mais tangível.
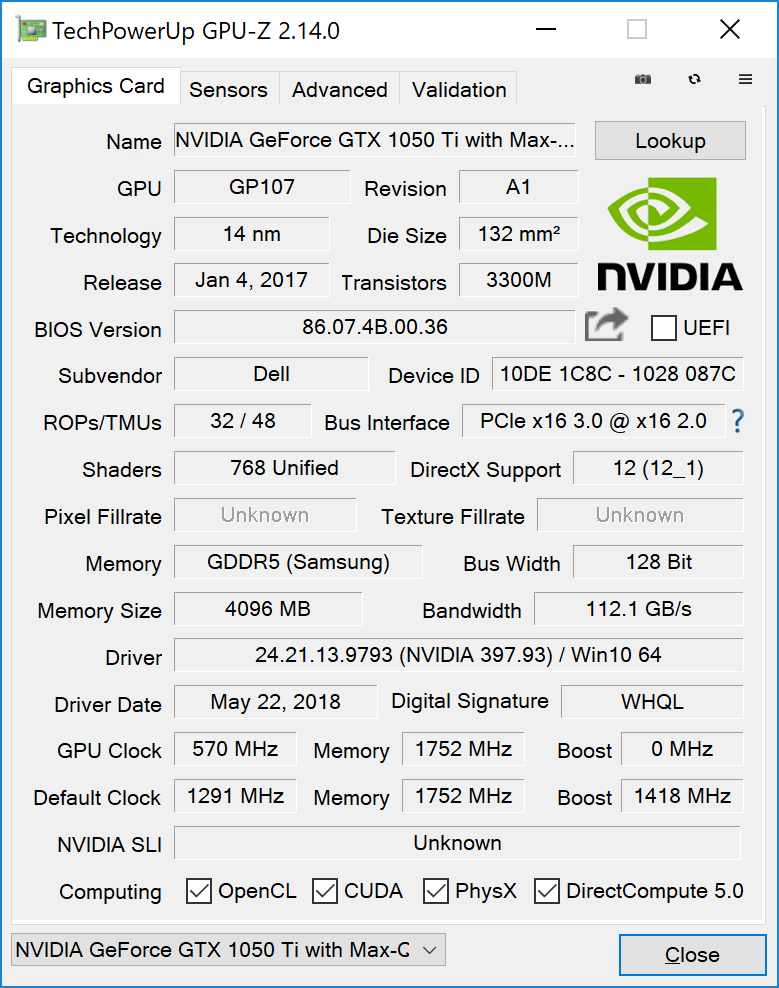
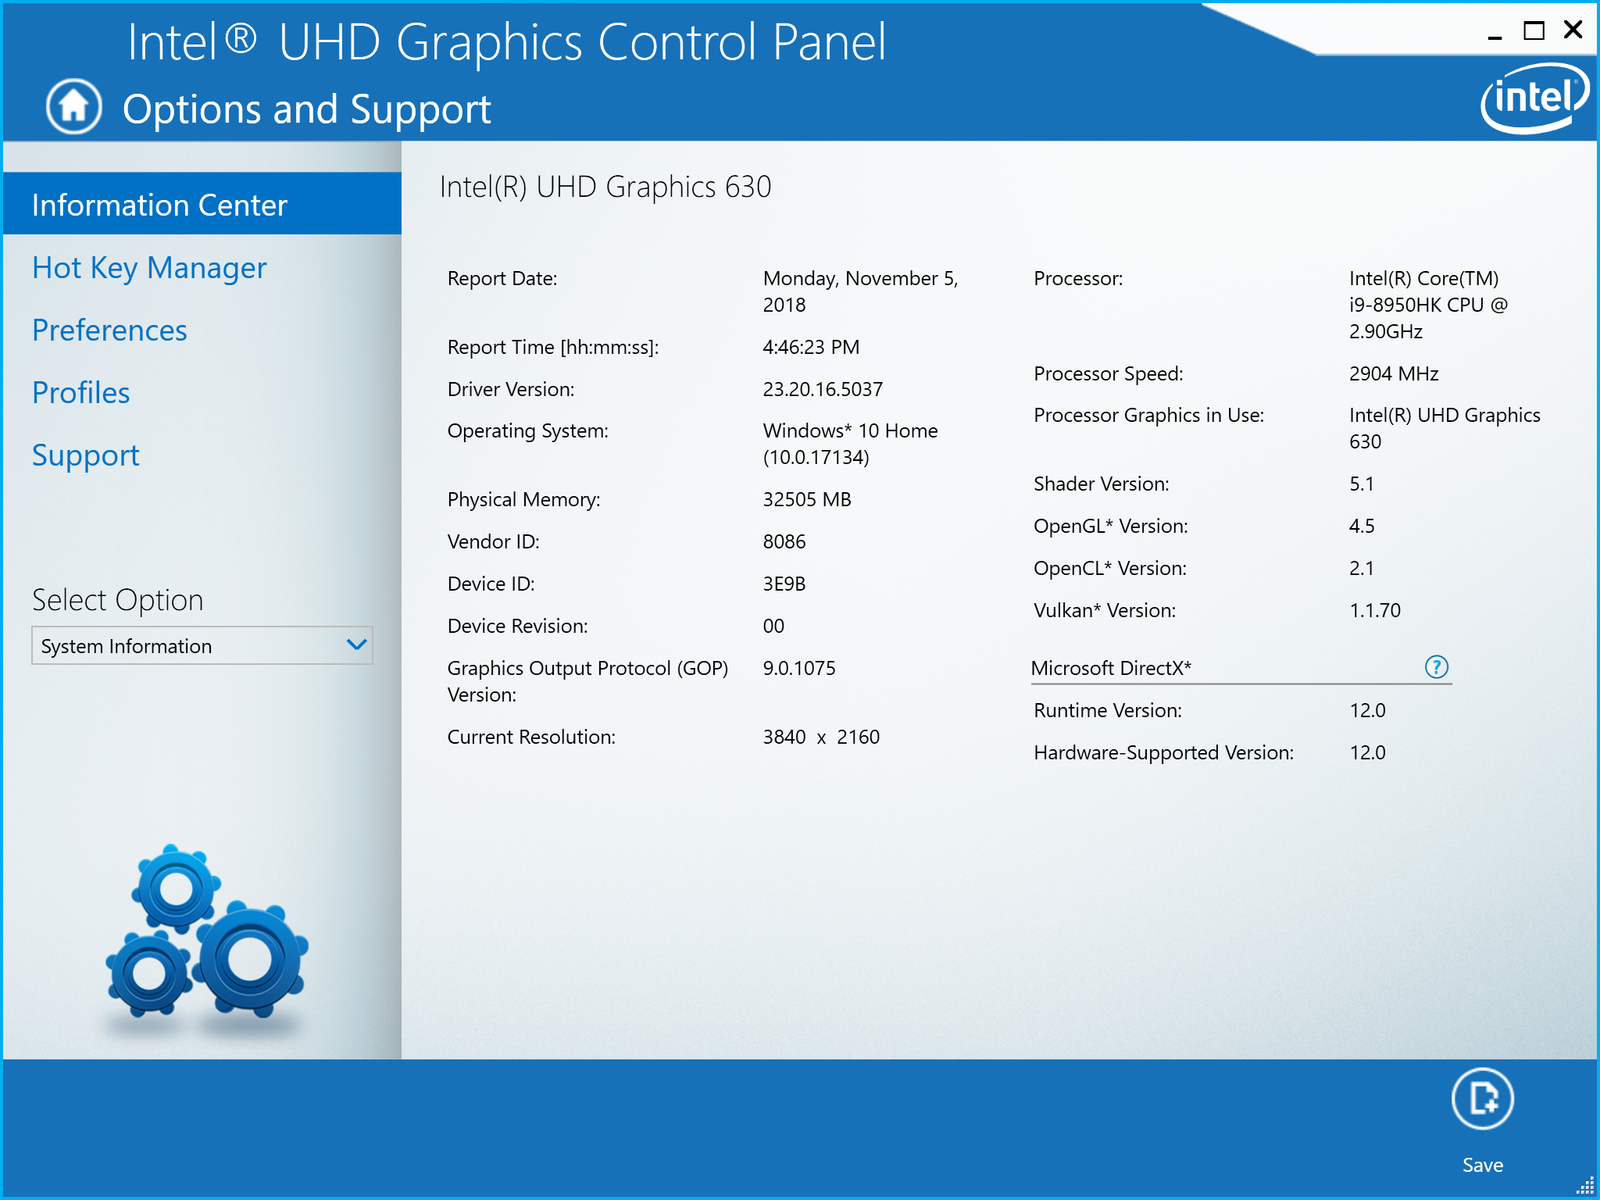
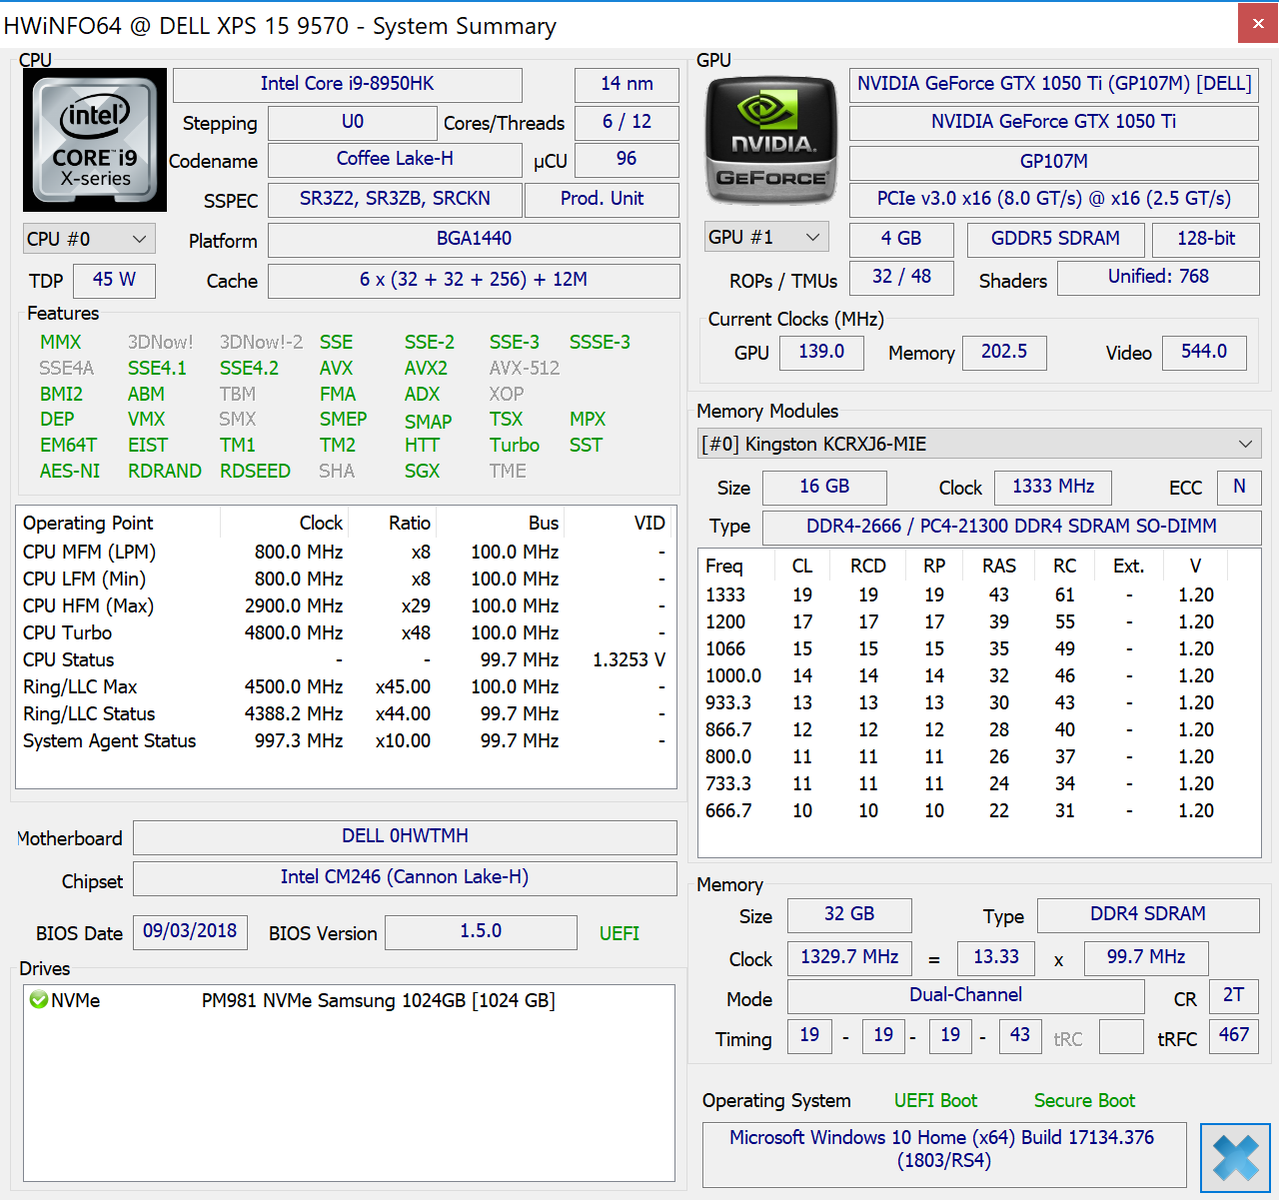
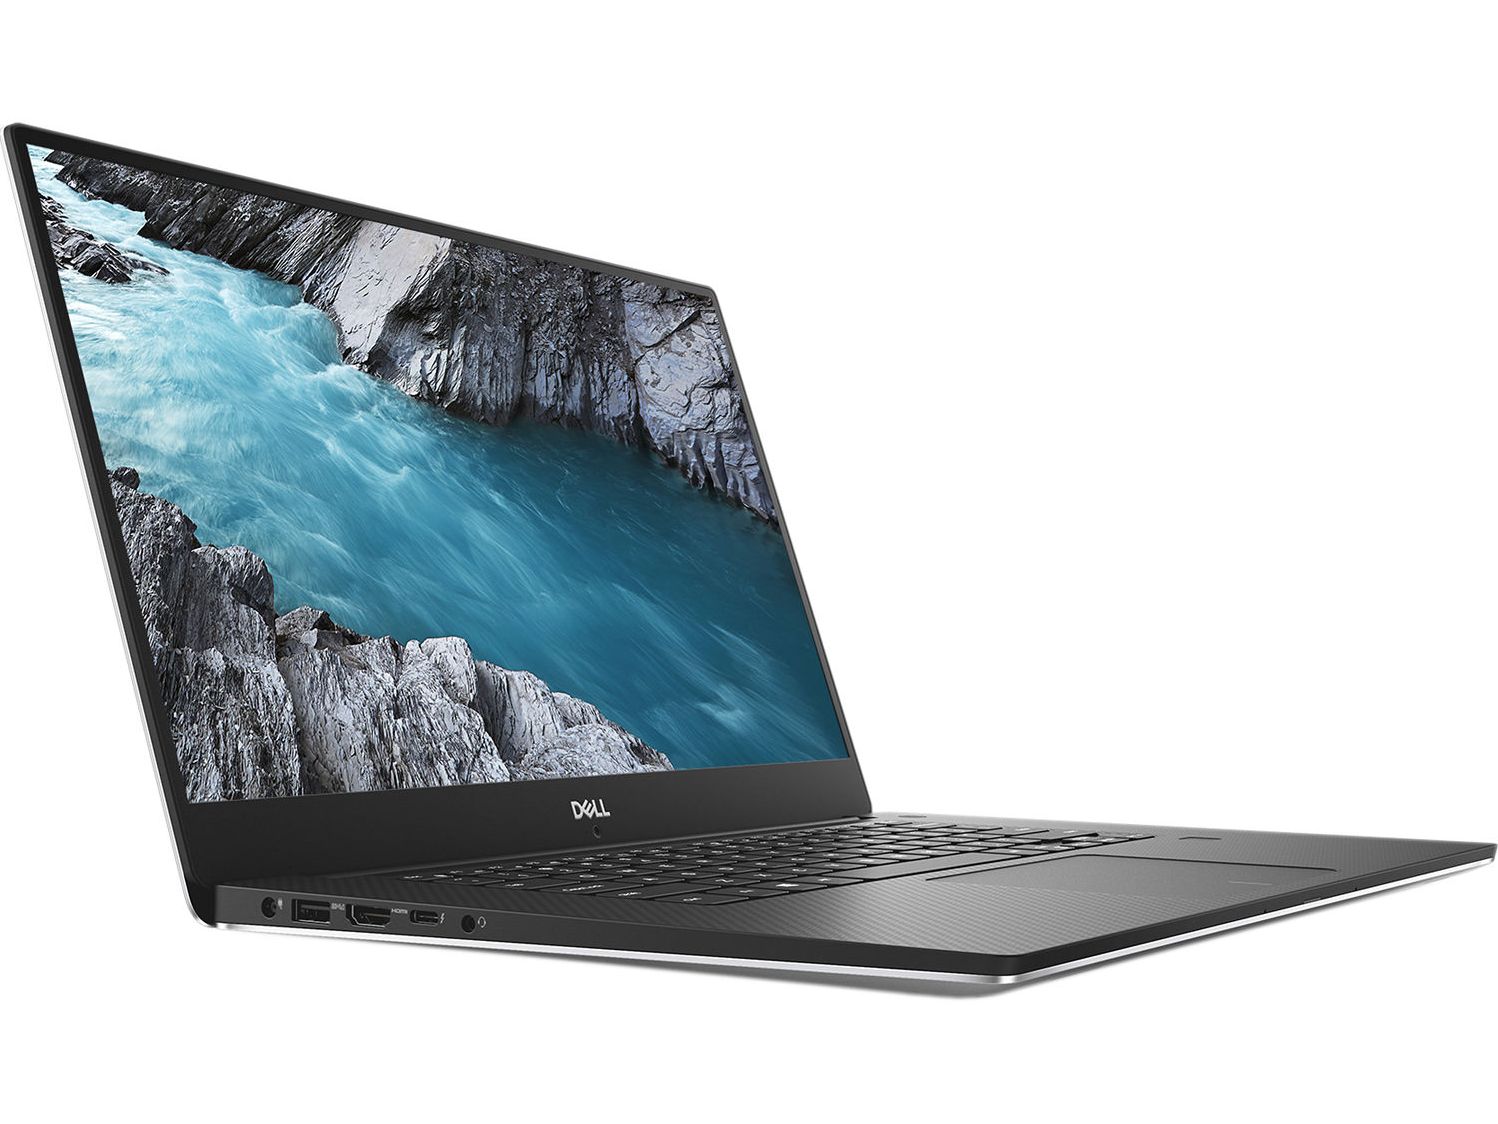
Dell XPS 15 9570 Core i9 UHD
- 11/10/2018 v6 (old)
Allen Ngo
Price comparison
