Breve Análise do Portátil HP EliteBook x360 830 G6: O conversível da HP impressiona em quase todo sentido


| |||||||||||||||||||||||||
iluminação: 69 %
iluminação com acumulador: 601 cd/m²
Contraste: 2319:1 (Preto: 0.26 cd/m²)
ΔE ColorChecker Calman: 2.2 | ∀{0.5-29.43 Ø4.71}
calibrated: 1.5
ΔE Greyscale Calman: 2.6 | ∀{0.09-98 Ø4.96}
93.6% sRGB (Argyll 1.6.3 3D)
60.2% AdobeRGB 1998 (Argyll 1.6.3 3D)
67.5% AdobeRGB 1998 (Argyll 3D)
95.3% sRGB (Argyll 3D)
66.1% Display P3 (Argyll 3D)
Gamma: 2.17
CCT: 6412 K
| HP EliteBook x360 830 G6 M133NVFC R5, , 1920x1080, 13.3" | HP EliteBook x360 1030 G3-4QZ12ES M133NVF3 R1, , 1920x1080, 13.3" | Lenovo ThinkPad X390 Yoga-20NQS05R00 LP133WF7-SPA1, , 1920x1080, 13.3" | Dell Latitude 7400 2-in-1 SHP14A2, , 1920x1080, 14" | |
|---|---|---|---|---|
| Display | -2% | 0% | 4% | |
| Display P3 Coverage (%) | 66.1 | 65.3 -1% | 65.2 -1% | 68.6 4% |
| sRGB Coverage (%) | 95.3 | 92.6 -3% | 97 2% | 99.6 5% |
| AdobeRGB 1998 Coverage (%) | 67.5 | 66.4 -2% | 67.3 0% | 70 4% |
| Response Times | 23% | -19% | -27% | |
| Response Time Grey 50% / Grey 80% * (ms) | 44 ? | 34.4 ? 22% | 59.2 ? -35% | 56 ? -27% |
| Response Time Black / White * (ms) | 30 ? | 23.2 ? 23% | 30.8 ? -3% | 38 ? -27% |
| PWM Frequency (Hz) | 952 ? | 18940 ? | 1667 ? | |
| Screen | -26% | -39% | -7% | |
| Brightness middle (cd/m²) | 603 | 668 11% | 319 -47% | 277.2 -54% |
| Brightness (cd/m²) | 692 | 685 -1% | 306 -56% | 263 -62% |
| Brightness Distribution (%) | 69 | 86 25% | 90 30% | 83 20% |
| Black Level * (cd/m²) | 0.26 | 0.52 -100% | 0.15 42% | 0.2 23% |
| Contrast (:1) | 2319 | 1285 -45% | 2127 -8% | 1386 -40% |
| Colorchecker dE 2000 * | 2.2 | 3.5 -59% | 6.1 -177% | 2.1 5% |
| Colorchecker dE 2000 max. * | 7.7 | 8.3 -8% | 9.7 -26% | 5.91 23% |
| Colorchecker dE 2000 calibrated * | 1.5 | 2.2 -47% | 1 33% | 1.03 31% |
| Greyscale dE 2000 * | 2.6 | 4.2 -62% | 8.6 -231% | 3.4 -31% |
| Gamma | 2.17 101% | 2.21 100% | 2.62 84% | 2.241 98% |
| CCT | 6412 101% | 6207 105% | 6613 98% | 6030 108% |
| Color Space (Percent of AdobeRGB 1998) (%) | 60.2 | 60.9 1% | 61.9 3% | 64 6% |
| Color Space (Percent of sRGB) (%) | 93.6 | 92.5 -1% | 96.8 3% | 100 7% |
| Média Total (Programa/Configurações) | -2% /
-15% | -19% /
-29% | -10% /
-7% |
* ... menor é melhor
Exibir tempos de resposta
| ↔ Tempo de resposta preto para branco | ||
|---|---|---|
| 30 ms ... ascensão ↗ e queda ↘ combinadas | ↗ 14 ms ascensão | 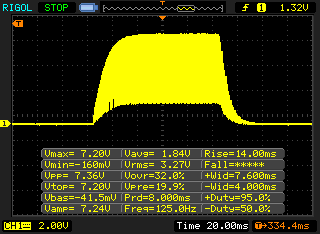 |
| ↘ 16 ms queda | ||
| A tela mostra taxas de resposta lentas em nossos testes e será insatisfatória para os jogadores. Em comparação, todos os dispositivos testados variam de 0.1 (mínimo) a 240 (máximo) ms. » 80 % de todos os dispositivos são melhores. Isso significa que o tempo de resposta medido é pior que a média de todos os dispositivos testados (19.8 ms). | ||
| ↔ Tempo de resposta 50% cinza a 80% cinza | ||
| 44 ms ... ascensão ↗ e queda ↘ combinadas | ↗ 18.8 ms ascensão | 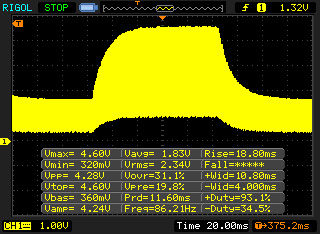 |
| ↘ 25.2 ms queda | ||
| A tela mostra taxas de resposta lentas em nossos testes e será insatisfatória para os jogadores. Em comparação, todos os dispositivos testados variam de 0.165 (mínimo) a 636 (máximo) ms. » 73 % de todos os dispositivos são melhores. Isso significa que o tempo de resposta medido é pior que a média de todos os dispositivos testados (30.9 ms). | ||
Cintilação da tela / PWM (modulação por largura de pulso)
| Tela tremeluzindo/PWM detectado | 952 Hz | ≤ 100 % configuração de brilho | 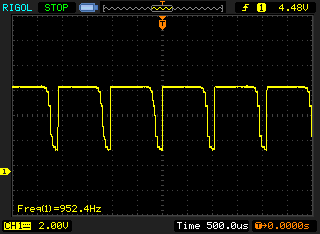 |
A luz de fundo da tela pisca em 952 Hz (pior caso, por exemplo, utilizando PWM) Cintilação detectada em uma configuração de brilho de 100 % e abaixo. Não deve haver cintilação ou PWM acima desta configuração de brilho. A frequência de 952 Hz é bastante alta, então a maioria dos usuários sensíveis ao PWM não deve notar nenhuma oscilação. [pwm_comparison] Em comparação: 52 % de todos os dispositivos testados não usam PWM para escurecer a tela. Se PWM foi detectado, uma média de 7744 (mínimo: 5 - máximo: 343500) Hz foi medida. | |||
| PCMark 8 | |
| Home Score Accelerated v2 | |
| Média da turma Convertible (n=1últimos 2 anos) | |
| HP EliteBook x360 1030 G3 45X96UT | |
| HP EliteBook x360 1030 G3-4QZ12ES | |
| Lenovo ThinkPad X390 Yoga-20NQS05R00 | |
| Dell Latitude 7400 2-in-1 | |
| Média Intel Core i7-8565U, Intel UHD Graphics 620 (2577 - 4179, n=20) | |
| HP EliteBook x360 830 G6 | |
| Work Score Accelerated v2 | |
| Média da turma Convertible (n=1últimos 2 anos) | |
| Lenovo ThinkPad X390 Yoga-20NQS05R00 | |
| HP EliteBook x360 1030 G3-4QZ12ES | |
| Média Intel Core i7-8565U, Intel UHD Graphics 620 (3596 - 5189, n=19) | |
| Dell Latitude 7400 2-in-1 | |
| HP EliteBook x360 830 G6 | |
| PCMark 8 Home Score Accelerated v2 | 3196 pontos | |
| PCMark 8 Work Score Accelerated v2 | 4421 pontos | |
| PCMark 10 Score | 3567 pontos | |
Ajuda | ||
| HP EliteBook x360 830 G6 WDC PC SN720 SDAPNTW-1T00 | HP EliteBook x360 1030 G3 45X96UT Samsung SSD PM981 MZVLB512HAJQ | Lenovo ThinkPad X390 Yoga-20NQS05R00 Intel SSD Pro 7600p SSDPEKKF512G8L | Dell Latitude 7400 2-in-1 Toshiba XG6 KXG60ZNV512G | Média WDC PC SN720 SDAPNTW-1T00 | |
|---|---|---|---|---|---|
| CrystalDiskMark 5.2 / 6 | 12% | 26% | -35% | 12% | |
| Write 4K (MB/s) | 122.8 | 120 -2% | 144.1 17% | 35.06 -71% | 130.1 ? 6% |
| Read 4K (MB/s) | 46.89 | 43.42 -7% | 63.5 35% | 23.64 -50% | 44.1 ? -6% |
| Write Seq (MB/s) | 1801 | 1814 1% | 1496 -17% | 1537 -15% | 2151 ? 19% |
| Read Seq (MB/s) | 1014 | 2227 120% | 2677 164% | 1782 76% | 1295 ? 28% |
| Write 4K Q32T1 (MB/s) | 333.7 | 391.8 17% | 357.4 7% | 100.3 -70% | 390 ? 17% |
| Read 4K Q32T1 (MB/s) | 314.4 | 288.7 -8% | 482.3 53% | 62.7 -80% | 418 ? 33% |
| Write Seq Q32T1 (MB/s) | 2784 | 1860 -33% | 1558 -44% | 2698 -3% | 2790 ? 0% |
| Read Seq Q32T1 (MB/s) | 3261 | 3376 4% | 3021 -7% | 1073 -67% | 3338 ? 2% |

| 3DMark | |
| 1280x720 Cloud Gate Standard Graphics | |
| Média da turma Convertible (7885 - 57566, n=32, últimos 2 anos) | |
| Lenovo ThinkPad X390 Yoga-20NQS05R00 | |
| Dell Latitude 7400 2-in-1 | |
| HP EliteBook x360 1030 G3-4QZ12ES | |
| HP EliteBook x360 830 G6 | |
| Média Intel UHD Graphics 620 (6205 - 16400, n=225) | |
| 1920x1080 Fire Strike Graphics | |
| Média da turma Convertible (1185 - 27447, n=48, últimos 2 anos) | |
| Lenovo ThinkPad X390 Yoga-20NQS05R00 | |
| Dell Latitude 7400 2-in-1 | |
| Média Intel UHD Graphics 620 (557 - 2608, n=213) | |
| HP EliteBook x360 830 G6 | |
| 3DMark Cloud Gate Standard Score | 8104 pontos | |
| 3DMark Fire Strike Score | 1025 pontos | |
Ajuda | ||
| baixo | média | alto | ultra | |
|---|---|---|---|---|
| BioShock Infinite (2013) | 71.7 | 37.3 | 31.3 | 9.9 |
| The Witcher 3 (2015) | 15.3 | |||
| Dota 2 Reborn (2015) | 71 | 44.8 | 18.9 | 17.2 |
| Rise of the Tomb Raider (2016) | 21.9 | |||
| X-Plane 11.11 (2018) | 25.4 | 16.4 | 14.9 |
Barulho
| Ocioso |
| 28.8 / 28.8 / 32.2 dB |
| Carga |
| 32.2 / 34.4 dB |
 | ||
30 dB silencioso 40 dB(A) audível 50 dB(A) ruidosamente alto |
||
min: | ||
(+) A temperatura máxima no lado superior é 35.1 °C / 95 F, em comparação com a média de 35.4 °C / 96 F , variando de 19.6 a 60 °C para a classe Convertible.
(±) A parte inferior aquece até um máximo de 43.3 °C / 110 F, em comparação com a média de 36.9 °C / 98 F
(+) Em uso inativo, a temperatura média para o lado superior é 24.8 °C / 77 F, em comparação com a média do dispositivo de 30.3 °C / ### class_avg_f### F.
(+) Os apoios para as mãos e o touchpad são mais frios que a temperatura da pele, com um máximo de 28 °C / 82.4 F e, portanto, são frios ao toque.
(±) A temperatura média da área do apoio para as mãos de dispositivos semelhantes foi 28 °C / 82.4 F (0 °C / 0 F).
HP EliteBook x360 830 G6 análise de áudio
(±) | o volume do alto-falante é médio, mas bom (###valor### dB)
Graves 100 - 315Hz
(-) | quase nenhum baixo - em média 16.7% menor que a mediana
(±) | a linearidade dos graves é média (11.4% delta para a frequência anterior)
Médios 400 - 2.000 Hz
(+) | médios equilibrados - apenas 4.1% longe da mediana
(+) | médios são lineares (5.8% delta para frequência anterior)
Altos 2 - 16 kHz
(+) | agudos equilibrados - apenas 2.3% longe da mediana
(+) | os máximos são lineares (4.8% delta da frequência anterior)
Geral 100 - 16.000 Hz
(±) | a linearidade do som geral é média (18.8% diferença em relação à mediana)
Comparado com a mesma classe
» 45% de todos os dispositivos testados nesta classe foram melhores, 5% semelhantes, 50% piores
» O melhor teve um delta de 6%, a média foi 20%, o pior foi 57%
Comparado com todos os dispositivos testados
» 44% de todos os dispositivos testados foram melhores, 8% semelhantes, 49% piores
» O melhor teve um delta de 4%, a média foi 23%, o pior foi 134%
Lenovo ThinkPad X390 Yoga-20NQS05R00 análise de áudio
(±) | o volume do alto-falante é médio, mas bom (###valor### dB)
Graves 100 - 315Hz
(-) | quase nenhum baixo - em média 15.8% menor que a mediana
(±) | a linearidade dos graves é média (10.6% delta para a frequência anterior)
Médios 400 - 2.000 Hz
(±) | médios mais altos - em média 6.5% maior que a mediana
(±) | a linearidade dos médios é média (10.3% delta para frequência anterior)
Altos 2 - 16 kHz
(+) | agudos equilibrados - apenas 2.8% longe da mediana
(±) | a linearidade dos máximos é média (11% delta para frequência anterior)
Geral 100 - 16.000 Hz
(±) | a linearidade do som geral é média (24% diferença em relação à mediana)
Comparado com a mesma classe
» 73% de todos os dispositivos testados nesta classe foram melhores, 5% semelhantes, 22% piores
» O melhor teve um delta de 6%, a média foi 20%, o pior foi 57%
Comparado com todos os dispositivos testados
» 72% de todos os dispositivos testados foram melhores, 6% semelhantes, 22% piores
» O melhor teve um delta de 4%, a média foi 23%, o pior foi 134%
| desligado | |
| Ocioso | |
| Carga |
|
Key:
min: | |
| HP EliteBook x360 830 G6 i7-8565U, UHD Graphics 620, WDC PC SN720 SDAPNTW-1T00, IPS LED, 1920x1080, 13.3" | HP EliteBook x360 1030 G3 45X96UT i7-8650U, UHD Graphics 620, Samsung SSD PM981 MZVLB512HAJQ, IPS, 1920x1080, 13.3" | Lenovo ThinkPad X390 Yoga-20NQS05R00 i7-8565U, UHD Graphics 620, Intel SSD Pro 7600p SSDPEKKF512G8L, IPS LED, 1920x1080, 13.3" | Dell Latitude 7400 2-in-1 i7-8665U, UHD Graphics 620, Toshiba XG6 KXG60ZNV512G, IPS, 1920x1080, 14" | |
|---|---|---|---|---|
| Power Consumption | 8% | 6% | 25% | |
| Idle Minimum * (Watt) | 4.4 | 3.4 23% | 3.46 21% | 2.6 41% |
| Idle Average * (Watt) | 8 | 7.6 5% | 5.88 26% | 4.3 46% |
| Idle Maximum * (Watt) | 10.6 | 11.5 -8% | 9.12 14% | 5.5 48% |
| Load Average * (Watt) | 34.6 | 35.4 -2% | 45.6 -32% | 32 8% |
| Load Maximum * (Watt) | 68.2 | 51.9 24% | 65.9 3% | 78.8 -16% |
* ... menor é melhor
| HP EliteBook x360 830 G6 i7-8565U, UHD Graphics 620, 53 Wh | HP EliteBook x360 1030 G3 45X96UT i7-8650U, UHD Graphics 620, 56.2 Wh | Lenovo ThinkPad X390 Yoga-20NQS05R00 i7-8565U, UHD Graphics 620, 50 Wh | Dell Latitude 7400 2-in-1 i7-8665U, UHD Graphics 620, 78 Wh | Média da turma Convertible | |
|---|---|---|---|---|---|
| Duração da bateria | 0% | -20% | 24% | 11% | |
| H.264 (h) | 10.7 | 10 -7% | 15 ? 40% | ||
| WiFi v1.3 (h) | 9.8 | 9.8 0% | 8.2 -16% | 12.2 24% | 12 ? 22% |
| Load (h) | 2.4 | 1.5 -37% | 1.713 ? -29% |
Pro
Contra
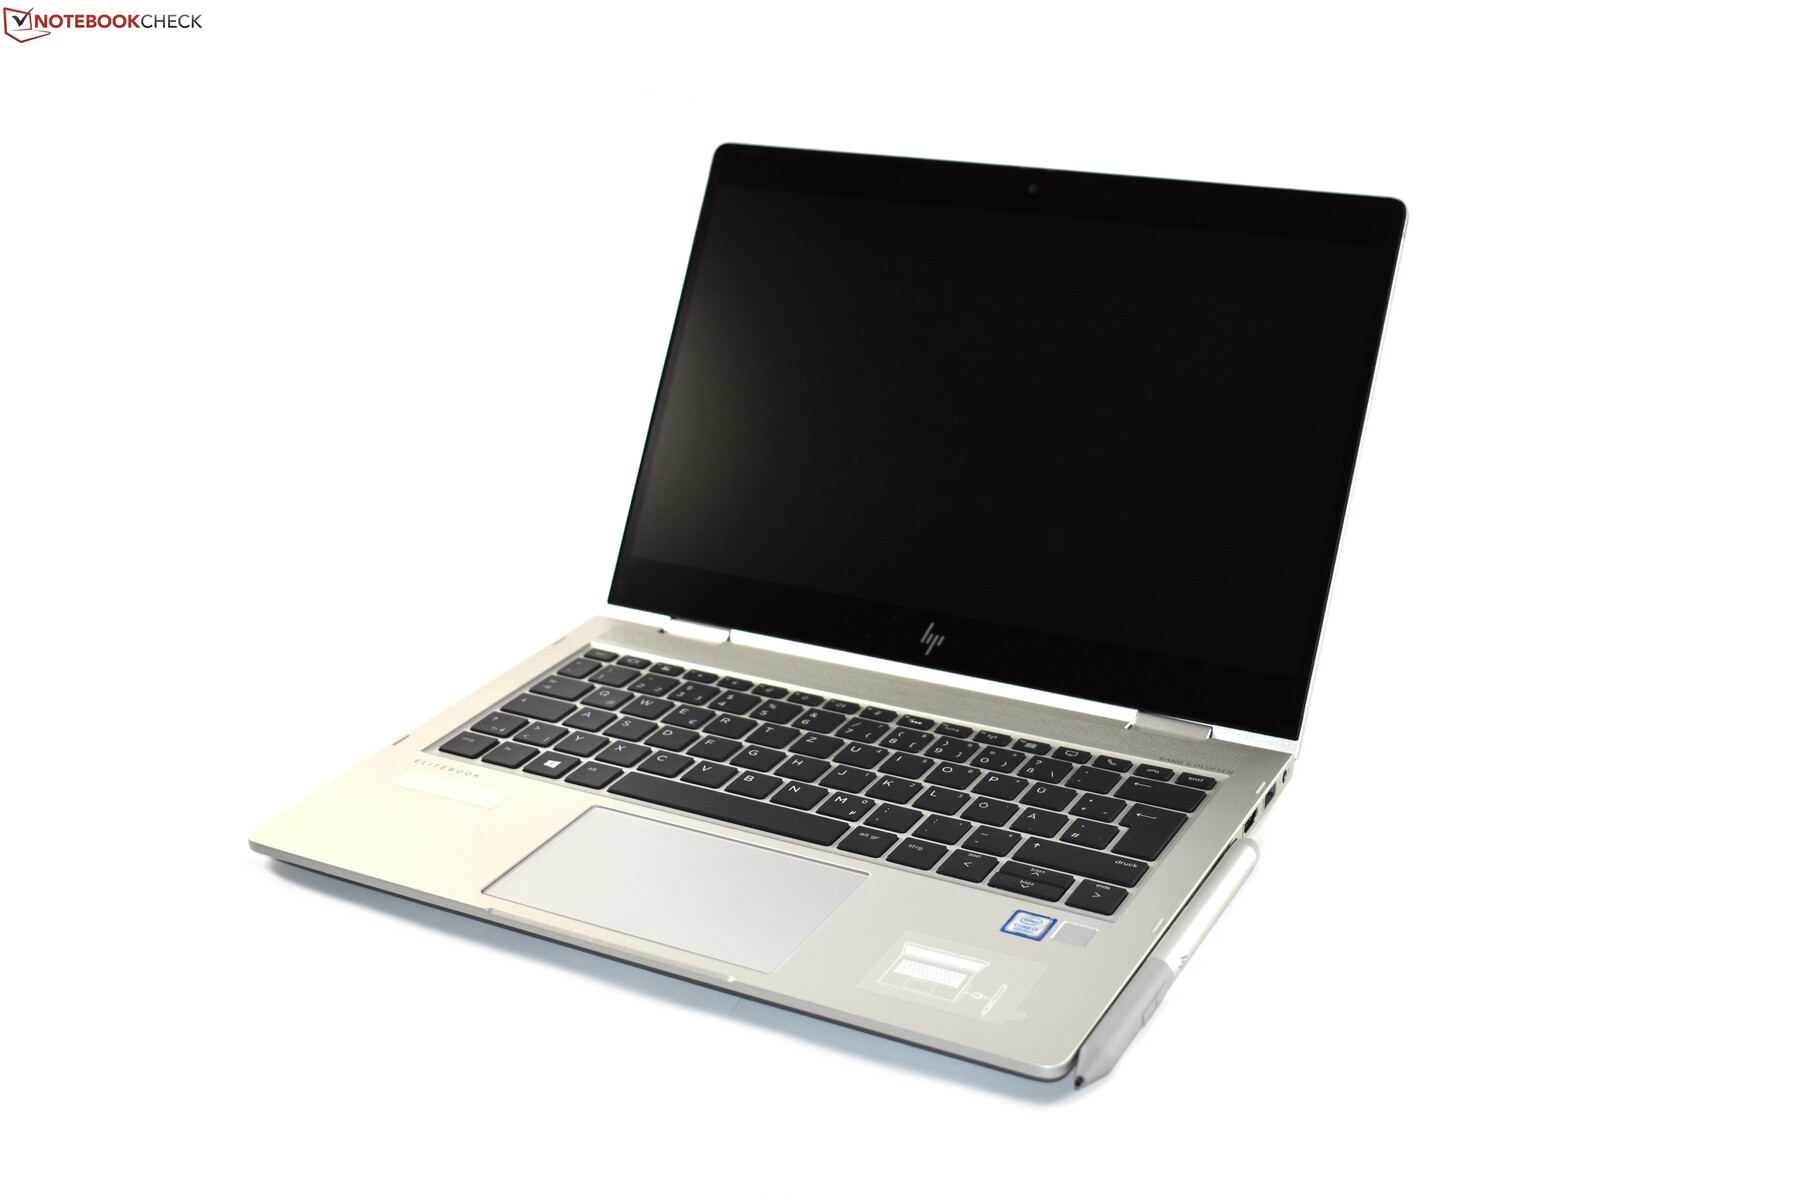
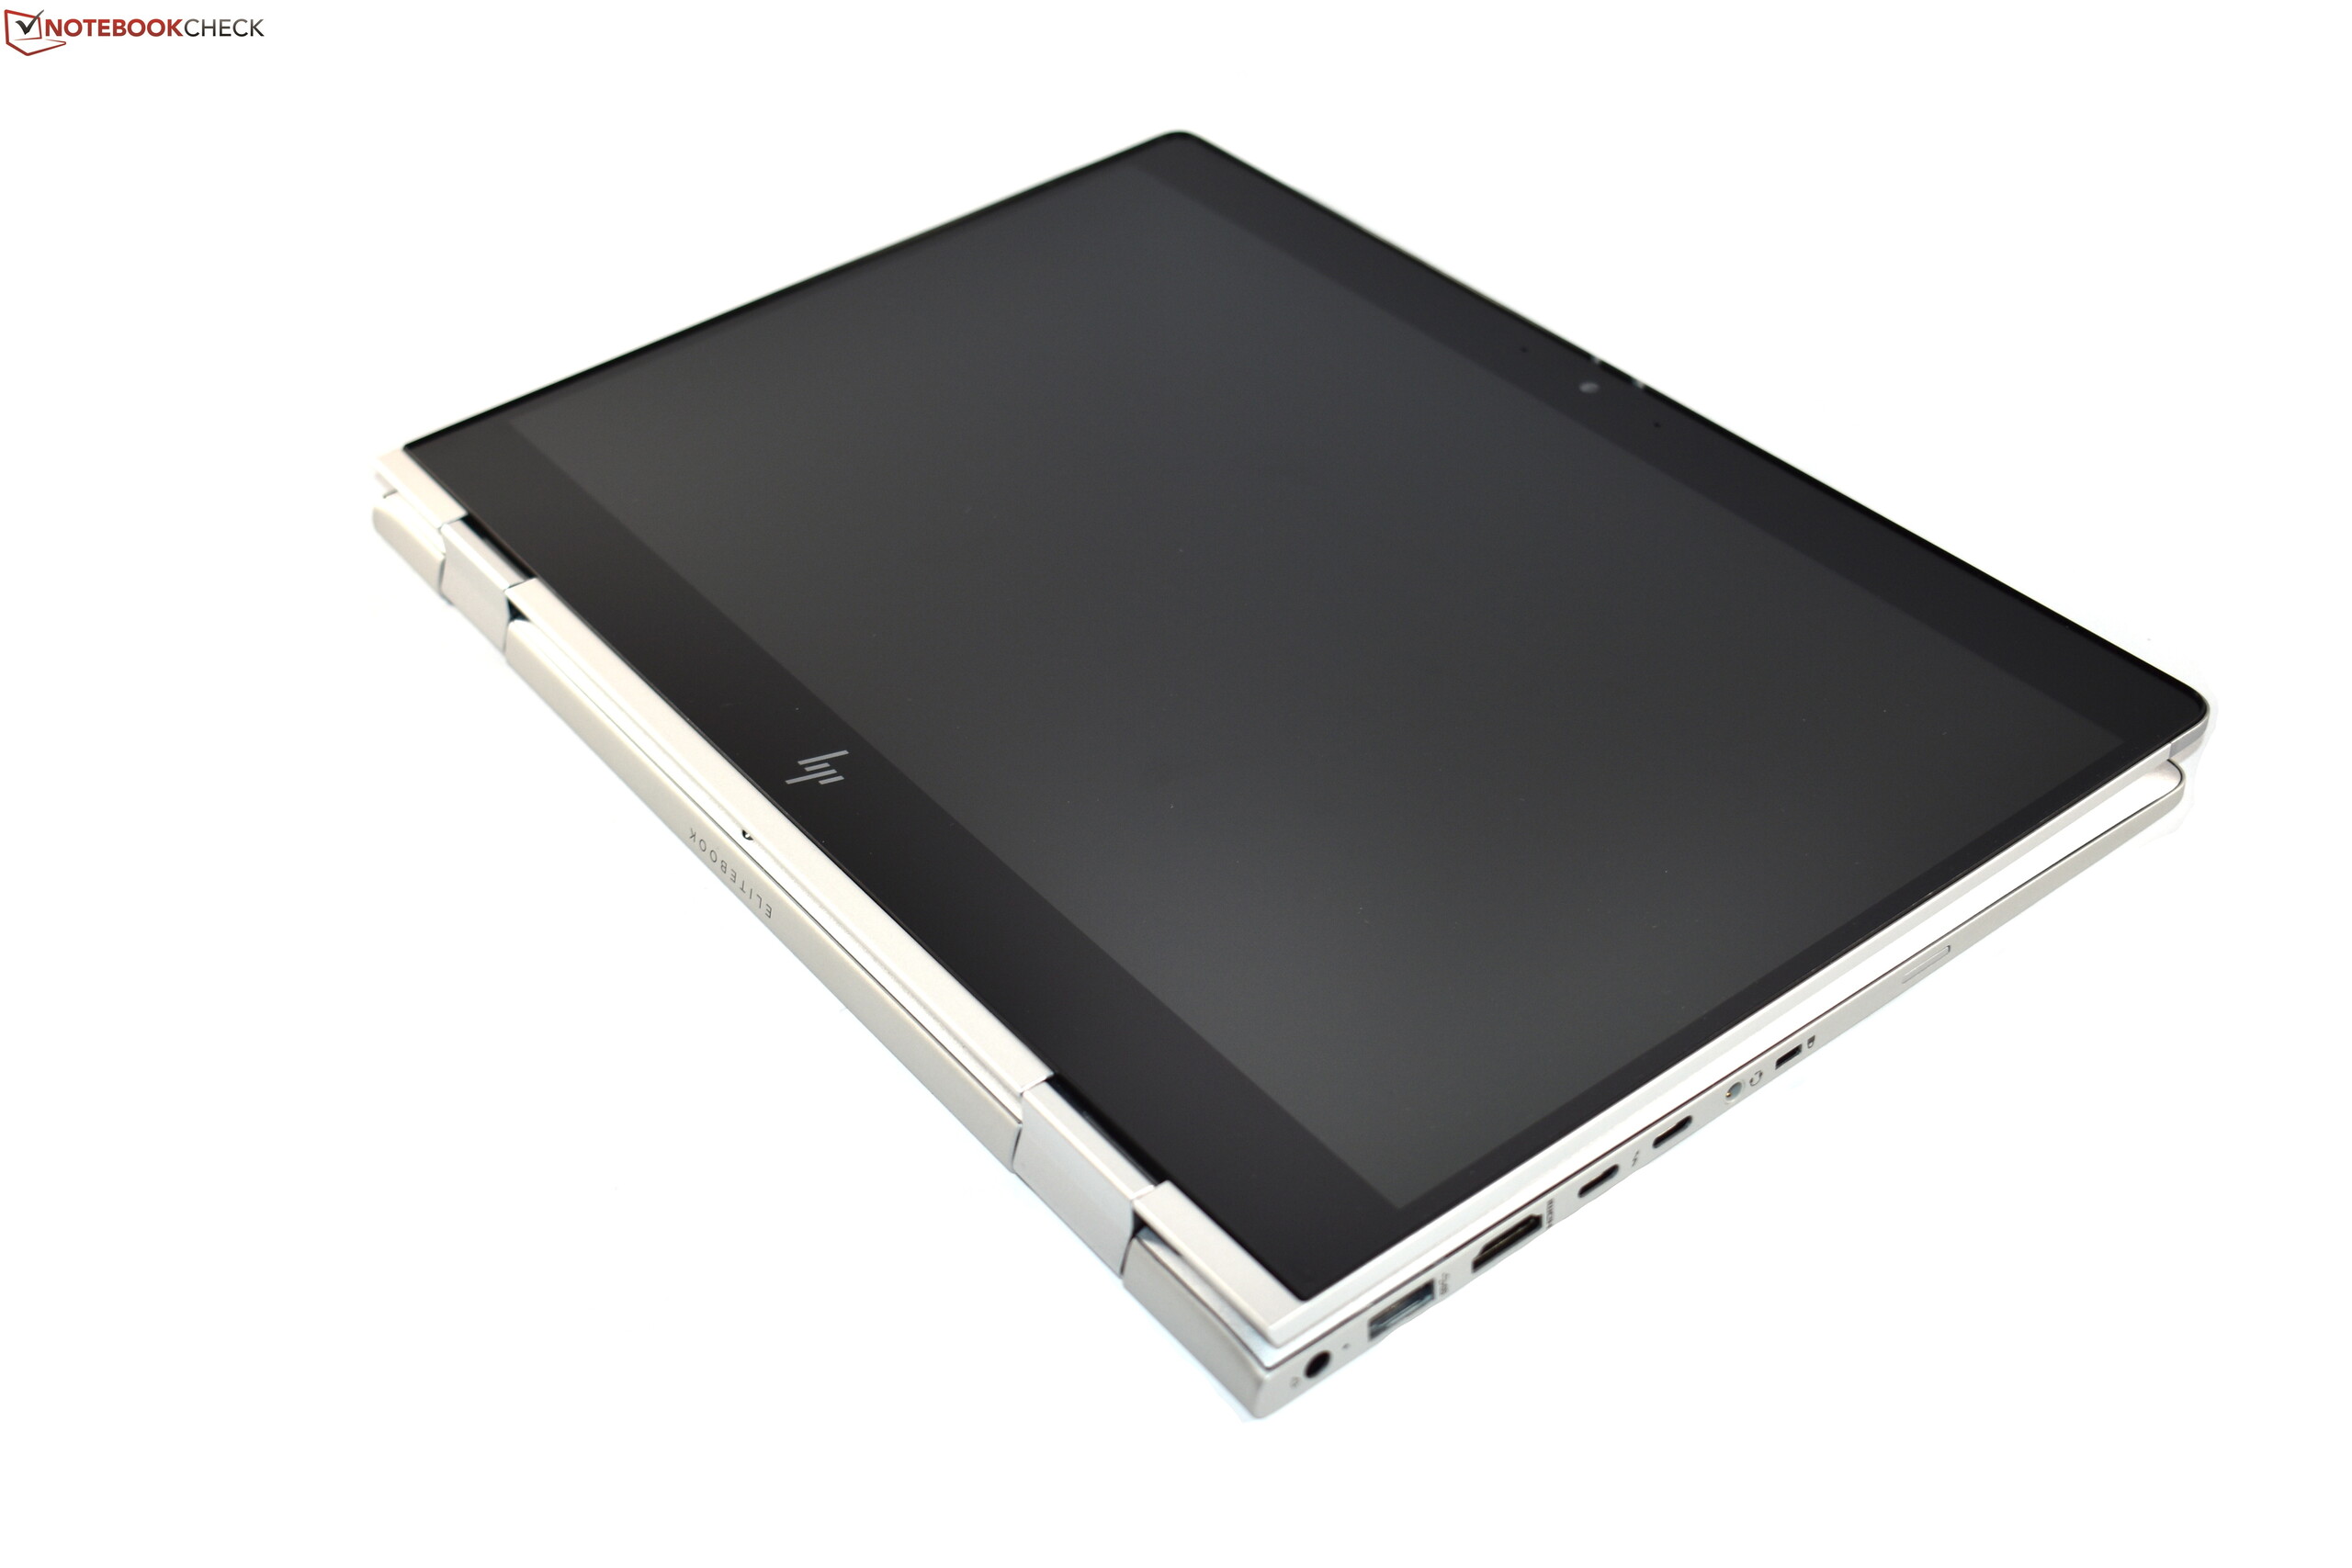
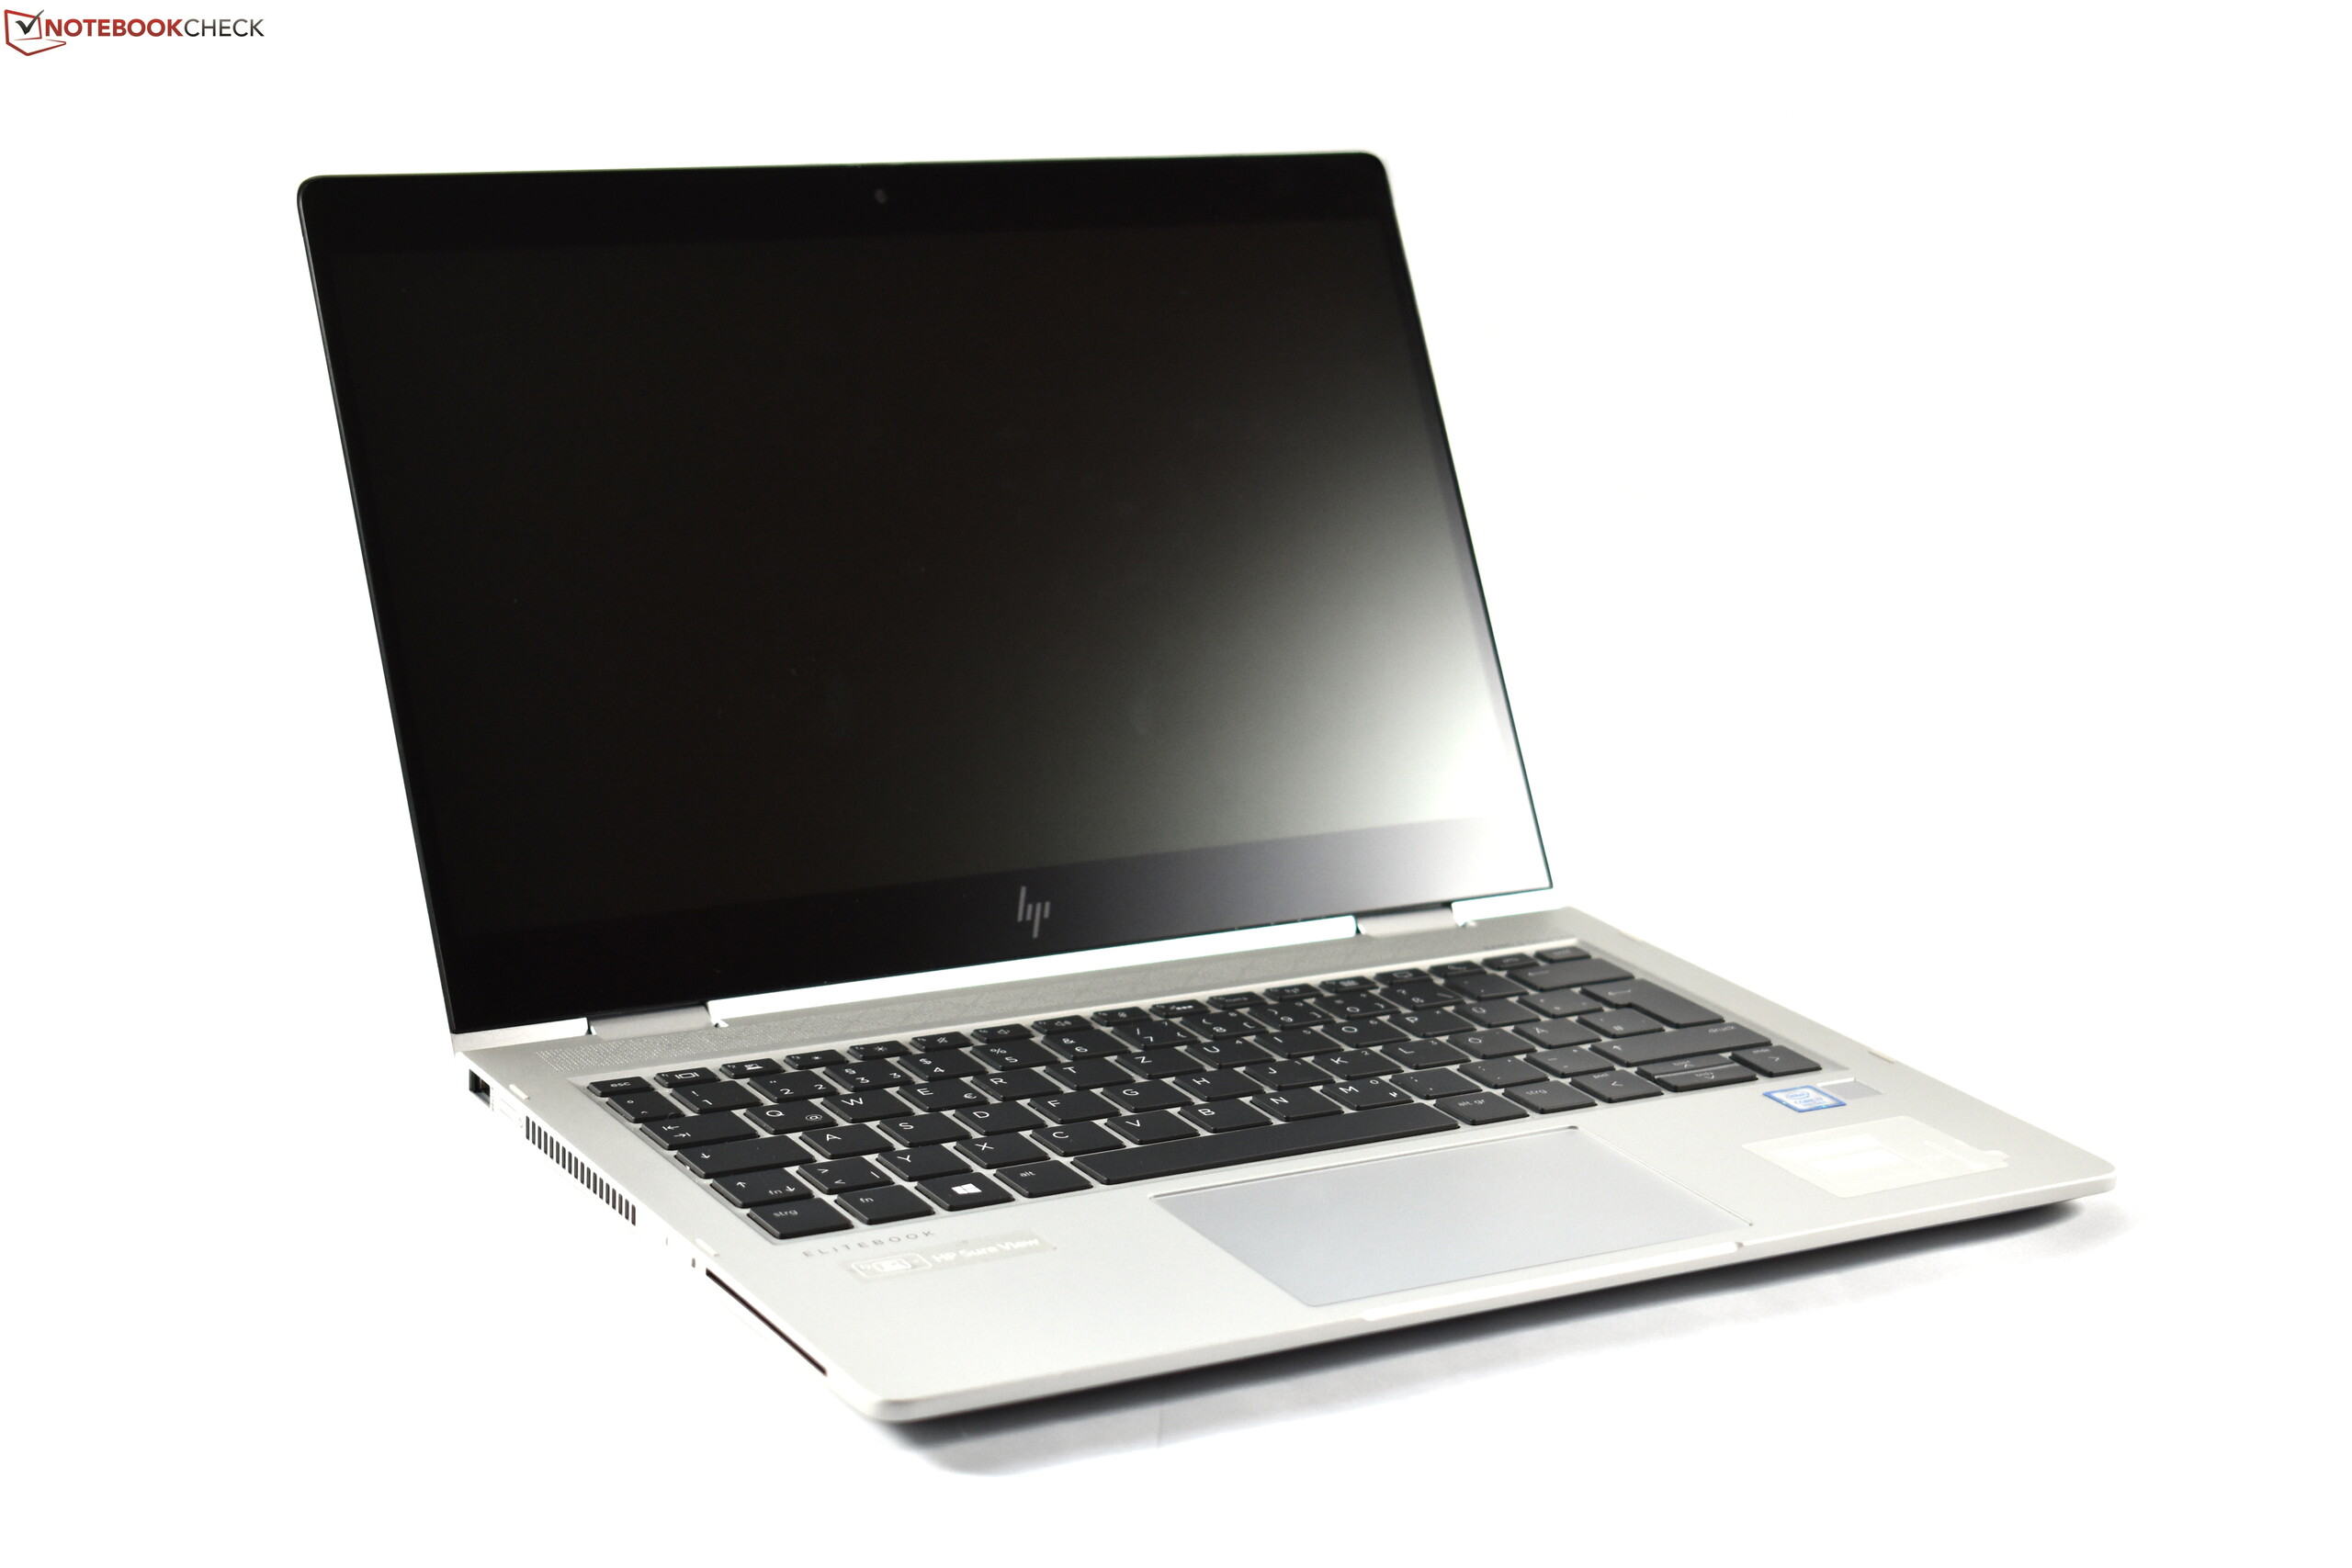
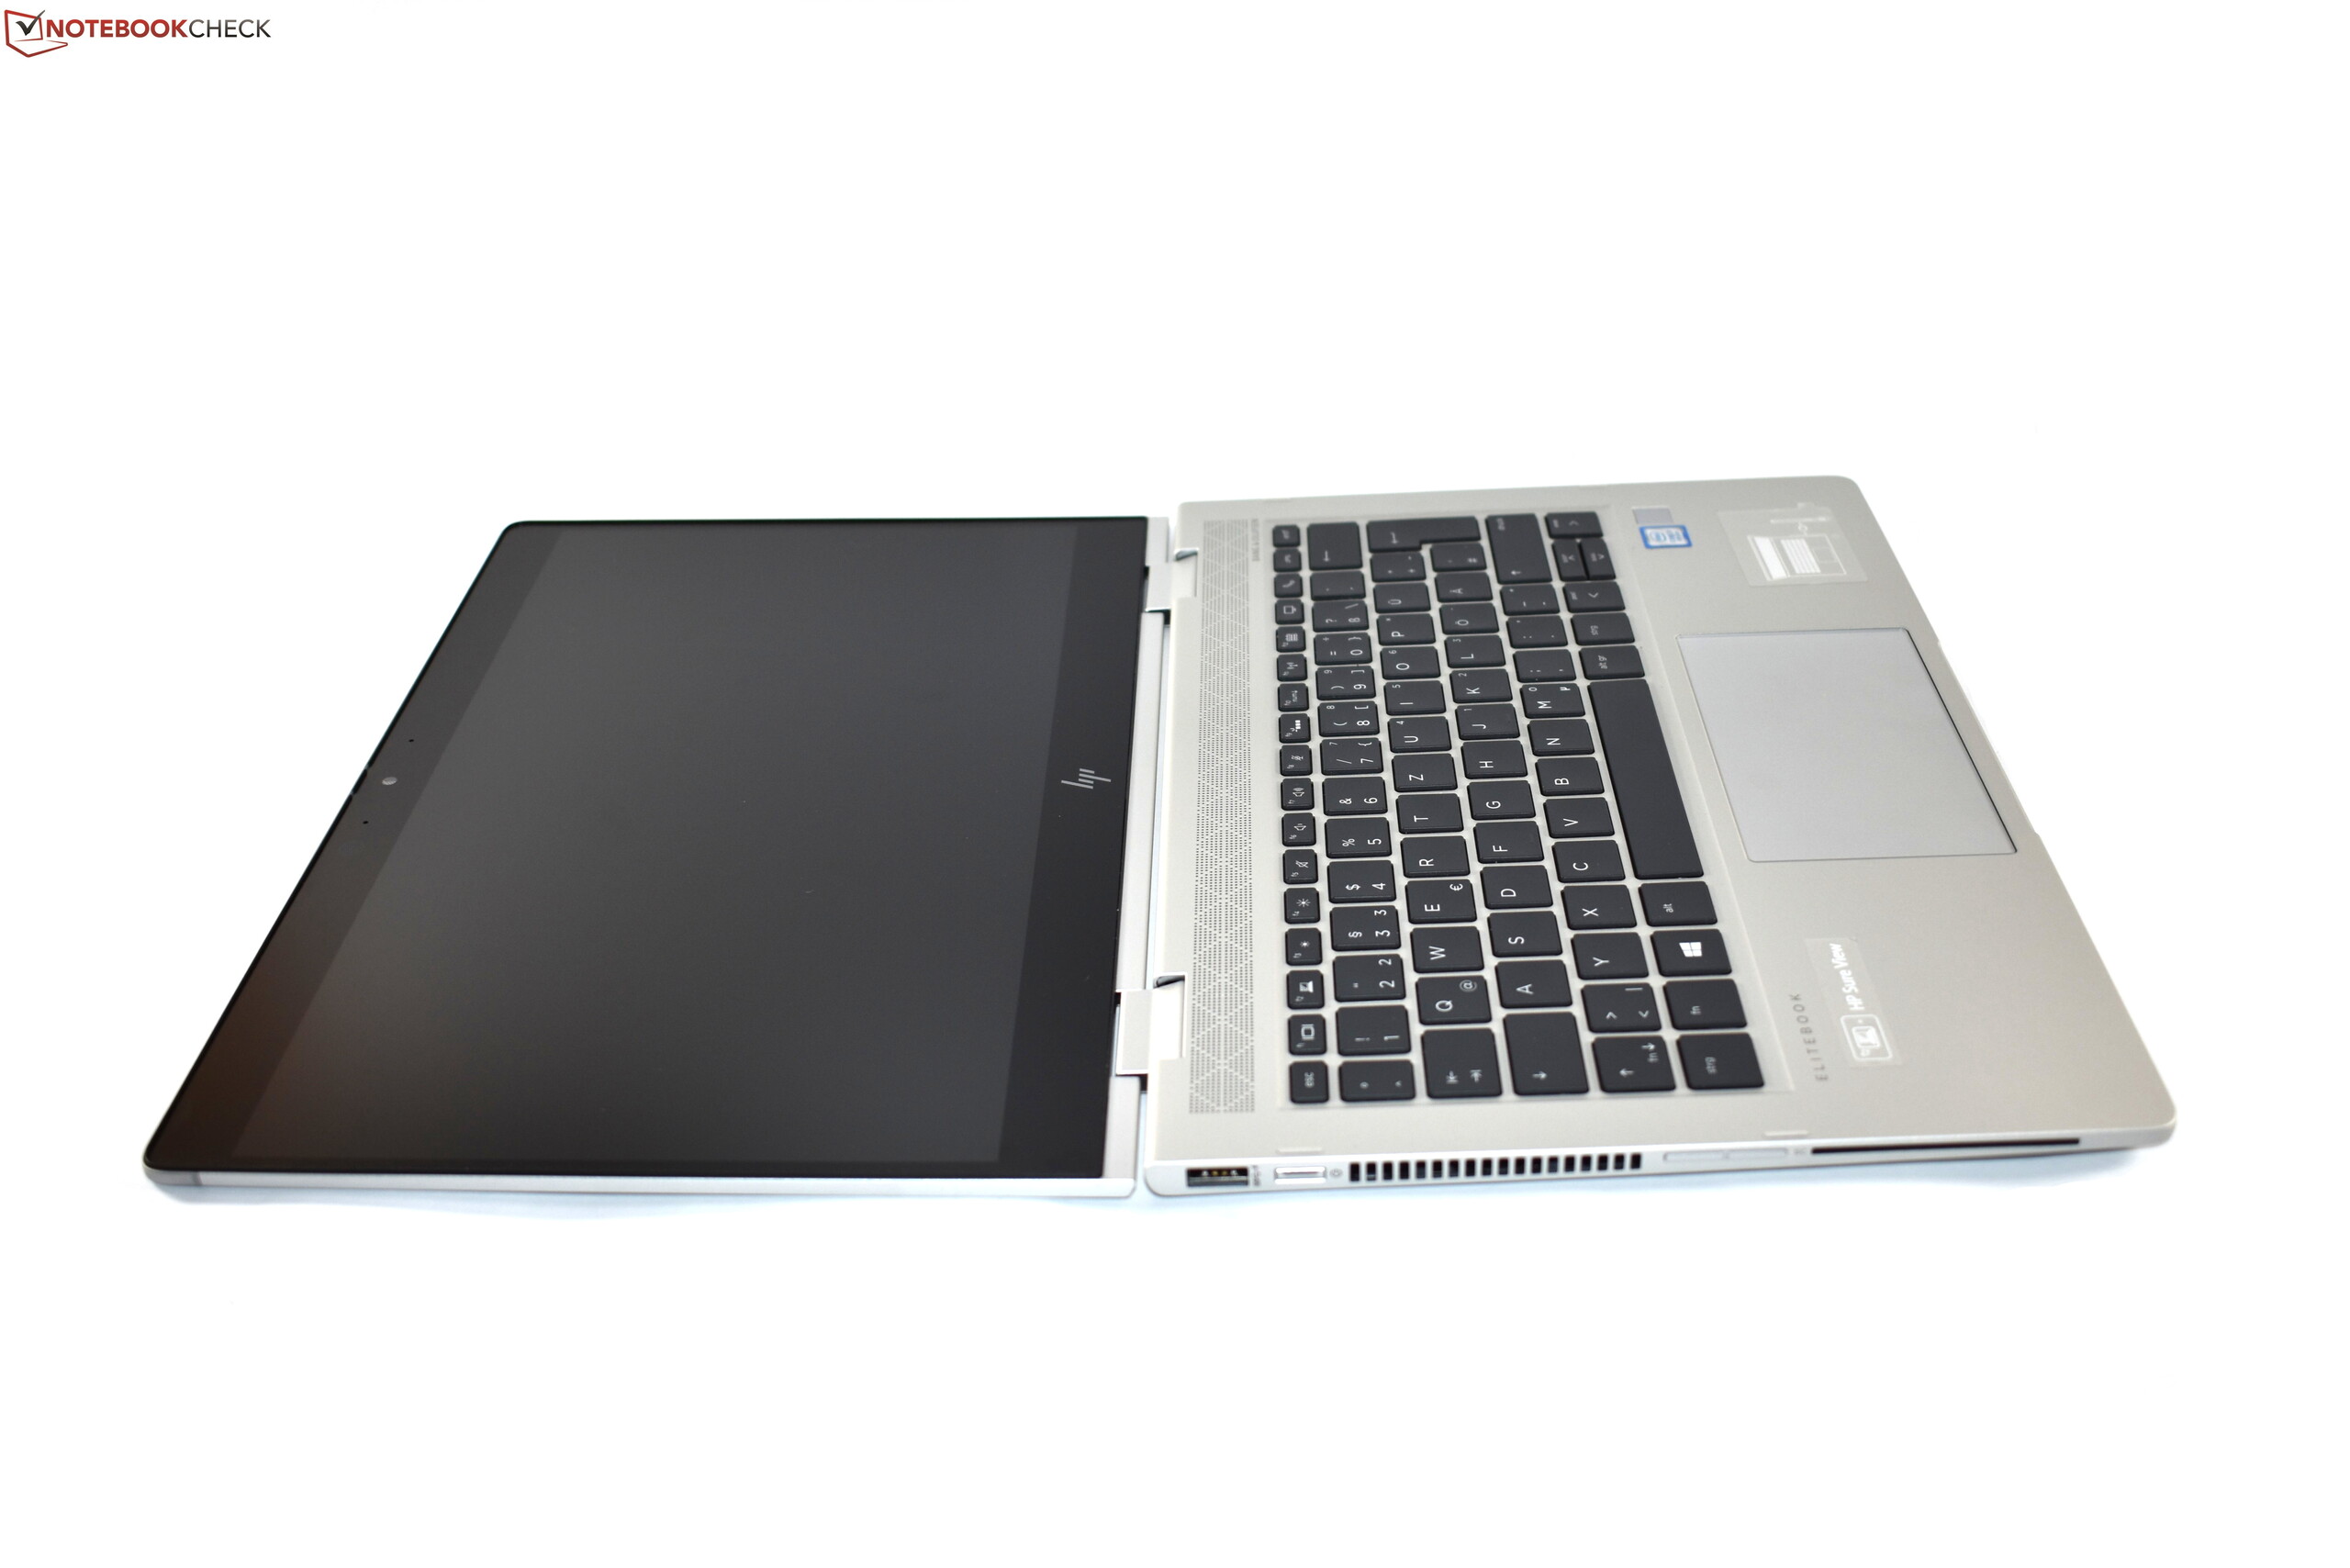
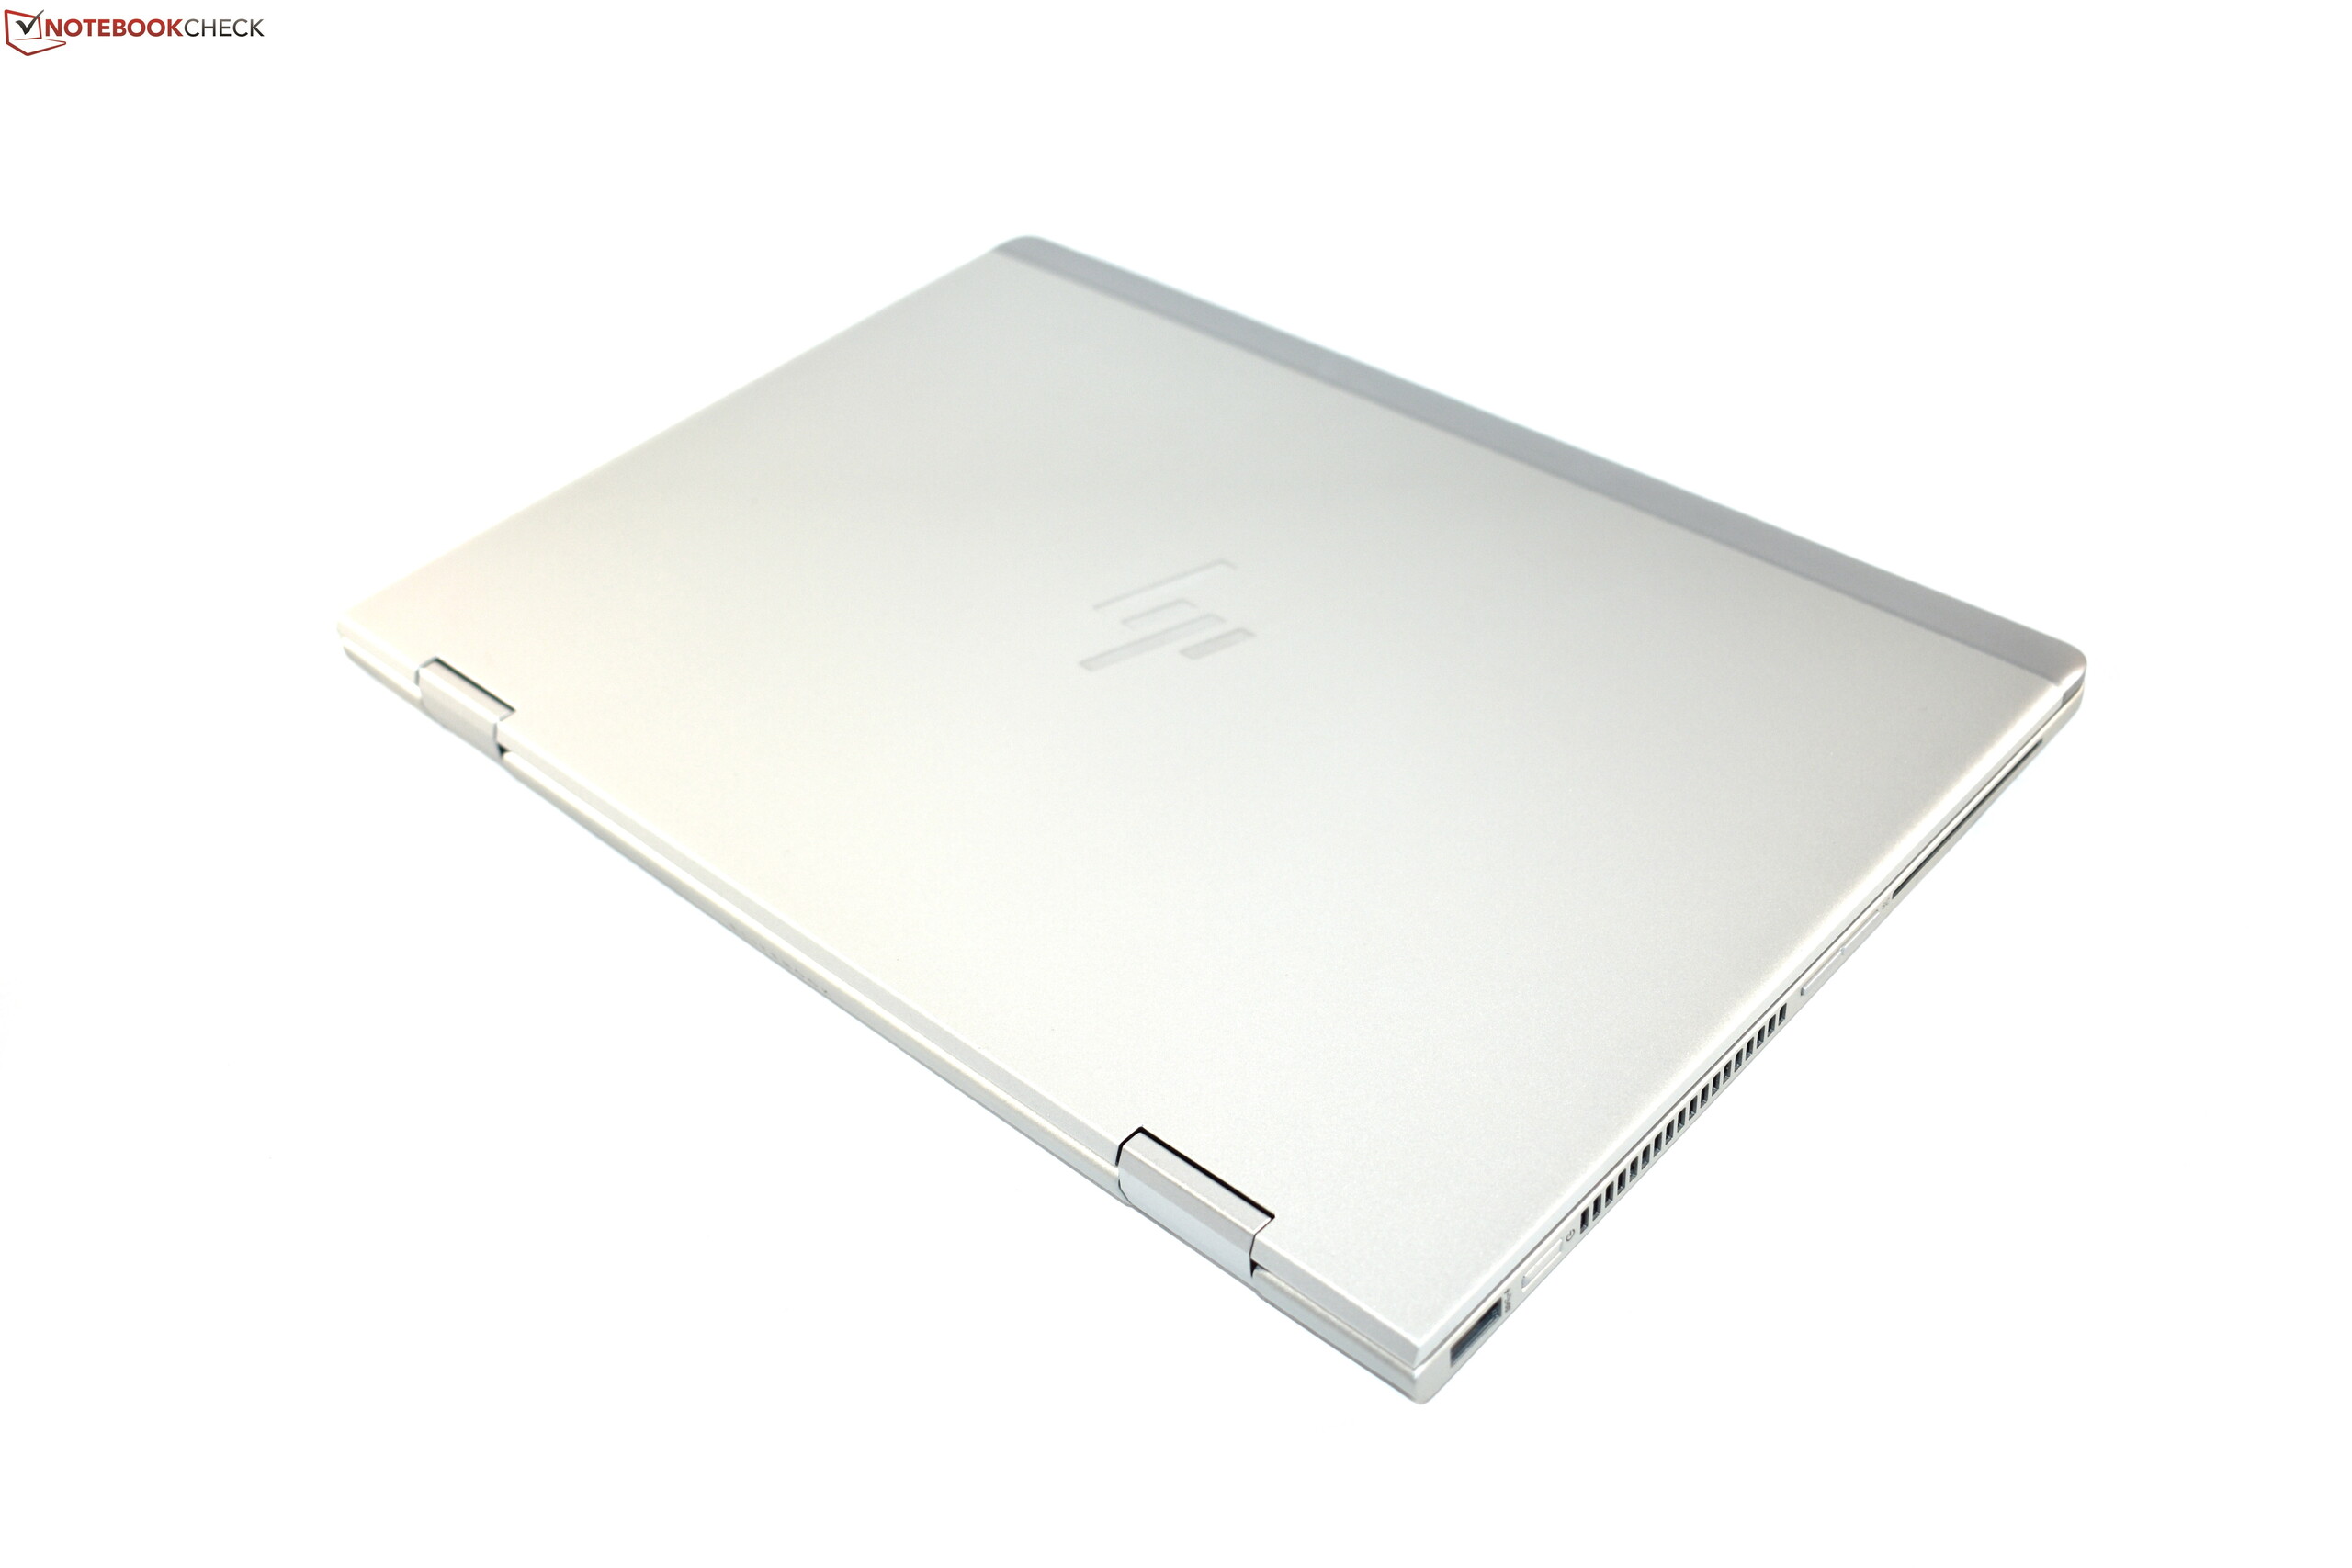
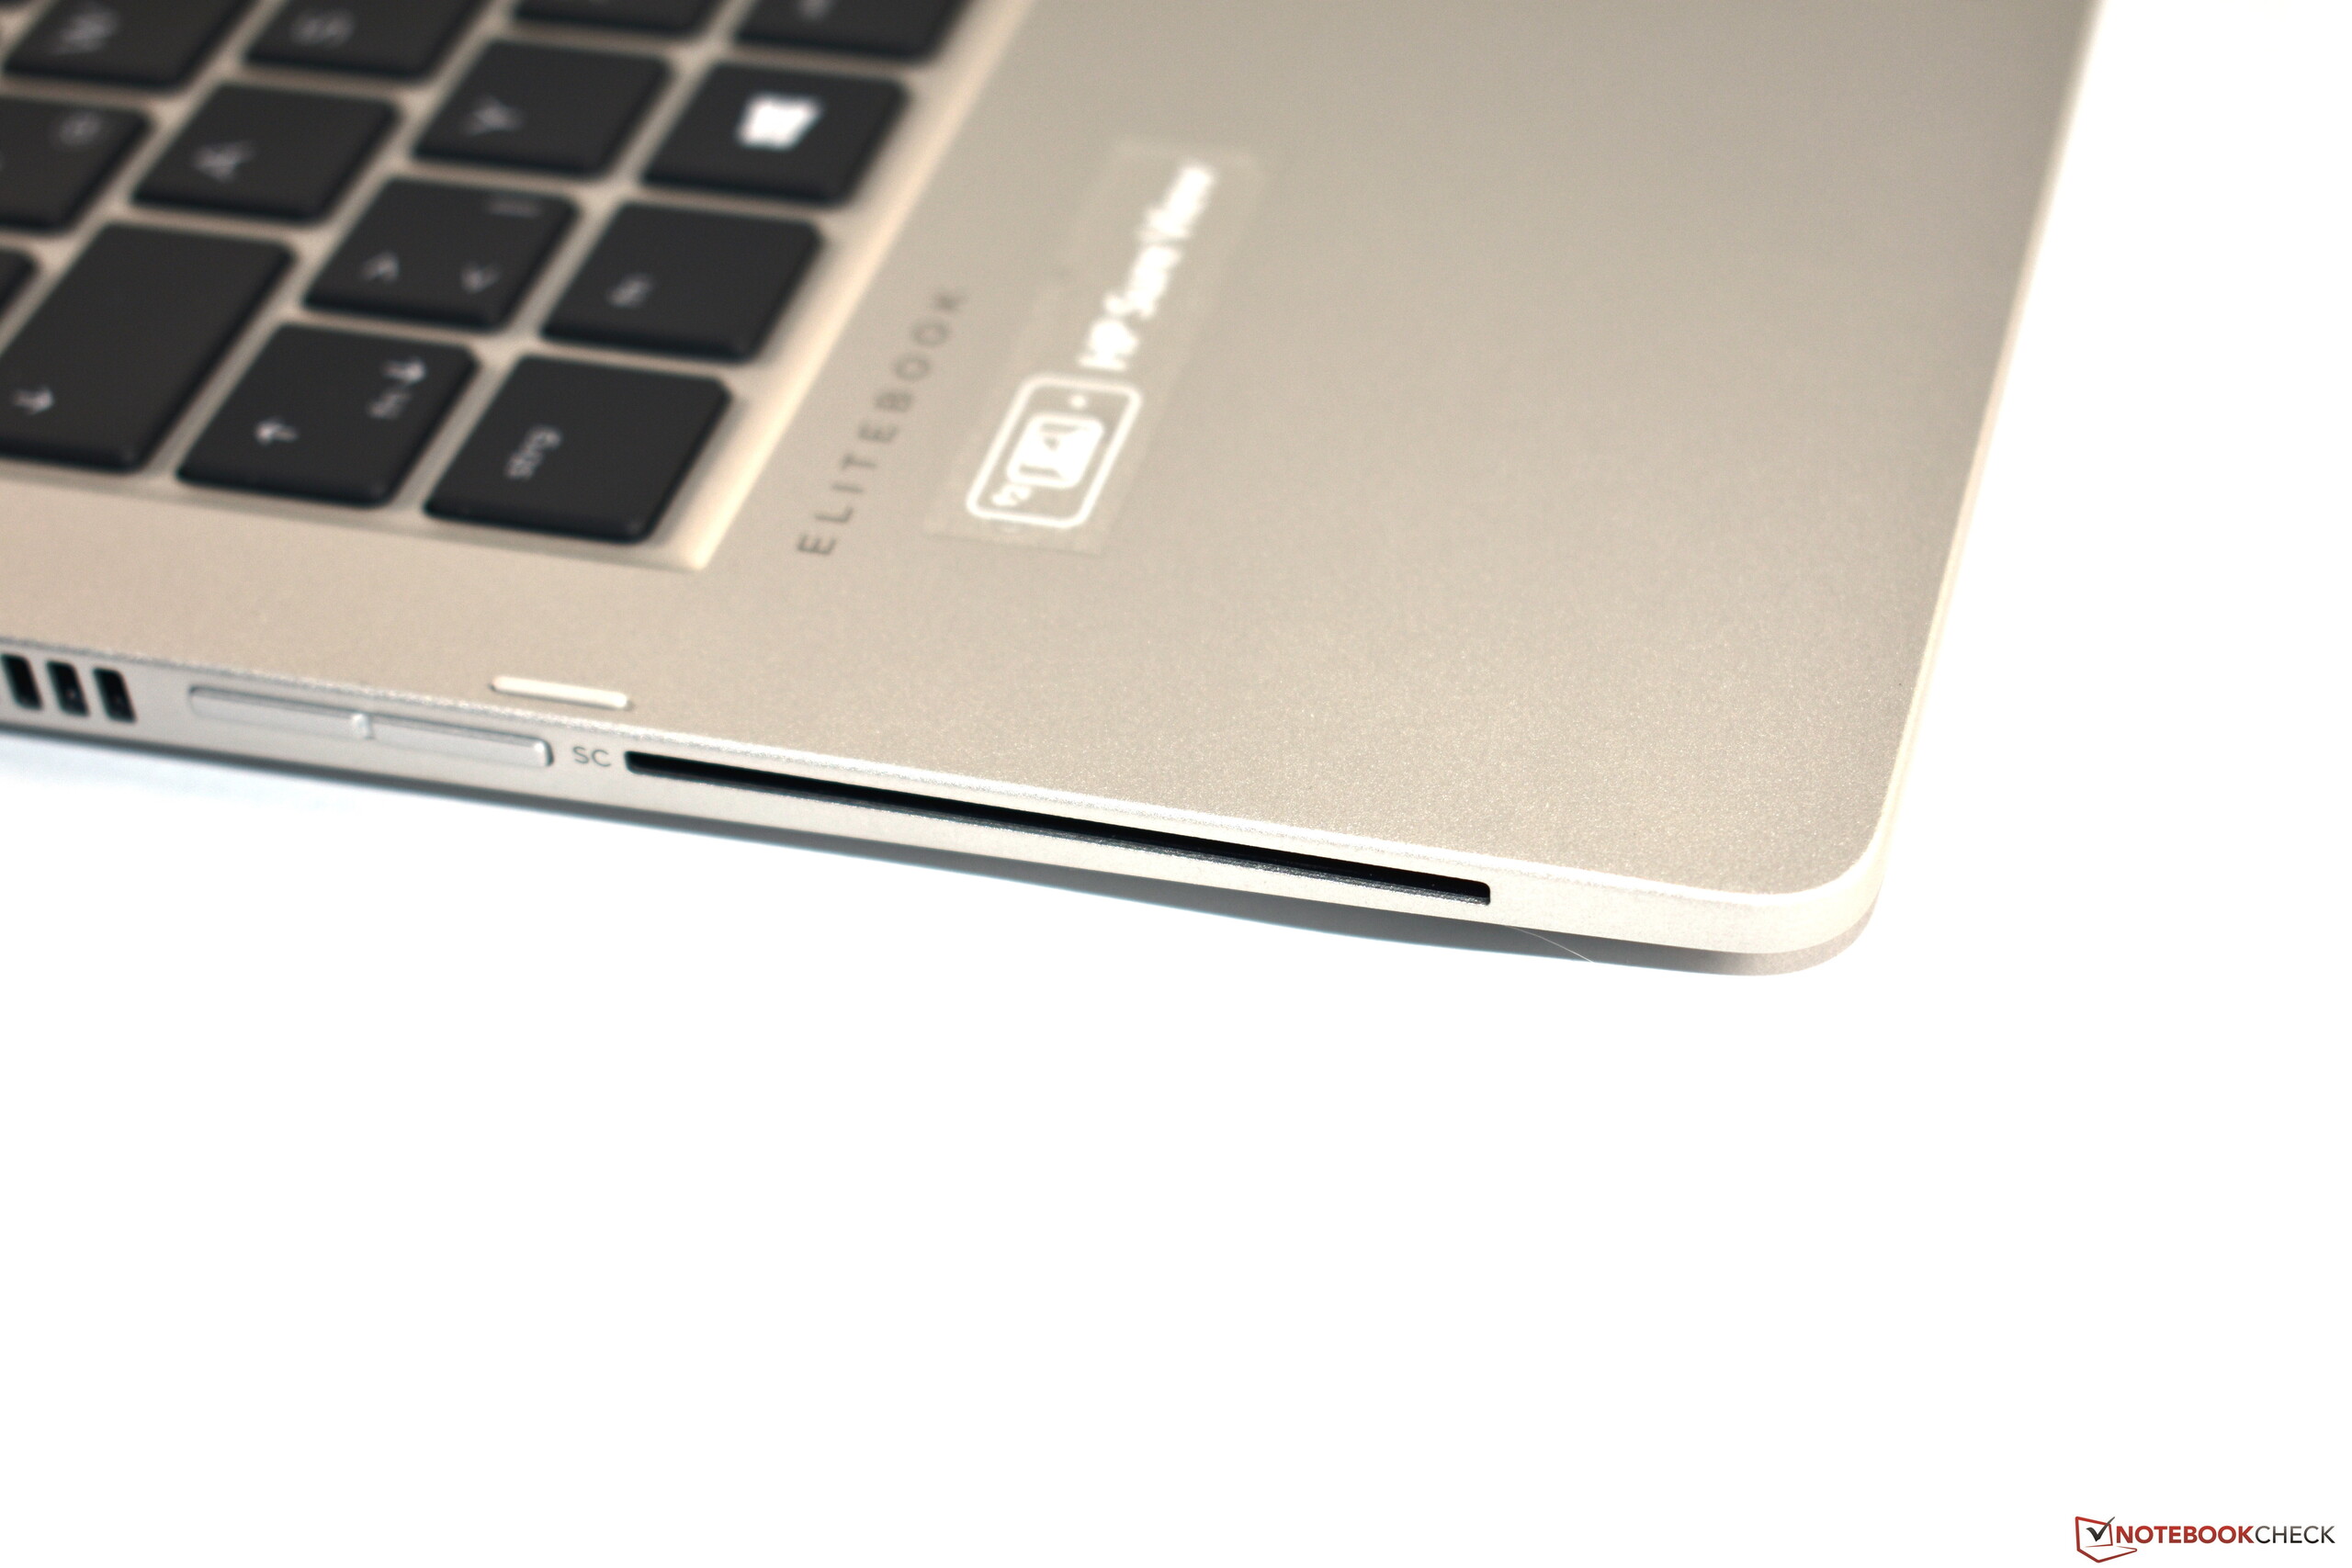
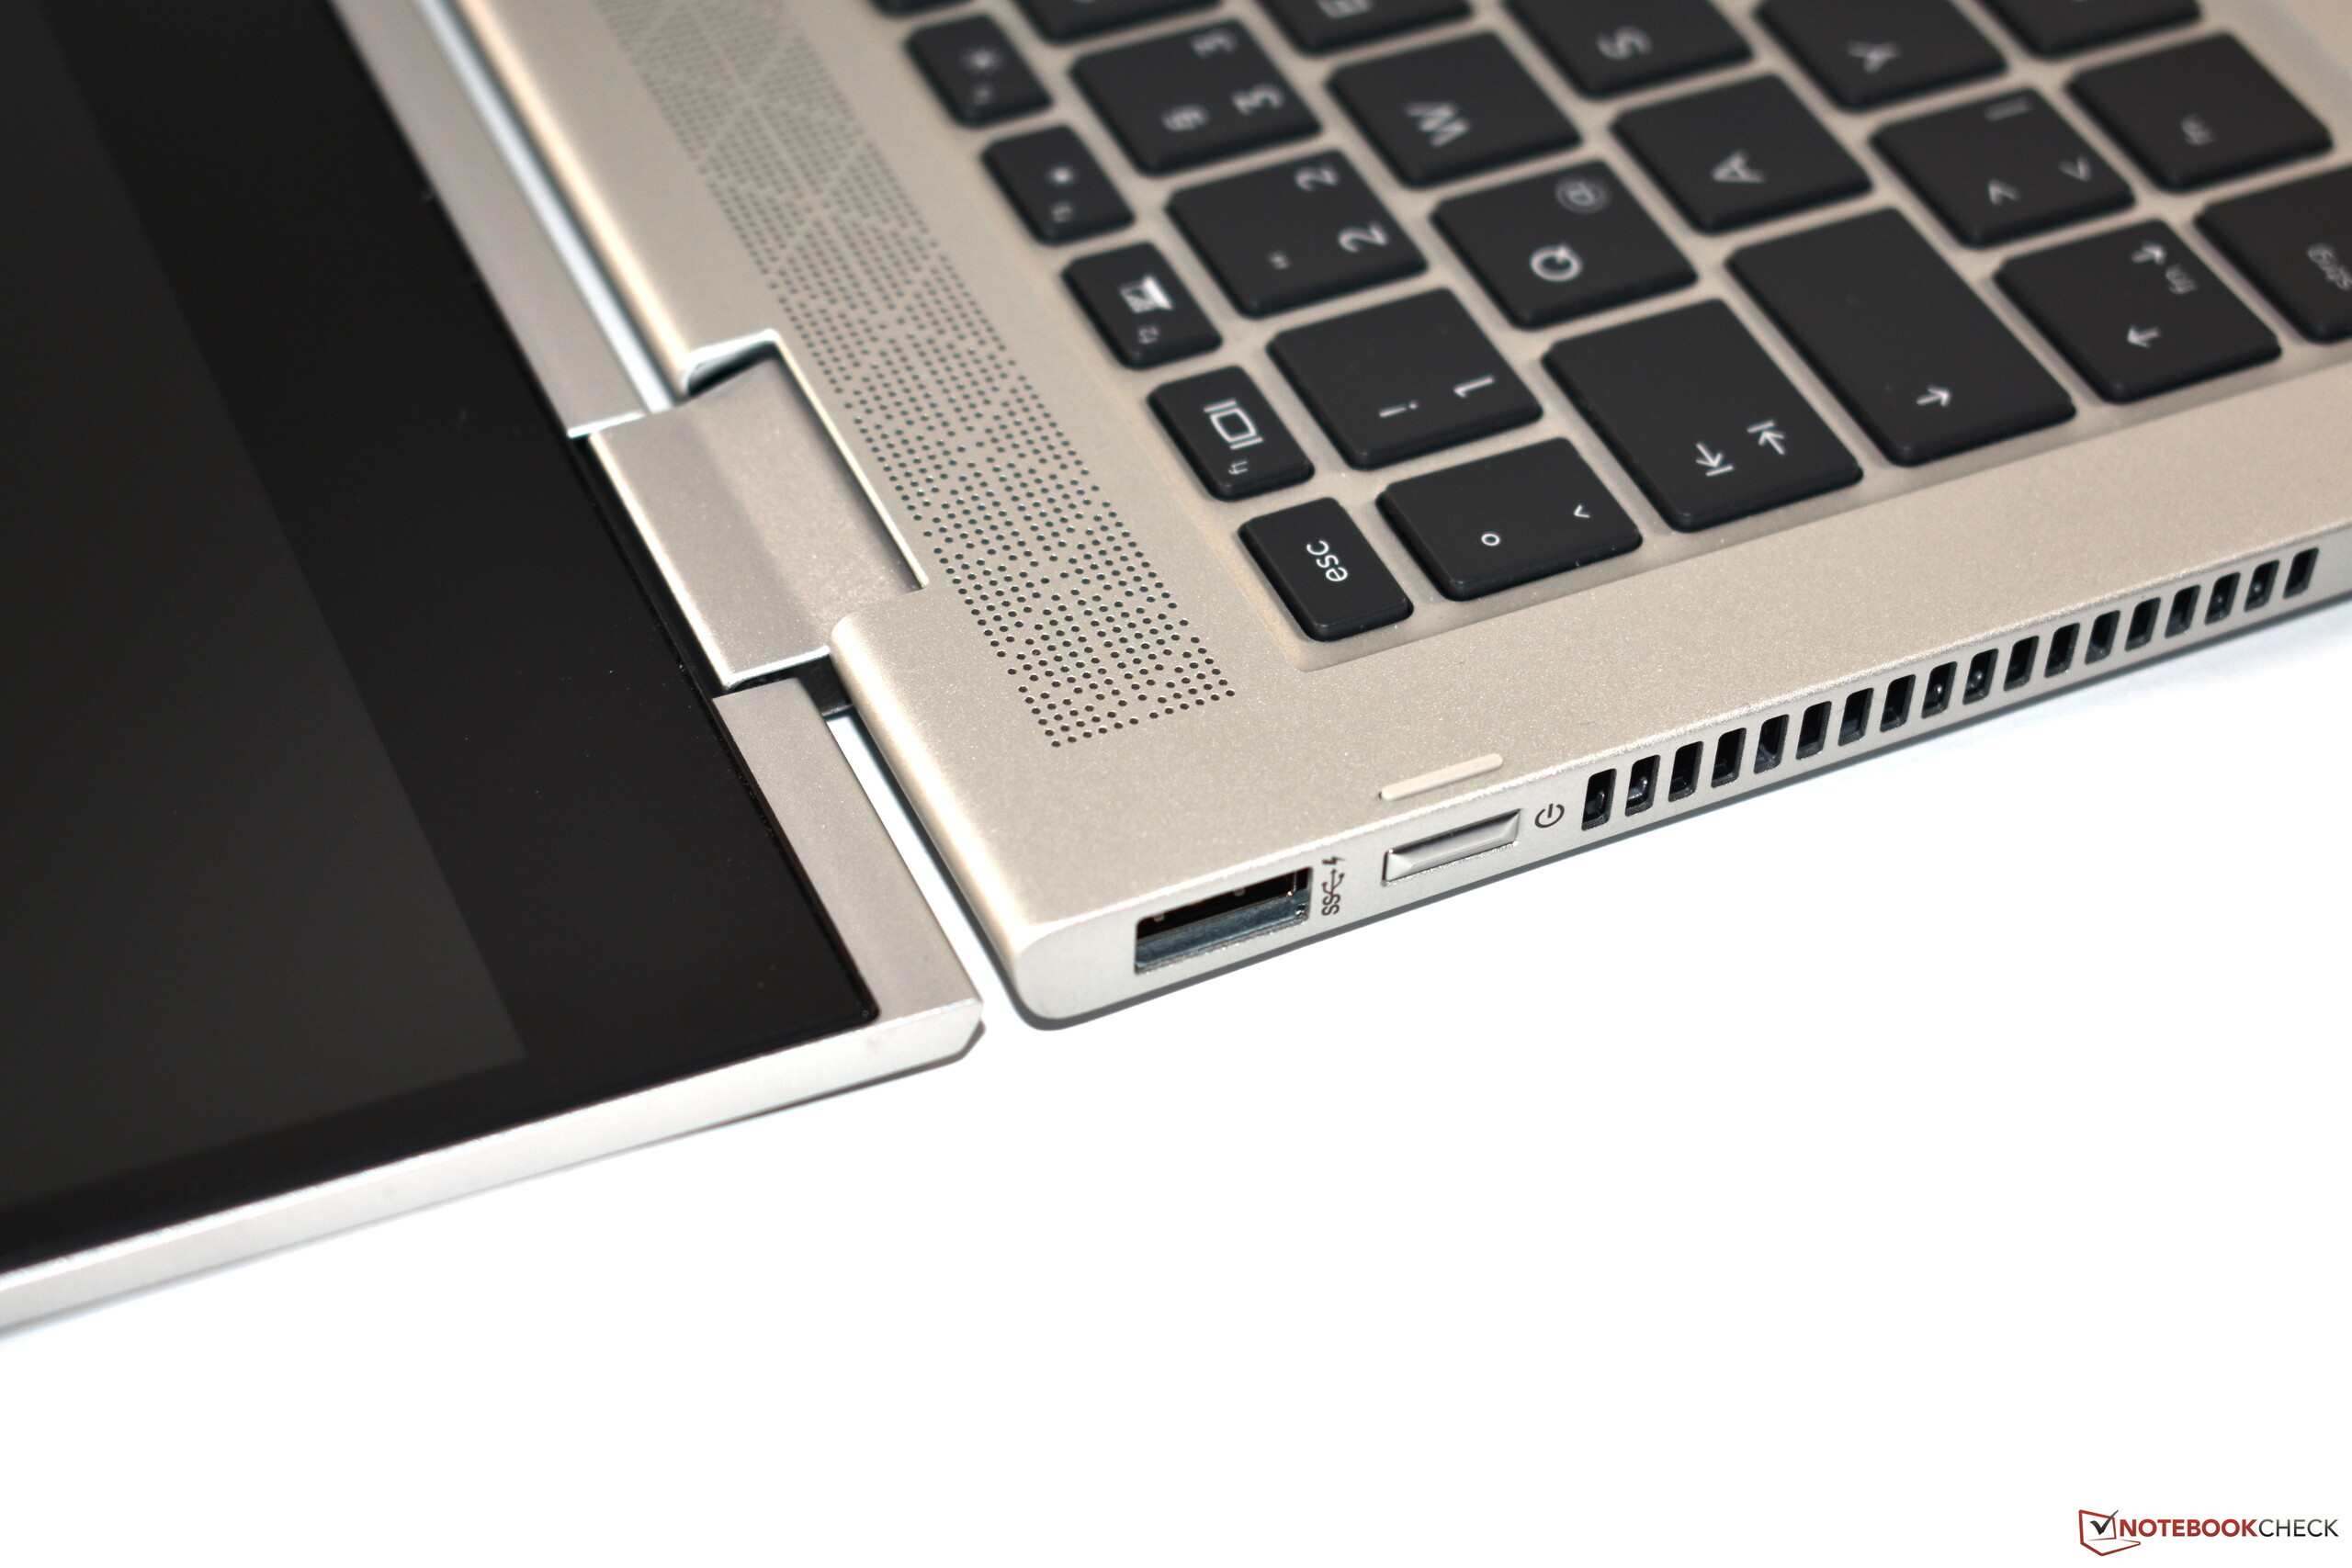
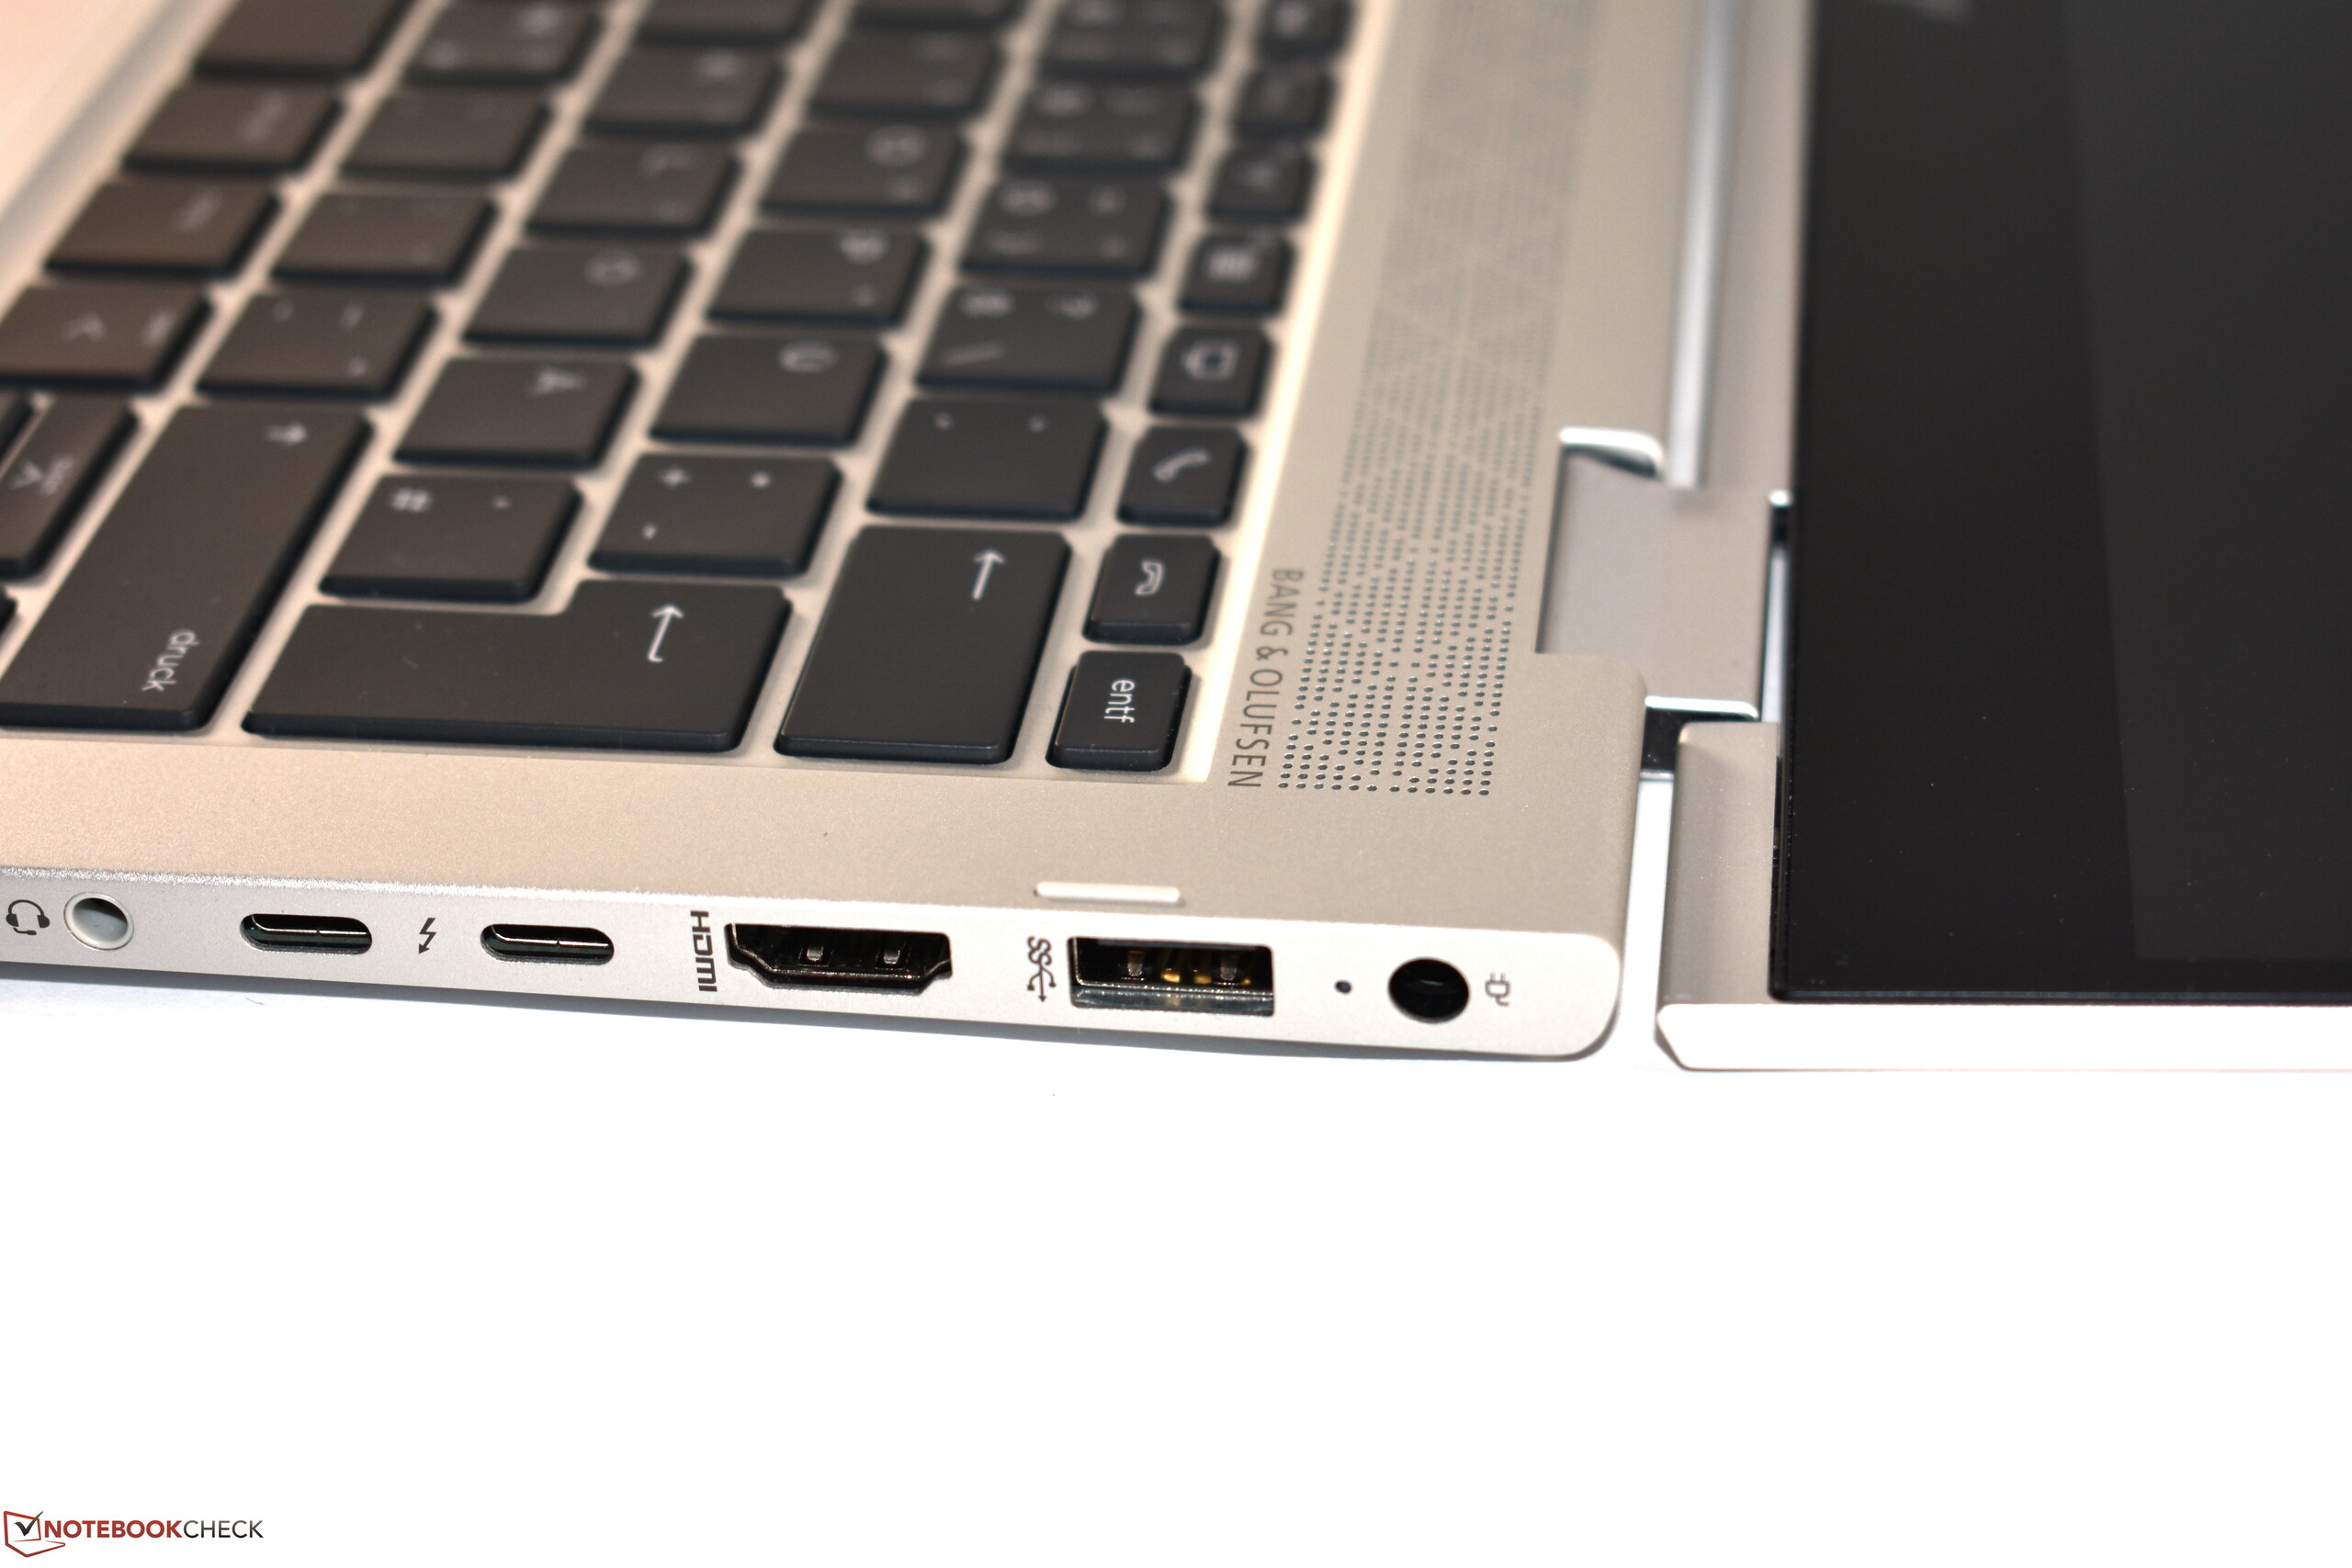
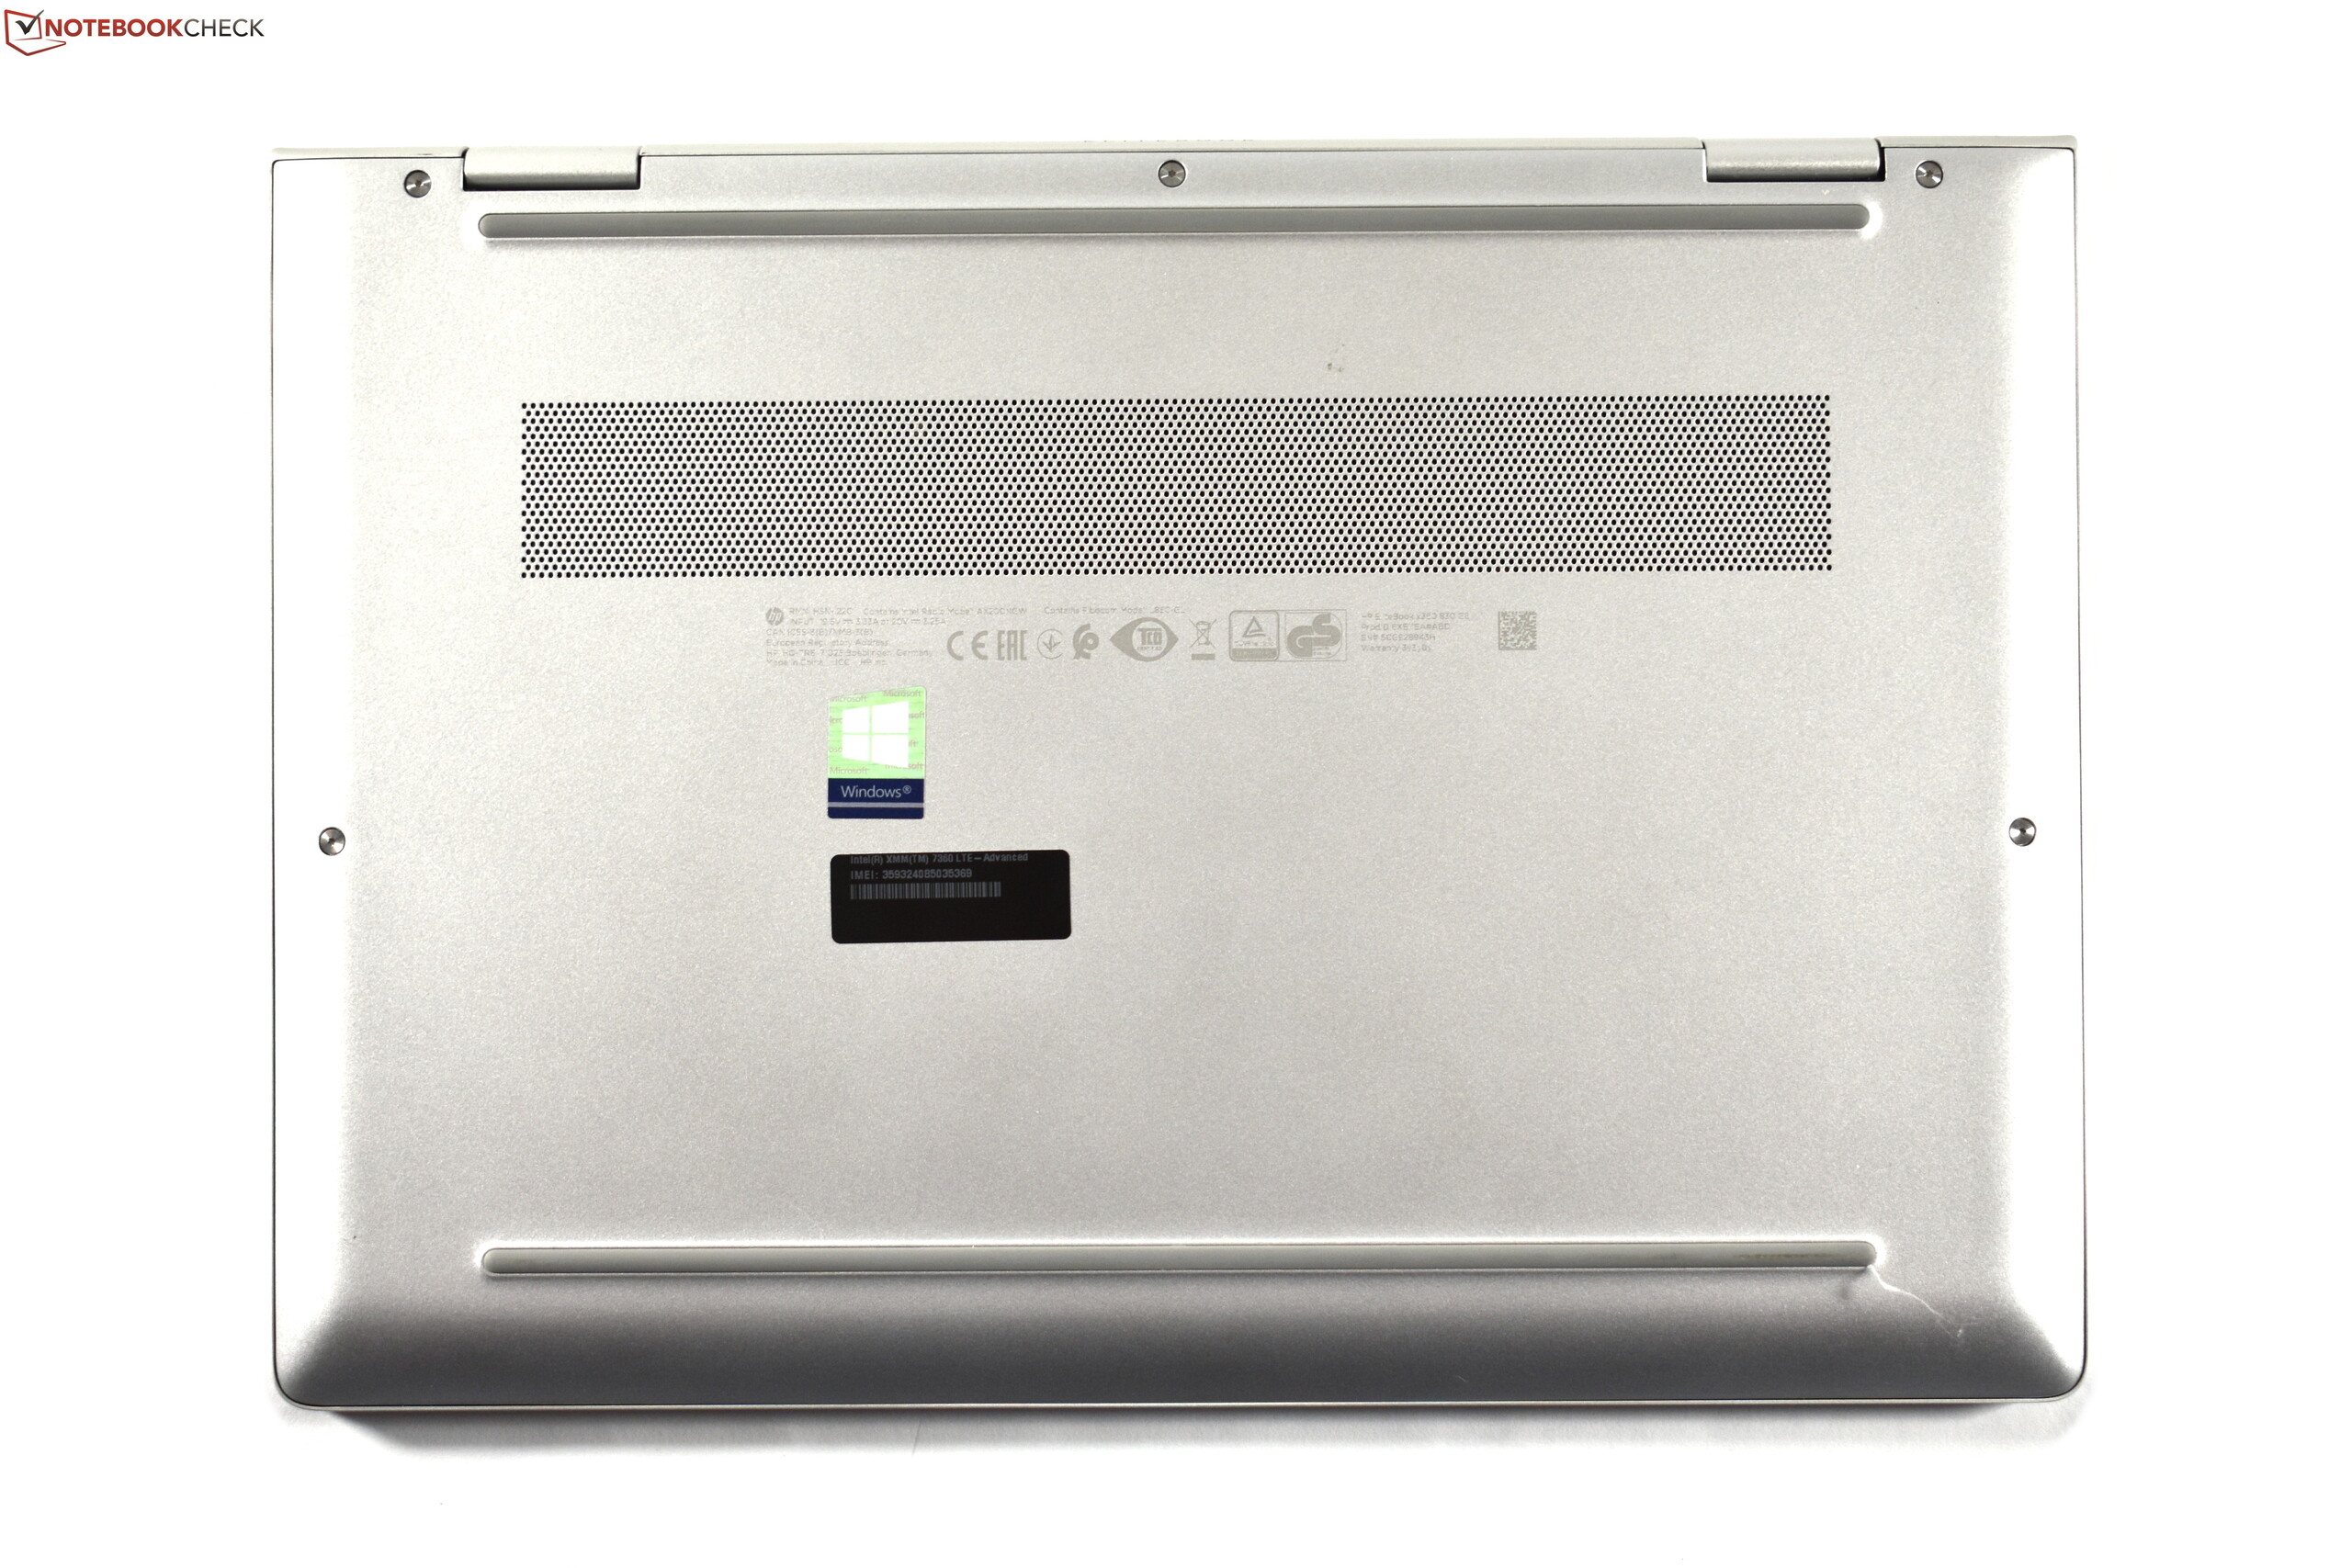
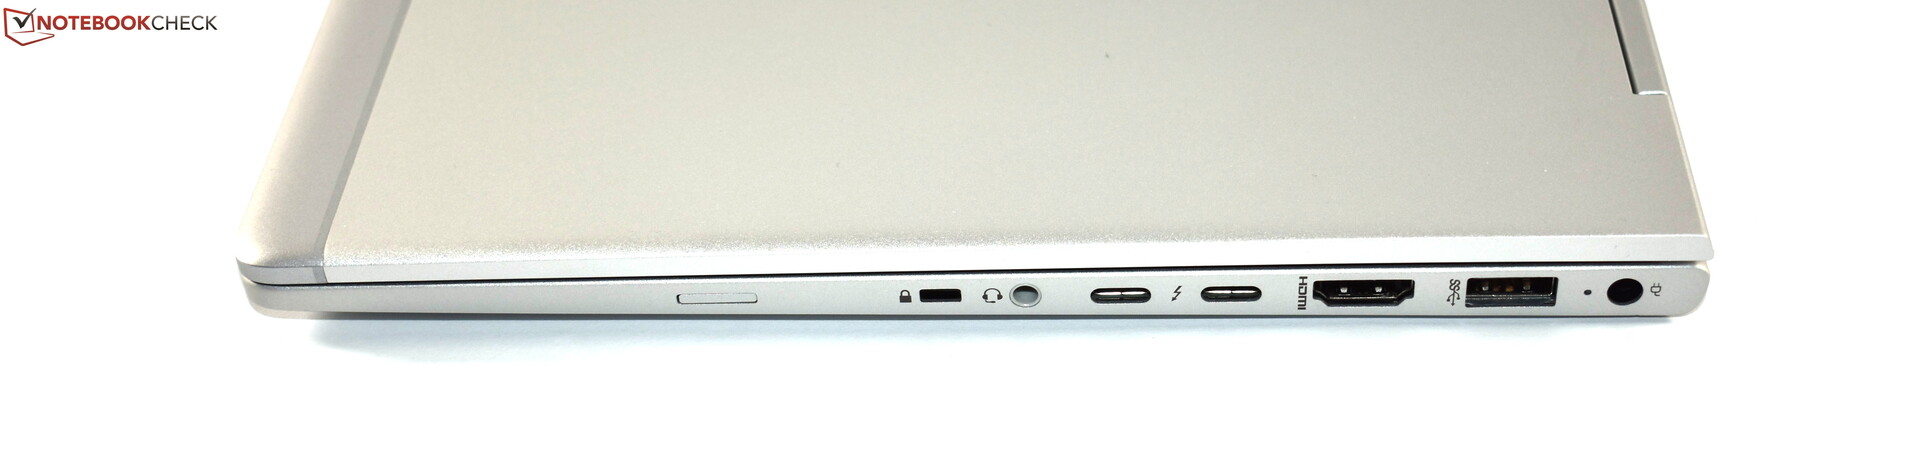
Com o EliteBook x360 830 G6, a HP criou um portátil conversível excelente para usuários empresariais. O recurso central deste modelo certamente é a tela táctil SureView extremamente brilhante e mate, que infelizmente não atinge os prometidos 1000 cd/m² - mas ainda é extremamente brilhante com 700 cd/m². Além da tela, a HP mal comete erros: O chassi de alumínio é muito robusto e bem feito, os dispositivos de entrada são confortáveis, o EliteBook 830 possui uma infinidade de portas e recursos de segurança e, com os dois slots de RAM, o portátil compacto da HP é bastante atualizável. Os alto-falantes são comparativamente bons, o portátil HP não esquenta e a duração da bateria é ótima. Notável também é a longa garantia.
No entanto, o HP EliteBook x360 830 G6 não está livre de problemas. Por exemplo, o desempenho da CPU é pior em comparação com os concorrentes. Além disso, temos que reclamar d ruído da bobina. O HP EliteBook também possui um leitor de cartões (micro) SD e um TrackPoint. Estranhamente, a caneta bloqueia as portas USB C quando é montada no chassi. Por fim, acreditamos que a estabilidade dos ângulos de visão da tela deveria ser melhor quando o SureView estiver desativado. A perda de brilho é muito aparente.
Rico em recursos combinado com qualidade premium: É isso que o HP EliteBook x360 830 G6 oferece.
Em suma, o HP EliteBook x360 830 G6 é uma excelente opção, não apenas para usuários empresariais, mas também para consumidores que desejam um cavalo de trabalho confiável. Ele está muito bem equipado para competir com o Lenovo ThinkPad X390 Yoga.
HP EliteBook x360 830 G6
- 09/30/2019 v7 (old)
Benjamin Herzig
Price comparison
