Breve Análise do Conversível Dell Latitude 7400 2-em-1 (i7-8665U)

| SD Card Reader | |
| average JPG Copy Test (av. of 3 runs) | |
| Lenovo ThinkPad X1 Yoga 2018-20LES01W00 (Toshiba Exceria Pro M501) | |
| Dell Latitude 7400 2-in-1 (Toshiba Exceria Pro M501 UHS-II) | |
| Média da turma Convertible (29.4 - 186, n=21, últimos 2 anos) | |
| HP Pavilion x360 14-cd0002ng (Toshiba Exceria Pro SDXC 64 GB UHS-II) | |
| Asus ZenBook Flip 14 UX461UA (Toshiba Exceria Pro M501 microSDXC 64GB) | |
| maximum AS SSD Seq Read Test (1GB) | |
| Lenovo ThinkPad X1 Yoga 2018-20LES01W00 (Toshiba Exceria Pro M501) | |
| Dell Latitude 7400 2-in-1 (Toshiba Exceria Pro M501 UHS-II) | |
| Média da turma Convertible (67.5 - 254, n=20, últimos 2 anos) | |
| HP Pavilion x360 14-cd0002ng (Toshiba Exceria Pro SDXC 64 GB UHS-II) | |
| Asus ZenBook Flip 14 UX461UA (Toshiba Exceria Pro M501 microSDXC 64GB) | |
| |||||||||||||||||||||||||
iluminação: 83 %
iluminação com acumulador: 277.2 cd/m²
Contraste: 1386:1 (Preto: 0.2 cd/m²)
ΔE ColorChecker Calman: 2.1 | ∀{0.5-29.43 Ø4.71}
calibrated: 1.03
ΔE Greyscale Calman: 3.4 | ∀{0.09-98 Ø4.96}
100% sRGB (Argyll 1.6.3 3D)
64% AdobeRGB 1998 (Argyll 1.6.3 3D)
70% AdobeRGB 1998 (Argyll 3D)
99.6% sRGB (Argyll 3D)
68.6% Display P3 (Argyll 3D)
Gamma: 2.241
CCT: 6030 K
| Dell Latitude 7400 2-in-1 SHP14A2, IPS, 14", 1920x1080 | HP Pavilion x360 14-cd0002ng Chi Mei CMN14D9, IPS, 14", 1920x1080 | Lenovo ThinkPad X1 Yoga 2018-20LES01W00 Lenovo 40AE / B140QAN02.0, IPS Dolby Vision HDR, 14", 2560x1440 | Asus ZenBook Flip 14 UX461UA BOE NV140FHM-N62, IPS, 14", 1920x1080 | HP Elitebook x360 1040 G5 AU Optronics AUO533D, IPS, 14", 1920x1080 | Lenovo ThinkPad X1 Carbon G6-20KG0025UK Lenovo LEN40A9 / AUO B140HAK02.3, IPS, 14", 1920x1080 | |
|---|---|---|---|---|---|---|
| Display | -39% | 23% | -11% | -6% | -2% | |
| Display P3 Coverage (%) | 68.6 | 41.32 -40% | 86.5 26% | 64.4 -6% | 64.3 -6% | 68.3 0% |
| sRGB Coverage (%) | 99.6 | 61.8 -38% | 100 0% | 84.6 -15% | 94.1 -6% | 94.9 -5% |
| AdobeRGB 1998 Coverage (%) | 70 | 42.74 -39% | 99.4 42% | 61.8 -12% | 65.5 -6% | 69.3 -1% |
| Response Times | 21% | 18% | 17% | -9% | 32% | |
| Response Time Grey 50% / Grey 80% * (ms) | 56 ? | 44 ? 21% | 56.8 ? -1% | 44 ? 21% | 70.8 ? -26% | 40 ? 29% |
| Response Time Black / White * (ms) | 38 ? | 30 ? 21% | 24 ? 37% | 33 ? 13% | 34.4 ? 9% | 25 ? 34% |
| PWM Frequency (Hz) | 1667 ? | 2439 ? | 200 ? | 735 ? | ||
| Screen | -51% | 17% | -42% | -4% | 3% | |
| Brightness middle (cd/m²) | 277.2 | 225 -19% | 562 103% | 302 9% | 416.3 50% | 298 8% |
| Brightness (cd/m²) | 263 | 195 -26% | 522 98% | 288 10% | 400 52% | 287 9% |
| Brightness Distribution (%) | 83 | 72 -13% | 86 4% | 90 8% | 89 7% | 91 10% |
| Black Level * (cd/m²) | 0.2 | 0.14 30% | 0.3 -50% | 0.57 -185% | 0.29 -45% | 0.2 -0% |
| Contrast (:1) | 1386 | 1607 16% | 1873 35% | 530 -62% | 1436 4% | 1490 8% |
| Colorchecker dE 2000 * | 2.1 | 5.44 -159% | 2.8 -33% | 5.17 -146% | 2.69 -28% | 2.19 -4% |
| Colorchecker dE 2000 max. * | 5.91 | 20.38 -245% | 5.8 2% | 7.68 -30% | 4.95 16% | 4.39 26% |
| Colorchecker dE 2000 calibrated * | 1.03 | 2.13 -107% | 1.67 -62% | |||
| Greyscale dE 2000 * | 3.4 | 3.98 -17% | 4.5 -32% | 3.26 4% | 2.9 15% | 1.97 42% |
| Gamma | 2.241 98% | 2.32 95% | 2.16 102% | 2.45 90% | 2.4 92% | 2.43 91% |
| CCT | 6030 108% | 6163 105% | 7205 90% | 7142 91% | 6623 98% | 6571 99% |
| Color Space (Percent of AdobeRGB 1998) (%) | 64 | 39 -39% | 88.9 39% | 55 -14% | 60.1 -6% | 62 -3% |
| Color Space (Percent of sRGB) (%) | 100 | 62 -38% | 100 0% | 85 -15% | 94.5 -5% | 95 -5% |
| Média Total (Programa/Configurações) | -23% /
-39% | 19% /
18% | -12% /
-28% | -6% /
-5% | 11% /
5% |
* ... menor é melhor
Exibir tempos de resposta
| ↔ Tempo de resposta preto para branco | ||
|---|---|---|
| 38 ms ... ascensão ↗ e queda ↘ combinadas | ↗ 22.8 ms ascensão | 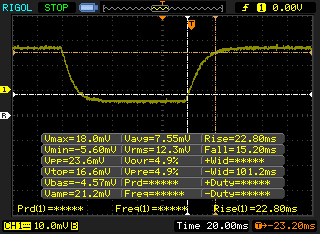 |
| ↘ 15.2 ms queda | ||
| A tela mostra taxas de resposta lentas em nossos testes e será insatisfatória para os jogadores. Em comparação, todos os dispositivos testados variam de 0.1 (mínimo) a 240 (máximo) ms. » 96 % de todos os dispositivos são melhores. Isso significa que o tempo de resposta medido é pior que a média de todos os dispositivos testados (19.8 ms). | ||
| ↔ Tempo de resposta 50% cinza a 80% cinza | ||
| 56 ms ... ascensão ↗ e queda ↘ combinadas | ↗ 31.6 ms ascensão | 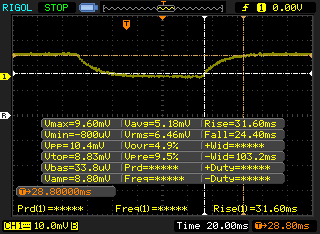 |
| ↘ 24.4 ms queda | ||
| A tela mostra taxas de resposta lentas em nossos testes e será insatisfatória para os jogadores. Em comparação, todos os dispositivos testados variam de 0.165 (mínimo) a 636 (máximo) ms. » 93 % de todos os dispositivos são melhores. Isso significa que o tempo de resposta medido é pior que a média de todos os dispositivos testados (30.9 ms). | ||
Cintilação da tela / PWM (modulação por largura de pulso)
| Tela tremeluzindo/PWM detectado | 1667 Hz | ≤ 24 % configuração de brilho | 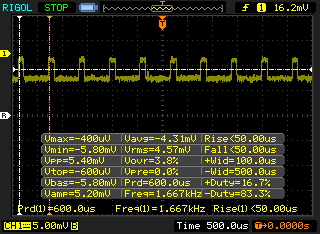 |
A luz de fundo da tela pisca em 1667 Hz (pior caso, por exemplo, utilizando PWM) Cintilação detectada em uma configuração de brilho de 24 % e abaixo. Não deve haver cintilação ou PWM acima desta configuração de brilho. A frequência de 1667 Hz é bastante alta, então a maioria dos usuários sensíveis ao PWM não deve notar nenhuma oscilação. [pwm_comparison] Em comparação: 52 % de todos os dispositivos testados não usam PWM para escurecer a tela. Se PWM foi detectado, uma média de 7748 (mínimo: 5 - máximo: 343500) Hz foi medida. | |||
| wPrime 2.10 - 1024m | |
| Dell Latitude 7400 2-in-1 | |
| Média Intel Core i7-8665U (n=1) | |
| Asus Zenbook 14 UX433FA-A6018T | |
| Média da turma Convertible (262 - 547, n=4, últimos 2 anos) | |
| Dell Inspiron 14 5000 5482 2-in-1 | |
* ... menor é melhor
| PCMark 8 Home Score Accelerated v2 | 3550 pontos | |
| PCMark 8 Work Score Accelerated v2 | 4743 pontos | |
| PCMark 10 Score | 4060 pontos | |
Ajuda | ||
| Dell Latitude 7400 2-in-1 Toshiba XG6 KXG60ZNV512G | Asus ZenBook Flip 14 UX461UA SanDisk SD8SN8U256G1002 | HP Elitebook x360 1040 G5 Samsung SSD PM981 MZVLB512HAJQ | Lenovo ThinkPad X1 Carbon G6-20KG0025UK Lenovo LENSE20256GMSP34MEAT2TA | |
|---|---|---|---|---|
| AS SSD | -27% | 136% | 29% | |
| Seq Read (MB/s) | 2289 | 459.9 -80% | 1816 -21% | 2365 3% |
| Seq Write (MB/s) | 1163 | 388.2 -67% | 1270 9% | 1220 5% |
| 4K Read (MB/s) | 22.29 | 26.93 21% | 46.25 107% | 35.67 60% |
| 4K Write (MB/s) | 28.92 | 50.7 75% | 104.1 260% | 87.6 203% |
| 4K-64 Read (MB/s) | 415.6 | 368.3 -11% | 1342 223% | 446.1 7% |
| 4K-64 Write (MB/s) | 199.5 | 146.4 -27% | 1209 506% | 195.8 -2% |
| Access Time Read * (ms) | 0.122 | 0.123 -1% | 0.043 65% | 0.108 11% |
| Access Time Write * (ms) | 0.143 | 0.086 40% | 0.035 76% | 0.144 -1% |
| Score Read (Points) | 667 | 441 -34% | 1569 135% | 718 8% |
| Score Write (Points) | 345 | 236 -32% | 1440 317% | 405 17% |
| Score Total (Points) | 1300 | 908 -30% | 3790 192% | 1443 11% |
| Copy ISO MB/s (MB/s) | 1767 | 324.1 -82% | 2034 15% | |
| Copy Program MB/s (MB/s) | 379.4 | 118.6 -69% | 450.3 19% | |
| Copy Game MB/s (MB/s) | 1055 | 186.1 -82% | 1024 -3% | |
| CrystalDiskMark 5.2 / 6 | 30% | 168% | 122% | |
| Write 4K (MB/s) | 35.06 | 52.4 49% | 122.7 250% | 116.4 232% |
| Read 4K (MB/s) | 23.64 | 27.91 18% | 46.57 97% | 45.75 94% |
| Write Seq (MB/s) | 1537 | 428.2 -72% | 1725 12% | 455.1 -70% |
| Read Seq (MB/s) | 1782 | 435.9 -76% | 2392 34% | 1818 2% |
| Write 4K Q32T1 (MB/s) | 100.3 | 246 145% | 470.6 369% | 248.9 148% |
| Read 4K Q32T1 (MB/s) | 62.7 | 255.6 308% | 313.2 400% | 358 471% |
| Write Seq Q32T1 (MB/s) | 2698 | 455.6 -83% | 1869 -31% | 1191 -56% |
| Read Seq Q32T1 (MB/s) | 1073 | 554 -48% | 3380 215% | 2755 157% |
| Média Total (Programa/Configurações) | 2% /
-6% | 152% /
148% | 76% /
68% |
* ... menor é melhor

| 3DMark 06 Standard Score | 10985 pontos | |
| 3DMark 11 Performance | 1964 pontos | |
| 3DMark Cloud Gate Standard Score | 8781 pontos | |
| 3DMark Fire Strike Score | 1133 pontos | |
Ajuda | ||
| baixo | média | alto | ultra | |
|---|---|---|---|---|
| BioShock Infinite (2013) | 56 | 34 | 28 | 17 |
Barulho
| Ocioso |
| 28.2 / 28.2 / 28.3 dB |
| Carga |
| 28.2 / 28.8 dB |
 | ||
30 dB silencioso 40 dB(A) audível 50 dB(A) ruidosamente alto |
||
min: | ||
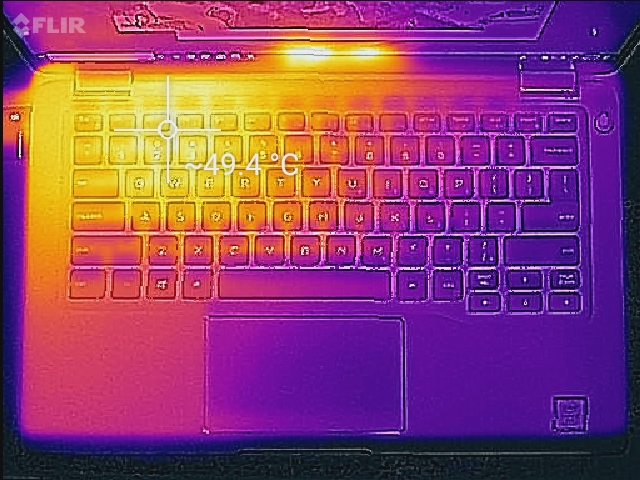
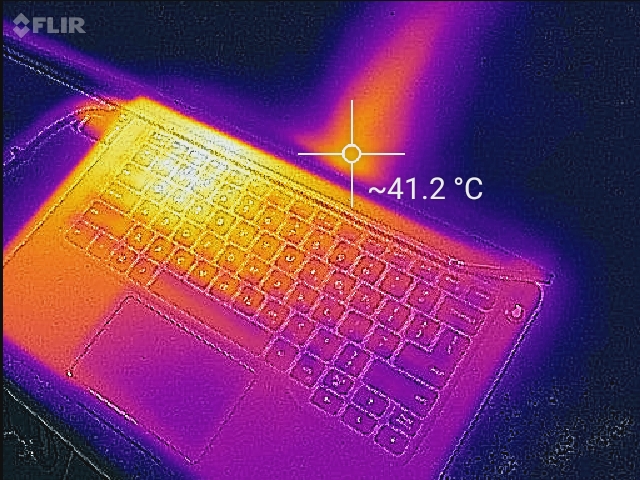
(-) A temperatura máxima no lado superior é 49.6 °C / 121 F, em comparação com a média de 35.4 °C / 96 F , variando de 19.6 a 60 °C para a classe Convertible.
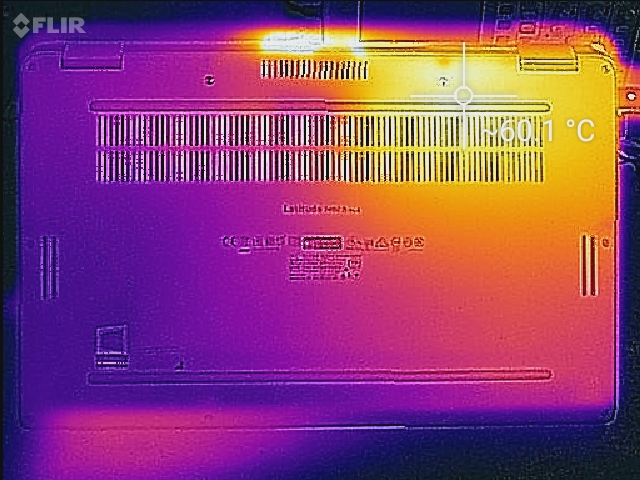
(-) A parte inferior aquece até um máximo de 60.2 °C / 140 F, em comparação com a média de 36.9 °C / 98 F
(+) Em uso inativo, a temperatura média para o lado superior é 21.5 °C / 71 F, em comparação com a média do dispositivo de 30.3 °C / ### class_avg_f### F.
(+) Os apoios para as mãos e o touchpad estão atingindo a temperatura máxima da pele (33.8 °C / 92.8 F) e, portanto, não estão quentes.
(-) A temperatura média da área do apoio para as mãos de dispositivos semelhantes foi 28 °C / 82.4 F (-5.8 °C / -10.4 F).
Dell Latitude 7400 2-in-1 análise de áudio
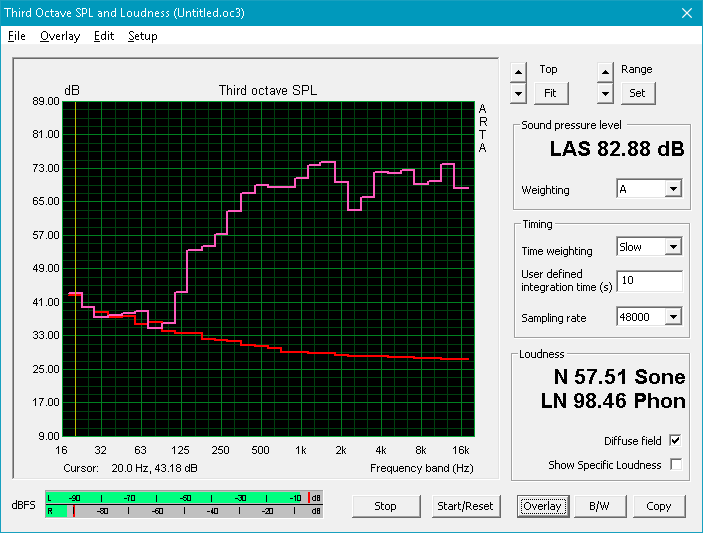
(+) | os alto-falantes podem tocar relativamente alto (###valor### dB)
Graves 100 - 315Hz
(-) | quase nenhum baixo - em média 17.3% menor que a mediana
(±) | a linearidade dos graves é média (11.7% delta para a frequência anterior)
Médios 400 - 2.000 Hz
(+) | médios equilibrados - apenas 2% longe da mediana
(+) | médios são lineares (5.3% delta para frequência anterior)
Altos 2 - 16 kHz
(+) | agudos equilibrados - apenas 2.9% longe da mediana
(±) | a linearidade dos máximos é média (7.3% delta para frequência anterior)
Geral 100 - 16.000 Hz
(±) | a linearidade do som geral é média (17.3% diferença em relação à mediana)
Comparado com a mesma classe
» 33% de todos os dispositivos testados nesta classe foram melhores, 8% semelhantes, 59% piores
» O melhor teve um delta de 6%, a média foi 20%, o pior foi 57%
Comparado com todos os dispositivos testados
» 33% de todos os dispositivos testados foram melhores, 8% semelhantes, 59% piores
» O melhor teve um delta de 4%, a média foi 23%, o pior foi 134%
HP Elitebook x360 1040 G5 análise de áudio
(±) | o volume do alto-falante é médio, mas bom (###valor### dB)
Graves 100 - 315Hz
(±) | graves reduzidos - em média 11.3% menor que a mediana
(±) | a linearidade dos graves é média (13.7% delta para a frequência anterior)
Médios 400 - 2.000 Hz
(+) | médios equilibrados - apenas 3.2% longe da mediana
(+) | médios são lineares (4.8% delta para frequência anterior)
Altos 2 - 16 kHz
(+) | agudos equilibrados - apenas 3.6% longe da mediana
(±) | a linearidade dos máximos é média (7.2% delta para frequência anterior)
Geral 100 - 16.000 Hz
(+) | o som geral é linear (13.1% diferença em relação à mediana)
Comparado com a mesma classe
» 7% de todos os dispositivos testados nesta classe foram melhores, 2% semelhantes, 91% piores
» O melhor teve um delta de 7%, a média foi 21%, o pior foi 53%
Comparado com todos os dispositivos testados
» 13% de todos os dispositivos testados foram melhores, 3% semelhantes, 84% piores
» O melhor teve um delta de 4%, a média foi 23%, o pior foi 134%
| desligado | |
| Ocioso | |
| Carga |
|
Key:
min: | |
| Dell Latitude 7400 2-in-1 i7-8665U, UHD Graphics 620, Toshiba XG6 KXG60ZNV512G, IPS, 1920x1080, 14" | Lenovo ThinkPad X1 Yoga 2018-20LES01W00 i5-8550U, UHD Graphics 620, Samsung SSD PM981 MZVLB512HAJQ, IPS Dolby Vision HDR, 2560x1440, 14" | Asus ZenBook Flip 14 UX461UA i5-8250U, UHD Graphics 620, SanDisk SD8SN8U256G1002, IPS, 1920x1080, 14" | HP Elitebook x360 1040 G5 i7-8650U, UHD Graphics 620, Samsung SSD PM981 MZVLB512HAJQ, IPS, 1920x1080, 14" | Lenovo ThinkPad X1 Carbon G6-20KG0025UK i5-8350U, UHD Graphics 620, Lenovo LENSE20256GMSP34MEAT2TA, IPS, 1920x1080, 14" | |
|---|---|---|---|---|---|
| Power Consumption | -60% | -23% | -30% | -29% | |
| Idle Minimum * (Watt) | 2.6 | 3.4 -31% | 3.3 -27% | 2.7 -4% | 4.7 -81% |
| Idle Average * (Watt) | 4.3 | 8.8 -105% | 6.3 -47% | 6.5 -51% | 7.3 -70% |
| Idle Maximum * (Watt) | 5.5 | 11.9 -116% | 11 -100% | 11.5 -109% | 9.4 -71% |
| Load Average * (Watt) | 32 | 50.4 -58% | 30 6% | 38.7 -21% | 28 12% |
| Load Maximum * (Watt) | 78.8 | 71.2 10% | 35.4 55% | 50.5 36% | 28.2 64% |
* ... menor é melhor
| Dell Latitude 7400 2-in-1 i7-8665U, UHD Graphics 620, 78 Wh | HP Pavilion x360 14-cd0002ng i3-8130U, UHD Graphics 620, 41 Wh | Lenovo ThinkPad X1 Yoga 2018-20LES01W00 i5-8550U, UHD Graphics 620, 54 Wh | Asus ZenBook Flip 14 UX461UA i5-8250U, UHD Graphics 620, 57 Wh | HP Elitebook x360 1040 G5 i7-8650U, UHD Graphics 620, 56 Wh | Lenovo ThinkPad X1 Carbon G6-20KG0025UK i5-8350U, UHD Graphics 620, 57 Wh | |
|---|---|---|---|---|---|---|
| Duração da bateria | -39% | -30% | -23% | -15% | -15% | |
| WiFi v1.3 (h) | 12.2 | 7.4 -39% | 8.6 -30% | 9.4 -23% | 10.4 -15% | 10.4 -15% |
| Reader / Idle (h) | 12.7 | 20.1 | 18.9 | 27.9 | 24.5 | |
| Load (h) | 2.1 | 1.5 | 2.1 | 3.1 | 1.9 |
Pro
Contra
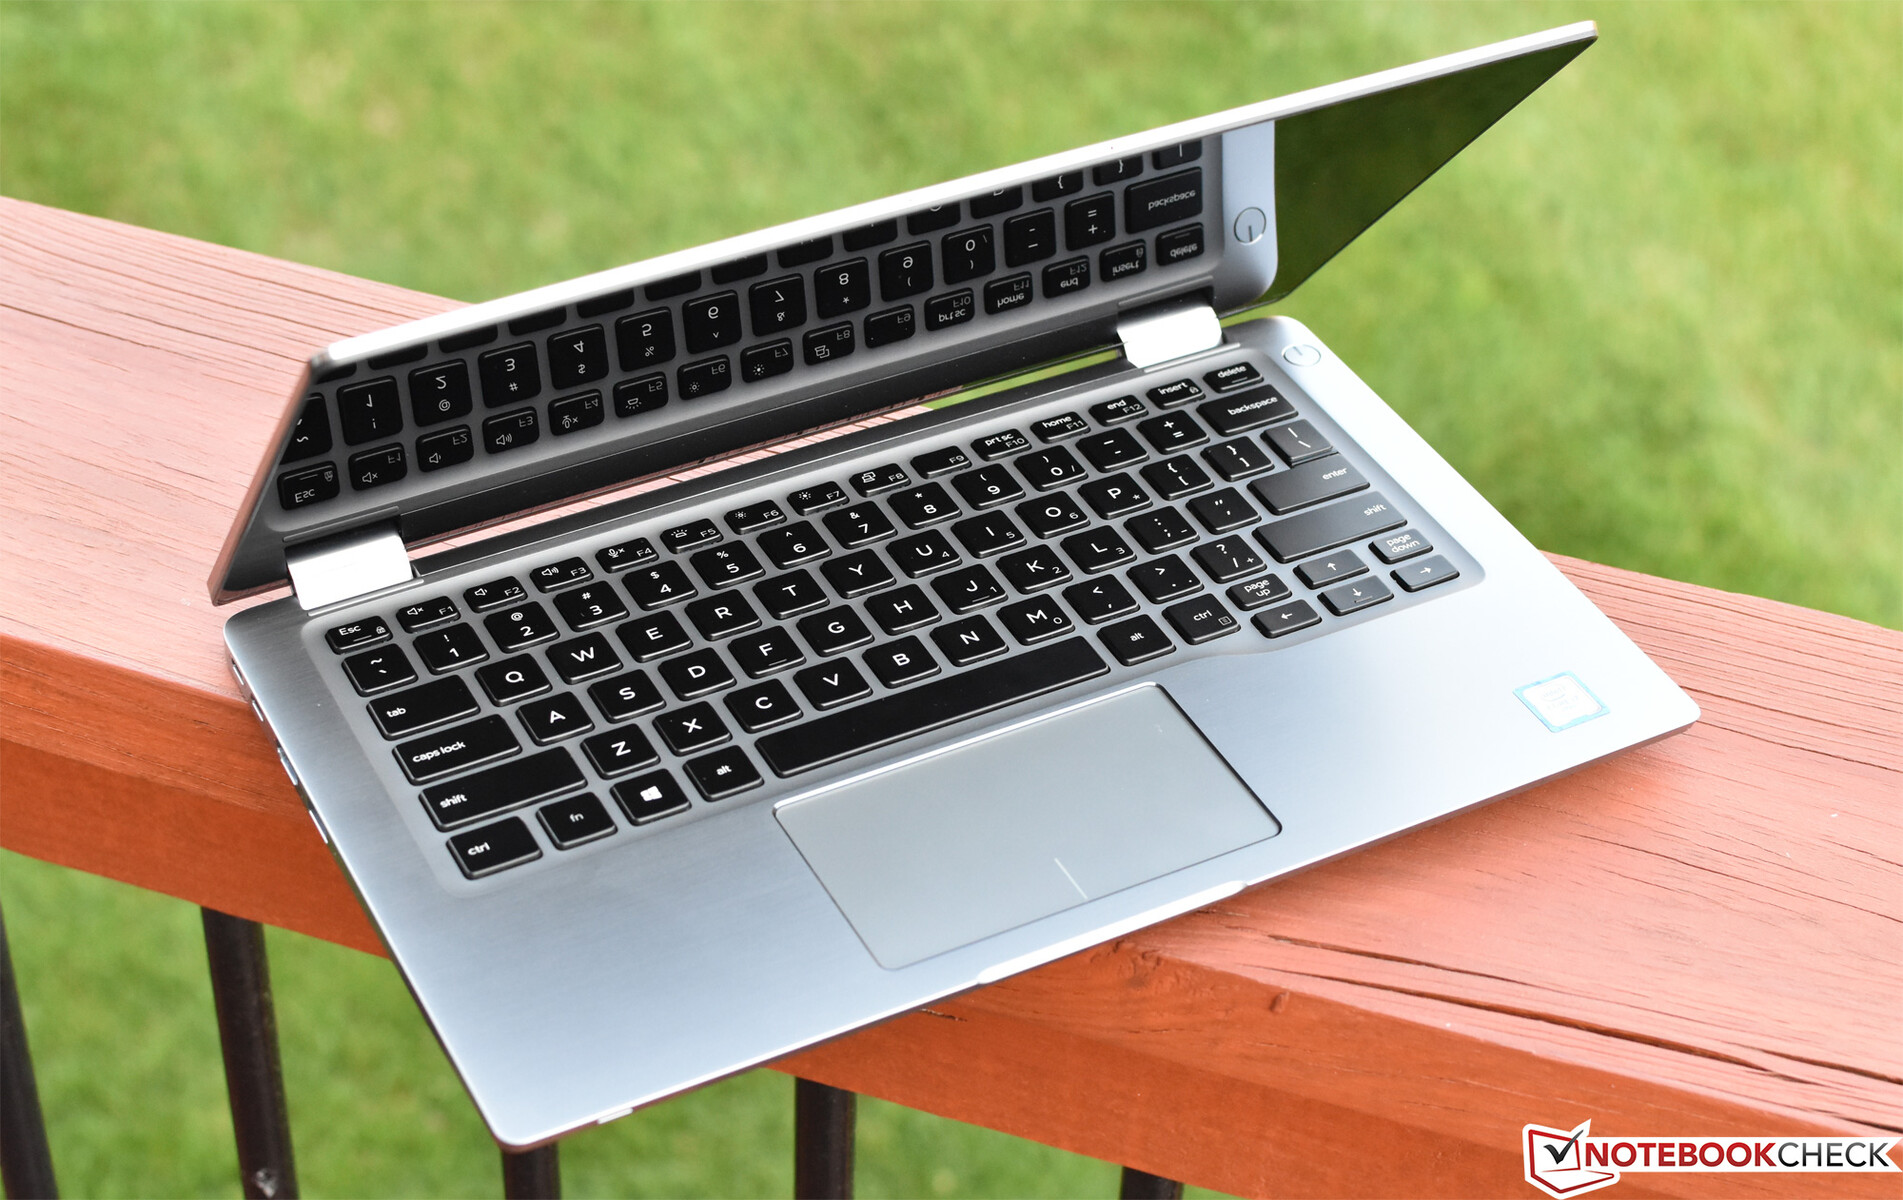
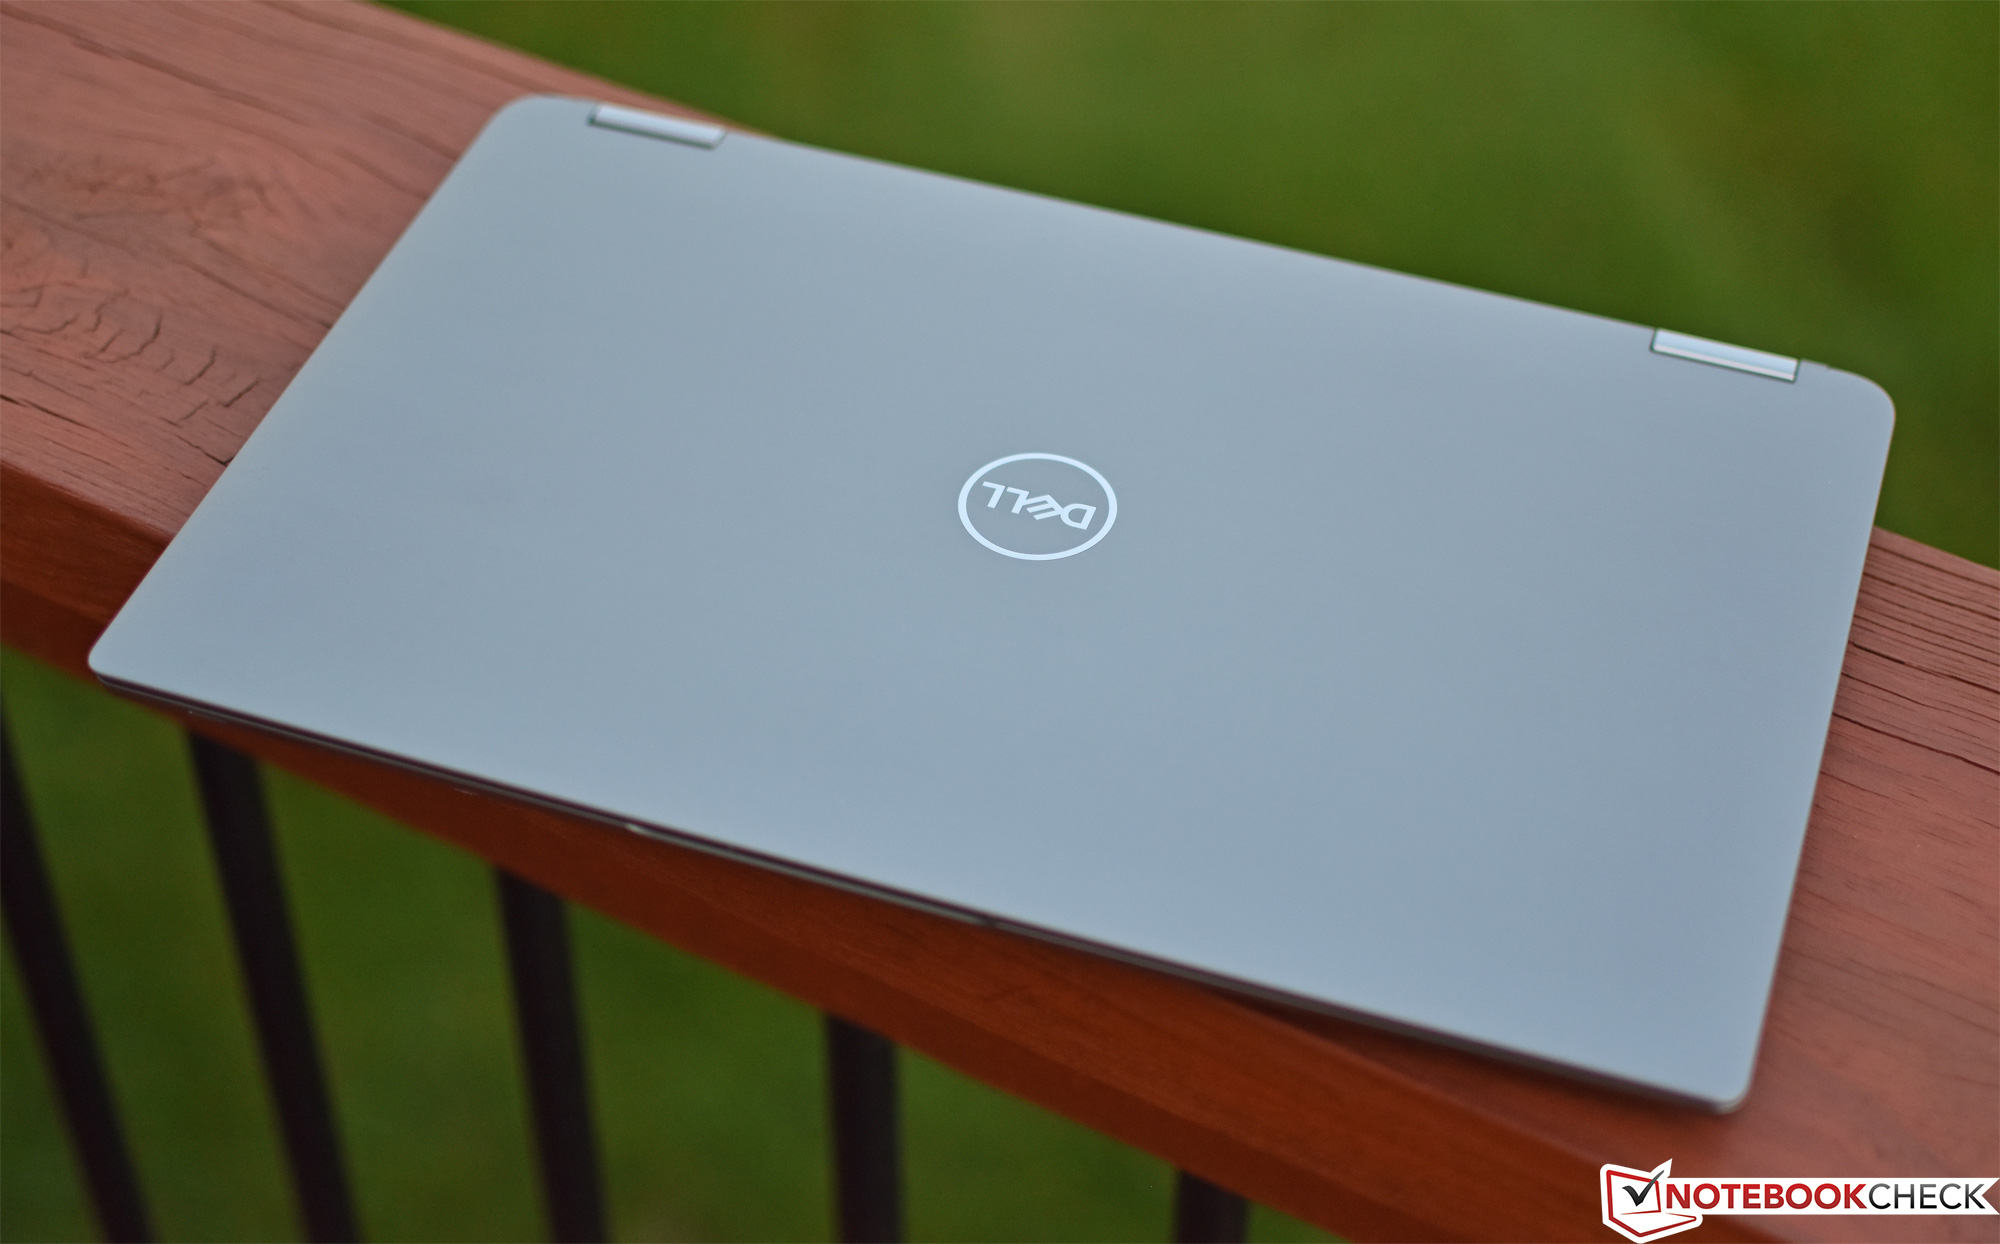
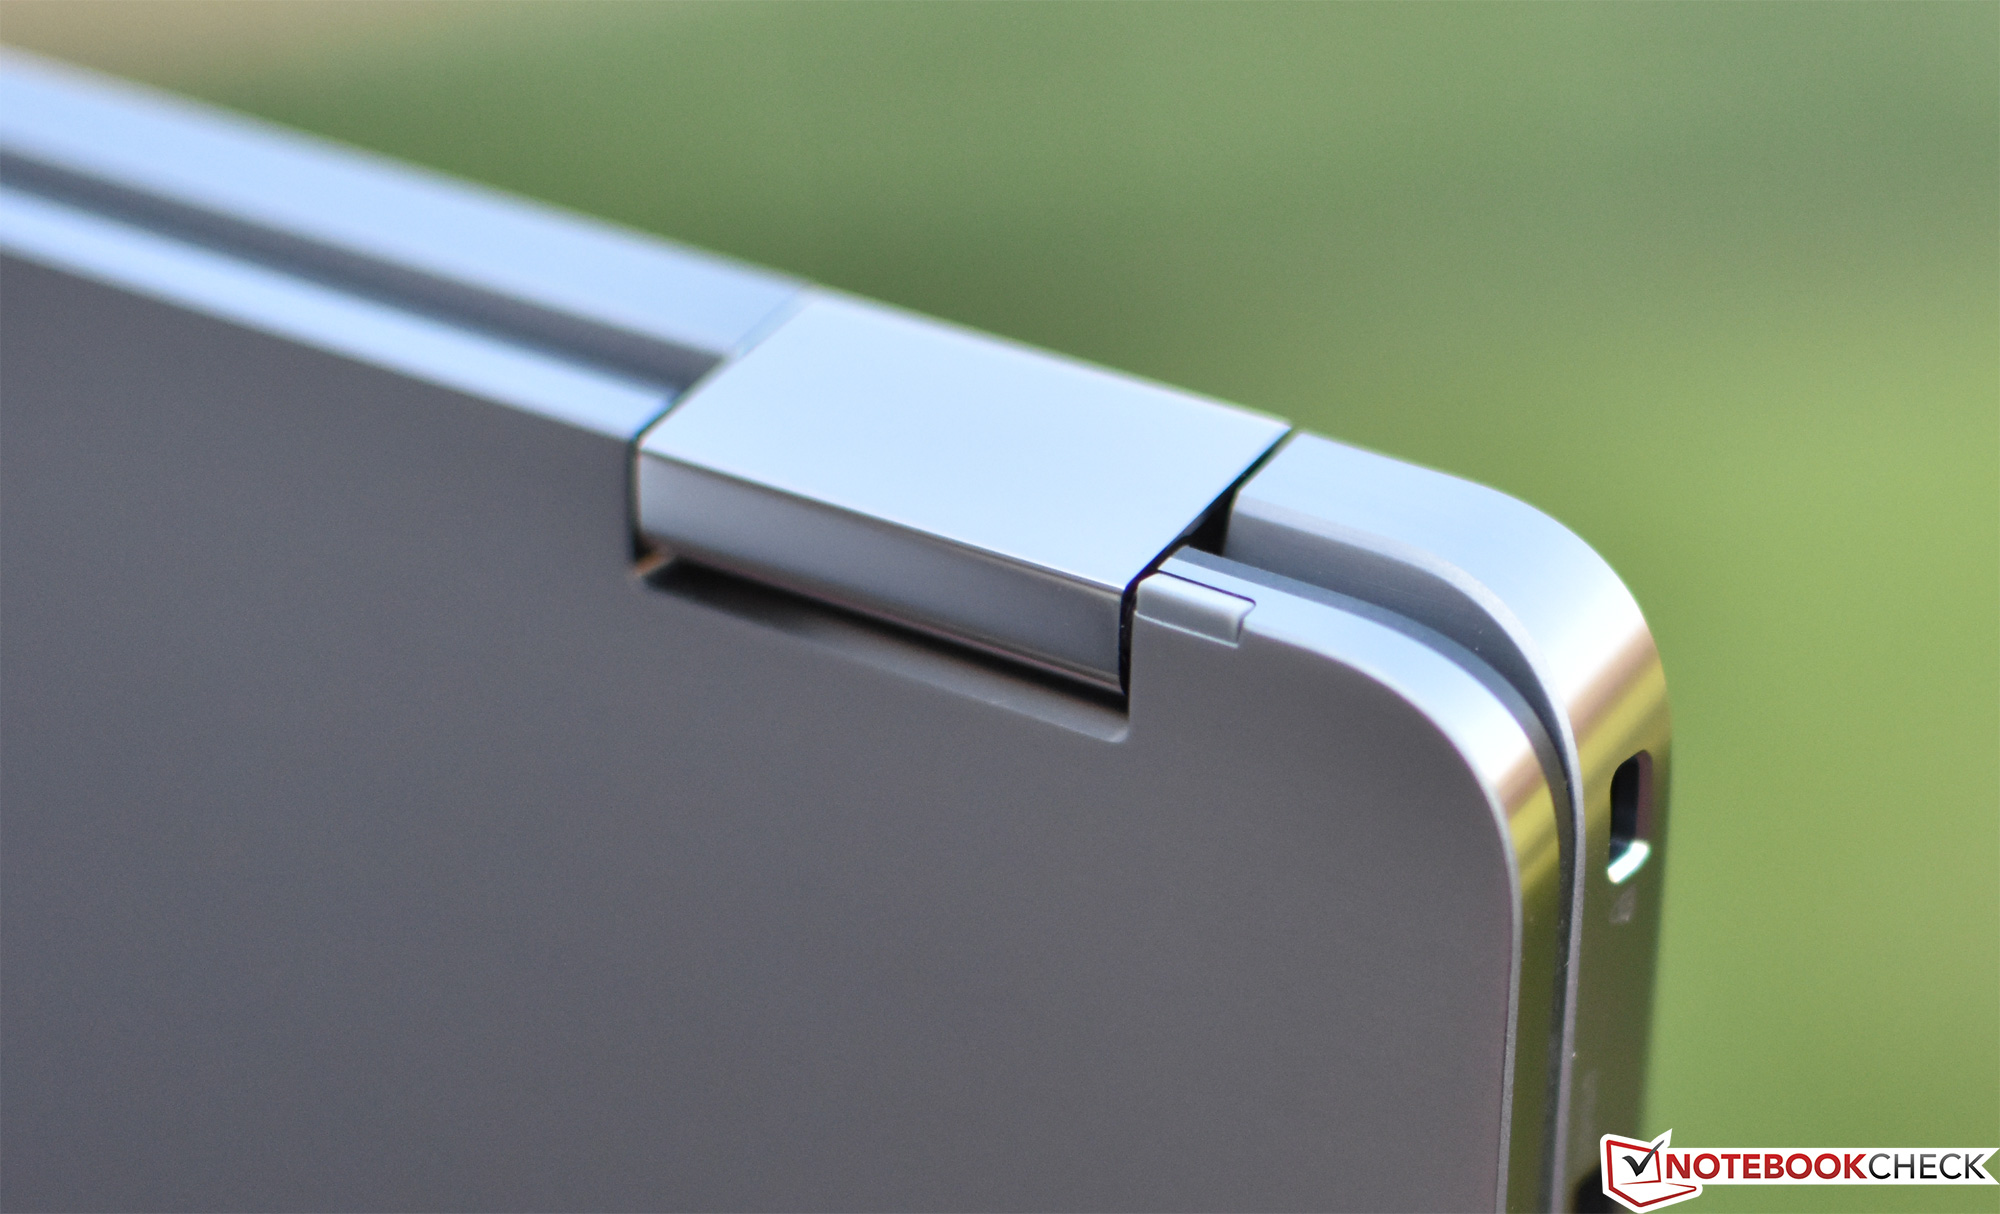
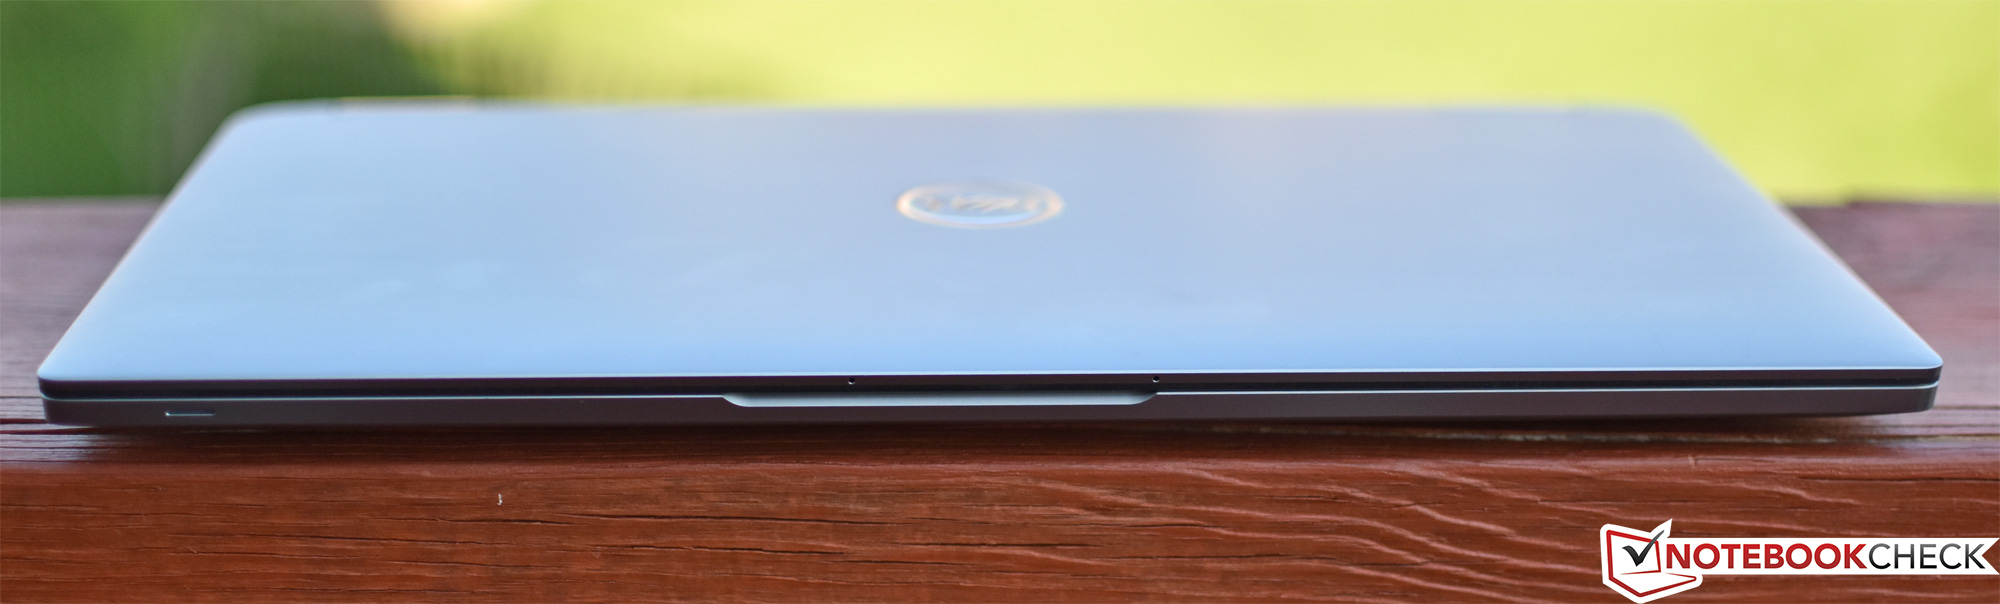
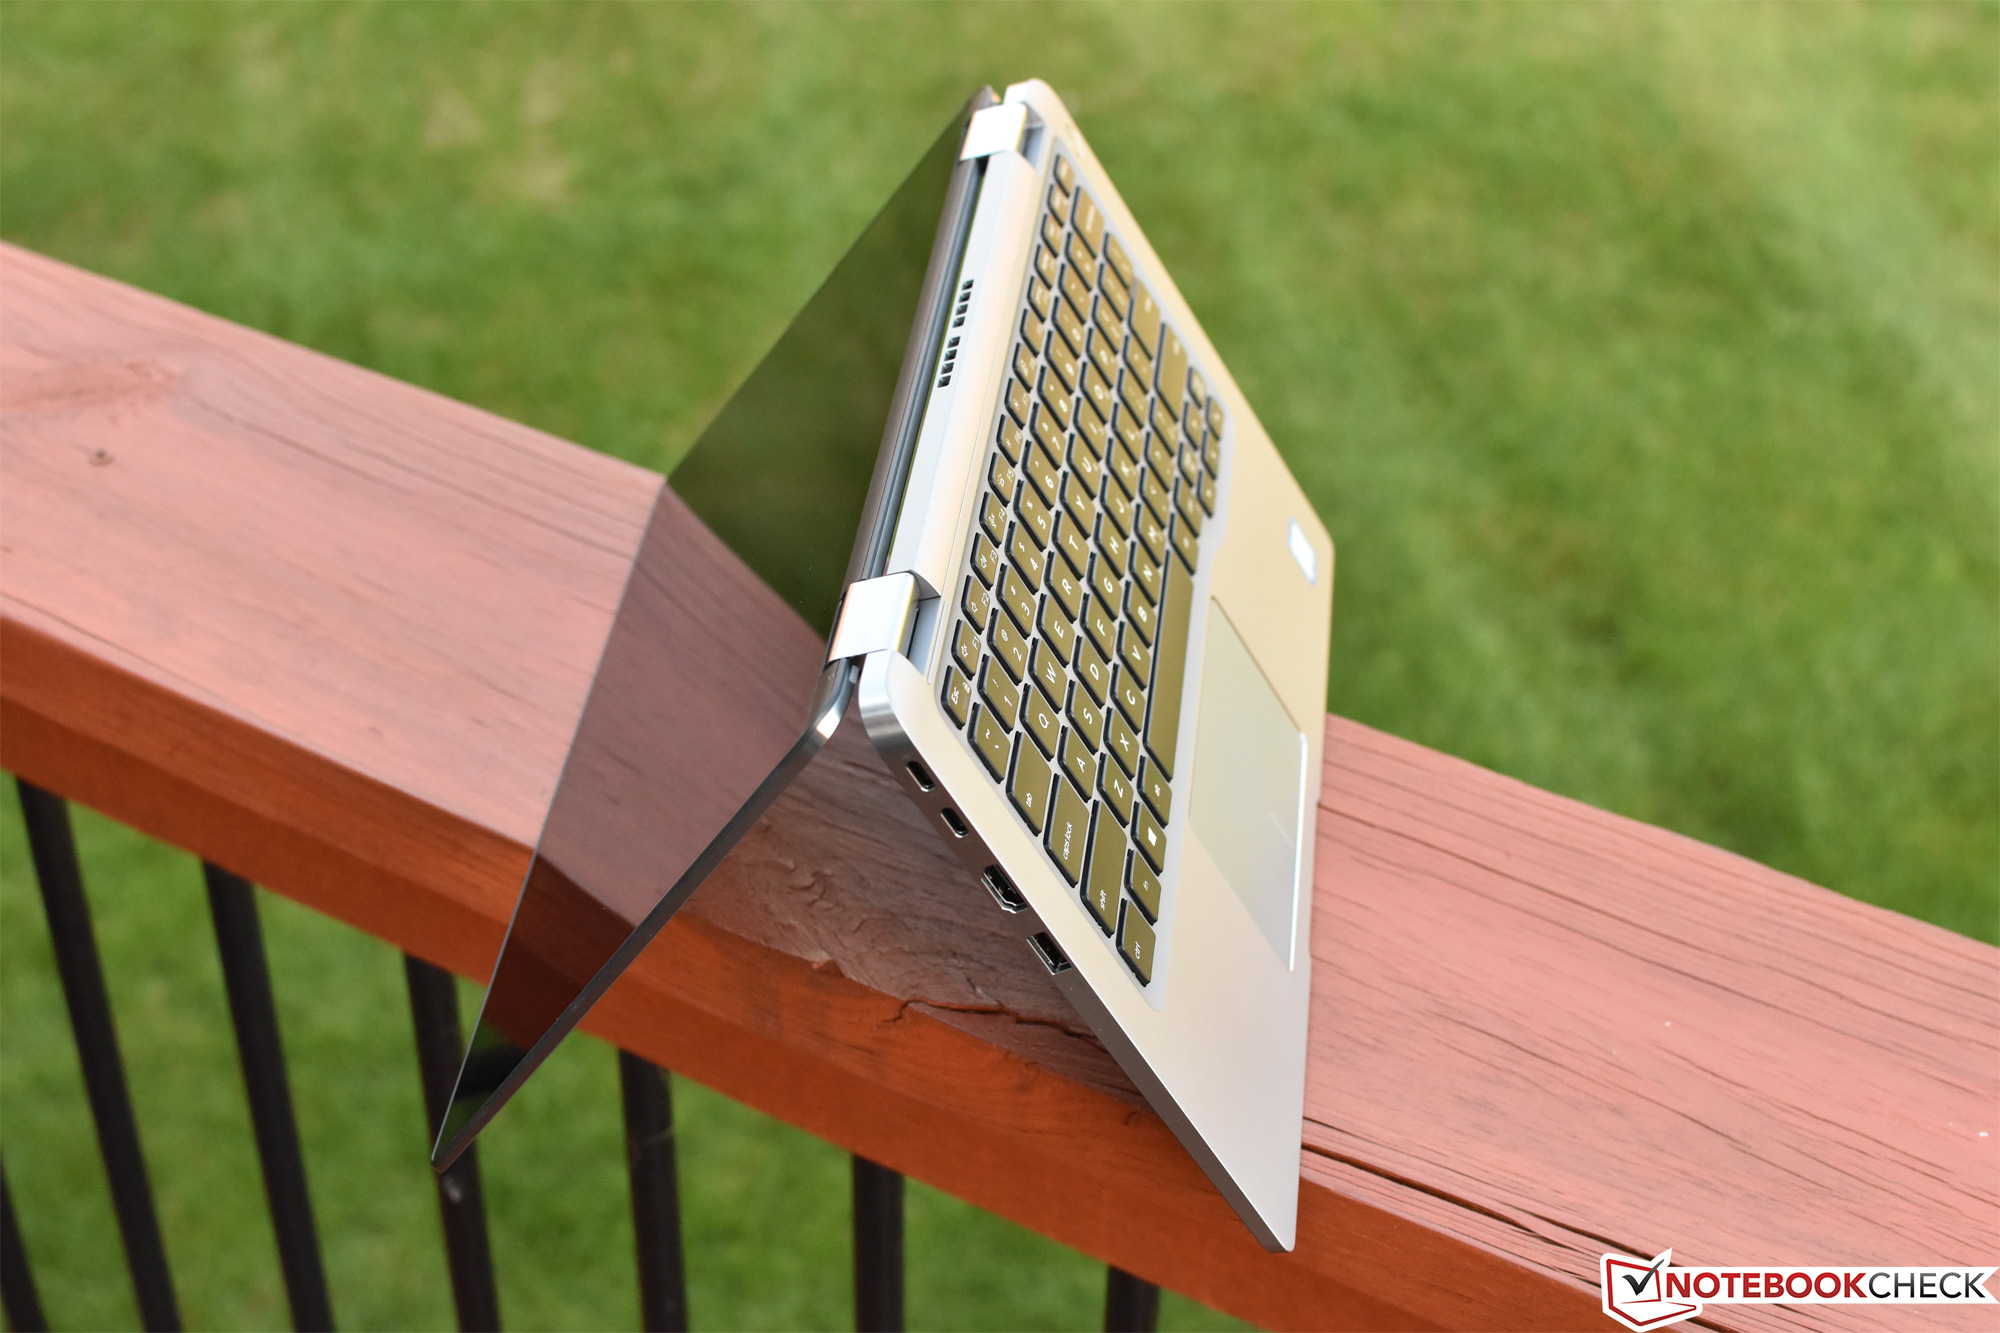
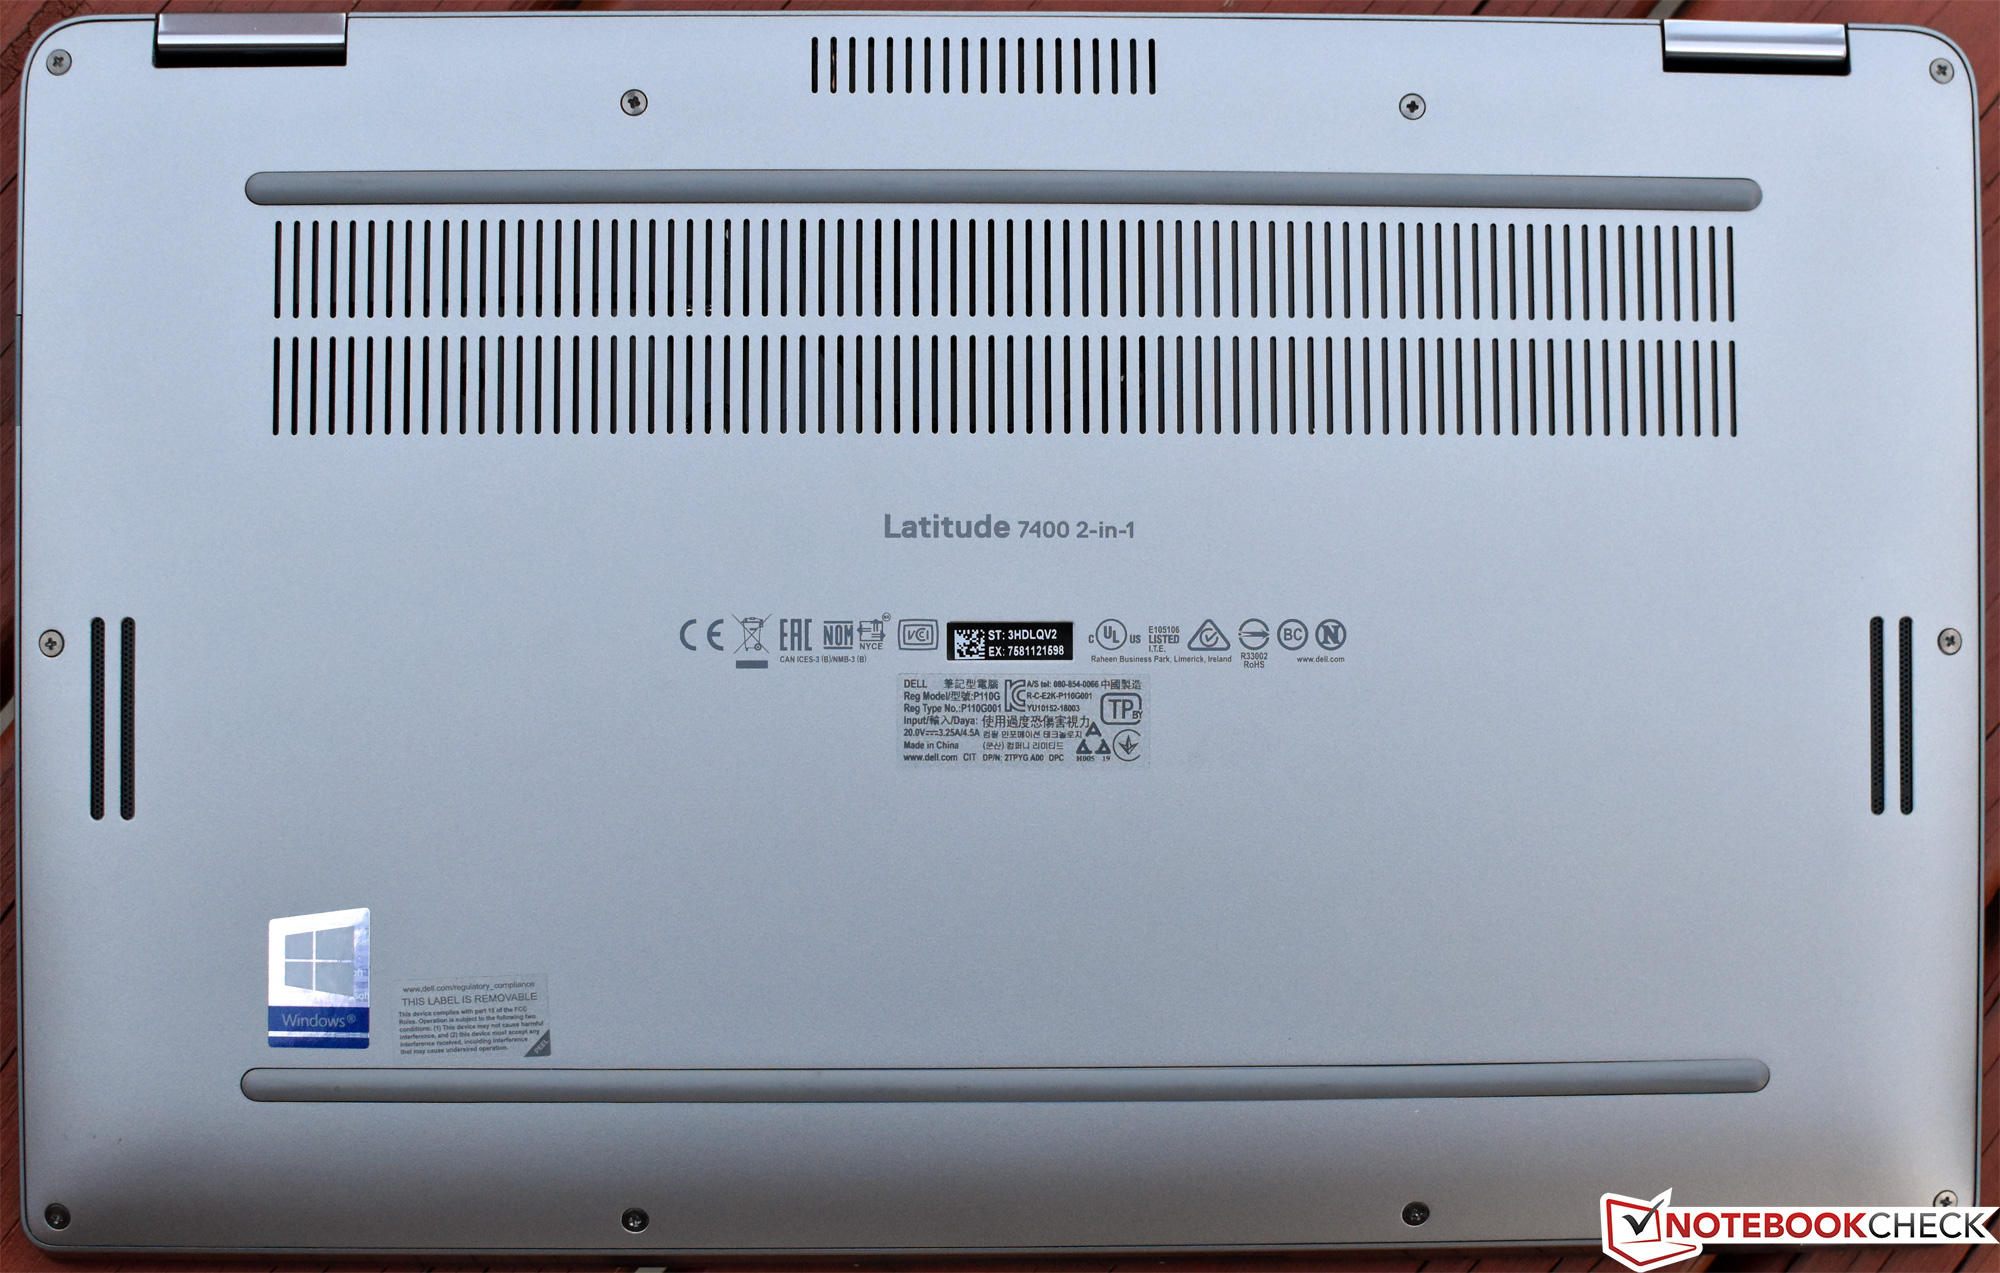
O Dell Latitude 7400 2-em-1 ($2.800 como testado) representa um passo importante em direção a uma filosofia de design diferente para os portáteis empresariais conversíveis do fabricante. Vamos começar com os prós e contras: sem dúvida, este é o Latitude mais atraente até hoje, com seu belo revestimento de alumínio escovado, bordas e cantos habilmente chanfrados por CNC e marcos super finos. Pode ser facilmente confundido com algo fora da linha de máquinas XPS.
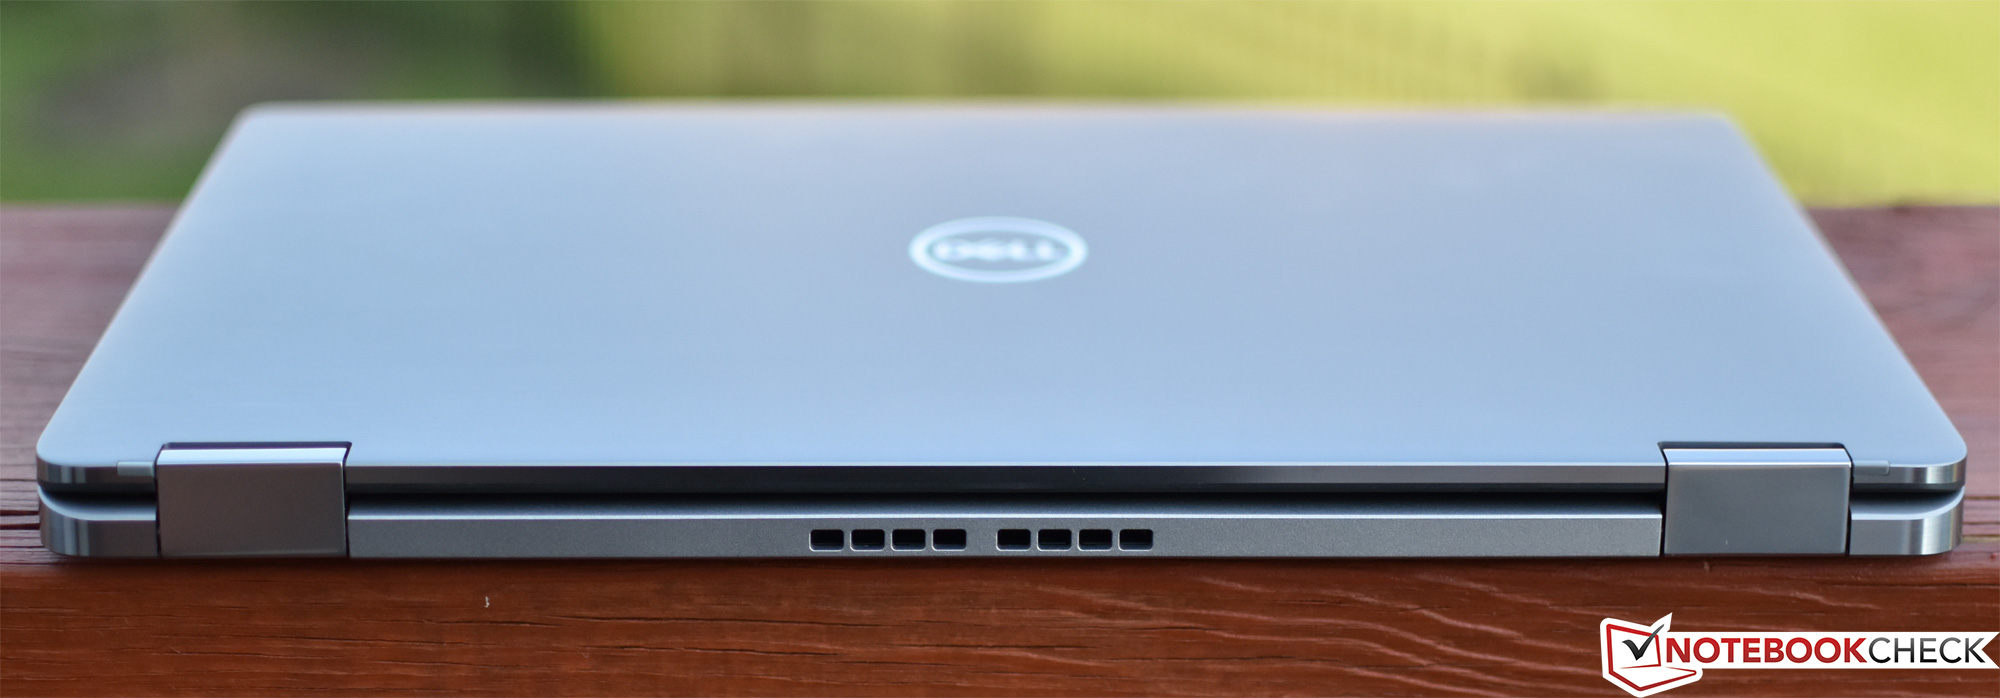
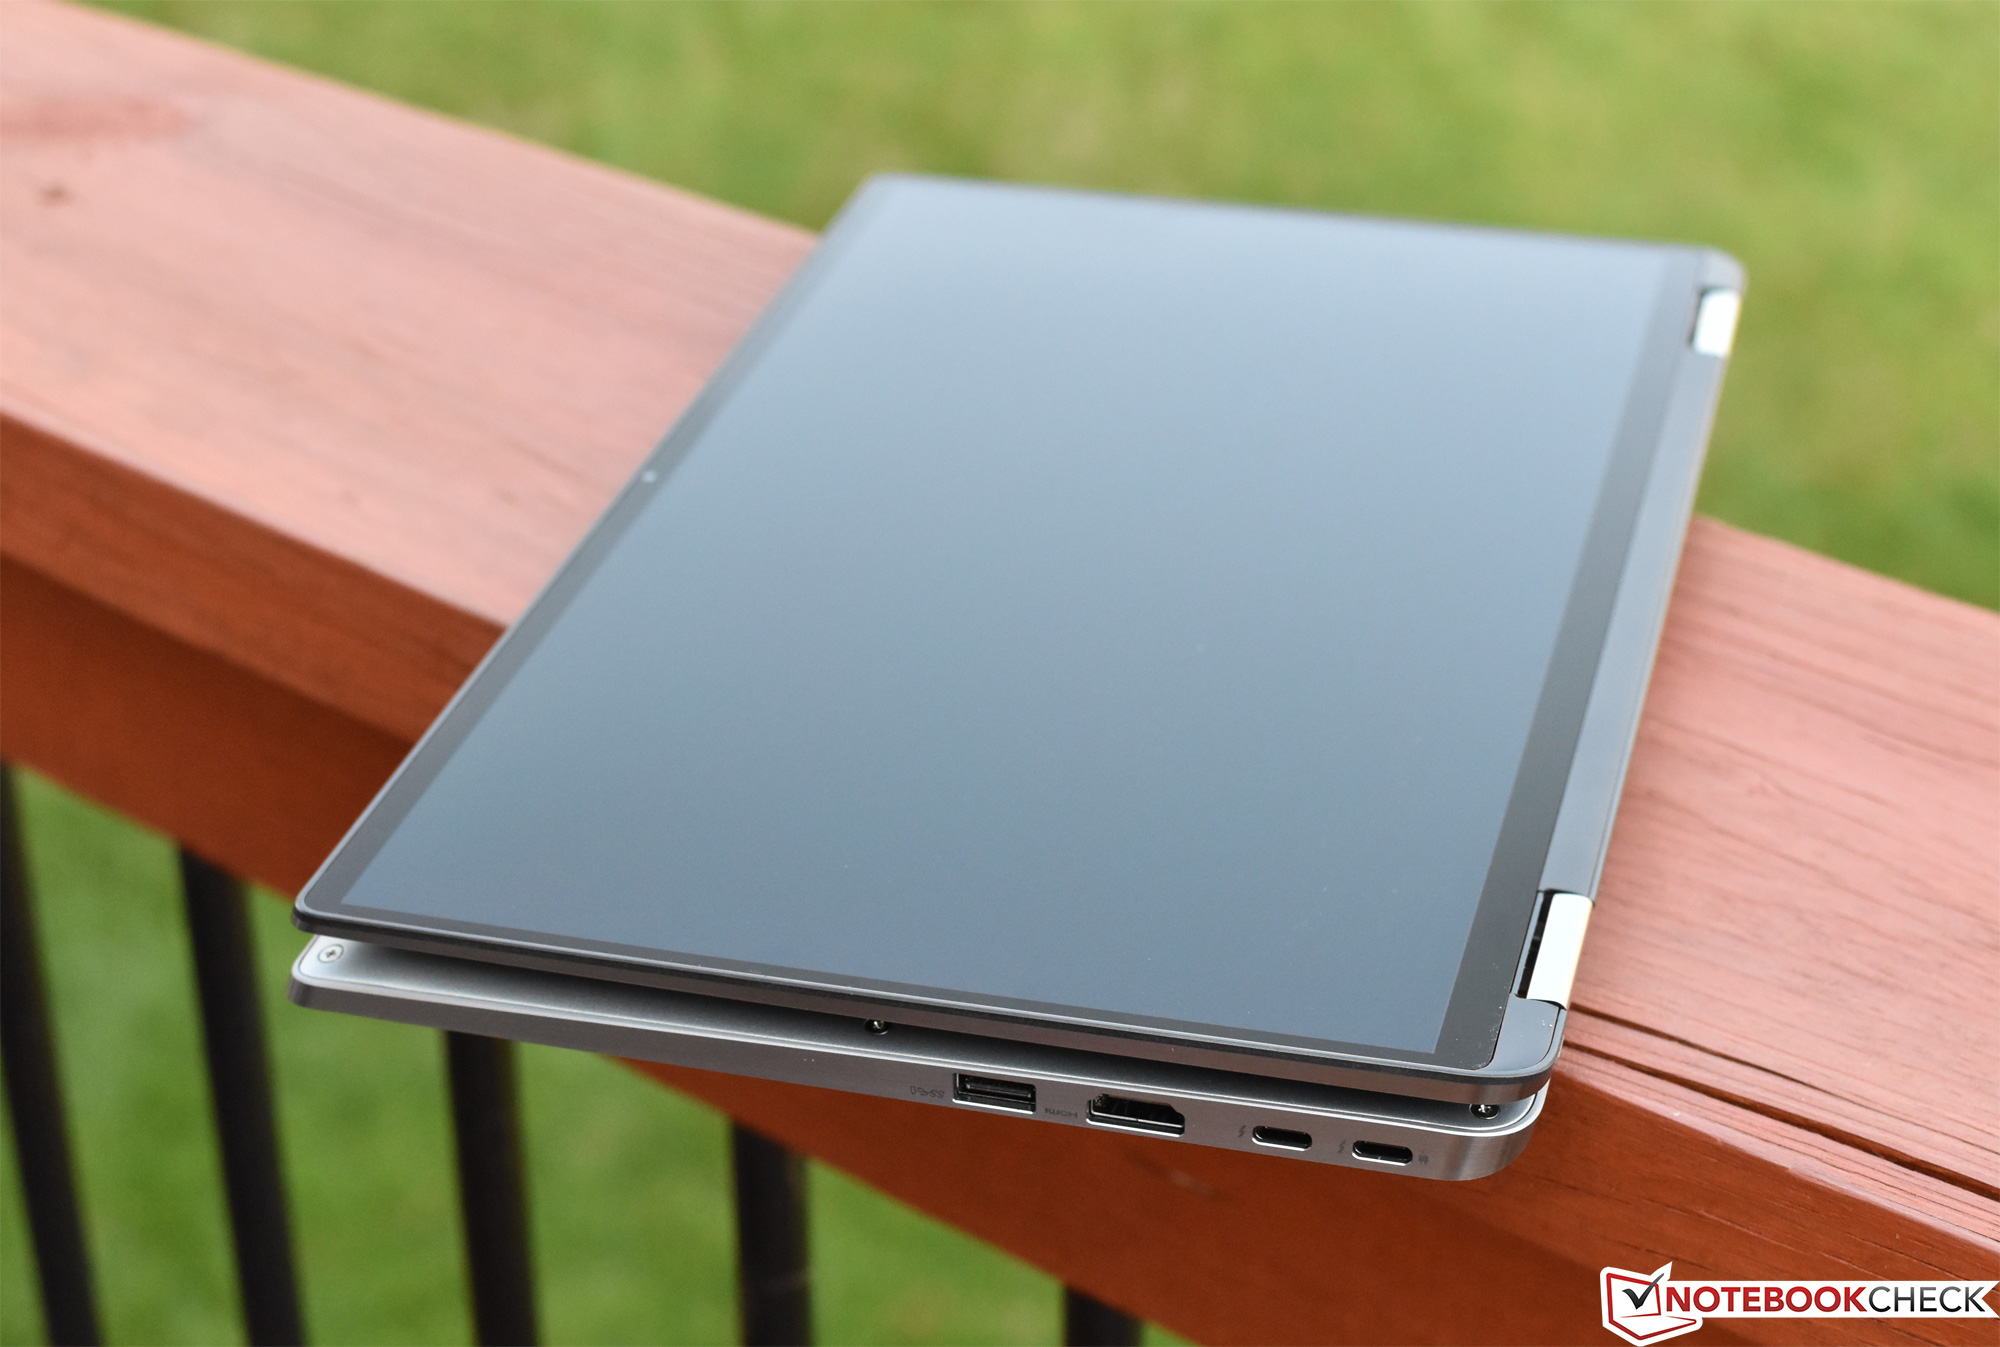
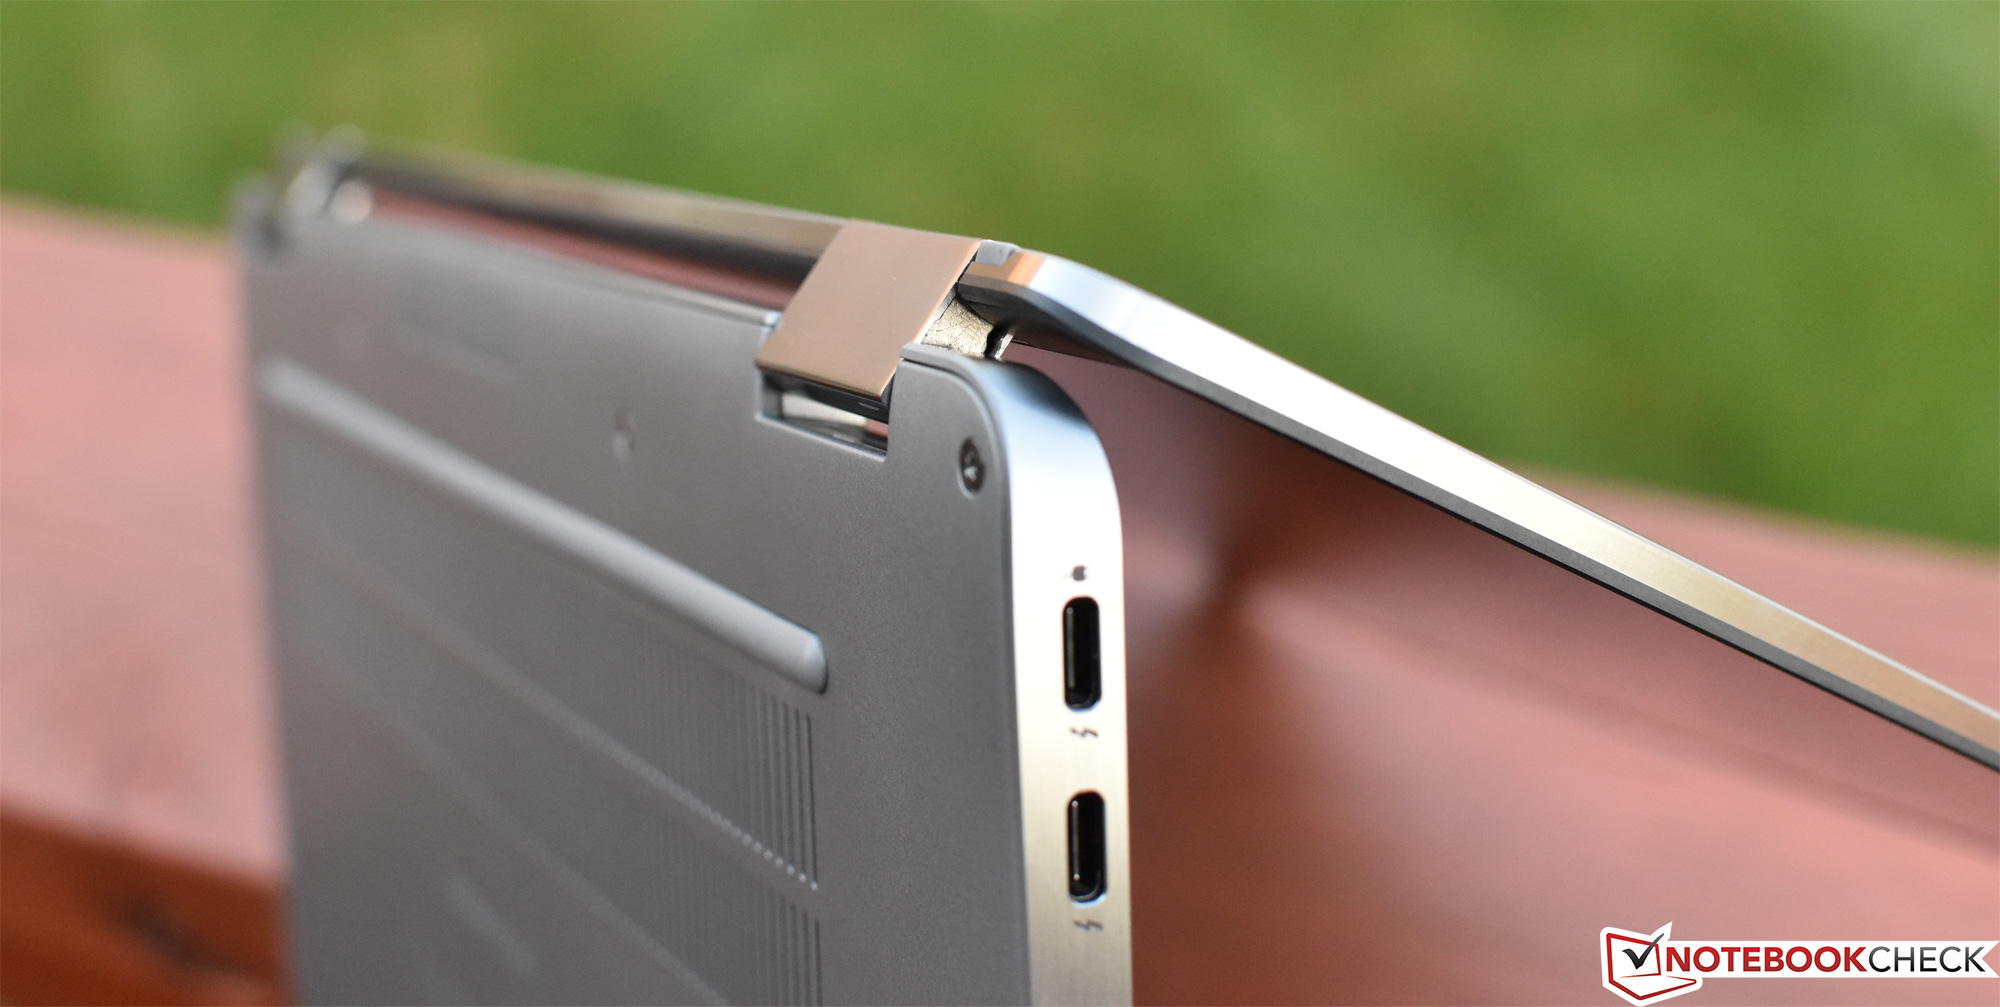
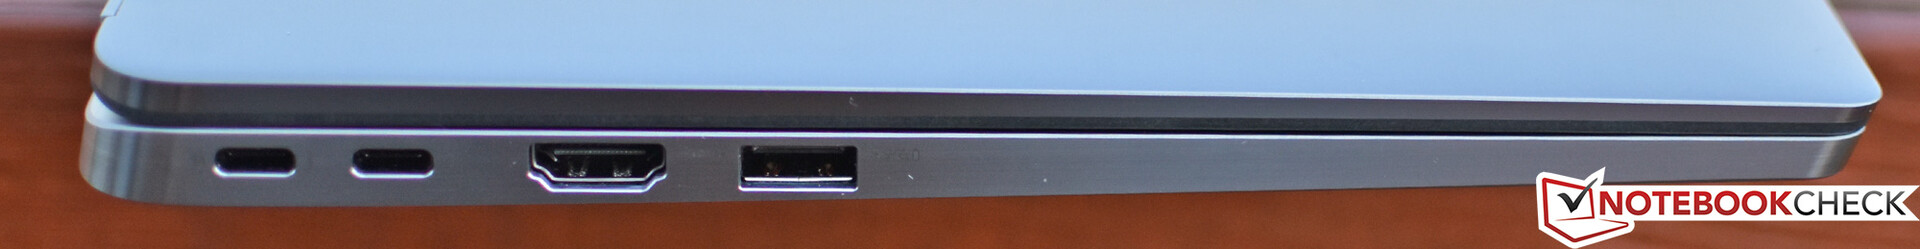
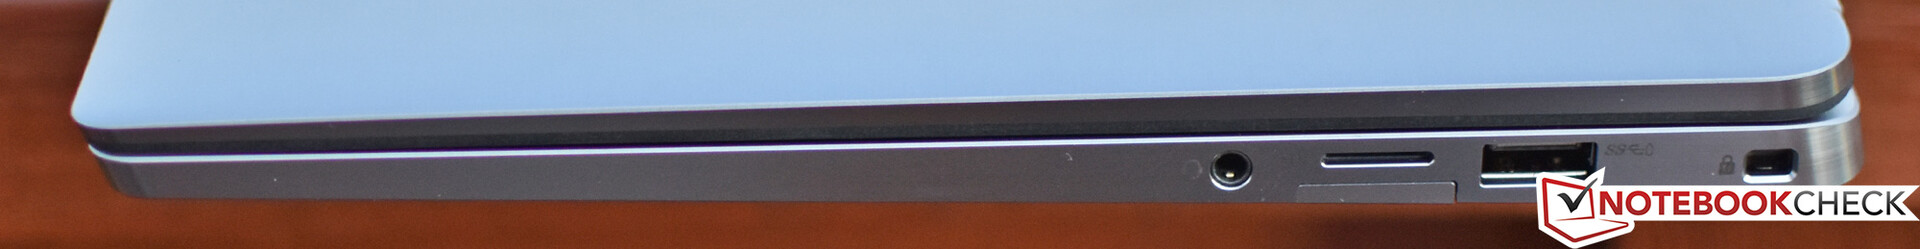
Mas ao longo de sua transição, o Latitude procura reter muitas das sensibilidades práticas empresariais que há muito são cruciais para o sucesso da marca: manutenção fácil, construção durável, longos tempos de duração de bateria, operação silenciosa e dispositivos de entrada premium. A seleção de portas foi um sucesso com a adoção de portas de carregamento USB Tipo-C/ThunderBolt 3 e a omissão da porta Ethernet, mas em geral o usuário médio de negócios terá mais do que precisa à sua disposição para trabalhar. O áudio foi amplamente melhorado em relação às máquinas Latitude anteriores. E, finalmente, os tempos de duração da bateria em nossa unidade de teste com 78 Wh são excelentes, durando facilmente um dia inteiro de trabalho sem a necessidade de ter um carregador na mão.
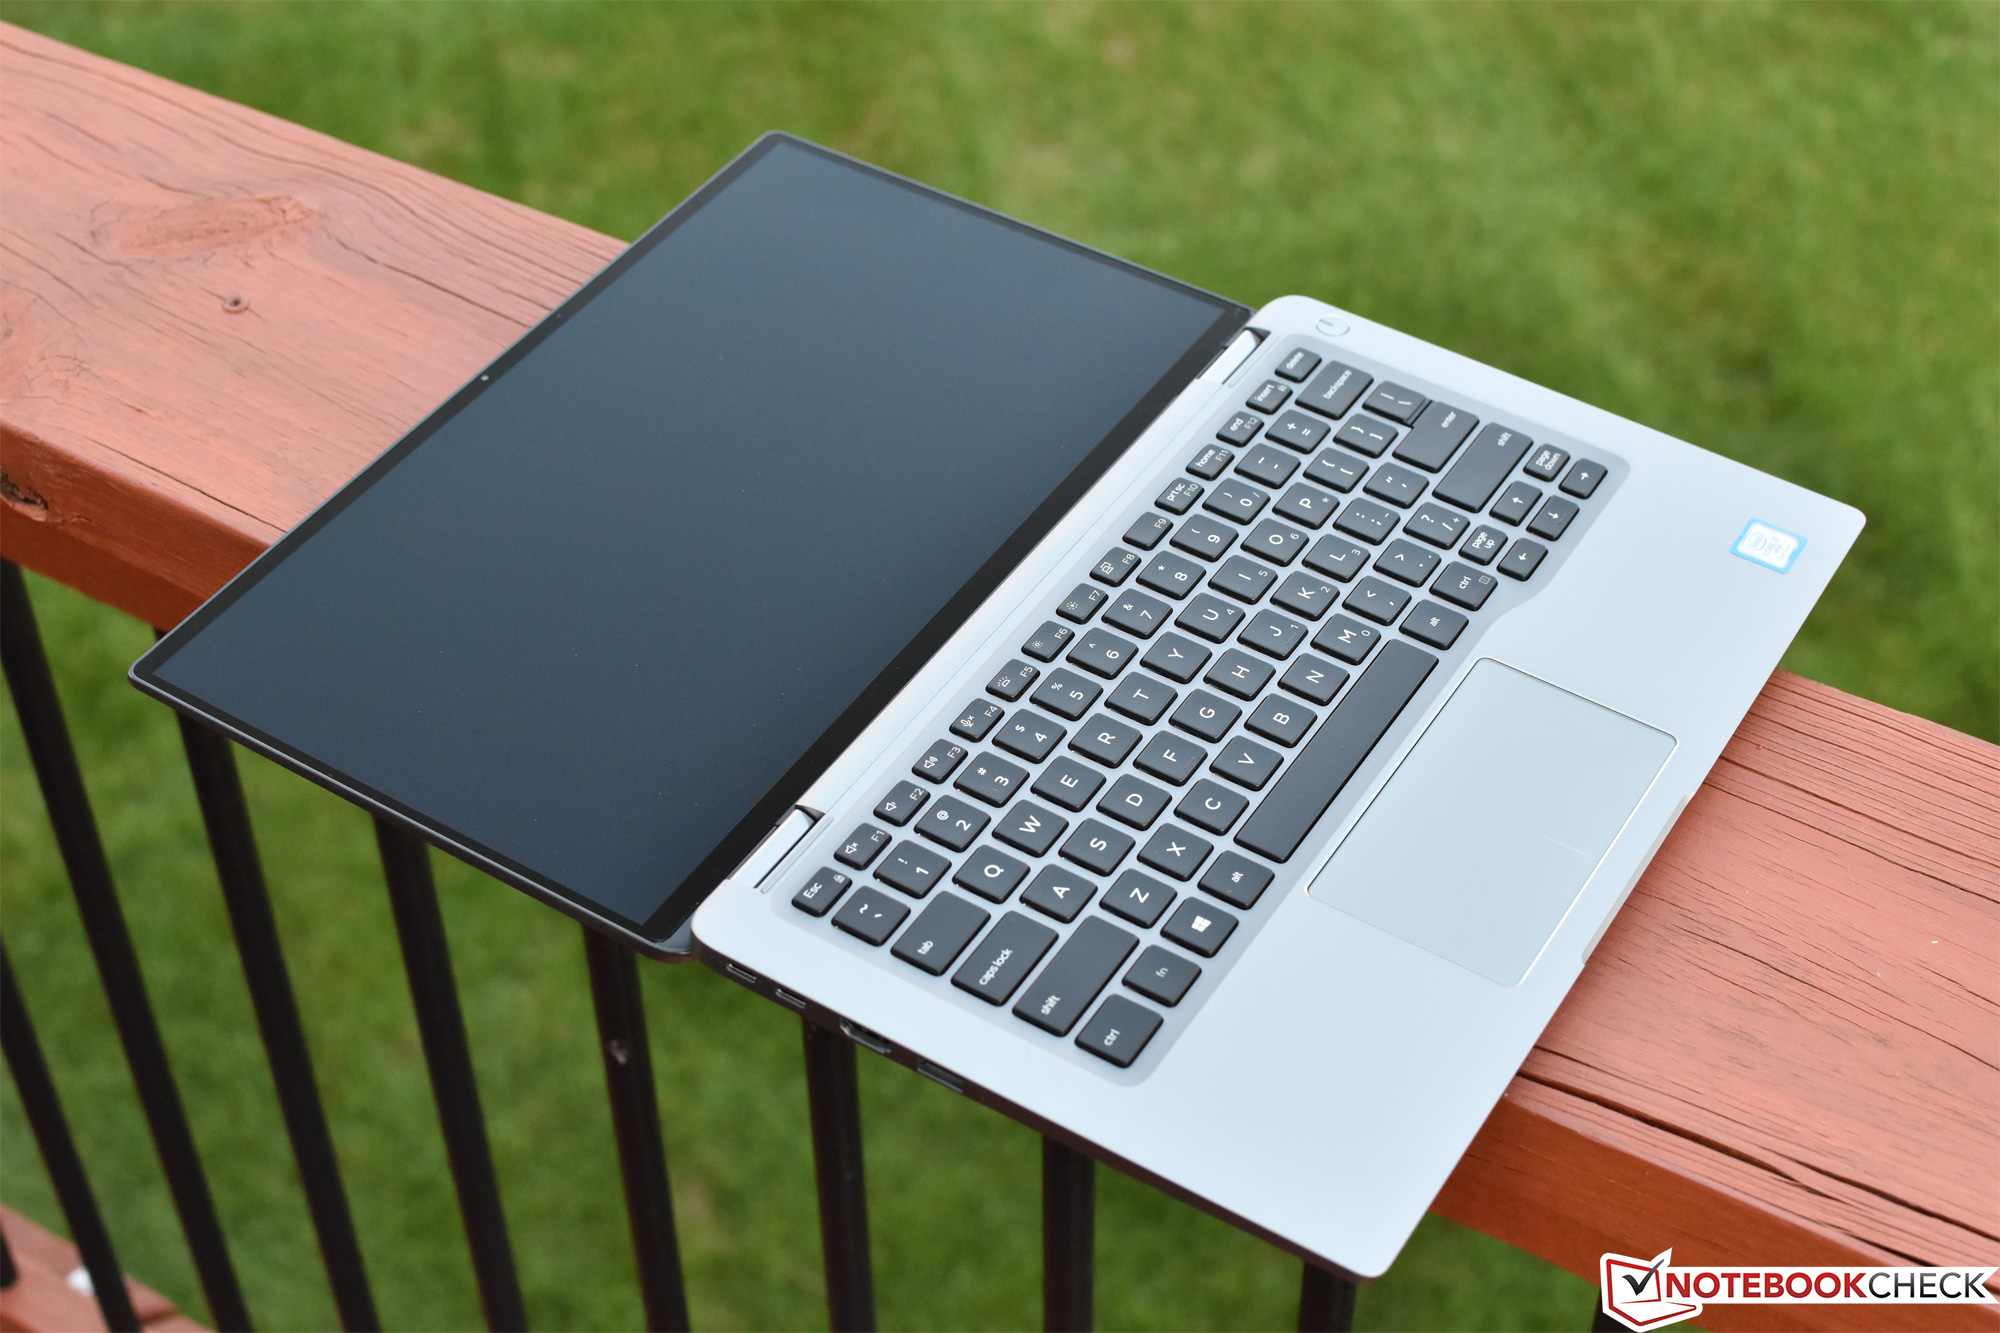
O Latitude 7400 2-in-1 é uma revisão ambiciosa dentro de um mercado em que as filosofias padrão são tipicamente conservadoras e incrementais. De certa forma, é uma aspirada de ar fresco (quente!), mas não sem problemas.
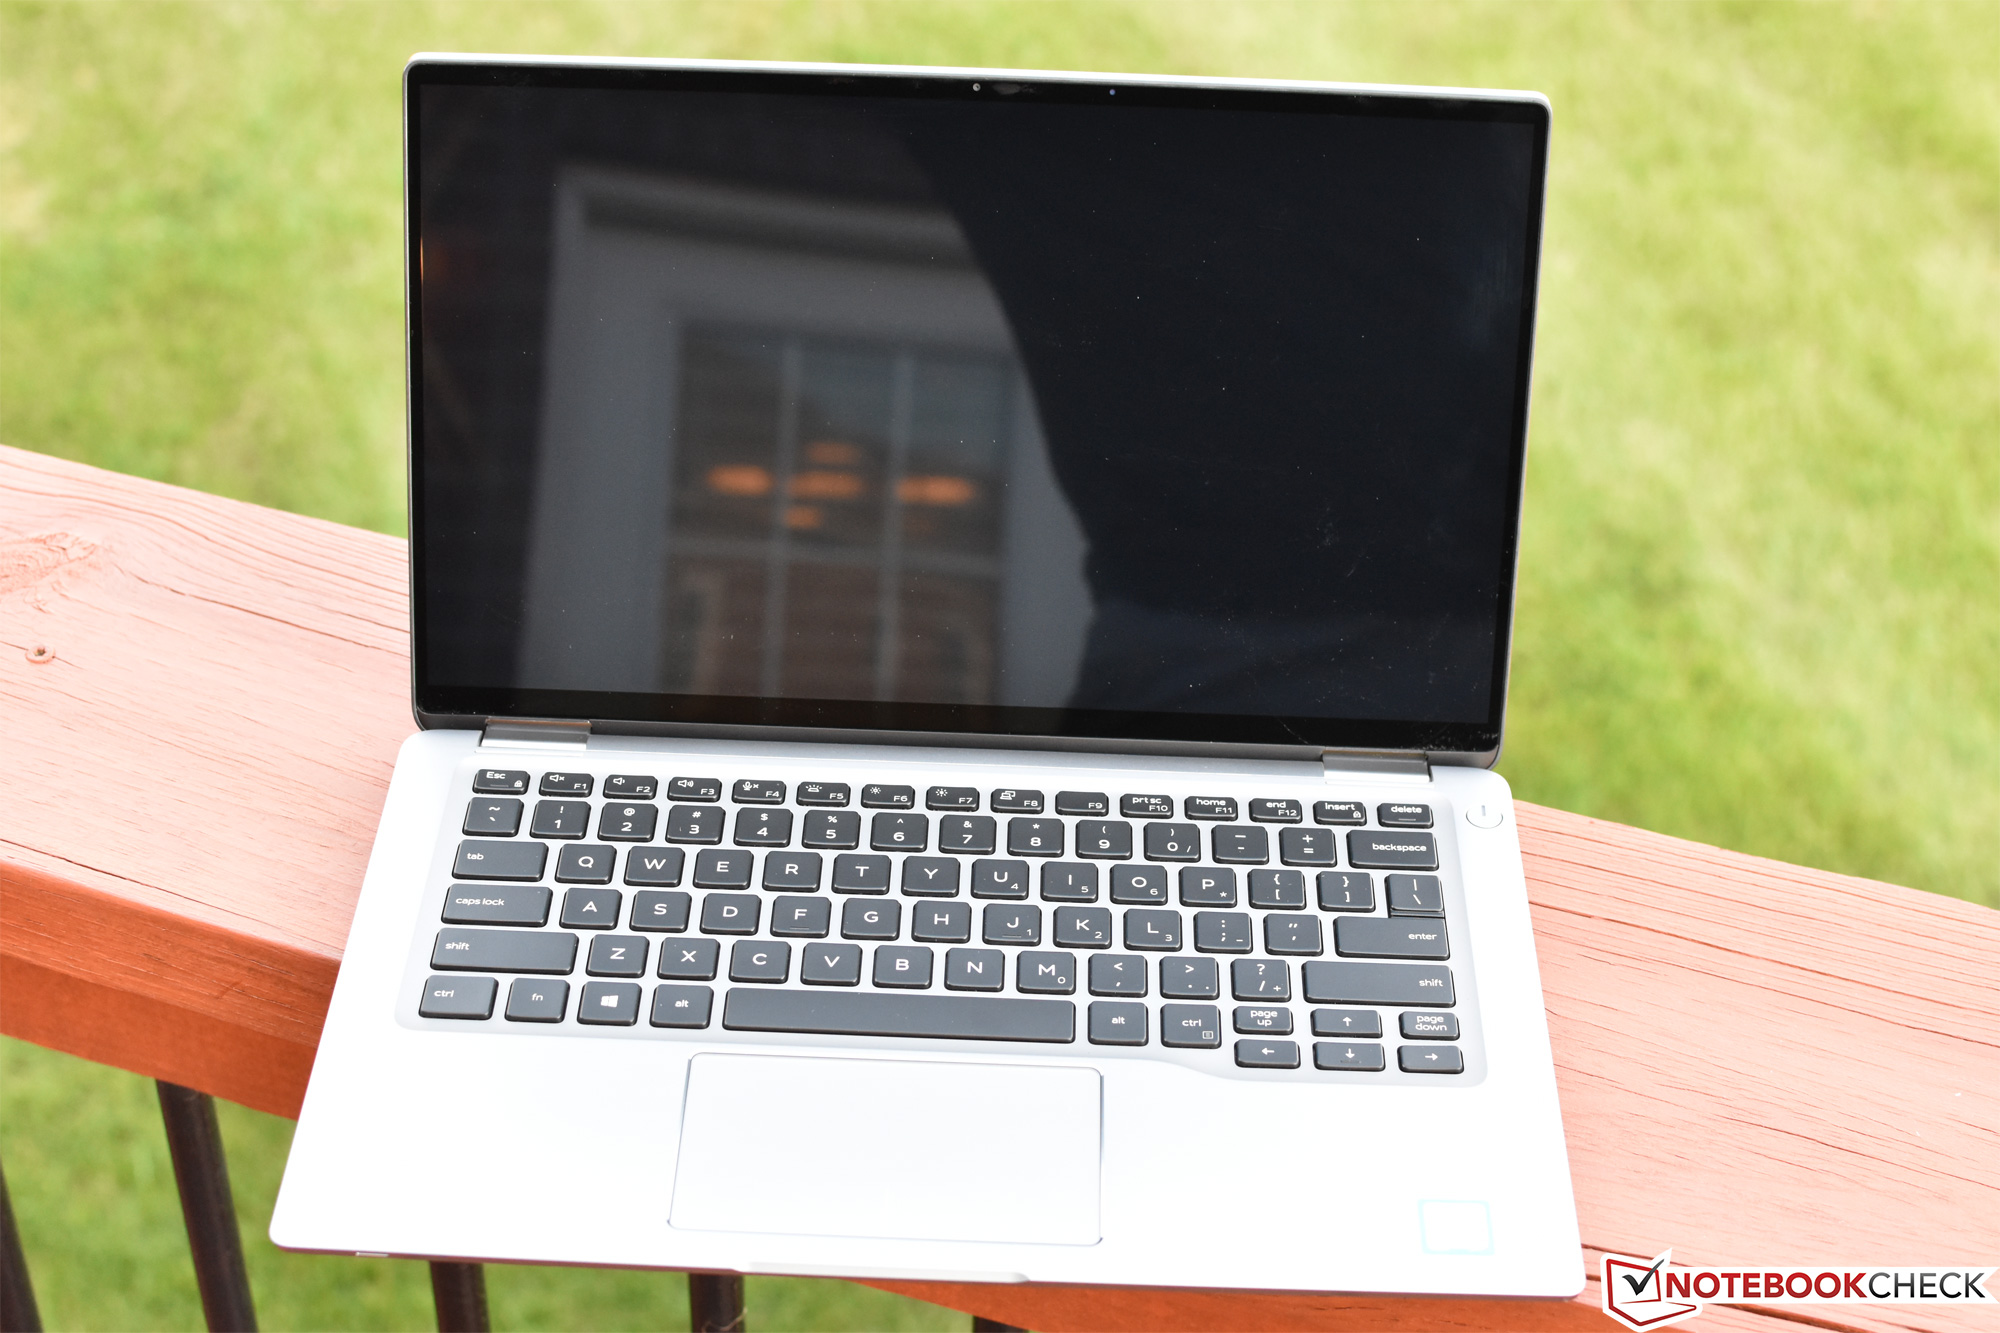
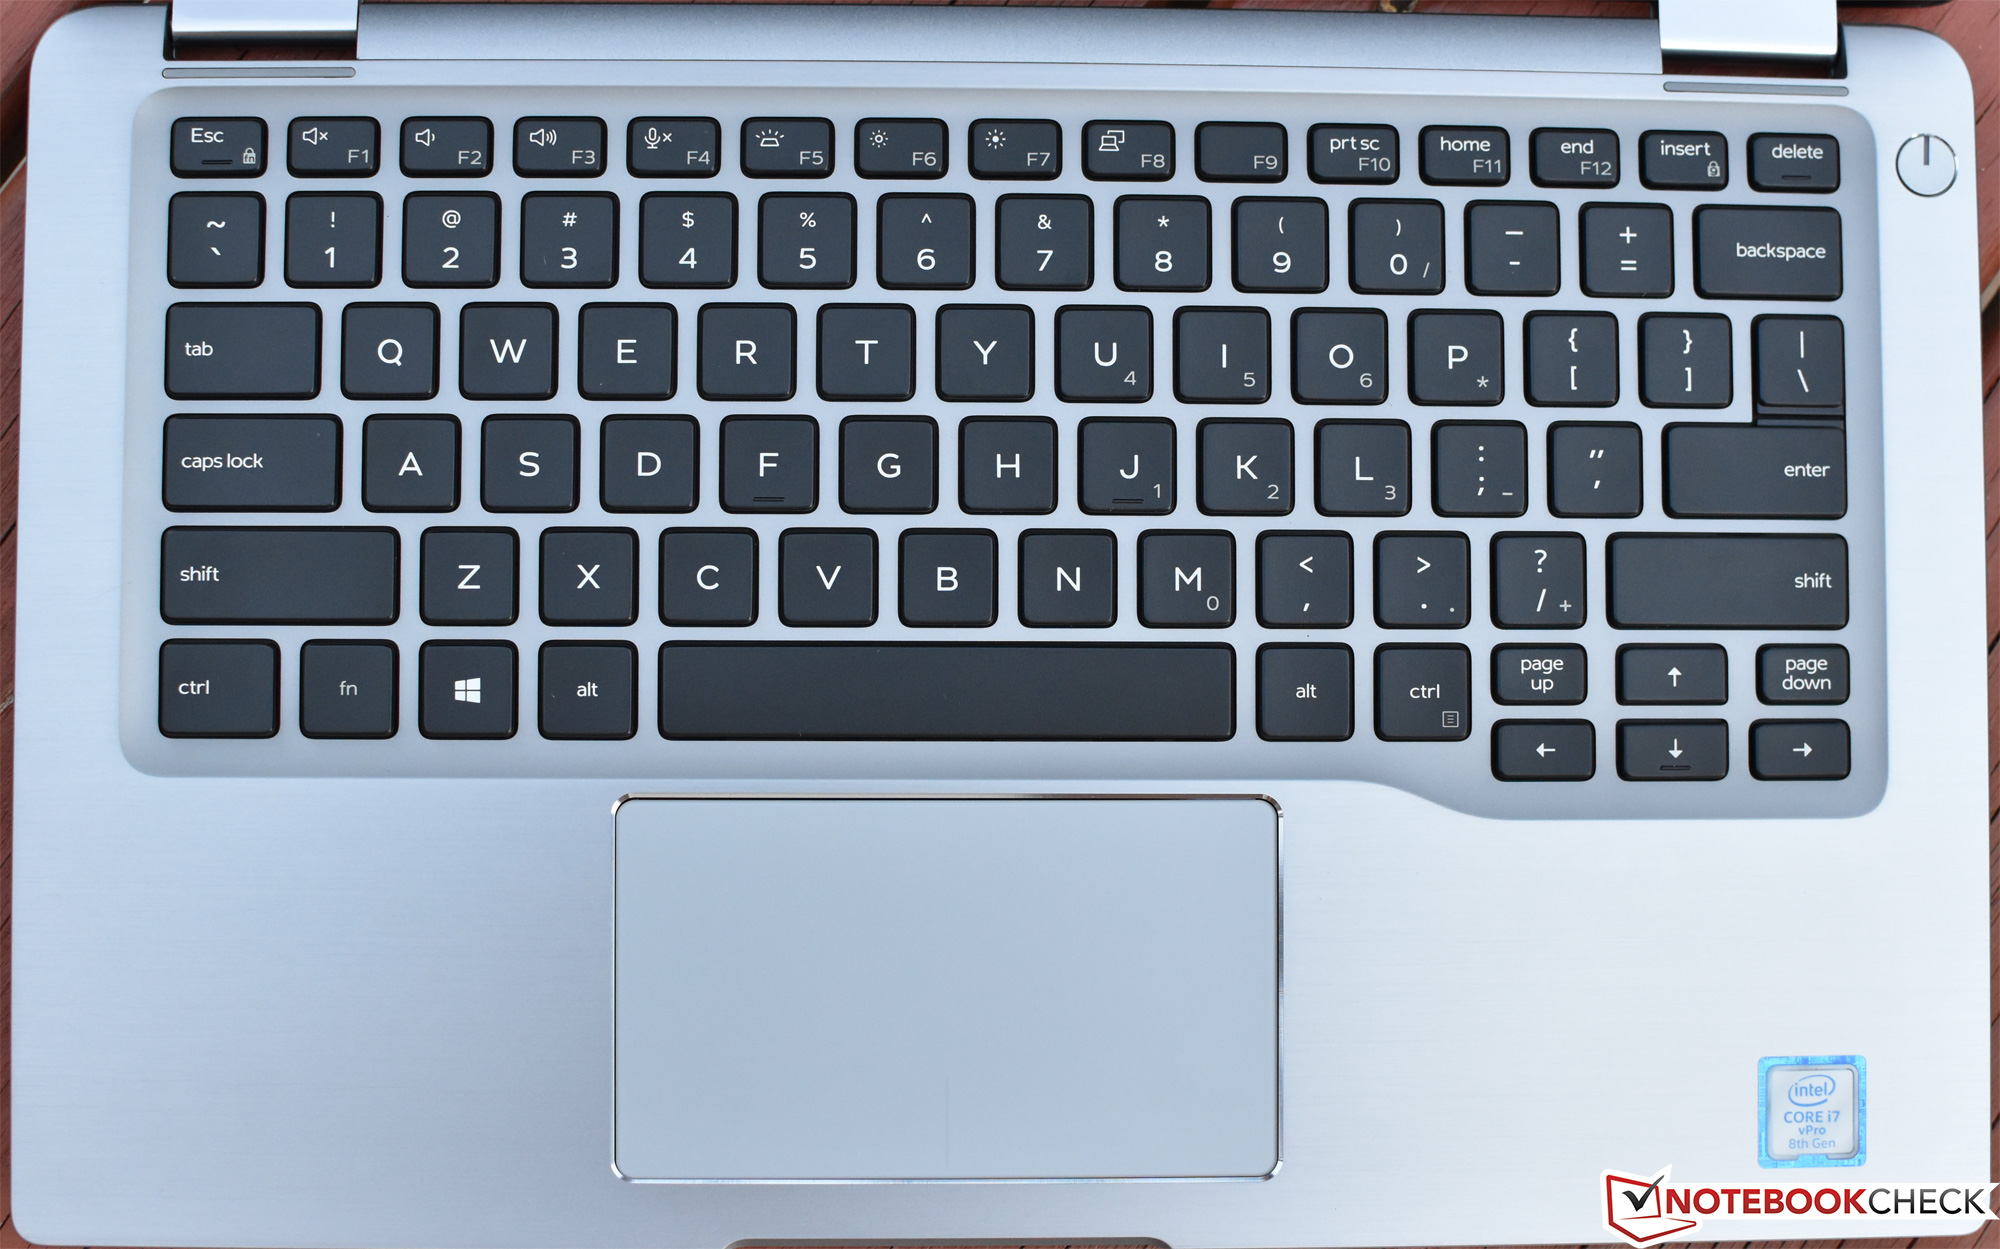
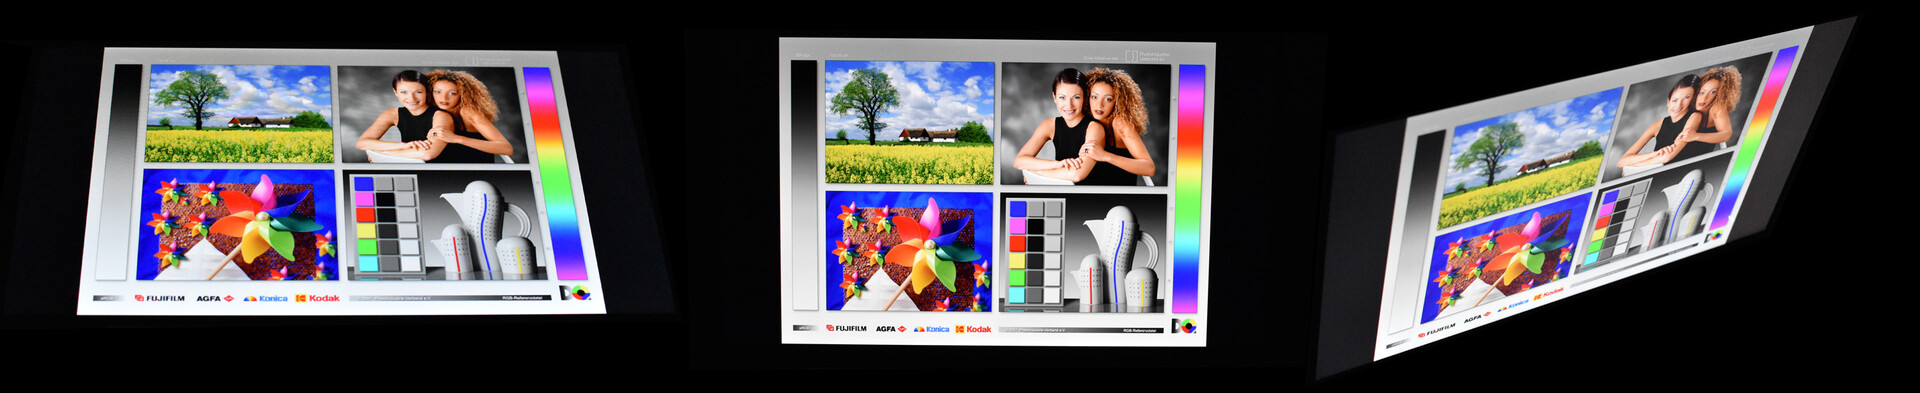
No entanto, embora seja agradável ao toque e esteticamente, os resultados estão longe de ser universalmente positivos neste caso. A tela, apesar de atraente em interiores, sofre com um brilho fraco e é altamente reflexiva, tornando desconfortável o uso em exteriores e, em muitos casos, simplesmente implausível. Enquanto a transição para um touchpad de vidro é agradável, alguns usuários corporativos irão lamentar a mudança de botões físicos separados para um design de “clickpad” integrado. A RAM do sistema agora está totalmente soldada na placa-mãe, significando que atualizações e substituições são impossíveis (embora o SSD M.2 NVMe ainda possa ser substituído).
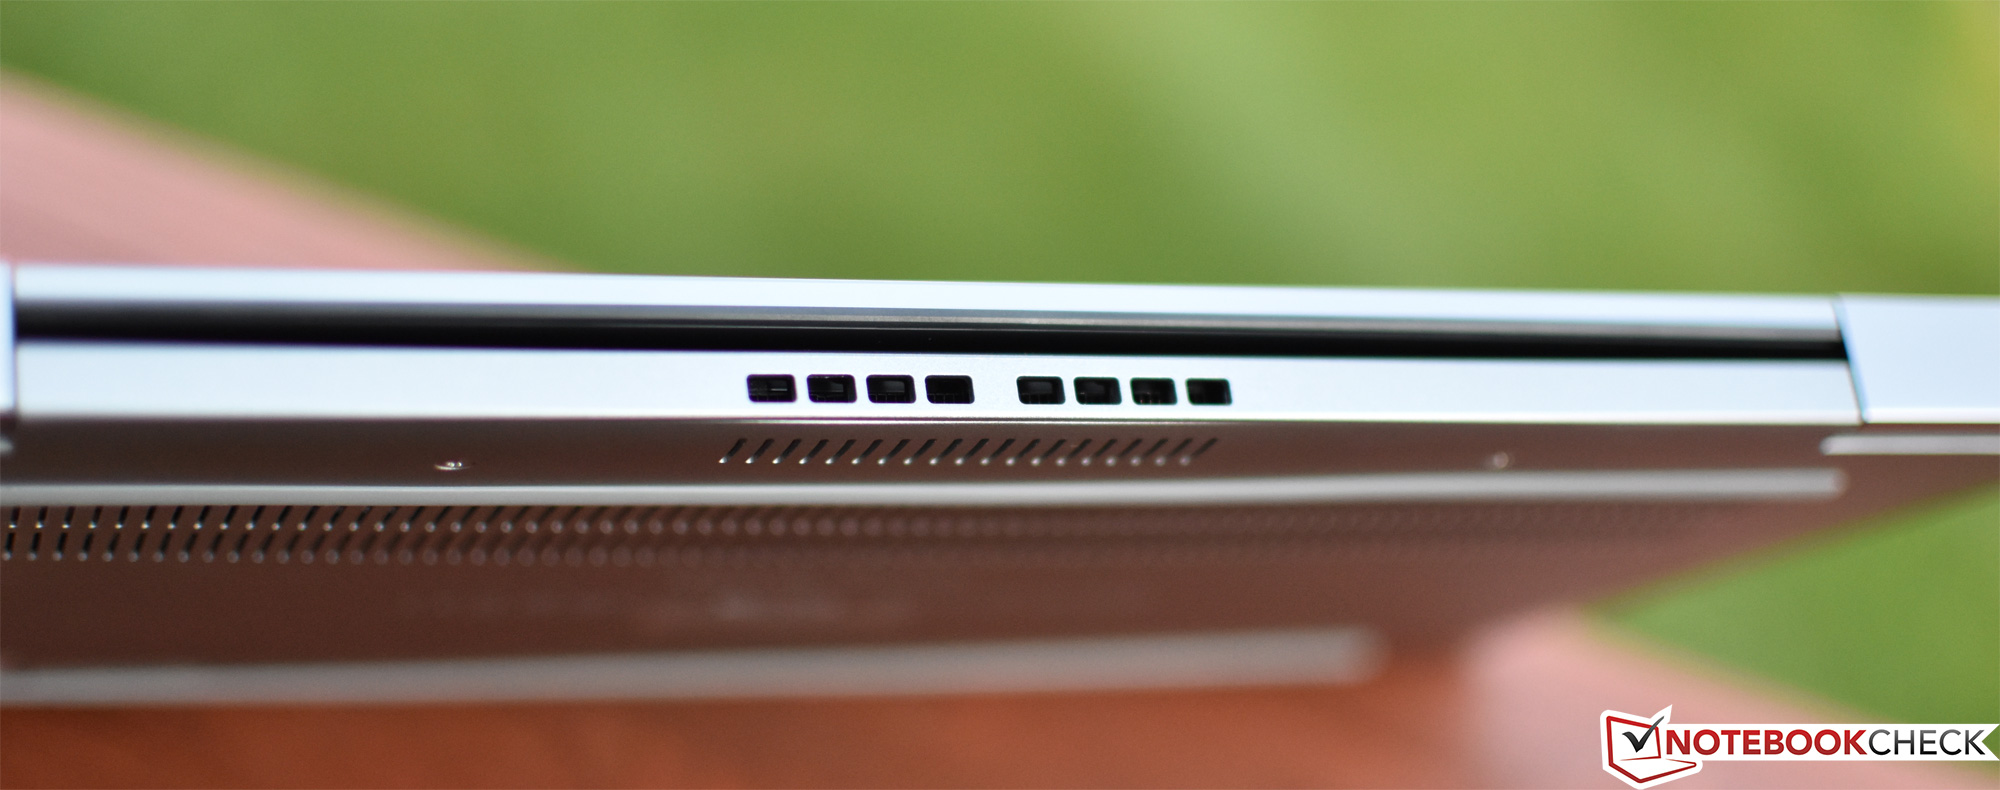
Mas a deficiência mais gritante de todas é a tendência das altas temperaturas do chip, que rapidamente sobrecarrega o sistema de resfriamento inferior e resulta em pontos quentes superficiais na carcaça e reduções de desempenho excessivas da CPU (e afogamento sob usos mais intensivos). Isso resulta em um desempenho que fica aquém dos modelos concorrentes mais baratos e menos equipados, mesmo de última geração, e questiona a praticidade de colocar um SoC Whisky Lake quente e faminto do Core i7 em uma carcaça tão pequena com um resfriamento conservador e insuficiente.
Estaríamos dispostos em trocar mais ruído do ventilador por melhor desempenho sustentado e temperaturas baixas, e felizmente isso pode ser parcialmente alcançado através de um switch para o perfil térmico Ultra Performance dentro do Dell Power Manager - que resulta em um desempenho sustentado pelo menos marginalmente melhor em nosso teste de loop Cinebench R15 (esperançosamente, uma futura atualização de firmware poderia melhorar isto, o que o usuário médio não informado provavelmente não saberia como fazer). Independentemente disso, no entanto, achamos que faz mais sentido economizar seu dinheiro e investir em uma configuração com uma CPU Core i5 menos dispendiosa, onde as temperaturas certamente serão mais baixas e você não pagará pelos aumentos de desempenho que são marginais na melhor das hipóteses.
Os concorrentes mais bem classificados incluem o HP EliteBook x360 1040 G5 e o Lenovo ThinkPad X1 Yoga. O Asus Zenbook Flip 14 também está disponível, mas não se saiu tão bem quanto as duas máquinas anteriores em nossos testes. Como alternativa, pode valer a pena esperar um pouco para ver se e como a Dell revisa o firmware no 7400 2-em-1 para resolver esses problemas. É uma excelente máquina de várias maneiras - um pouco ambiciosa demais para o sistema de resfriamento.
Dell Latitude 7400 2-in-1
- 10/17/2019 v7 (old)
Steve Schardein
Price comparison
