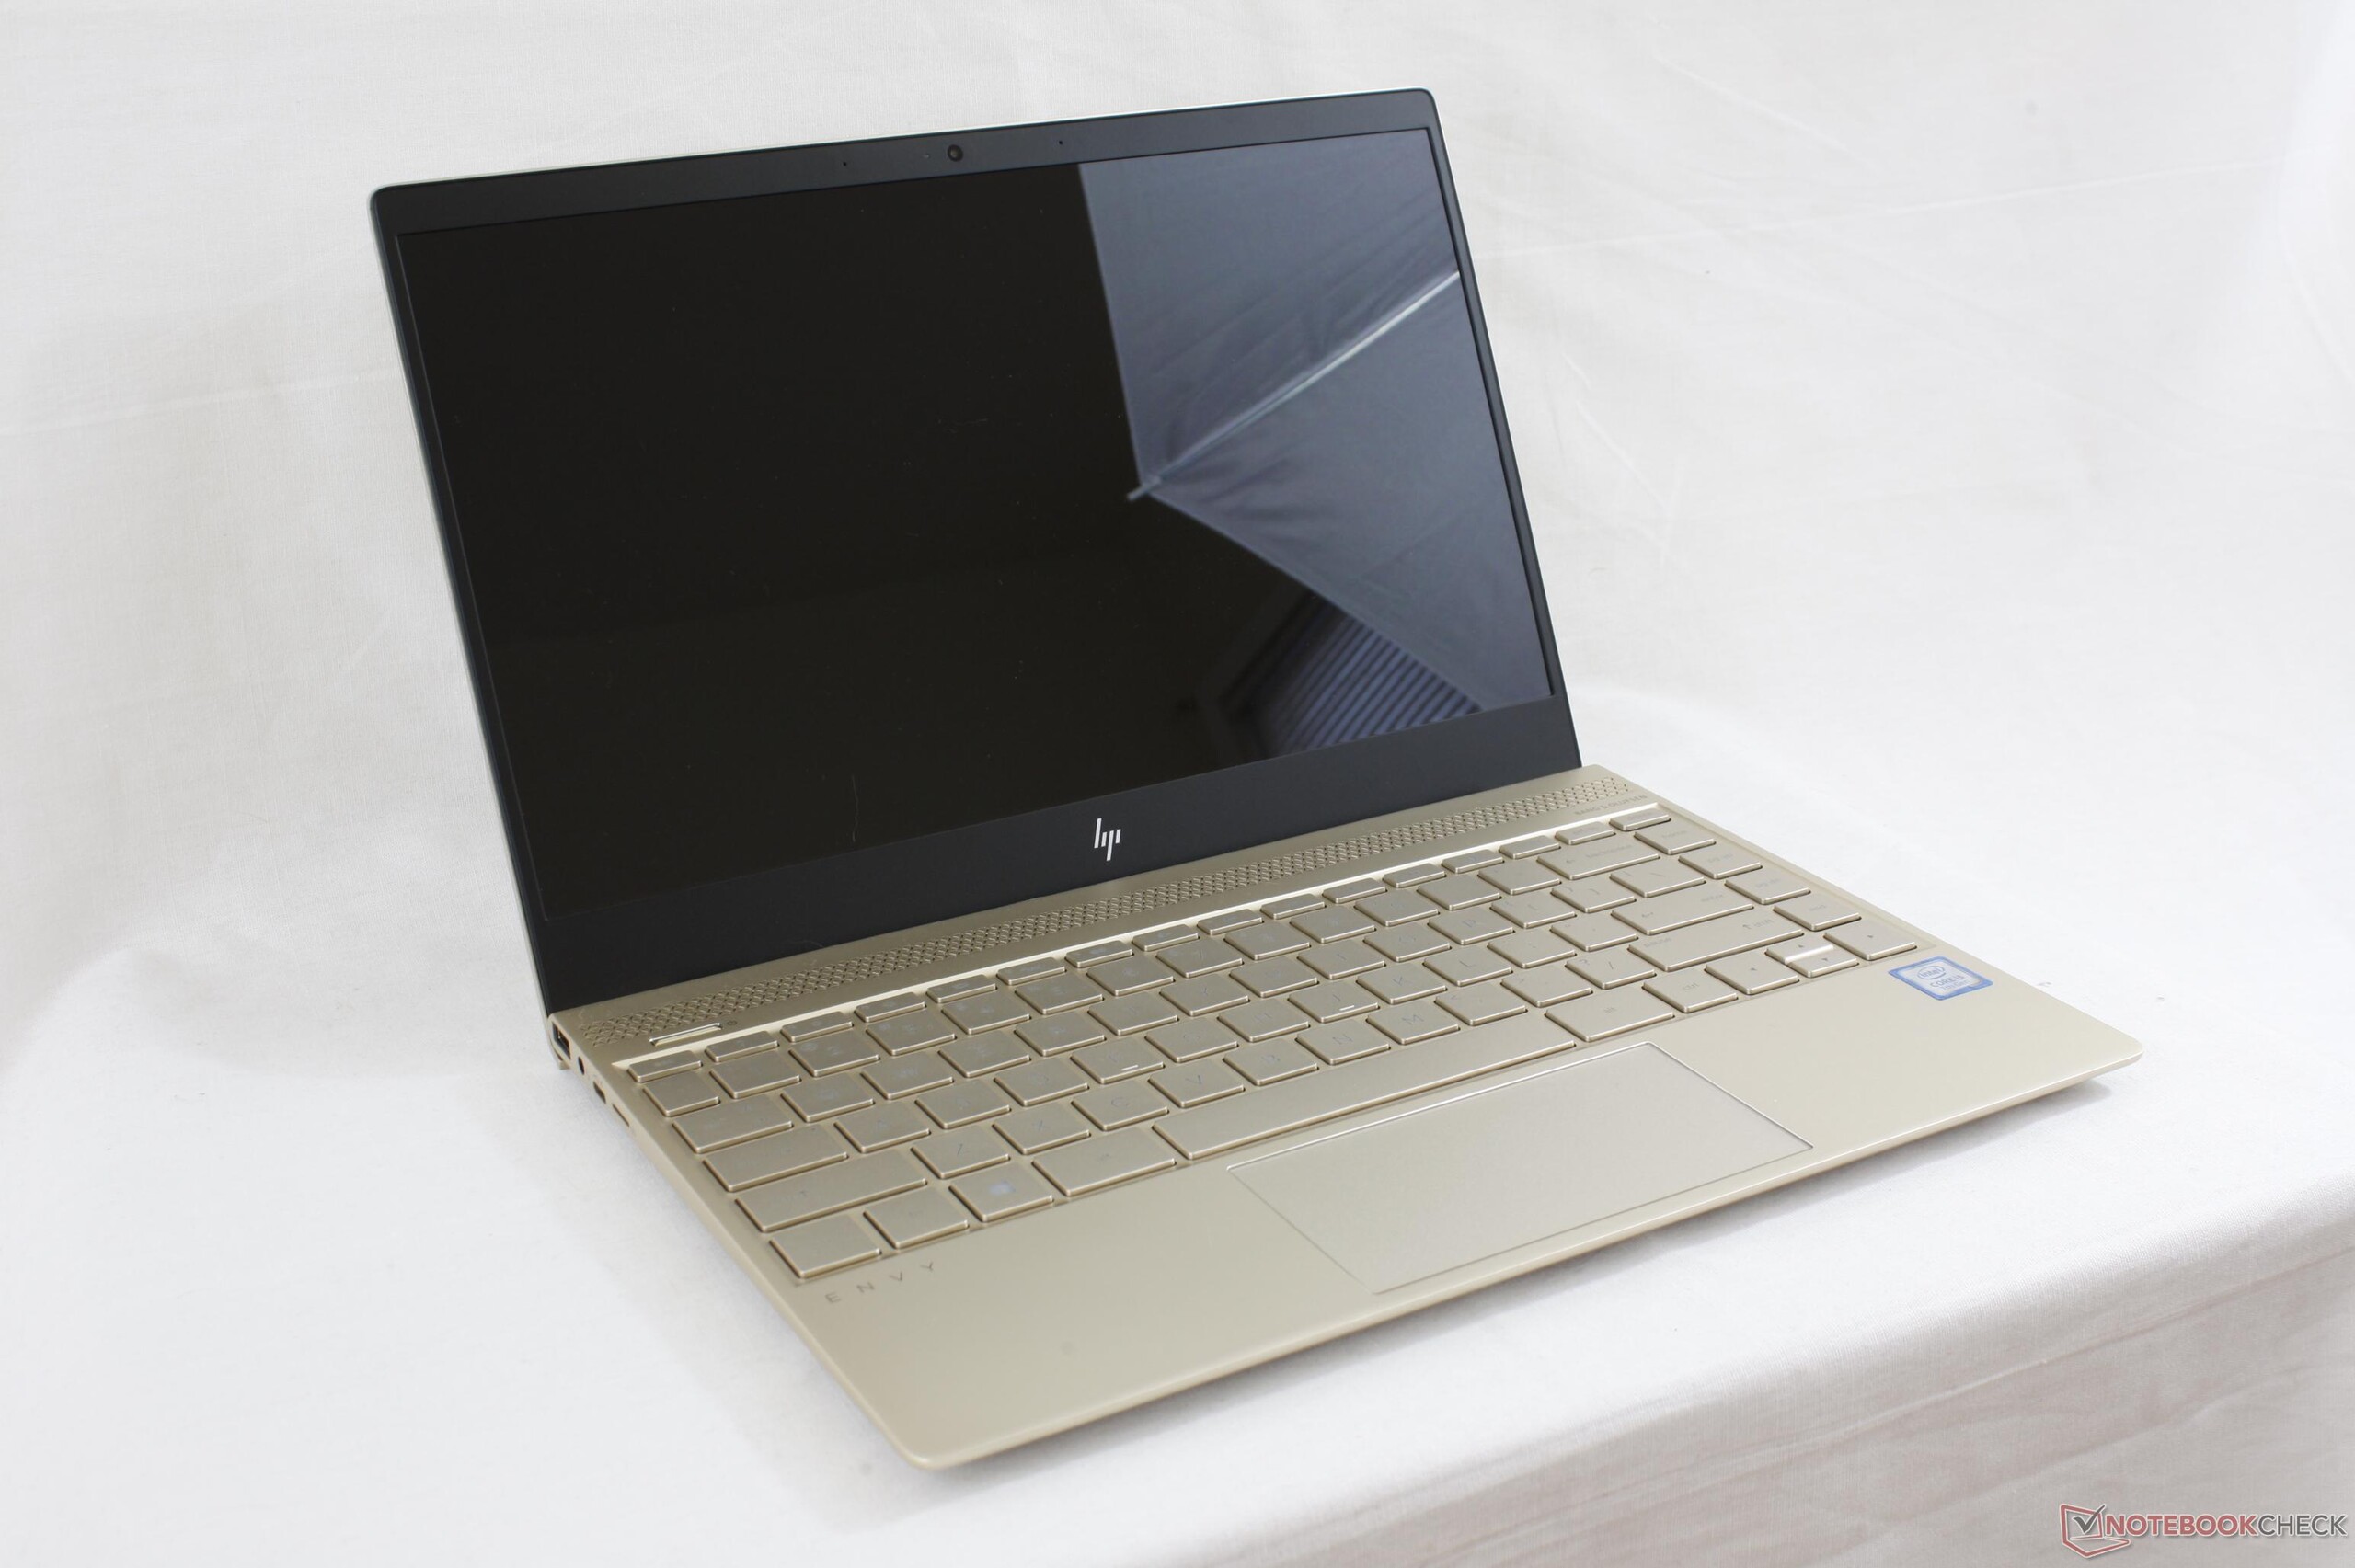
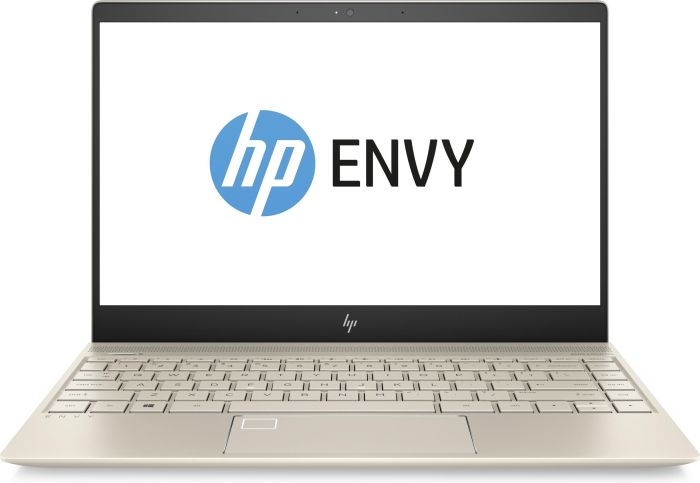
Breve Análise do Portátil HP Envy 13-ad006ng (i7-7500U, MX150)
| SD Card Reader | |
| average JPG Copy Test (av. of 3 runs) | |
| Dell XPS 13 i7-8550U | |
| HP Envy 13-ad006ng (Toshiba Exceria Pro SDXC 64 GB UHS-II) | |
| Lenovo IdeaPad 710S Plus-13IKB | |
| maximum AS SSD Seq Read Test (1GB) | |
| Dell XPS 13 i7-8550U | |
| Lenovo IdeaPad 710S Plus-13IKB | |
| HP Envy 13-ad006ng (Toshiba Exceria Pro SDXC 64 GB UHS-II) | |
| Networking | |
| iperf3 transmit AX12 | |
| HP Envy 13-ad006ng | |
| Lenovo IdeaPad 710S Plus-13IKB | |
| Dell XPS 13 i7-8550U | |
| iperf3 receive AX12 | |
| Dell XPS 13 i7-8550U | |
| Lenovo IdeaPad 710S Plus-13IKB | |
| HP Envy 13-ad006ng | |
| |||||||||||||||||||||||||
iluminação: 83 %
iluminação com acumulador: 281 cd/m²
Contraste: 1222:1 (Preto: 0.23 cd/m²)
ΔE ColorChecker Calman: 4.83 | ∀{0.5-29.43 Ø4.71}
ΔE Greyscale Calman: 6.63 | ∀{0.09-98 Ø4.96}
86% sRGB (Argyll 1.6.3 3D)
56% AdobeRGB 1998 (Argyll 1.6.3 3D)
63.1% AdobeRGB 1998 (Argyll 3D)
86.3% sRGB (Argyll 3D)
66.8% Display P3 (Argyll 3D)
Gamma: 1.85
CCT: 6794 K
| HP Envy 13-ad006ng BOE070E, , 1920x1080, 13.3" | HP Envy 13-ad065nr LG Philips LGD0576, , 1920x1080, 13.3" | Dell XPS 13 9360 FHD i5 Sharp SHP1449 LQ133M1, , 1920x1080, 13.3" | Lenovo IdeaPad 710S Plus-13IKB LG Philips LP133WF4-SPB1 (LGD04EF), , 1920x1080, 13.3" | Asus Zenbook UX310UA-FC347T iGP AU Optronics AUO272D, , 1920x1080, 13.3" | Xiaomi Mi Notebook Air 13.3 2016 Samsung LTN133HL09-M01, , 1920x1080, 13.3" | |
|---|---|---|---|---|---|---|
| Display | -3% | -21% | -3% | -8% | 6% | |
| Display P3 Coverage (%) | 66.8 | 65.5 -2% | 48.94 -27% | 65.3 -2% | 64.2 -4% | 66 -1% |
| sRGB Coverage (%) | 86.3 | 83.8 -3% | 73.3 -15% | 82.9 -4% | 65.3 -24% | 95.5 11% |
| AdobeRGB 1998 Coverage (%) | 63.1 | 61.3 -3% | 50.5 -20% | 60.6 -4% | 65.3 3% | 67.8 7% |
| Response Times | 36% | 14% | 8% | 24% | 7% | |
| Response Time Grey 50% / Grey 80% * (ms) | 48 ? | 28 ? 42% | 32.8 ? 32% | 45 ? 6% | 40 ? 17% | 49 ? -2% |
| Response Time Black / White * (ms) | 32 ? | 22.4 ? 30% | 33.2 ? -4% | 29 ? 9% | 22 ? 31% | 27 ? 16% |
| PWM Frequency (Hz) | 1000 ? | 10200 ? | 200 ? | 50 ? | ||
| Screen | -4% | 4% | 4% | 6% | 18% | |
| Brightness middle (cd/m²) | 281 | 290 3% | 351.2 25% | 343 22% | 358 27% | 347 23% |
| Brightness (cd/m²) | 264 | 270 2% | 325 23% | 306 16% | 347 31% | 334 27% |
| Brightness Distribution (%) | 83 | 78 -6% | 89 7% | 81 -2% | 87 5% | 80 -4% |
| Black Level * (cd/m²) | 0.23 | 0.32 -39% | 0.195 15% | 0.3 -30% | 0.26 -13% | 0.27 -17% |
| Contrast (:1) | 1222 | 906 -26% | 1801 47% | 1143 -6% | 1377 13% | 1285 5% |
| Colorchecker dE 2000 * | 4.83 | 4.8 1% | 7.4 -53% | 4.73 2% | 5.22 -8% | 3.29 32% |
| Colorchecker dE 2000 max. * | 8.89 | 11.2 -26% | 9.08 -2% | 9.05 -2% | 9.19 -3% | 4.69 47% |
| Greyscale dE 2000 * | 6.63 | 2.8 58% | 6.71 -1% | 3.29 50% | 6.69 -1% | 3.62 45% |
| Gamma | 1.85 119% | 2.19 100% | 2.74 80% | 2.36 93% | 2.35 94% | 2.23 99% |
| CCT | 6794 96% | 6382 102% | 7222 90% | 6437 101% | 6745 96% | 7307 89% |
| Color Space (Percent of AdobeRGB 1998) (%) | 56 | 54.9 -2% | 50.48 -10% | 54 -4% | 59 5% | 62 11% |
| Color Space (Percent of sRGB) (%) | 86 | 83.5 -3% | 73.31 -15% | 83 -3% | 91 6% | 95 10% |
| Média Total (Programa/Configurações) | 10% /
2% | -1% /
0% | 3% /
3% | 7% /
6% | 10% /
14% |
* ... menor é melhor
Exibir tempos de resposta
| ↔ Tempo de resposta preto para branco | ||
|---|---|---|
| 32 ms ... ascensão ↗ e queda ↘ combinadas | ↗ 17 ms ascensão | 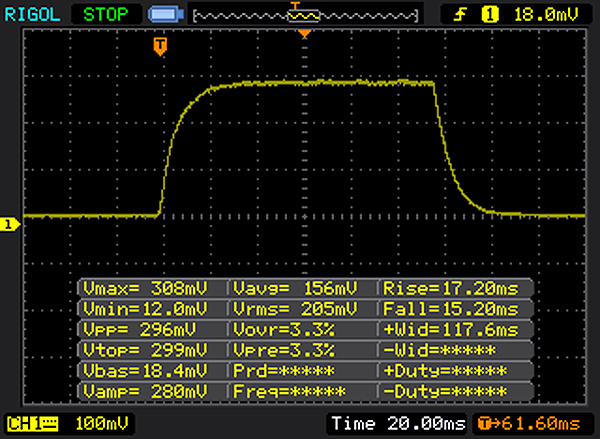 |
| ↘ 15 ms queda | ||
| A tela mostra taxas de resposta lentas em nossos testes e será insatisfatória para os jogadores. Em comparação, todos os dispositivos testados variam de 0.1 (mínimo) a 240 (máximo) ms. » 86 % de todos os dispositivos são melhores. Isso significa que o tempo de resposta medido é pior que a média de todos os dispositivos testados (19.8 ms). | ||
| ↔ Tempo de resposta 50% cinza a 80% cinza | ||
| 48 ms ... ascensão ↗ e queda ↘ combinadas | ↗ 23 ms ascensão | 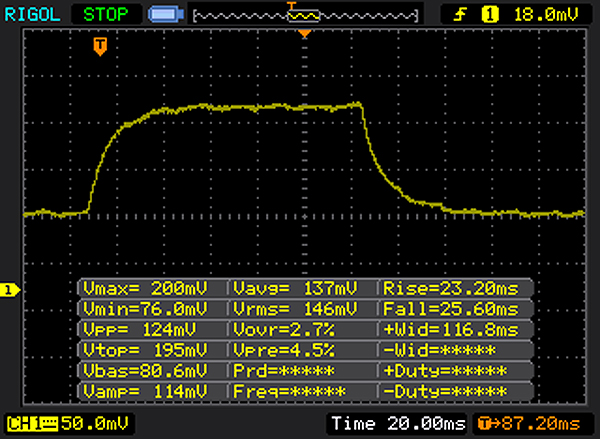 |
| ↘ 25 ms queda | ||
| A tela mostra taxas de resposta lentas em nossos testes e será insatisfatória para os jogadores. Em comparação, todos os dispositivos testados variam de 0.165 (mínimo) a 636 (máximo) ms. » 82 % de todos os dispositivos são melhores. Isso significa que o tempo de resposta medido é pior que a média de todos os dispositivos testados (30.9 ms). | ||
Cintilação da tela / PWM (modulação por largura de pulso)
| Tela tremeluzindo/PWM detectado | 1000 Hz | ≤ 90 % configuração de brilho | 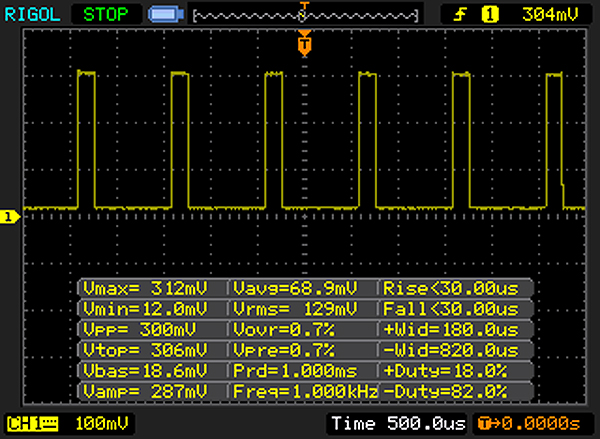 |
A luz de fundo da tela pisca em 1000 Hz (pior caso, por exemplo, utilizando PWM) Cintilação detectada em uma configuração de brilho de 90 % e abaixo. Não deve haver cintilação ou PWM acima desta configuração de brilho. A frequência de 1000 Hz é bastante alta, então a maioria dos usuários sensíveis ao PWM não deve notar nenhuma oscilação. [pwm_comparison] Em comparação: 52 % de todos os dispositivos testados não usam PWM para escurecer a tela. Se PWM foi detectado, uma média de 7748 (mínimo: 5 - máximo: 343500) Hz foi medida. | |||
| PCMark 10 - Score | |
| HP Envy 13-ad006ng | |
| HP Envy 13-ad065nr | |
| PCMark 8 Home Score Accelerated v2 | 3773 pontos | |
| PCMark 8 Work Score Accelerated v2 | 4900 pontos | |
| PCMark 10 Score | 3282 pontos | |
Ajuda | ||
| HP Envy 13-ad006ng Toshiba NVMe THNSN5256GPUK | Lenovo IdeaPad 710S Plus-13IKB Samsung PM961 NVMe MZVLW512HMJP | Xiaomi Mi Notebook Air 13.3 2016 Samsung PM951 NVMe MZVLV256 | Asus Zenbook UX310UA-FC347T iGP Micron SSD 1100 (MTFDDAV256TBN) | HP Envy 13-ad065nr SanDisk X400 SD8SN8U-128G-1006 | Dell XPS 13 i7-8550U Toshiba XG5 KXG50ZNV256G | |
|---|---|---|---|---|---|---|
| CrystalDiskMark 3.0 | 193% | 40% | 14% | |||
| Read Seq (MB/s) | 1019 | 1577 55% | 1209 19% | 489.4 -52% | ||
| Write Seq (MB/s) | 195.4 | 1472 653% | 314 61% | 431.6 121% | ||
| Read 512 (MB/s) | 735 | 1165 59% | 356.7 -51% | |||
| Write 512 (MB/s) | 172.3 | 1244 622% | 389.1 126% | |||
| Read 4k (MB/s) | 34.5 | 54.8 59% | 43.4 26% | 26.68 -23% | ||
| Write 4k (MB/s) | 109.4 | 121.5 11% | 153.4 40% | 88.7 -19% | ||
| Read 4k QD32 (MB/s) | 494.6 | 407.5 -18% | 487.6 -1% | 246.3 -50% | ||
| Write 4k QD32 (MB/s) | 161.3 | 321.4 99% | 312.2 94% | 251.5 56% | ||
| CrystalDiskMark 5.2 / 6 | -26% | 12% | ||||
| Write 4K (MB/s) | 155.7 | 57.5 -63% | 121.5 -22% | |||
| Read 4K (MB/s) | 26.5 | 29.34 11% | 24.92 -6% | |||
| Write Seq (MB/s) | 312.3 | 342.5 10% | 345 10% | |||
| Read Seq (MB/s) | 928 | 503 -46% | 1313 41% | |||
| Write 4K Q32T1 (MB/s) | 208.7 | 160.3 -23% | 346.1 66% | |||
| Read 4K Q32T1 (MB/s) | 478.8 | 285.7 -40% | 389.4 -19% | |||
| Write Seq Q32T1 (MB/s) | 305.1 | 330.8 8% | 334.7 10% | |||
| Read Seq Q32T1 (MB/s) | 1601 | 552 -66% | 1840 15% | |||
| Média Total (Programa/Configurações) | 193% /
193% | 40% /
40% | 14% /
14% | -26% /
-26% | 12% /
12% |

| 3DMark 11 - 1280x720 Performance GPU | |
| HP Envy 13-ad006ng | |
| Lenovo IdeaPad 710S Plus-13IKB | |
| Xiaomi Mi Notebook Air 13.3 2016 | |
| Dell XPS 13 i7-8550U | |
| Asus Zenbook UX310UA-FC347T iGP | |
| HP Envy 13-ad065nr | |
| 3DMark 11 Performance | 3588 pontos | |
| 3DMark Cloud Gate Standard Score | 9800 pontos | |
| 3DMark Fire Strike Score | 2528 pontos | |
Ajuda | ||
| The Witcher 3 - 1366x768 Medium Graphics & Postprocessing | |
| Dell XPS 15 2017 9560 (7300HQ, Full-HD) | |
| HP Envy 13-ad006ng | |
| Lenovo IdeaPad 710S Plus-13IKB | |
| Asus Zenbook UX310UA-FC347T iGP | |
| BioShock Infinite - 1366x768 High Preset | |
| HP Envy 13-ad006ng | |
| Xiaomi Mi Notebook Air 13.3 2016 | |
| Dell XPS 13 i7-8550U | |
| Asus Zenbook UX310UA-FC347T iGP | |
| HP Envy 13-ad065nr | |
| baixo | média | alto | ultra | |
|---|---|---|---|---|
| BioShock Infinite (2013) | 173.9 | 94 | 79 | 29.72 |
| Company of Heroes 2 (2013) | 46.46 | 38.73 | 27.87 | 9.9 |
| The Witcher 3 (2015) | 45.13 | 27.64 | 14.47 | 9 |
| Rise of the Tomb Raider (2016) | 60 | 34.06 | 17 |
Barulho
| Ocioso |
| 30.5 / 30.5 / 30.5 dB |
| Carga |
| 37.3 / 34.2 dB |
 | ||
30 dB silencioso 40 dB(A) audível 50 dB(A) ruidosamente alto |
||
min: | ||
(±) A temperatura máxima no lado superior é 41.6 °C / 107 F, em comparação com a média de 35.9 °C / 97 F , variando de 21.4 a 59 °C para a classe Subnotebook.
(+) A parte inferior aquece até um máximo de 33.4 °C / 92 F, em comparação com a média de 39.2 °C / 103 F
(+) Em uso inativo, a temperatura média para o lado superior é 22.4 °C / 72 F, em comparação com a média do dispositivo de 30.8 °C / ### class_avg_f### F.
(±) Jogando The Witcher 3, a temperatura média para o lado superior é 35 °C / 95 F, em comparação com a média do dispositivo de 30.8 °C / ## #class_avg_f### F.
(+) Os apoios para as mãos e o touchpad são mais frios que a temperatura da pele, com um máximo de 30.6 °C / 87.1 F e, portanto, são frios ao toque.
(-) A temperatura média da área do apoio para as mãos de dispositivos semelhantes foi 28.2 °C / 82.8 F (-2.4 °C / -4.3 F).
HP Envy 13-ad006ng análise de áudio
(-) | alto-falantes não muito altos (###valor### dB)
Graves 100 - 315Hz
(-) | quase nenhum baixo - em média 27.6% menor que a mediana
(±) | a linearidade dos graves é média (9.8% delta para a frequência anterior)
Médios 400 - 2.000 Hz
(+) | médios equilibrados - apenas 2.2% longe da mediana
(+) | médios são lineares (6.1% delta para frequência anterior)
Altos 2 - 16 kHz
(+) | agudos equilibrados - apenas 2% longe da mediana
(+) | os máximos são lineares (3.7% delta da frequência anterior)
Geral 100 - 16.000 Hz
(±) | a linearidade do som geral é média (20.2% diferença em relação à mediana)
Comparado com a mesma classe
» 64% de todos os dispositivos testados nesta classe foram melhores, 9% semelhantes, 27% piores
» O melhor teve um delta de 5%, a média foi 18%, o pior foi 53%
Comparado com todos os dispositivos testados
» 53% de todos os dispositivos testados foram melhores, 8% semelhantes, 39% piores
» O melhor teve um delta de 4%, a média foi 23%, o pior foi 134%
Dell XPS 13 i7-8550U análise de áudio
(-) | alto-falantes não muito altos (###valor### dB)
Graves 100 - 315Hz
(+) | bons graves - apenas 4.5% longe da mediana
(±) | a linearidade dos graves é média (8.2% delta para a frequência anterior)
Médios 400 - 2.000 Hz
(±) | médios mais altos - em média 5% maior que a mediana
(+) | médios são lineares (5.8% delta para frequência anterior)
Altos 2 - 16 kHz
(+) | agudos equilibrados - apenas 3% longe da mediana
(±) | a linearidade dos máximos é média (14.5% delta para frequência anterior)
Geral 100 - 16.000 Hz
(±) | a linearidade do som geral é média (17.2% diferença em relação à mediana)
Comparado com a mesma classe
» 44% de todos os dispositivos testados nesta classe foram melhores, 9% semelhantes, 46% piores
» O melhor teve um delta de 5%, a média foi 18%, o pior foi 53%
Comparado com todos os dispositivos testados
» 32% de todos os dispositivos testados foram melhores, 8% semelhantes, 60% piores
» O melhor teve um delta de 4%, a média foi 23%, o pior foi 134%
| desligado | |
| Ocioso | |
| Carga |
|
Key:
min: | |
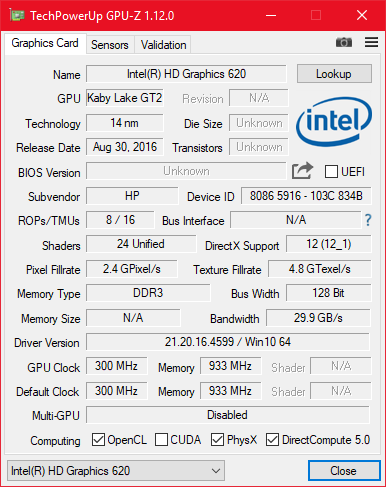
| HP Envy 13-ad006ng i7-7500U, GeForce MX150, Toshiba NVMe THNSN5256GPUK, IPS LED, 1920x1080, 13.3" | HP Envy 13-ad065nr i5-7200U, HD Graphics 620, SanDisk X400 SD8SN8U-128G-1006, IPS, 1920x1080, 13.3" | Lenovo IdeaPad 710S Plus-13IKB i7-7500U, GeForce 940MX, Samsung PM961 NVMe MZVLW512HMJP, IPS, 1920x1080, 13.3" | Asus Zenbook UX310UA-FC347T iGP i7-7500U, HD Graphics 620, Micron SSD 1100 (MTFDDAV256TBN), IPS, LED, 1920x1080, 13.3" | Dell XPS 13 i7-8550U i5-8550U, UHD Graphics 620, Toshiba XG5 KXG50ZNV256G, IGZO IPS, 3200x1800, 13.3" | Xiaomi Mi Notebook Air 13.3 2016 6200U, GeForce 940MX, Samsung PM951 NVMe MZVLV256, IPS, 1920x1080, 13.3" | |
|---|---|---|---|---|---|---|
| Power Consumption | 17% | -10% | 2% | 0% | -10% | |
| Idle Minimum * (Watt) | 2.8 | 2.8 -0% | 3.6 -29% | 3.5 -25% | 4.1 -46% | 4 -43% |
| Idle Average * (Watt) | 5.8 | 5.8 -0% | 7.4 -28% | 6.6 -14% | 5.8 -0% | 6.6 -14% |
| Idle Maximum * (Watt) | 7.7 | 6.4 17% | 8.7 -13% | 7.5 3% | 6 22% | 7.4 4% |
| Load Average * (Watt) | 48 | 31.3 35% | 43 10% | 34.7 28% | 42.5 11% | 41.7 13% |
| Witcher 3 ultra * (Watt) | 35 | |||||
| Load Maximum * (Watt) | 48 | 31.7 34% | 42 12% | 39.6 17% | 41.4 14% | 52.4 -9% |
* ... menor é melhor
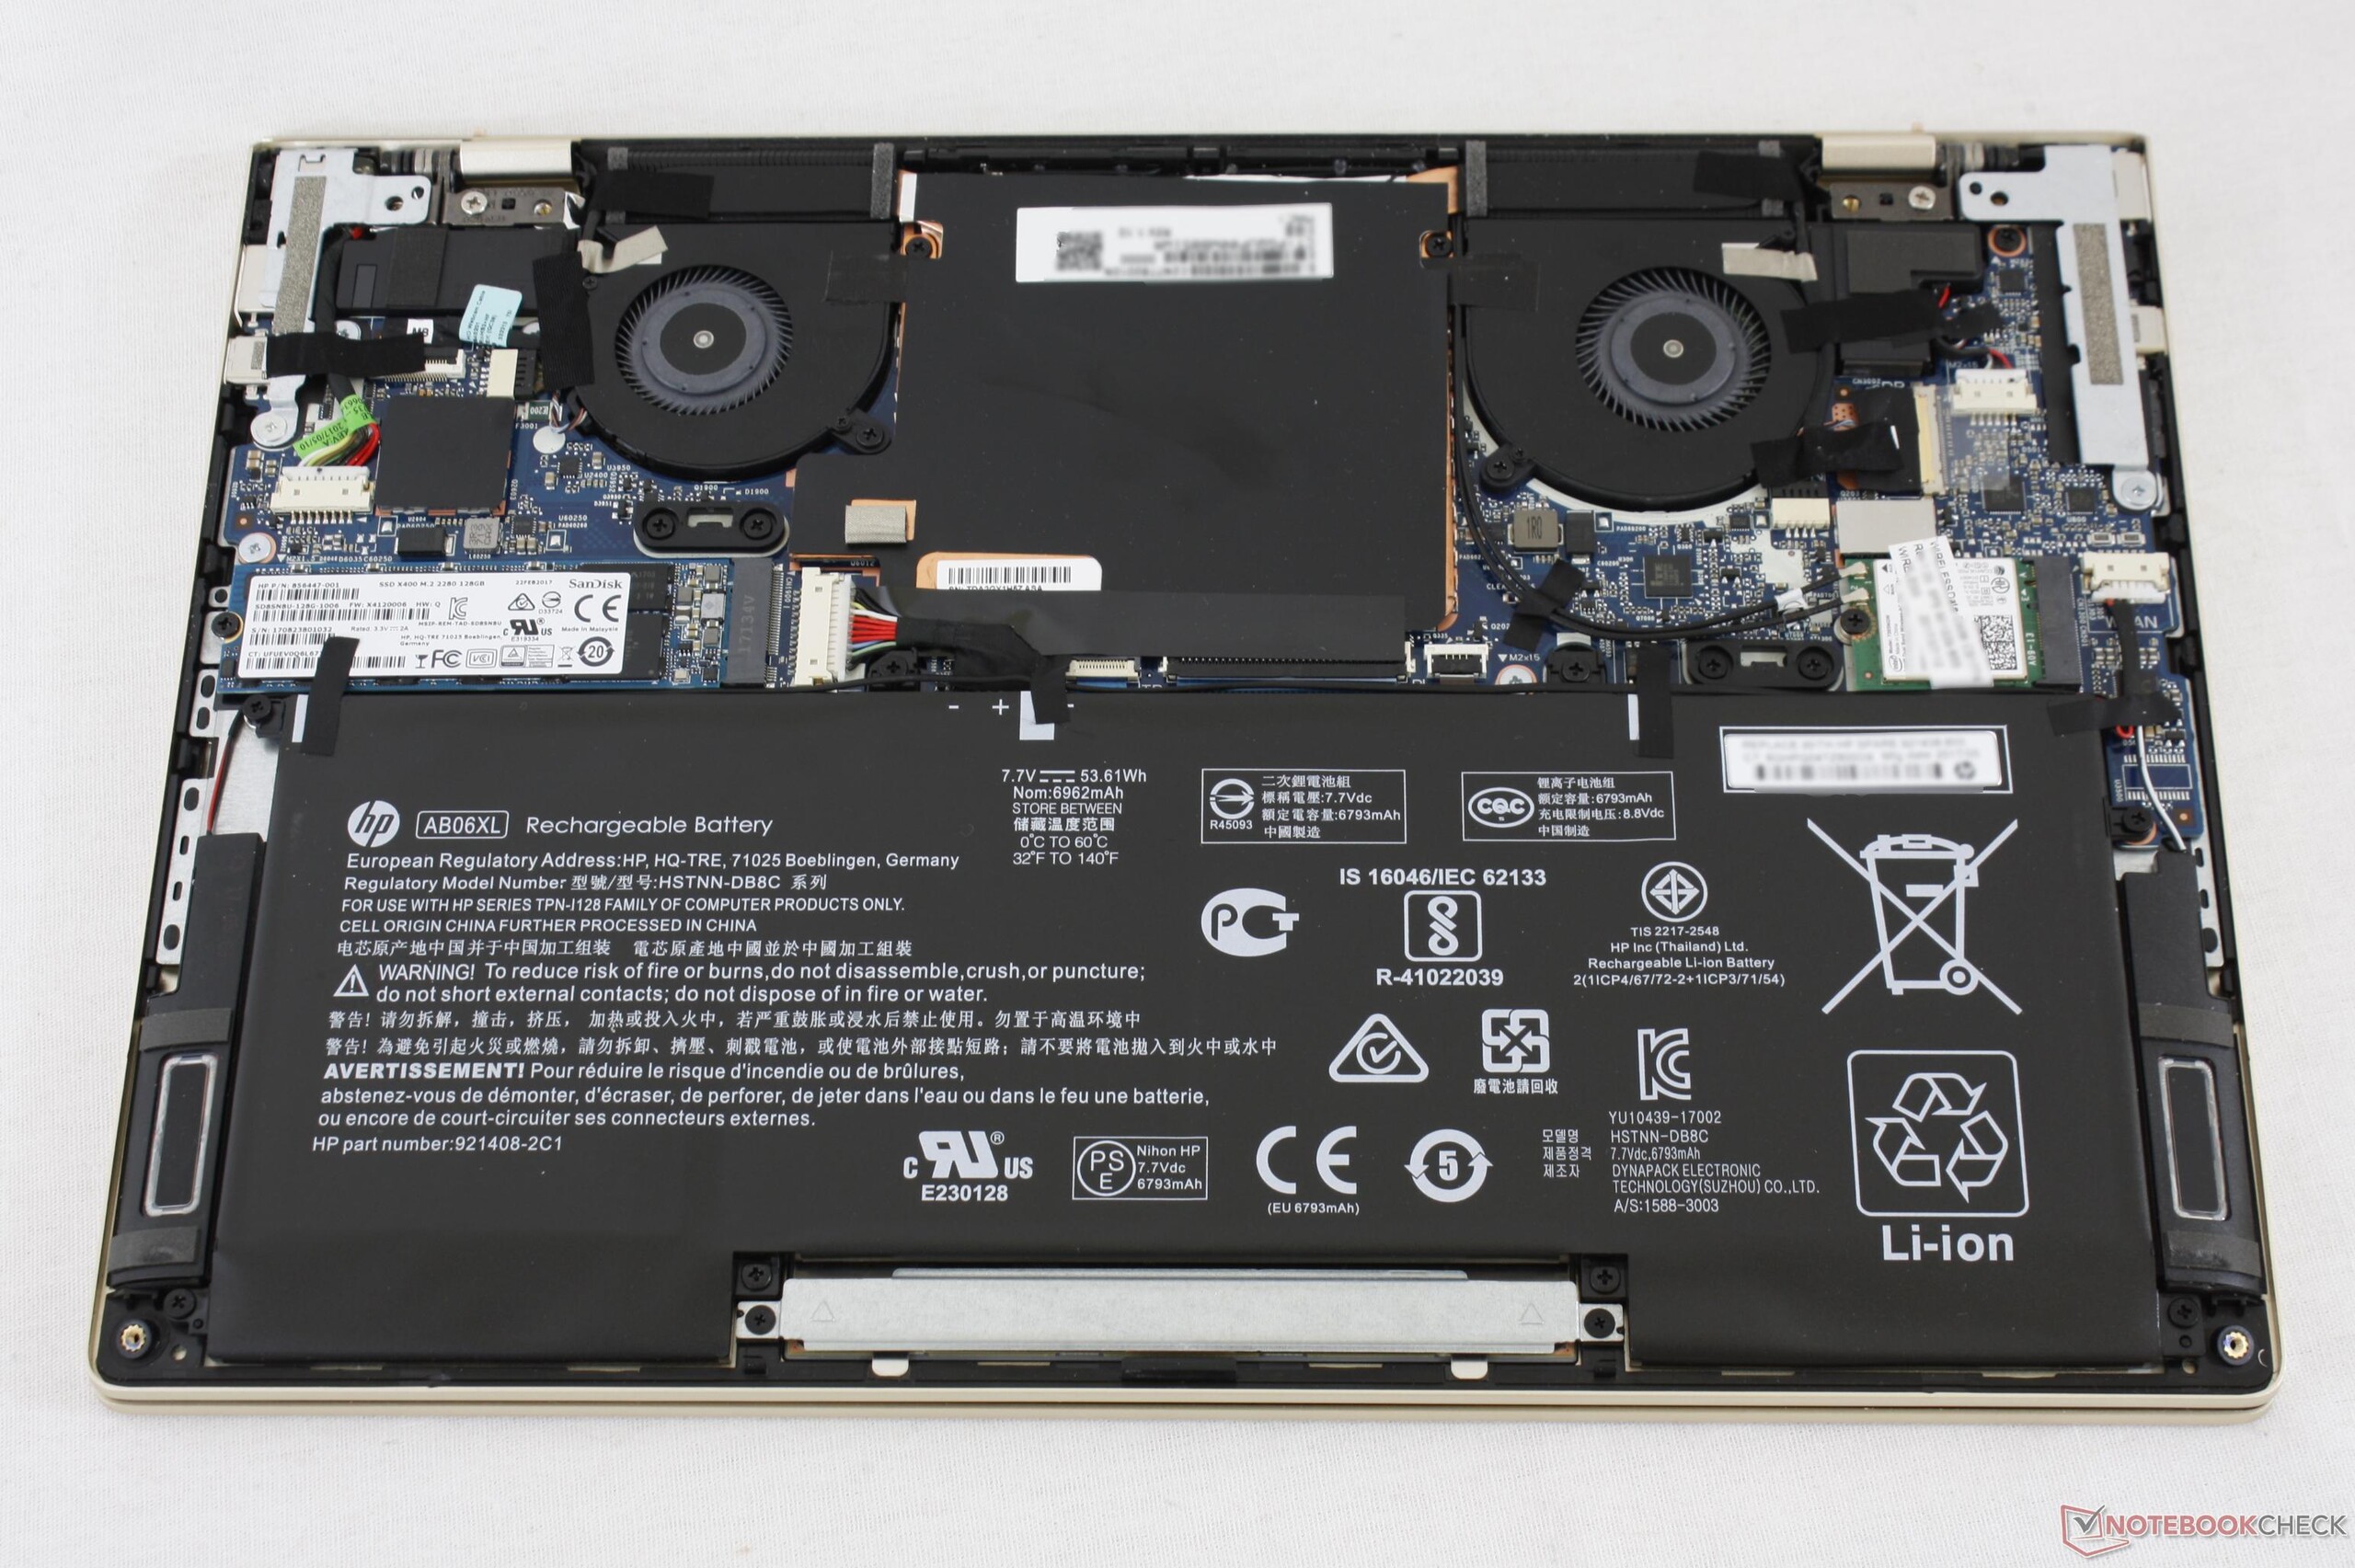
| HP Envy 13-ad006ng i7-7500U, GeForce MX150, 51 Wh | HP Envy 13-ad065nr i5-7200U, HD Graphics 620, 53.6 Wh | Lenovo IdeaPad 710S Plus-13IKB i7-7500U, GeForce 940MX, 46 Wh | Asus Zenbook UX310UA-FC347T iGP i7-7500U, HD Graphics 620, 48 Wh | Dell XPS 13 i7-8550U i5-8550U, UHD Graphics 620, 60 Wh | Xiaomi Mi Notebook Air 13.3 2016 6200U, GeForce 940MX, 40 Wh | |
|---|---|---|---|---|---|---|
| Duração da bateria | 21% | -36% | -1% | 17% | -22% | |
| Reader / Idle (h) | 20 | 24.8 24% | 7.8 -61% | 16.1 -19% | 18.5 -7% | 12 -40% |
| H.264 (h) | 7.9 | 6.9 -13% | 7.1 -10% | |||
| WiFi v1.3 (h) | 7.1 | 9.5 34% | 5.6 -21% | 9.6 35% | 9.8 38% | 6.5 -8% |
| Load (h) | 2 | 2.1 5% | 1.5 -25% | 1.9 -5% | 2.4 20% | 1.4 -30% |
Pro
Contra
O Envy 13 da HP é um Ultrabook convencional de 13,3 polegadas projetado para competir com o Dell XPS 13 - também com o seu preço. No que diz respeito a esse objetivo elevado, o Envy fica para trás.
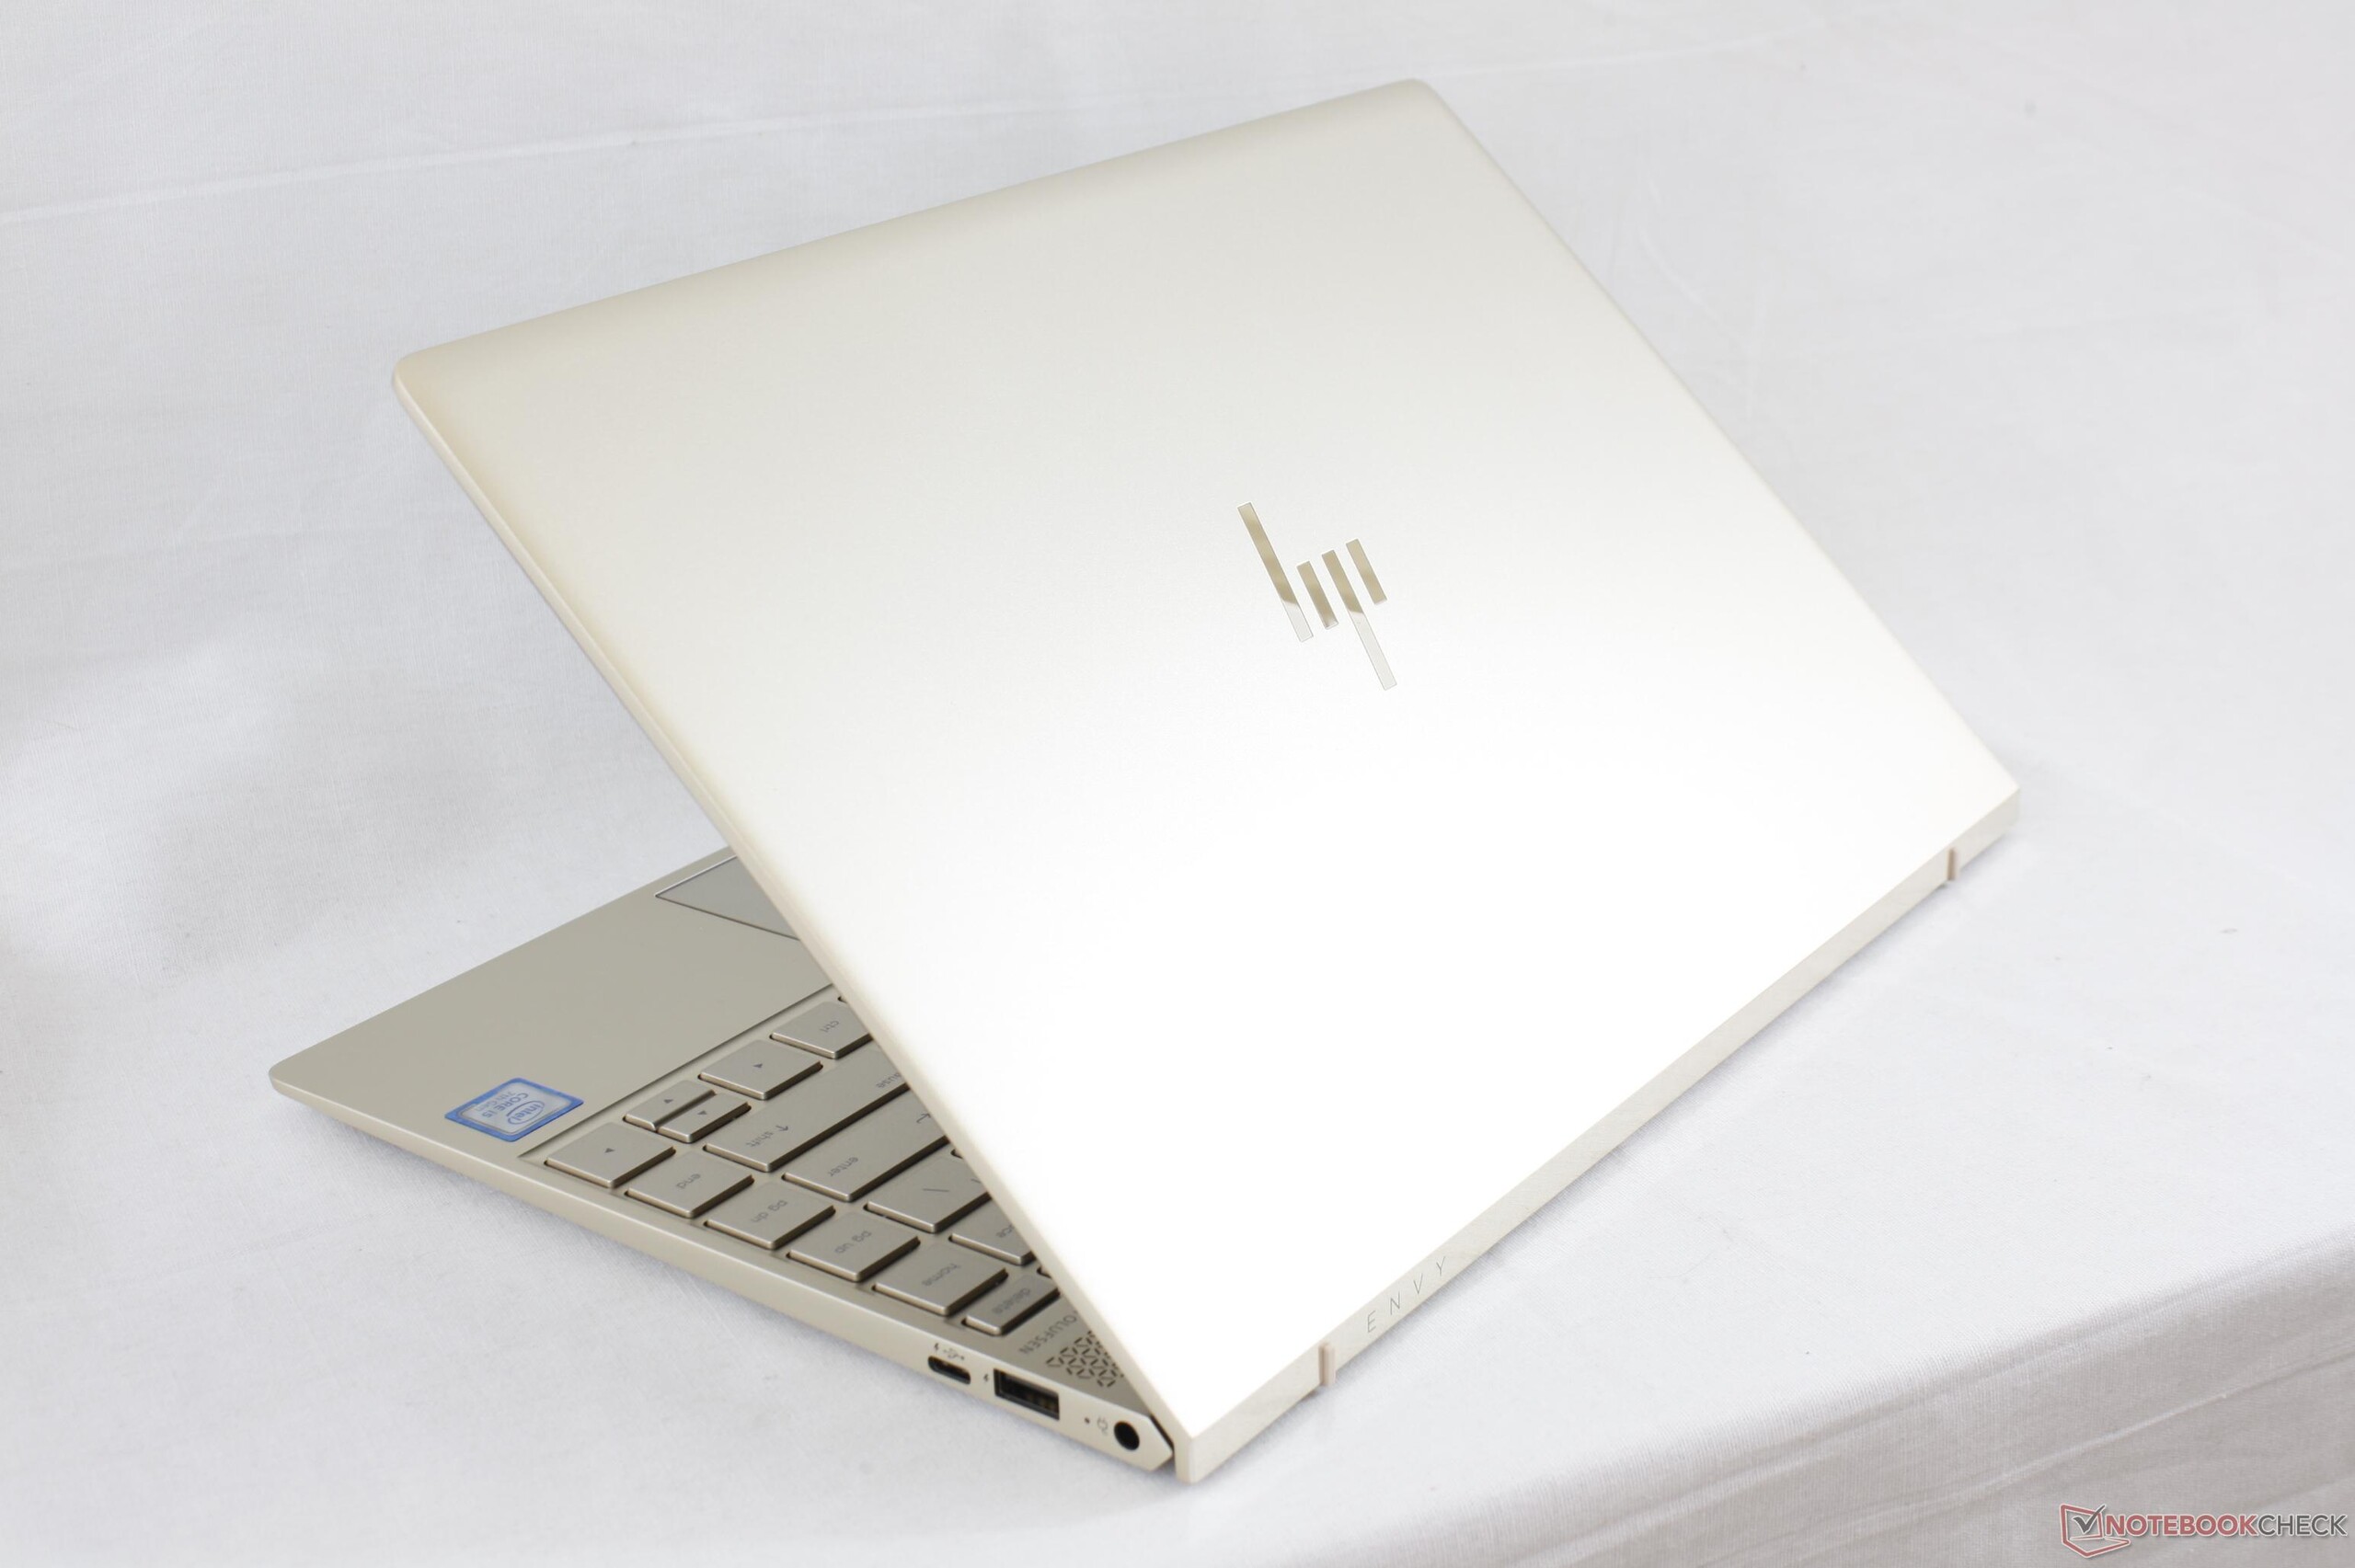
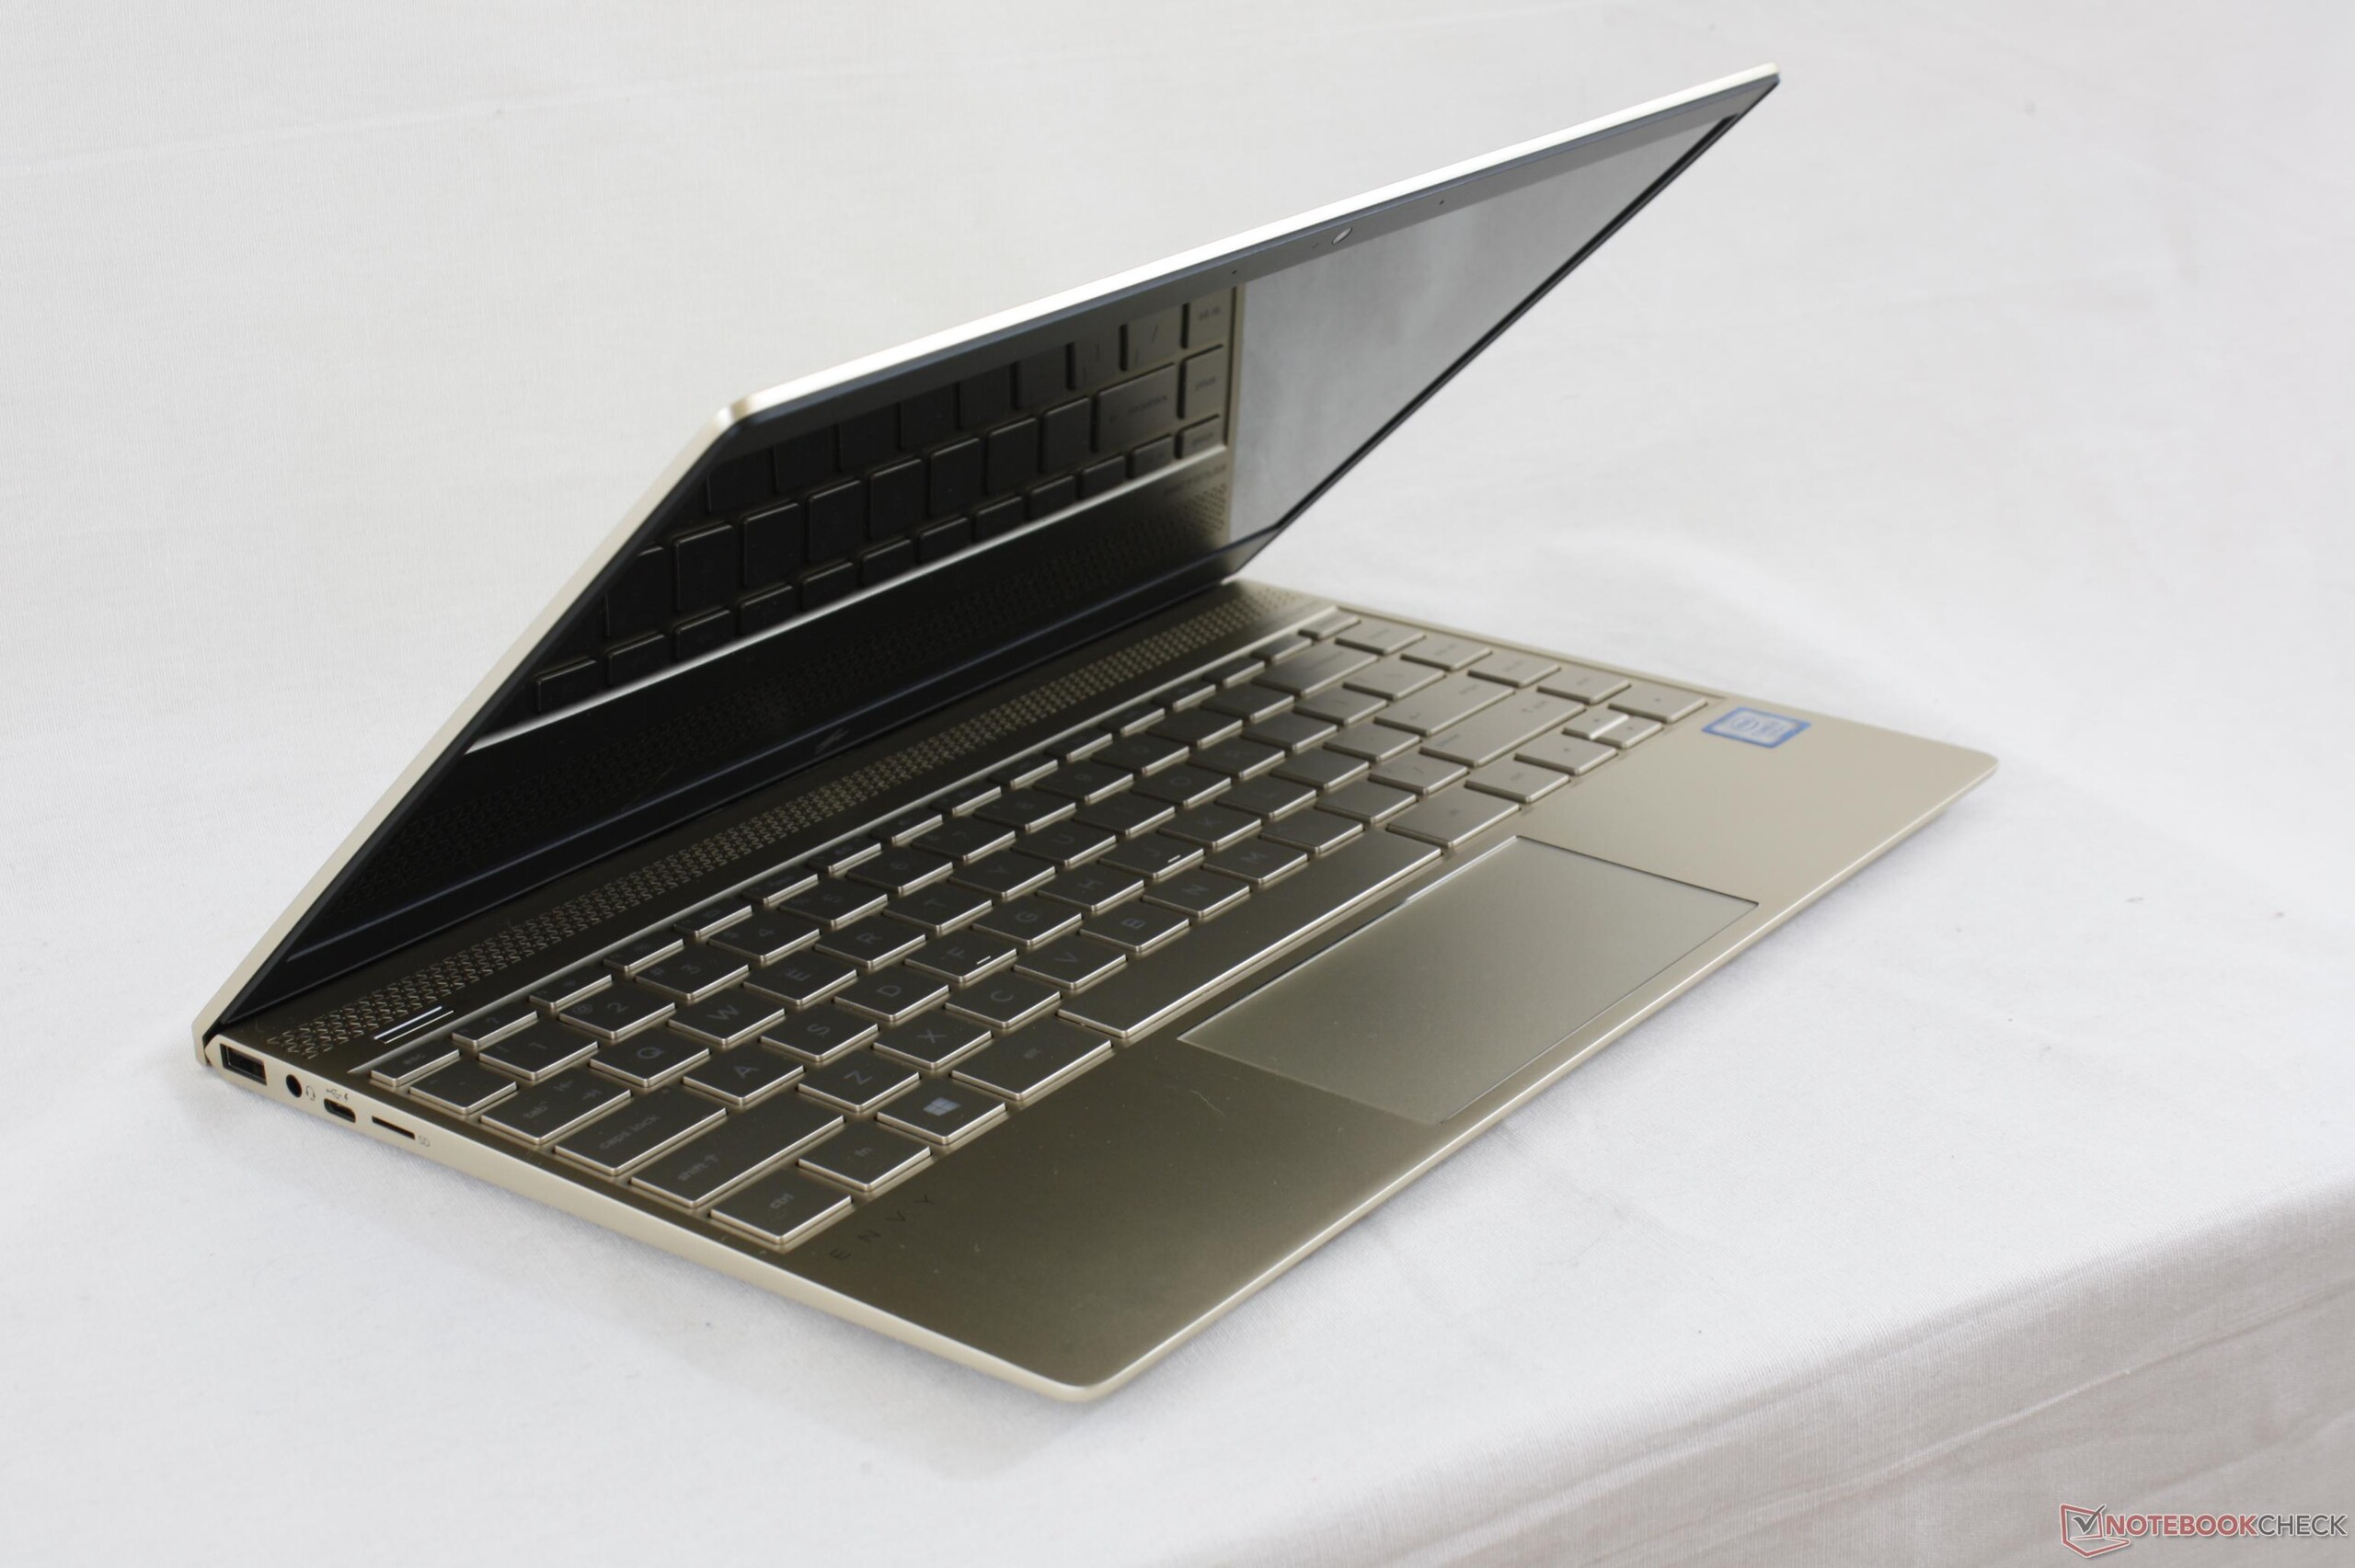
Há uma coisa que o XPS 13 não oferece: uma GPU dedicada. Essa é uma vantagem clara para a HP, dado que o MX150 será um fator decisivo para muitos clientes. O Envy faz muitas coisas muito bem: a qualidade de construção é excelente e o chassi é - graças aos marcos finos - muito compacto e atraente. O sistema de resfriamento também é muito capaz e tudo está bem quando se trata do nível de ruído e das temperaturas. A tela tem sua parcela de fraquezas, mas subjetivamente, parece muito boa, é muito nítida e oferece um bom contraste.
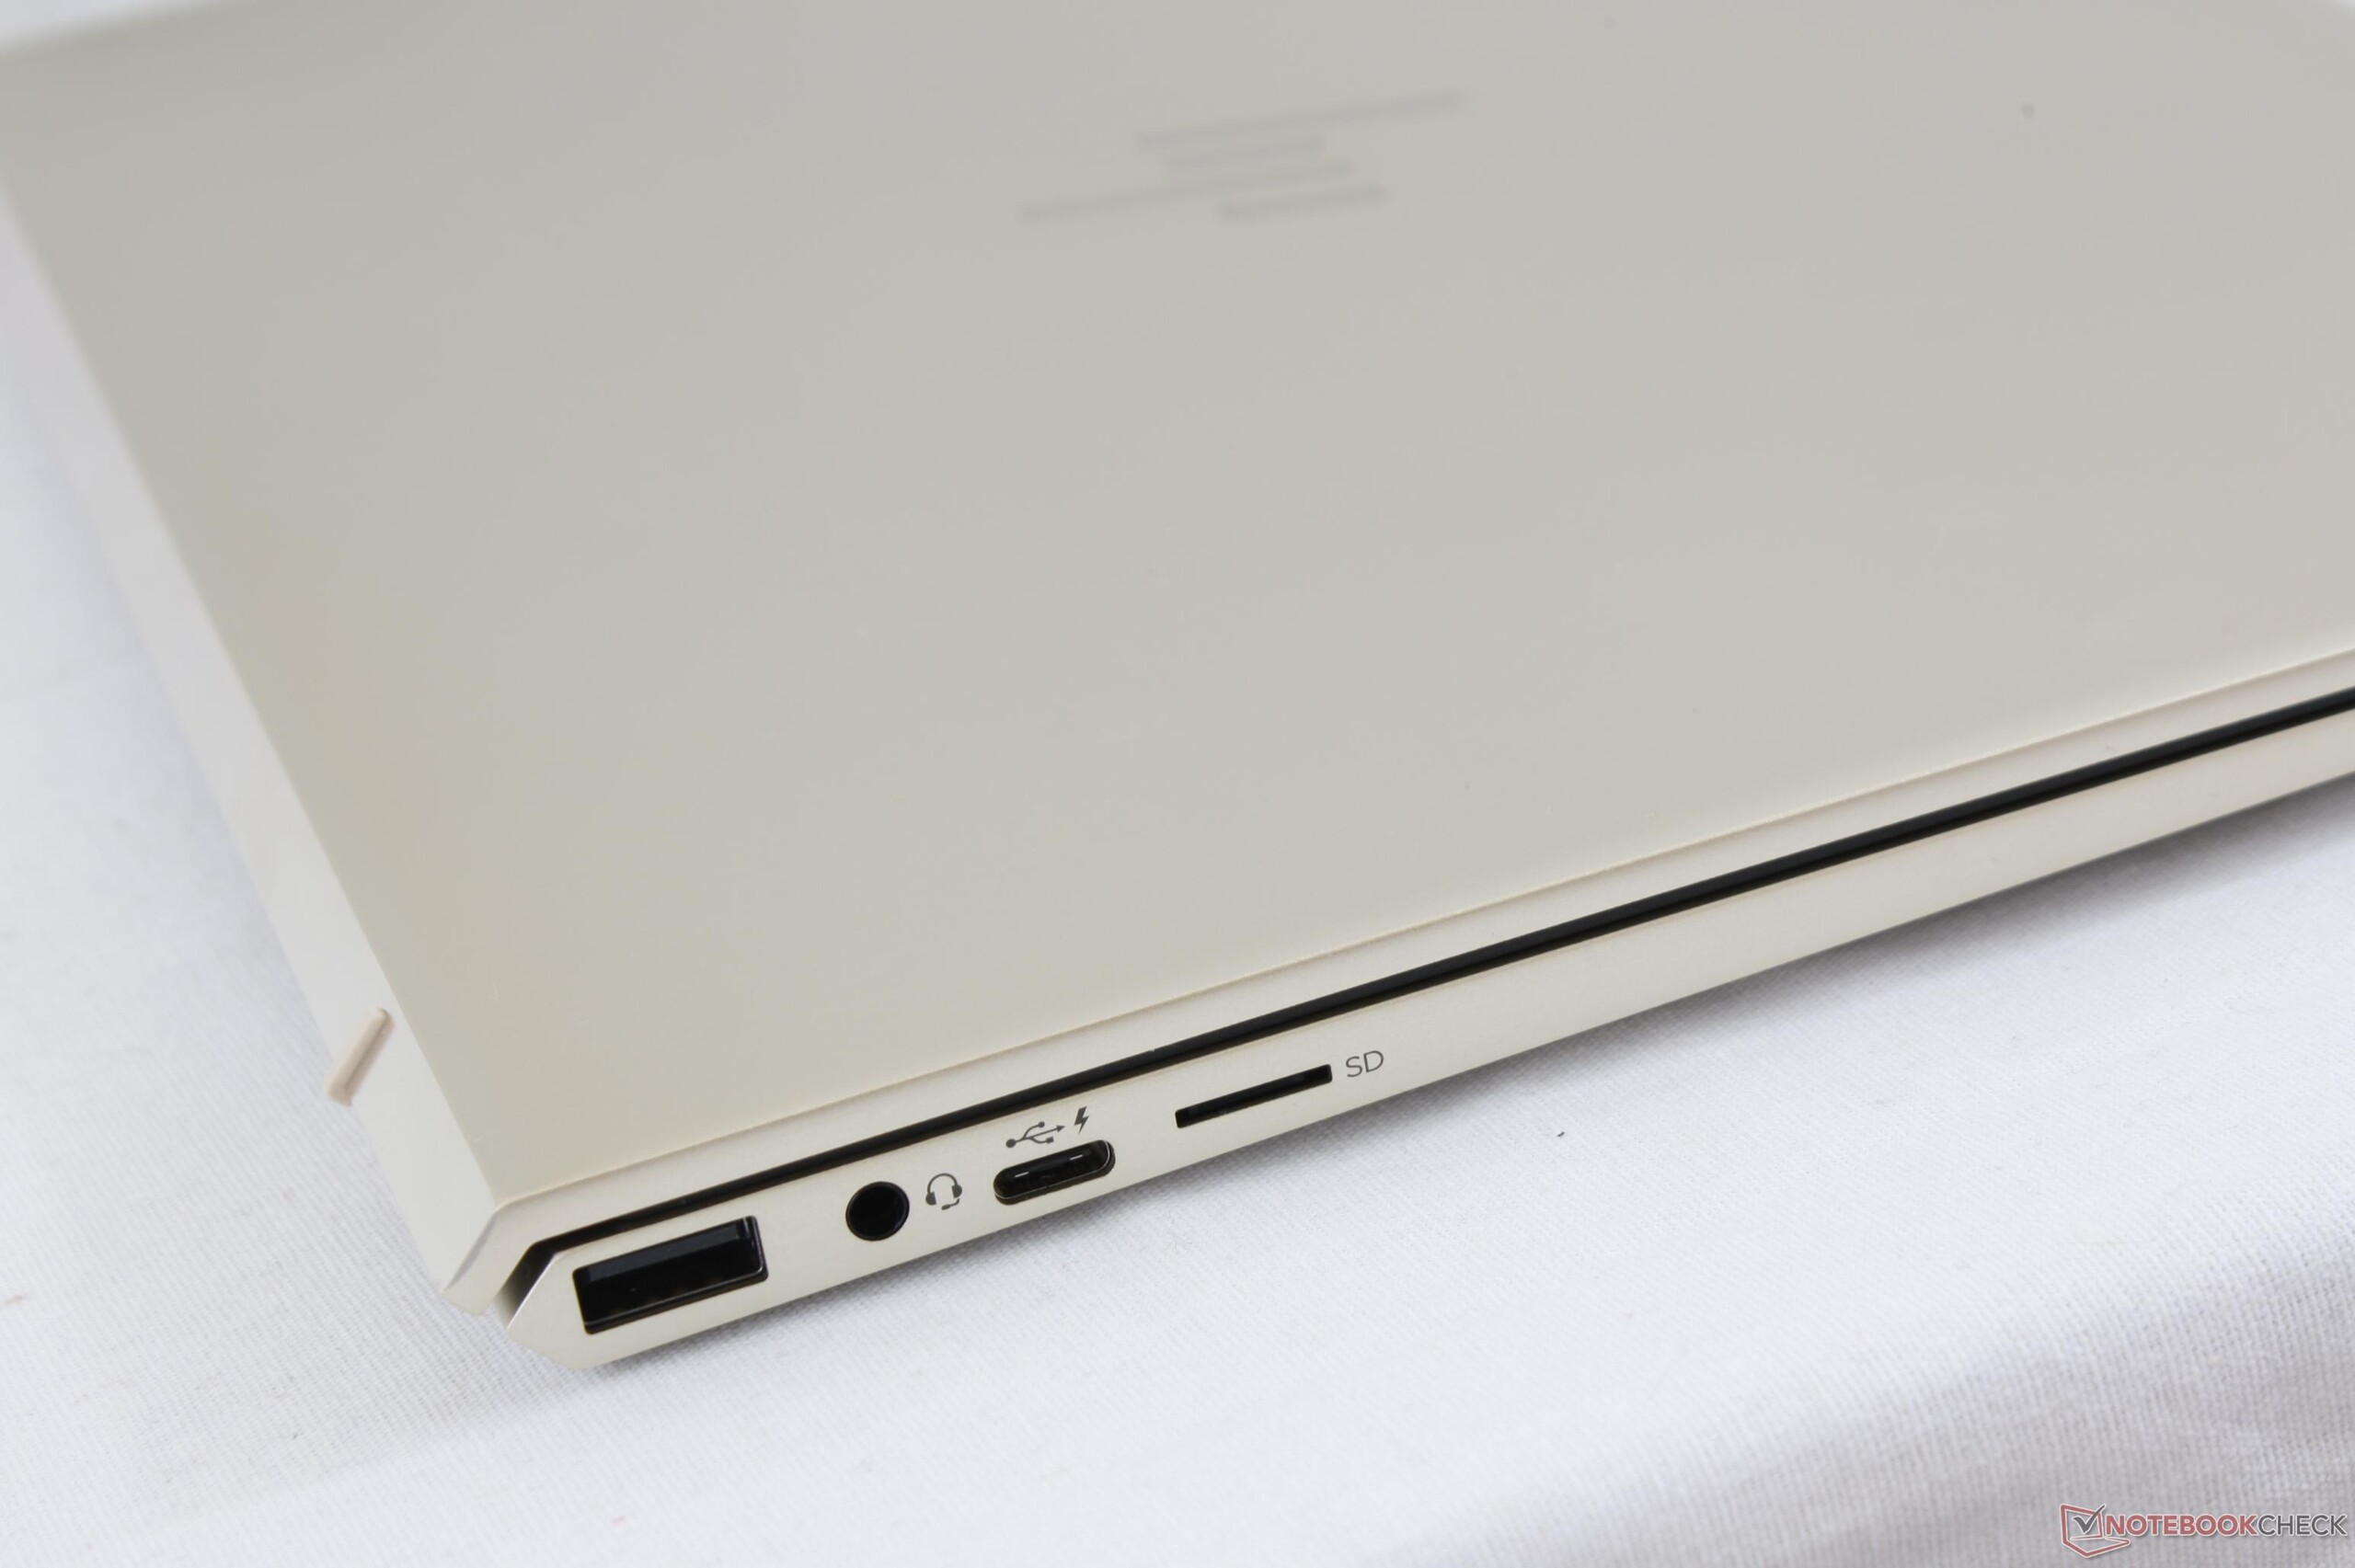
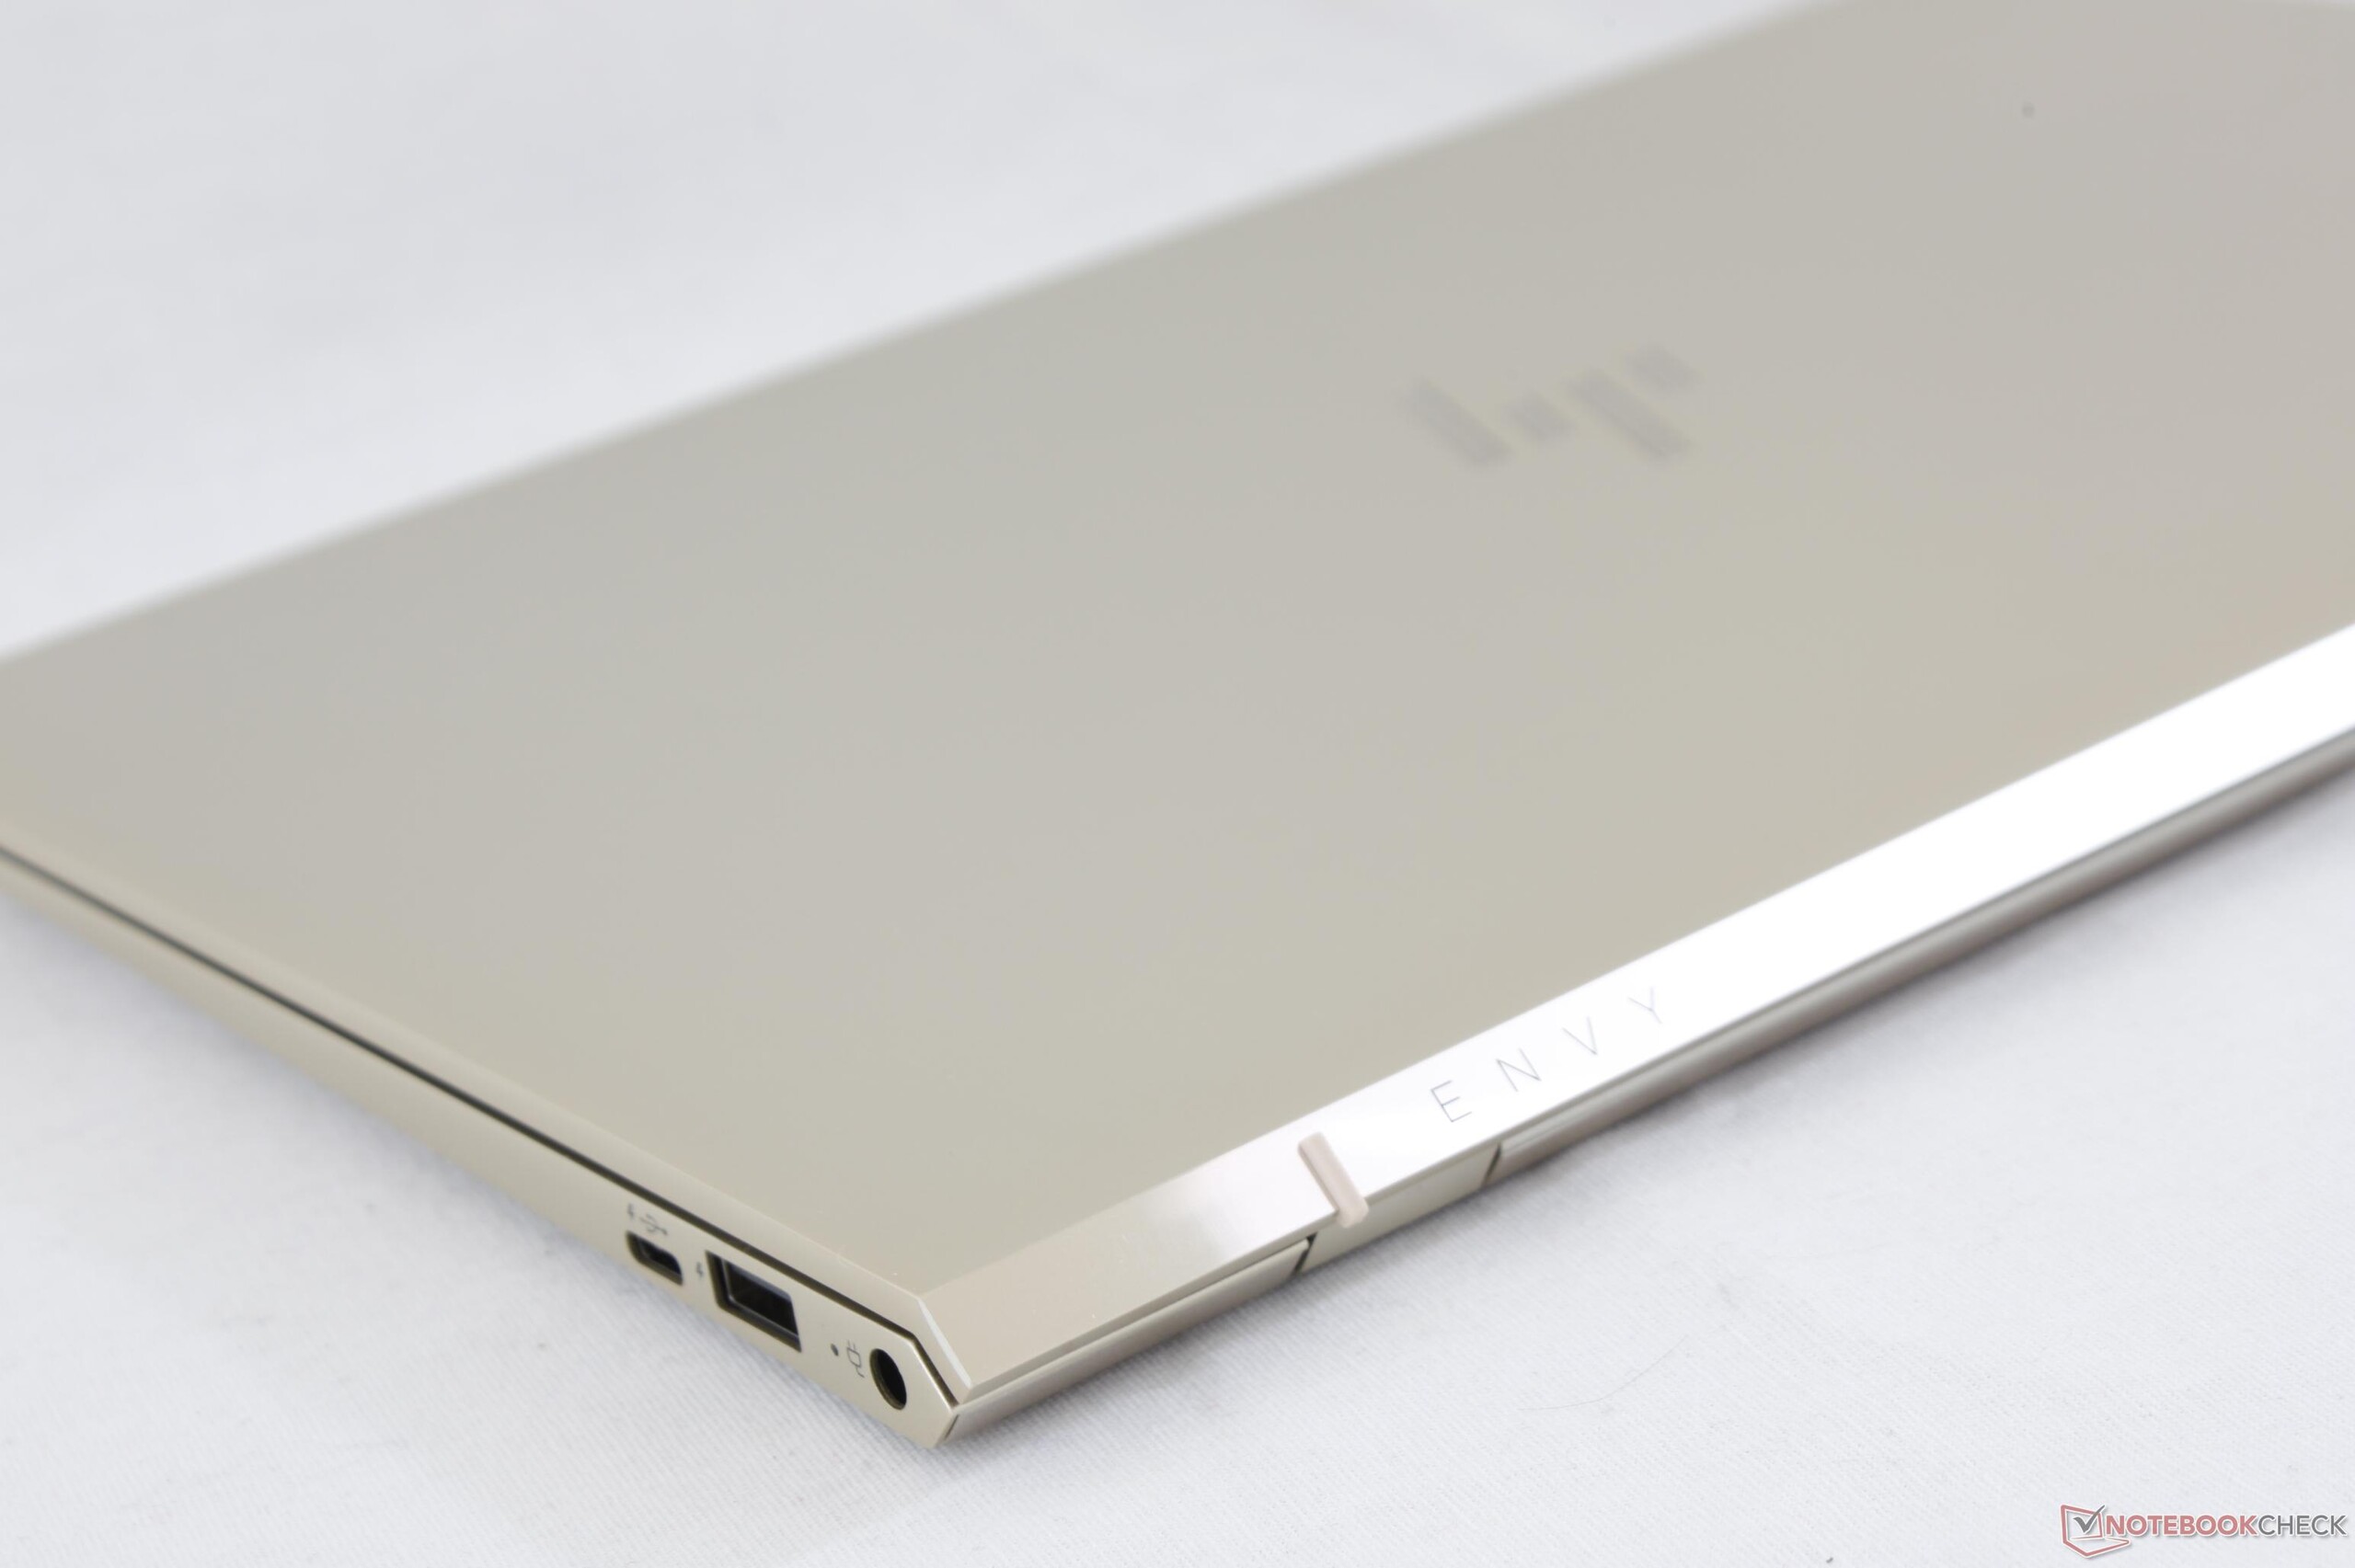
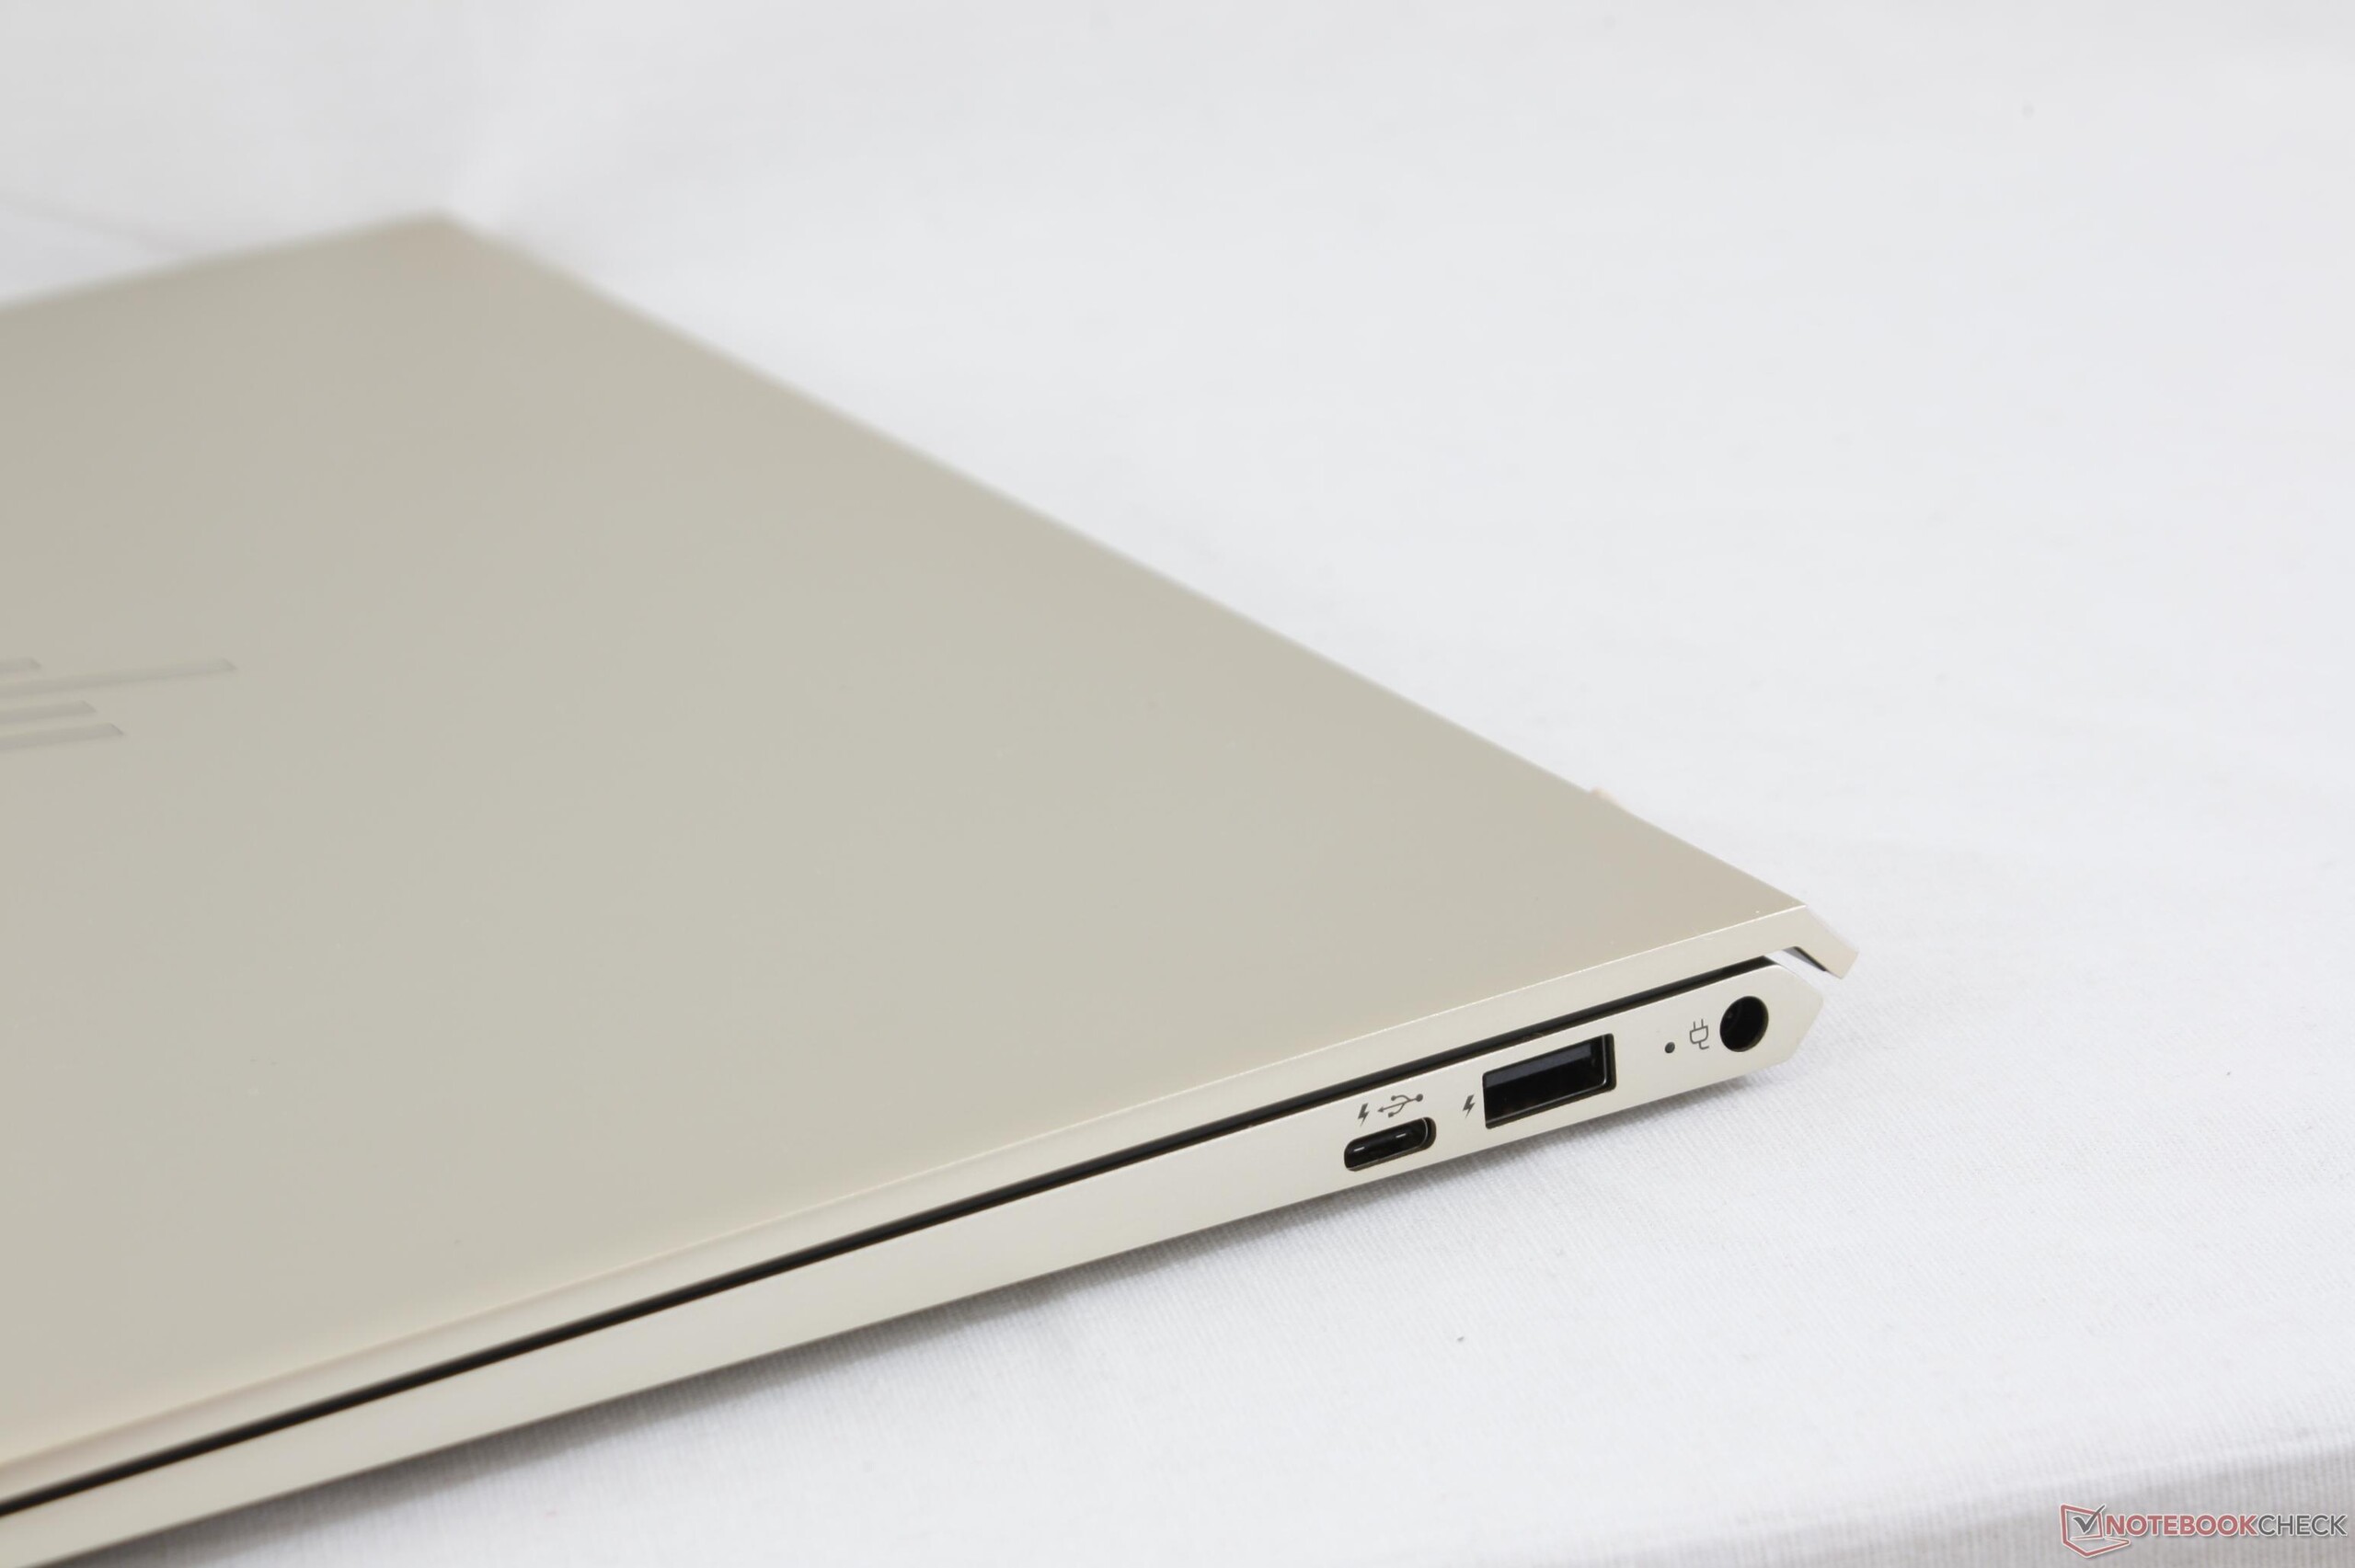
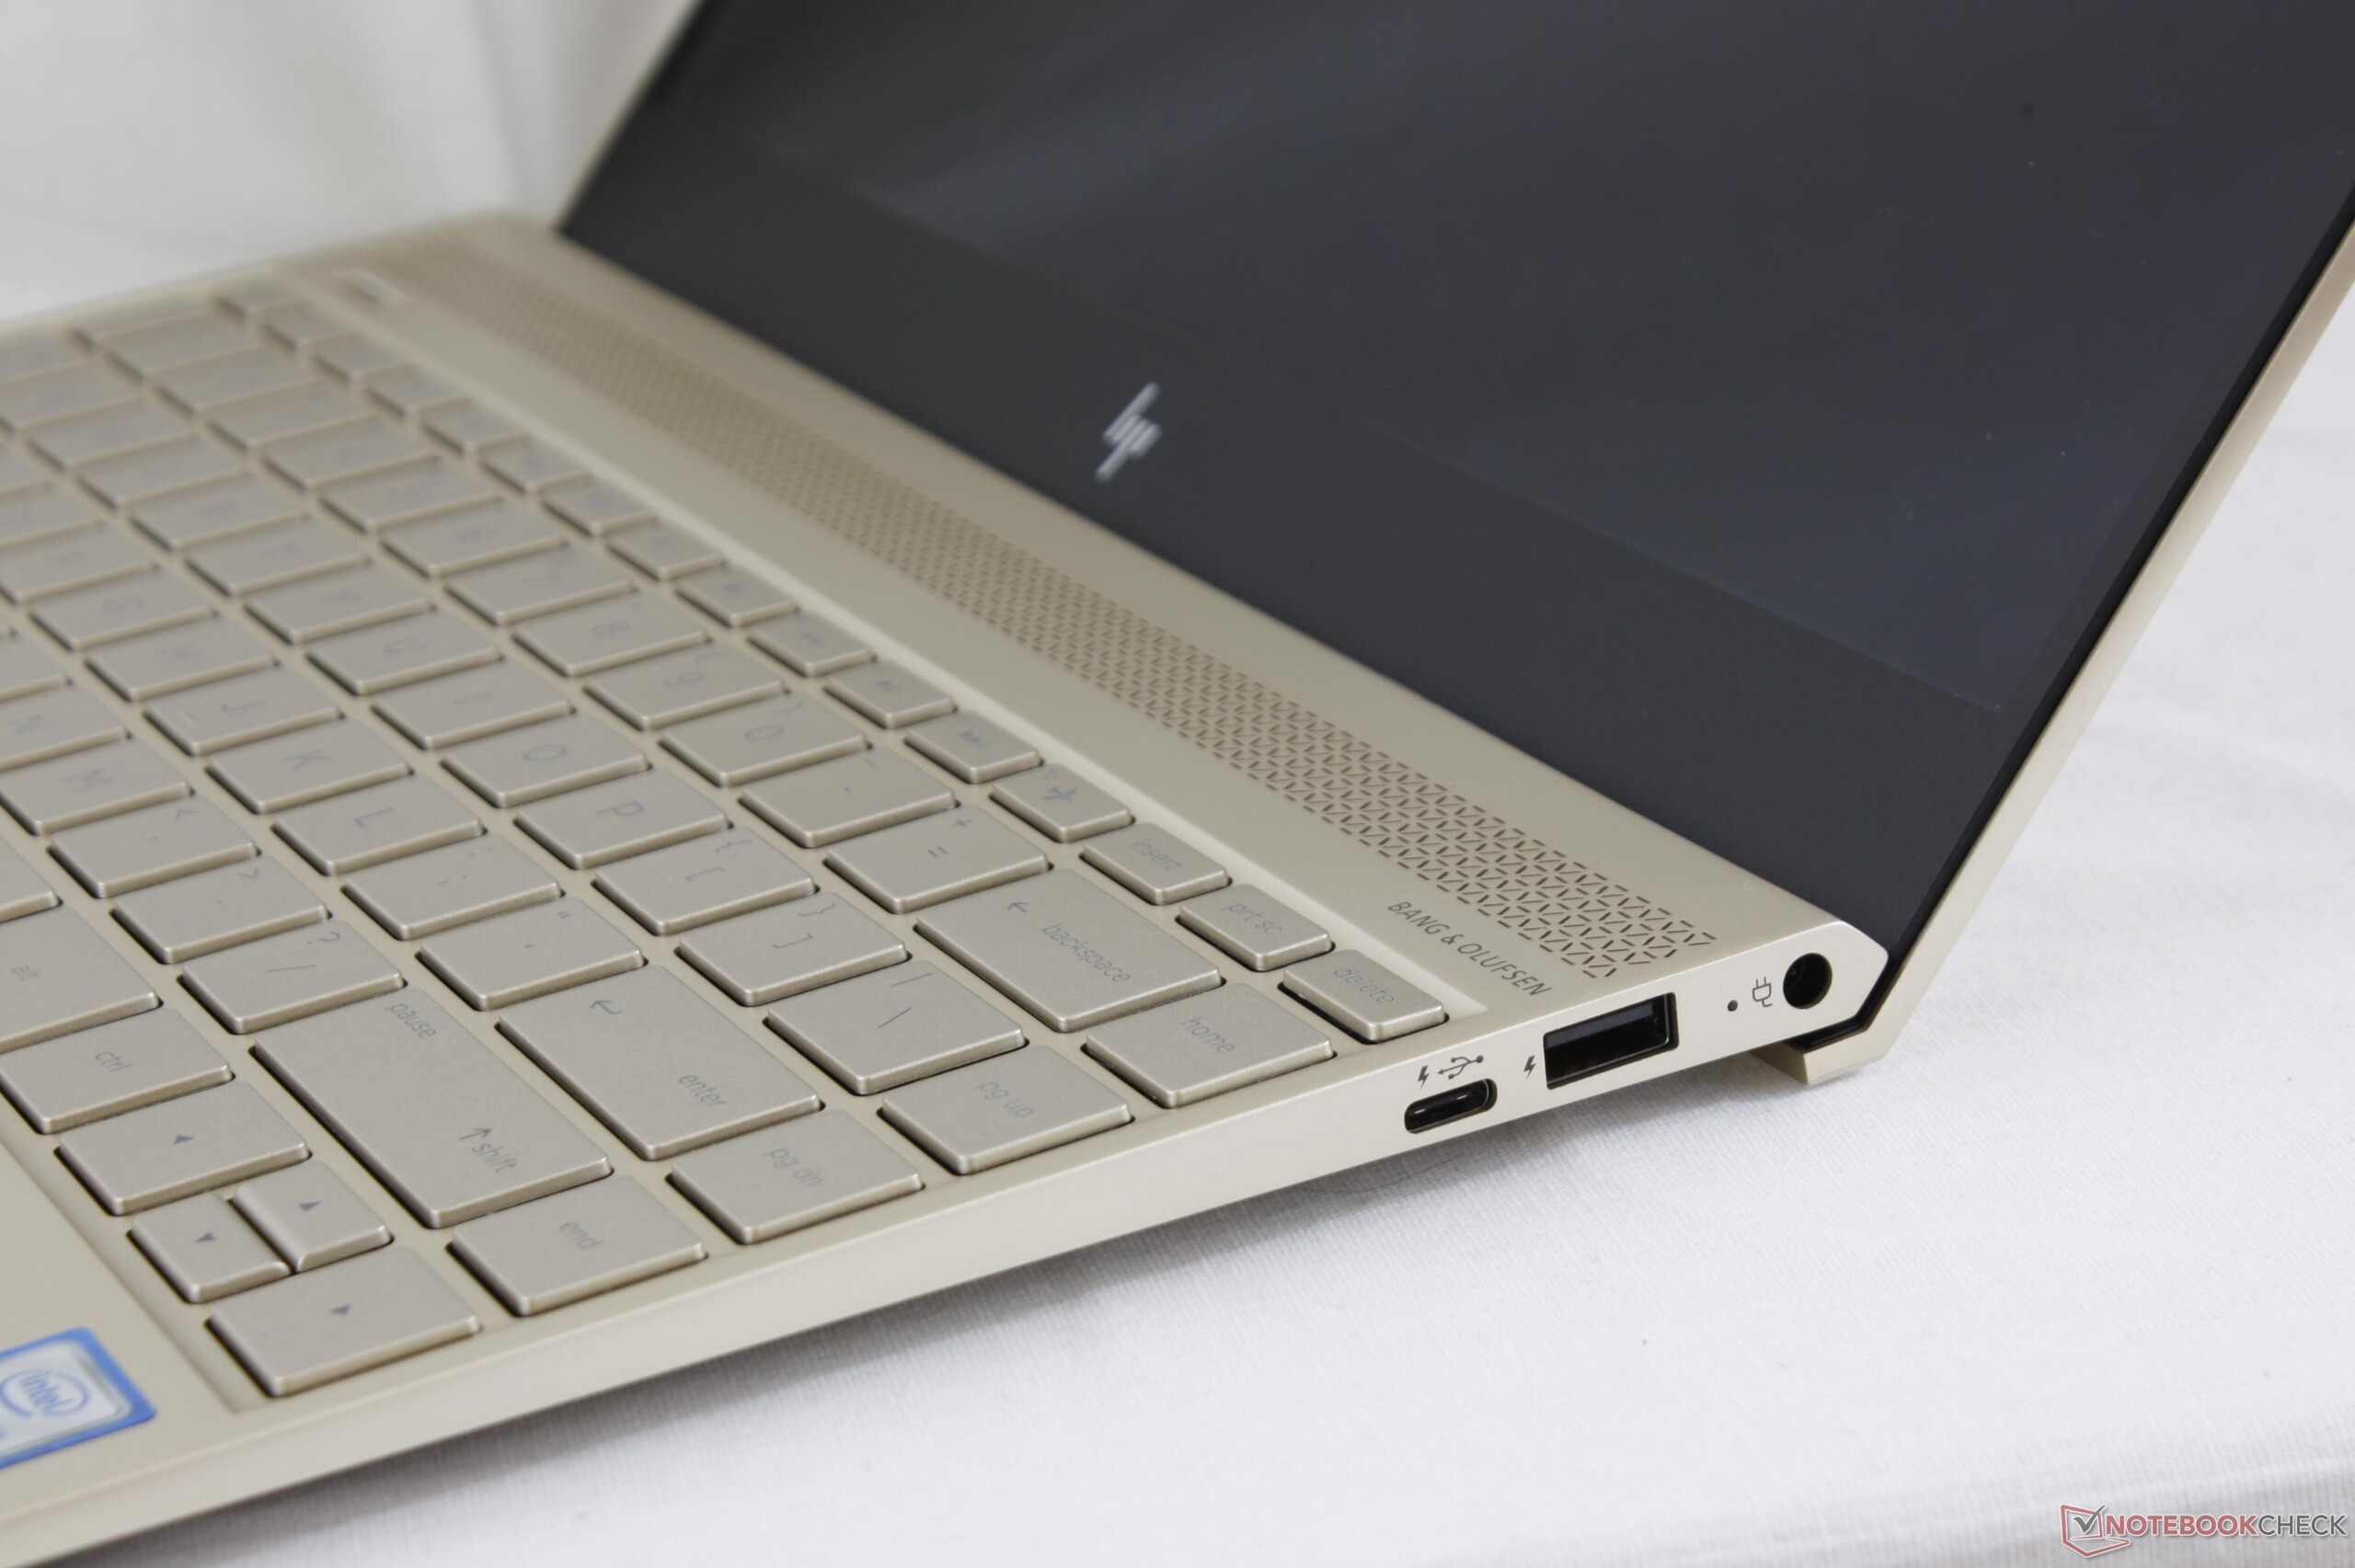
Entretanto, o brilho da tela não está no nível da concorrência. O que piora as coisas aqui é o fato de que não existe uma opção de painel mate, o que restringe a adequação para o uso em exteriores um pouco - um verdadeiro problema, considerando este é um subportátil. A seleção das portas também é inferior: gostaríamos de incluir a inclusão de HDMI, um slot de cartão SD de tamanho completo e o Thunderbolt 3. Não ficamos muito satisfeitos com o touchpad do Envy 13-ad065nr e nosso descontentamento continua aqui, dado que o teclado de vidro faz um barulho notável. Outra desvantagem potencial do sistema de alto desempenho é o fato de que o afogamento térmico ocorre durante o teste de estresse. Este afogamento poderia ocorrer potencialmente durante o uso regular também.
Às vezes, o original é simplesmente melhor: não podemos realmente apresentar motivos suficientes para recomendar o HP Envy 13 sobre o Dell XPS 13.
Apesar dessas falhas, o Envy 13 não é um portátil ruim. Além do preço ligeiramente mais baixo e da GPU dedicada, simplesmente não encontramos muitos argumentos para o Envy. O Dell XPS é superior e melhor quando se trata das portas físicas, do brilho da tela e da duração da bateria. Nossa configuração também já está desatualizada - um sucessor com Core i7-8550U já está disponível. Por esse motivo, não podemos realmente recomendar a nossa versão específica. Os usuários interessados no Envy 13 devem procurar um modelo com os mais novos componentes de hardware.
HP Envy 13-ad006ng
- 10/17/2017 v6 (old)
Benjamin Herzig
Price comparison
