Breve Análise do Portátil HP ProBook 450 G4 Y8B60EA
| SD Card Reader | |
| average JPG Copy Test (av. of 3 runs) | |
| HP ProBook 450 G4 Y8B60EA | |
| Lenovo ThinkPad E560-20EWS00000 | |
| Dell Latitude 15-3570 | |
| maximum AS SSD Seq Read Test (1GB) | |
| HP ProBook 450 G4 Y8B60EA | |
| Lenovo ThinkPad E560-20EWS00000 | |
| Dell Latitude 15-3570 | |
| Networking | |
| iperf Server (receive) TCP 1 m | |
| Xiaomi Mi Notebook Air 13.3 2016 | |
| HP ProBook 450 G4 Y8B60EA | |
| Lenovo Ideapad 310-15IKB | |
| Dell Latitude 14 3470 | |
| iperf Client (transmit) TCP 1 m | |
| HP ProBook 450 G4 Y8B60EA | |
| Xiaomi Mi Notebook Air 13.3 2016 | |
| Lenovo Ideapad 310-15IKB | |
| Dell Latitude 14 3470 | |
| |||||||||||||||||||||||||
iluminação: 77 %
iluminação com acumulador: 214 cd/m²
Contraste: 498:1 (Preto: 0.43 cd/m²)
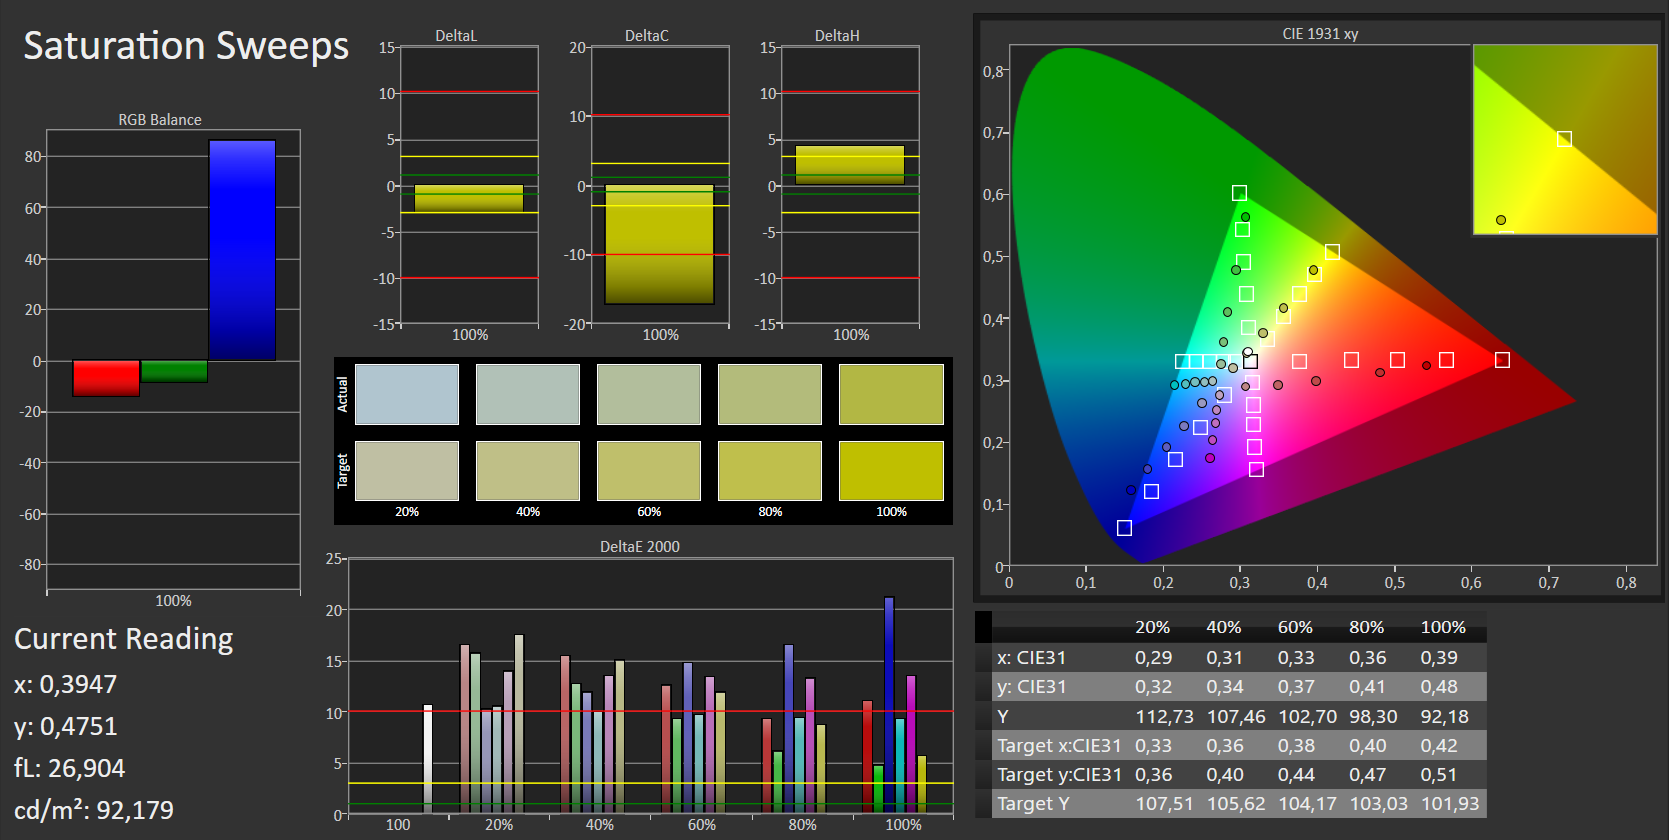
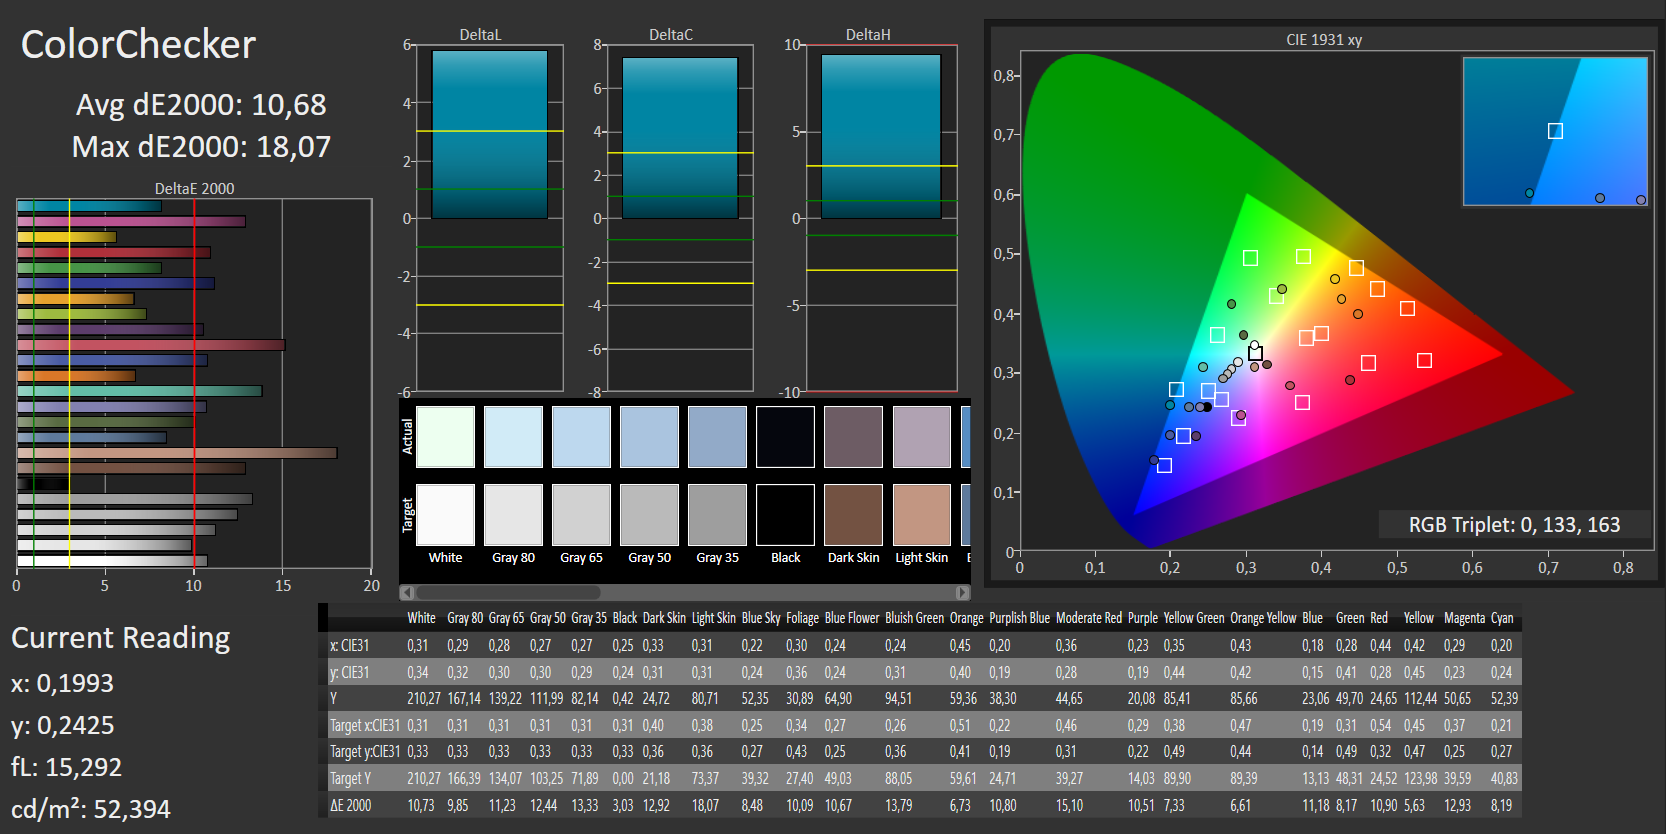
ΔE ColorChecker Calman: 10.68 | ∀{0.5-29.43 Ø4.71}
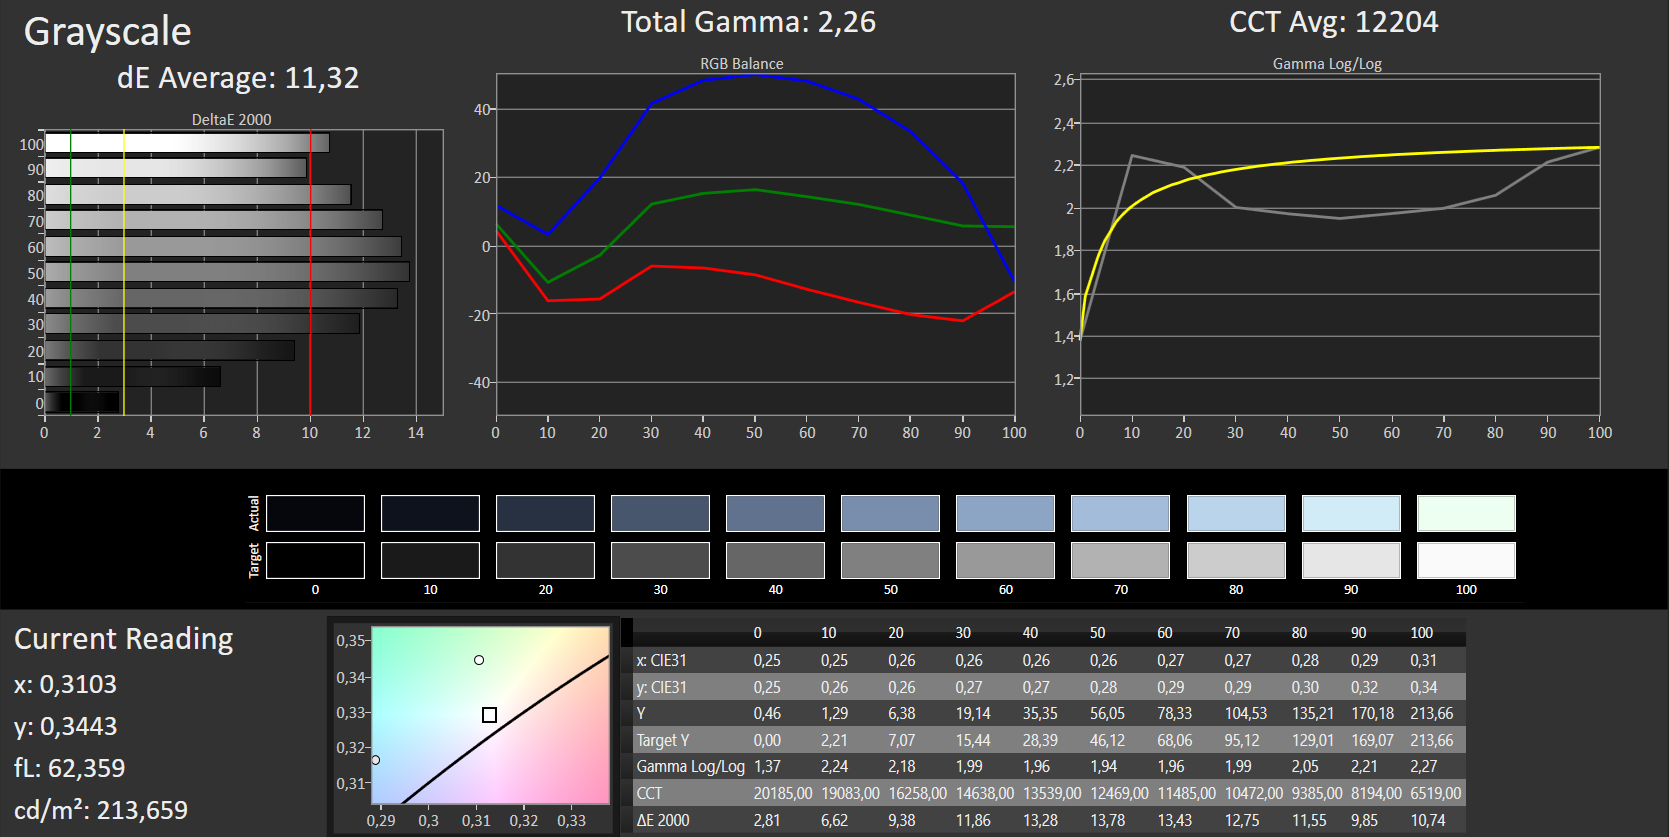
ΔE Greyscale Calman: 11.32 | ∀{0.09-98 Ø4.96}
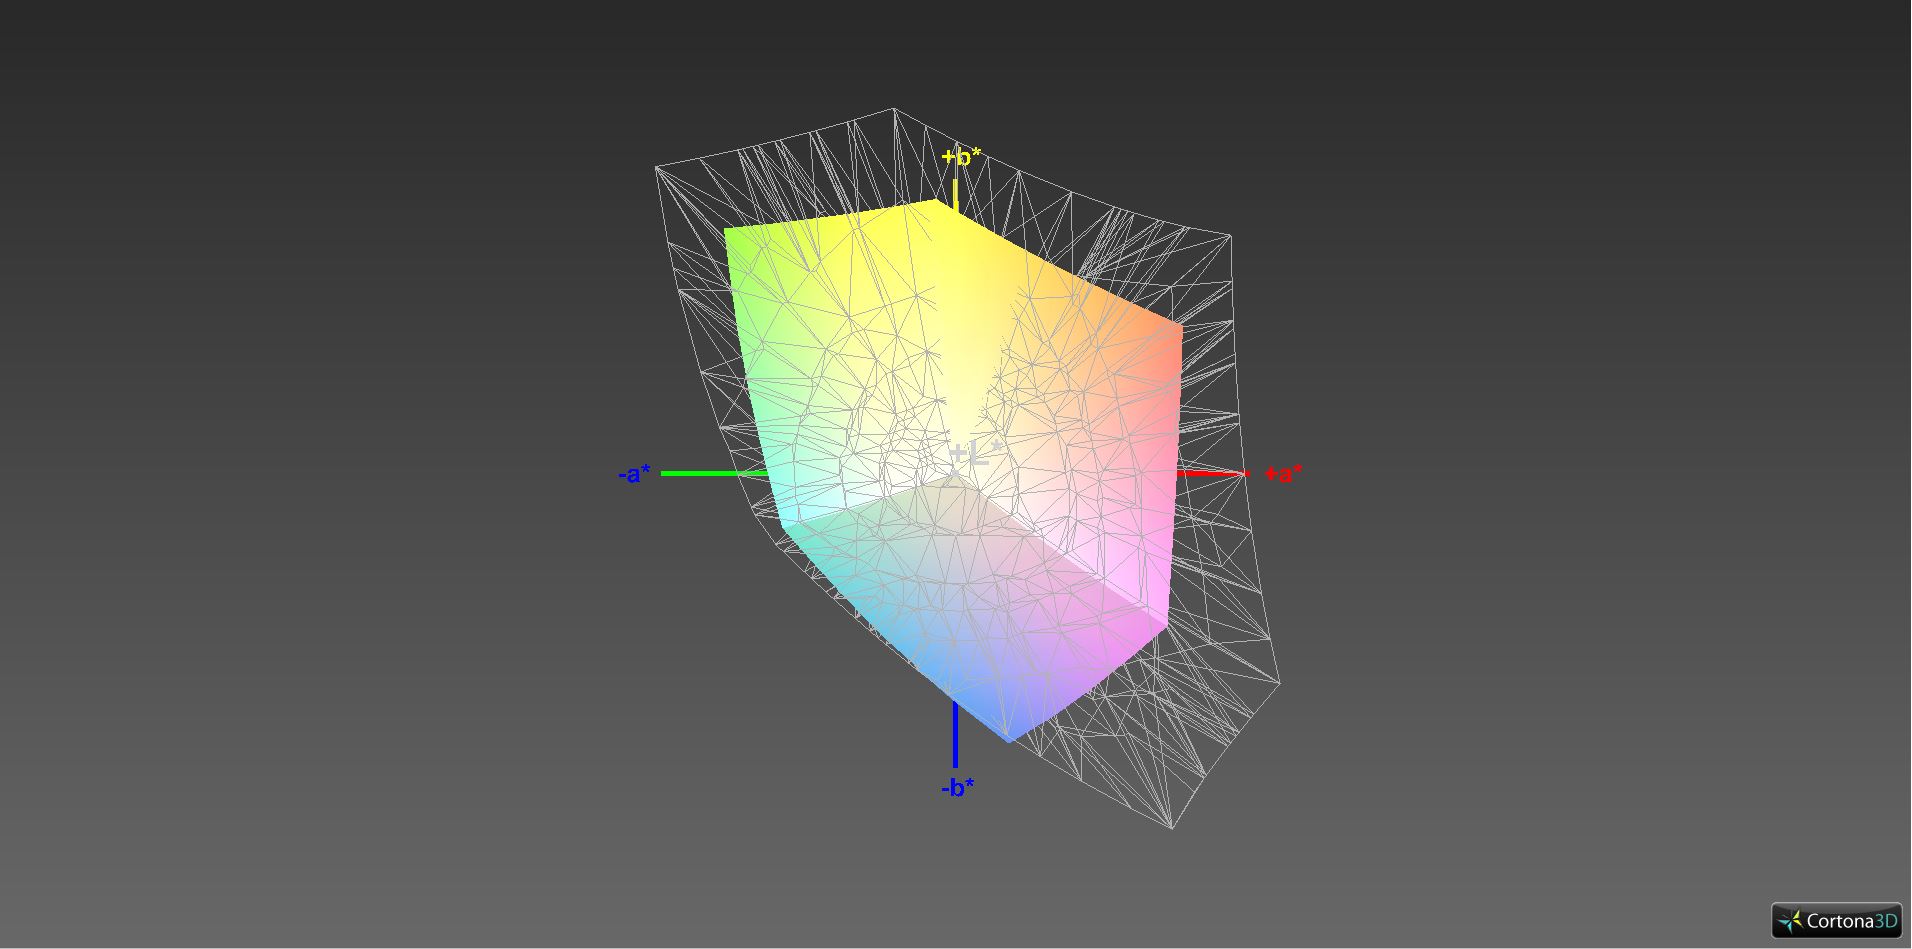
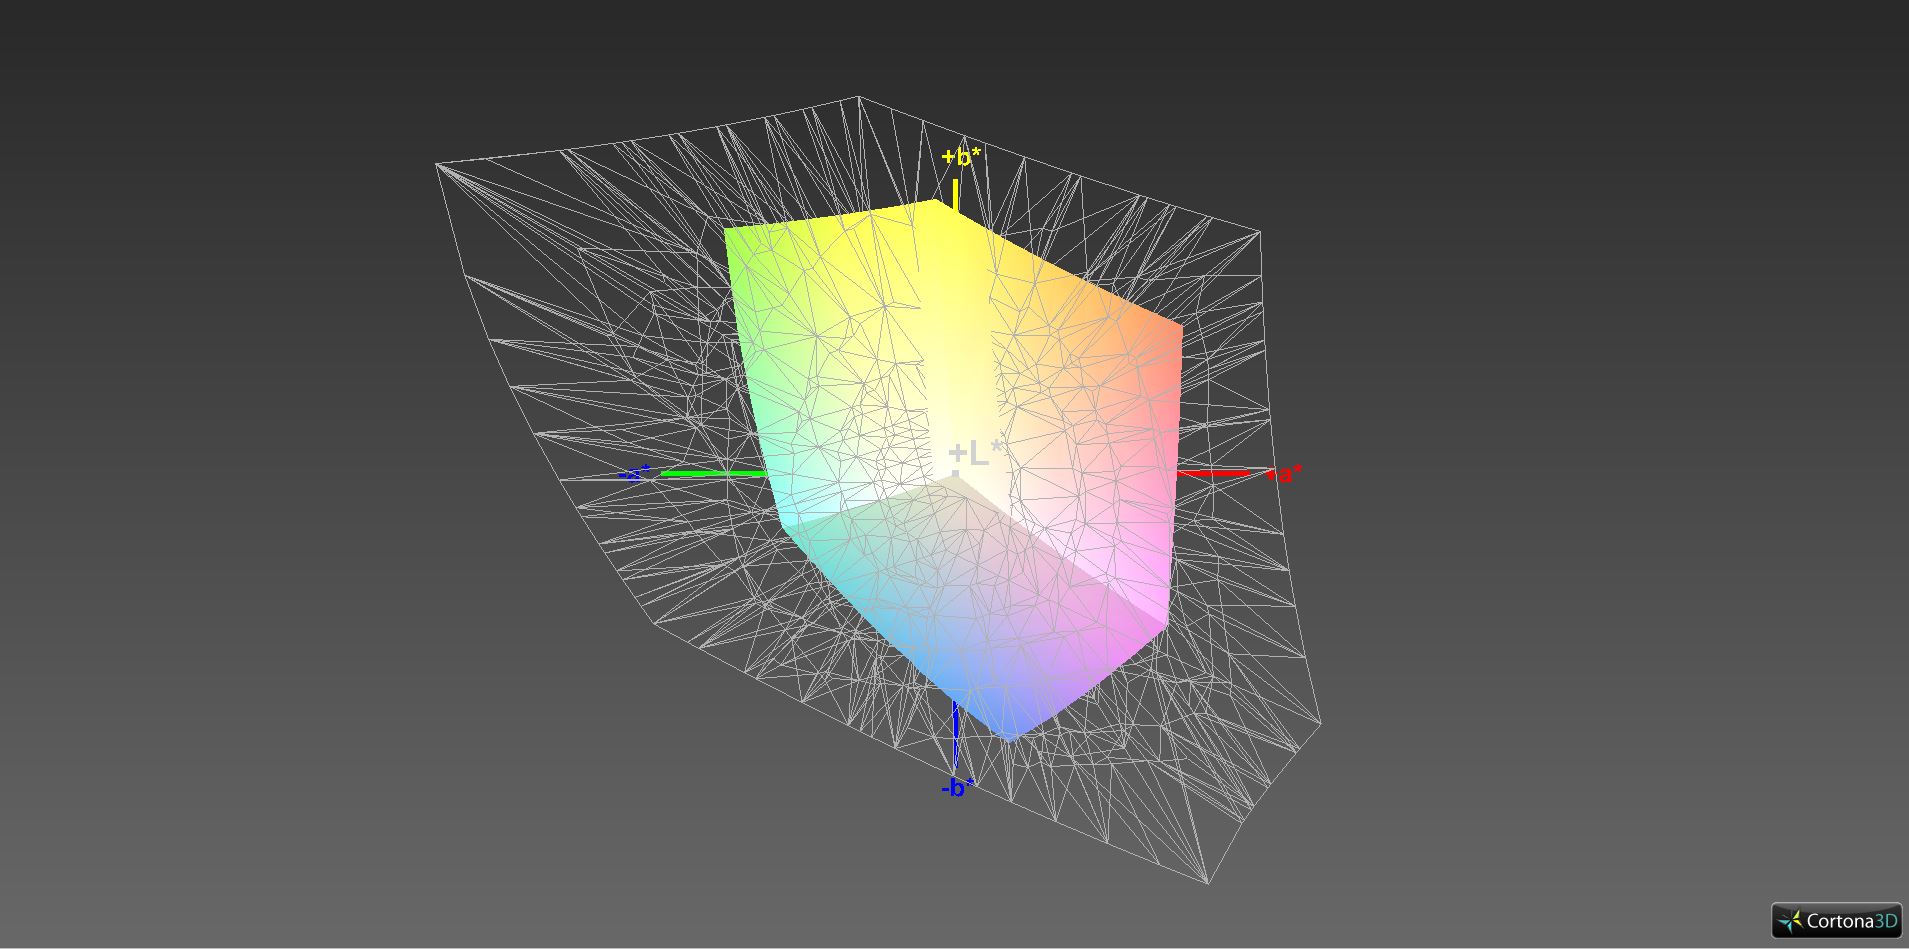
59% sRGB (Argyll 1.6.3 3D)
38% AdobeRGB 1998 (Argyll 1.6.3 3D)
41.24% AdobeRGB 1998 (Argyll 3D)
59.5% sRGB (Argyll 3D)
39.89% Display P3 (Argyll 3D)
Gamma: 2.26
CCT: 12204 K
| HP ProBook 450 G4 Y8B60EA Chi Mei CMN15C4, , 1920x1080, 15.6" | Lenovo ThinkPad E560-20EWS00000 Lenovo LP156WF6-SPK2, , 1920x1080, 15.6" | Lenovo ThinkPad L560-20F10026GE LG LP156WF6-SPK1, , 1920x1080, 15.6" | Dell Latitude 15-3570 LG Philips LGD04AF / 156WHU, , 1366x768, 15.6" | Dell Latitude 15 E5570 LG Philips 156WHU, , 1366x768, 15.6" | HP ProBook 450 G3 AU Optronics, , 1920x1080, 15.6" | |
|---|---|---|---|---|---|---|
| Display | -3% | -2% | 2% | 1% | -4% | |
| Display P3 Coverage (%) | 39.89 | 38.5 -3% | 39 -2% | 40.61 2% | 40.48 1% | 38.1 -4% |
| sRGB Coverage (%) | 59.5 | 57.5 -3% | 58.3 -2% | 61.1 3% | 60.9 2% | 57.3 -4% |
| AdobeRGB 1998 Coverage (%) | 41.24 | 39.8 -3% | 40.33 -2% | 41.96 2% | 41.82 1% | 39.37 -5% |
| Response Times | 25% | 15% | 2% | 9% | 13% | |
| Response Time Grey 50% / Grey 80% * (ms) | 51 ? | 38.4 ? 25% | 39.2 ? 23% | 37 ? 27% | 47 ? 8% | 41.2 ? 19% |
| Response Time Black / White * (ms) | 30 ? | 22.4 ? 25% | 28 ? 7% | 37 ? -23% | 27 ? 10% | 28 ? 7% |
| PWM Frequency (Hz) | 50 ? | |||||
| Screen | 27% | 22% | -11% | 2% | 5% | |
| Brightness middle (cd/m²) | 214 | 257 20% | 262 22% | 202 -6% | 228 7% | 211 -1% |
| Brightness (cd/m²) | 201 | 234 16% | 250 24% | 211 5% | 236 17% | 214 6% |
| Brightness Distribution (%) | 77 | 83 8% | 92 19% | 88 14% | 90 17% | 91 18% |
| Black Level * (cd/m²) | 0.43 | 0.27 37% | 0.29 33% | 0.62 -44% | 0.56 -30% | 0.43 -0% |
| Contrast (:1) | 498 | 952 91% | 903 81% | 326 -35% | 407 -18% | 491 -1% |
| Colorchecker dE 2000 * | 10.68 | 7.16 33% | 8.49 21% | 12.35 -16% | 10.02 6% | 9.25 13% |
| Colorchecker dE 2000 max. * | 18.07 | 17.99 -0% | 19.9 -10% | 15.93 12% | ||
| Greyscale dE 2000 * | 11.32 | 6.28 45% | 8.11 28% | 13.46 -19% | 10.66 6% | 9.83 13% |
| Gamma | 2.26 97% | 2.44 90% | 2.37 93% | 2.44 90% | 2.48 89% | 2.82 78% |
| CCT | 12204 53% | 6806 96% | 6300 103% | 15217 43% | 11800 55% | 10890 60% |
| Color Space (Percent of AdobeRGB 1998) (%) | 38 | 36.6 -4% | 37.07 -2% | 39 3% | 39 3% | 36.4 -4% |
| Color Space (Percent of sRGB) (%) | 59 | 57.3 -3% | 57.94 -2% | 61 3% | 61 3% | 57.3 -3% |
| Média Total (Programa/Configurações) | 16% /
20% | 12% /
17% | -2% /
-6% | 4% /
3% | 5% /
4% |
* ... menor é melhor
Exibir tempos de resposta
| ↔ Tempo de resposta preto para branco | ||
|---|---|---|
| 30 ms ... ascensão ↗ e queda ↘ combinadas | ↗ 10 ms ascensão | 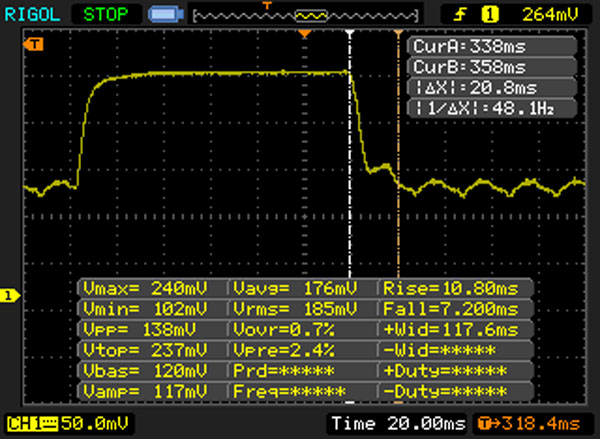 |
| ↘ 20 ms queda | ||
| A tela mostra taxas de resposta lentas em nossos testes e será insatisfatória para os jogadores. Em comparação, todos os dispositivos testados variam de 0.1 (mínimo) a 240 (máximo) ms. » 80 % de todos os dispositivos são melhores. Isso significa que o tempo de resposta medido é pior que a média de todos os dispositivos testados (19.8 ms). | ||
| ↔ Tempo de resposta 50% cinza a 80% cinza | ||
| 51 ms ... ascensão ↗ e queda ↘ combinadas | ↗ 23 ms ascensão | 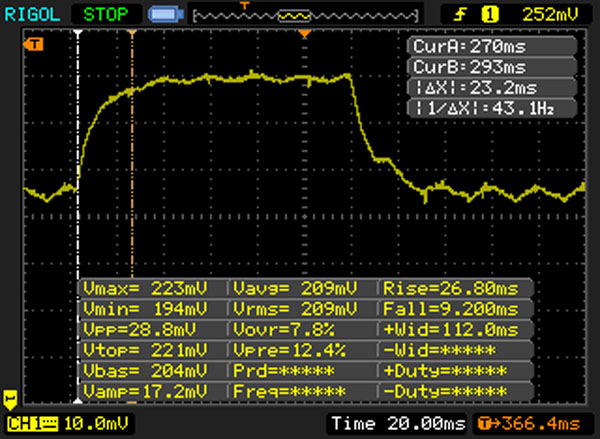 |
| ↘ 28 ms queda | ||
| A tela mostra taxas de resposta lentas em nossos testes e será insatisfatória para os jogadores. Em comparação, todos os dispositivos testados variam de 0.165 (mínimo) a 636 (máximo) ms. » 87 % de todos os dispositivos são melhores. Isso significa que o tempo de resposta medido é pior que a média de todos os dispositivos testados (31 ms). | ||
Cintilação da tela / PWM (modulação por largura de pulso)
| Tela tremeluzindo/PWM detectado | 50 Hz | ≤ 40 % configuração de brilho | 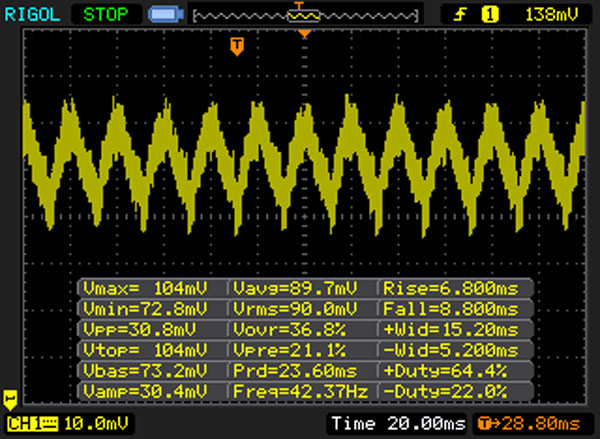 |
A luz de fundo da tela pisca em 50 Hz (pior caso, por exemplo, utilizando PWM) Cintilação detectada em uma configuração de brilho de 40 % e abaixo. Não deve haver cintilação ou PWM acima desta configuração de brilho. A frequência de 50 Hz é muito baixa, portanto a oscilação pode causar fadiga ocular e dores de cabeça após uso prolongado. [pwm_comparison] Em comparação: 52 % de todos os dispositivos testados não usam PWM para escurecer a tela. Se PWM foi detectado, uma média de 7757 (mínimo: 5 - máximo: 343500) Hz foi medida. | |||
| PCMark 8 Home Score Accelerated v2 | 3163 pontos | |
| PCMark 8 Work Score Accelerated v2 | 4725 pontos | |
Ajuda | ||
| HP ProBook 450 G4 Y8B60EA SanDisk SD8SNAT256G1002 | Lenovo ThinkPad E560-20EWS00000 Samsung CM871 MZ7LF192HCGS | Dell Latitude 15-3570 Samsung CM871 MZNLF128HCHP | Dell Latitude 15 E5570 Samsung SSD PM871 MZ7LN128HCHP | |
|---|---|---|---|---|
| AS SSD | -27% | -35% | 26% | |
| Access Time Write * (ms) | 0.159 | 0.112 30% | 0.188 -18% | 0.07 56% |
| Access Time Read * (ms) | 0.141 | 0.171 -21% | 0.14 1% | 0.114 19% |
| 4K-64 Write (MB/s) | 195.5 | 33.55 -83% | 19.37 -90% | 82.7 -58% |
| 4K-64 Read (MB/s) | 137.1 | 83.9 -39% | 81.8 -40% | 356.1 160% |
| 4K Write (MB/s) | 73.4 | 34.46 -53% | 21.57 -71% | 91.1 24% |
| 4K Read (MB/s) | 17.96 | 17.2 -4% | 17.25 -4% | 29.68 65% |
| Seq Write (MB/s) | 315.9 | 162 -49% | 130 -59% | 146.2 -54% |
| Seq Read (MB/s) | 493.8 | 497.1 1% | 489.1 -1% | 488.5 -1% |
* ... menor é melhor

| 3DMark 11 - 1280x720 Performance GPU | |
| Lenovo ThinkPad E560-20EWS00000 | |
| HP ProBook 450 G4 Y8B60EA | |
| Dell Latitude 15 E5570 | |
| Dell Latitude 15-3570 | |
| Lenovo ThinkPad L560-20F10026GE | |
| HP ProBook 450 G3 | |
| 3DMark | |
| 1280x720 Cloud Gate Standard Graphics | |
| Lenovo ThinkPad E560-20EWS00000 | |
| HP ProBook 450 G4 Y8B60EA | |
| Dell Latitude 15 E5570 | |
| Lenovo ThinkPad L560-20F10026GE | |
| Dell Latitude 15-3570 | |
| HP ProBook 450 G3 | |
| 1920x1080 Fire Strike Graphics | |
| Lenovo ThinkPad E560-20EWS00000 | |
| HP ProBook 450 G4 Y8B60EA | |
| Dell Latitude 15 E5570 | |
| Lenovo ThinkPad L560-20F10026GE | |
| HP ProBook 450 G3 | |
| 3DMark 11 Performance | 2248 pontos | |
| 3DMark Cloud Gate Standard Score | 6908 pontos | |
| 3DMark Fire Strike Score | 1454 pontos | |
Ajuda | ||
| baixo | média | alto | ultra | |
|---|---|---|---|---|
| BioShock Infinite (2013) | 94.8 | 51.2 | 41.77 | 14.42 |
| Company of Heroes 2 (2013) | 37.29 | 29.32 | 17.58 | |
| Rise of the Tomb Raider (2016) | 35.28 | 19.58 |
Barulho
| Ocioso |
| 32.6 / 32.6 / 33 dB |
| DVD |
| 37.8 / dB |
| Carga |
| 38.9 / 38.9 dB |
 | ||
30 dB silencioso 40 dB(A) audível 50 dB(A) ruidosamente alto |
||
min: | ||
(±) A temperatura máxima no lado superior é 44.3 °C / 112 F, em comparação com a média de 34.3 °C / 94 F , variando de 21.2 a 62.5 °C para a classe Office.
(-) A parte inferior aquece até um máximo de 46.3 °C / 115 F, em comparação com a média de 36.8 °C / 98 F
(+) Em uso inativo, a temperatura média para o lado superior é 25.6 °C / 78 F, em comparação com a média do dispositivo de 29.5 °C / ### class_avg_f### F.
(+) Os apoios para as mãos e o touchpad são mais frios que a temperatura da pele, com um máximo de 24.7 °C / 76.5 F e, portanto, são frios ao toque.
(+) A temperatura média da área do apoio para as mãos de dispositivos semelhantes foi 27.5 °C / 81.5 F (+2.8 °C / 5 F).
HP ProBook 450 G4 Y8B60EA análise de áudio
(±) | o volume do alto-falante é médio, mas bom (###valor### dB)
Graves 100 - 315Hz
(-) | quase nenhum baixo - em média 15.8% menor que a mediana
(±) | a linearidade dos graves é média (7.2% delta para a frequência anterior)
Médios 400 - 2.000 Hz
(+) | médios equilibrados - apenas 1.7% longe da mediana
(+) | médios são lineares (5.2% delta para frequência anterior)
Altos 2 - 16 kHz
(±) | máximos mais altos - em média 6.8% maior que a mediana
(±) | a linearidade dos máximos é média (9% delta para frequência anterior)
Geral 100 - 16.000 Hz
(±) | a linearidade do som geral é média (18.9% diferença em relação à mediana)
Comparado com a mesma classe
» 36% de todos os dispositivos testados nesta classe foram melhores, 7% semelhantes, 57% piores
» O melhor teve um delta de 7%, a média foi 21%, o pior foi 53%
Comparado com todos os dispositivos testados
» 44% de todos os dispositivos testados foram melhores, 8% semelhantes, 48% piores
» O melhor teve um delta de 4%, a média foi 23%, o pior foi 134%
Apple MacBook 12 (Early 2016) 1.1 GHz análise de áudio
(+) | os alto-falantes podem tocar relativamente alto (###valor### dB)
Graves 100 - 315Hz
(±) | graves reduzidos - em média 11.3% menor que a mediana
(±) | a linearidade dos graves é média (14.2% delta para a frequência anterior)
Médios 400 - 2.000 Hz
(+) | médios equilibrados - apenas 2.4% longe da mediana
(+) | médios são lineares (5.5% delta para frequência anterior)
Altos 2 - 16 kHz
(+) | agudos equilibrados - apenas 2% longe da mediana
(+) | os máximos são lineares (4.5% delta da frequência anterior)
Geral 100 - 16.000 Hz
(+) | o som geral é linear (10.2% diferença em relação à mediana)
Comparado com a mesma classe
» 7% de todos os dispositivos testados nesta classe foram melhores, 2% semelhantes, 90% piores
» O melhor teve um delta de 5%, a média foi 18%, o pior foi 53%
Comparado com todos os dispositivos testados
» 5% de todos os dispositivos testados foram melhores, 1% semelhantes, 94% piores
» O melhor teve um delta de 4%, a média foi 23%, o pior foi 134%
| desligado | |
| Ocioso | |
| Carga |
|
Key:
min: | |
| HP ProBook 450 G4 Y8B60EA i7-7500U, GeForce 930MX, SanDisk SD8SNAT256G1002, TN LED, 1920x1080, 15.6" | Lenovo ThinkPad E560-20EWS00000 6500U, Radeon R7 M370, Samsung CM871 MZ7LF192HCGS, IPS-Panel, 1920x1080, 15.6" | Lenovo ThinkPad L560-20F10026GE 6200U, HD Graphics 520, WDC Slim WD10SPCX-21KHST0, AH-IPS, 1920x1080, 15.6" | Dell Latitude 15-3570 6200U, HD Graphics 520, Samsung CM871 MZNLF128HCHP, TN LED, 1366x768, 15.6" | Dell Latitude 15 E5570 6300U, HD Graphics 520, Samsung SSD PM871 MZ7LN128HCHP, TN LED, 1366x768, 15.6" | |
|---|---|---|---|---|---|
| Power Consumption | -15% | 5% | 13% | 10% | |
| Idle Minimum * (Watt) | 3.8 | 4.2 -11% | 5 -32% | 4.9 -29% | 4.5 -18% |
| Idle Average * (Watt) | 6.6 | 7.5 -14% | 7.9 -20% | 7.2 -9% | 7.6 -15% |
| Idle Maximum * (Watt) | 11.3 | 8.2 27% | 8.6 24% | 7.5 34% | 8.7 23% |
| Load Average * (Watt) | 38 | 49.6 -31% | 27.5 28% | 25.4 33% | 28.5 25% |
| Load Maximum * (Watt) | 45 | 65.8 -46% | 33.7 25% | 28 38% | 29.2 35% |
* ... menor é melhor
| HP ProBook 450 G4 Y8B60EA i7-7500U, GeForce 930MX, 45 Wh | Lenovo ThinkPad E560-20EWS00000 6500U, Radeon R7 M370, 48 Wh | Lenovo ThinkPad L560-20F10026GE 6200U, HD Graphics 520, 48 Wh | Dell Latitude 15-3570 6200U, HD Graphics 520, 65 Wh | Dell Latitude 15 E5570 6300U, HD Graphics 520, 62 Wh | |
|---|---|---|---|---|---|
| Duração da bateria | -11% | -14% | 22% | 35% | |
| Reader / Idle (h) | 12.4 | 14.7 19% | 11.6 -6% | 17.1 38% | 20.5 65% |
| WiFi v1.3 (h) | 8.6 | 5.7 -34% | 6.8 -21% | 9 5% | 10.5 22% |
| Load (h) | 2.1 | 1.7 -19% | 1.8 -14% | 2.6 24% | 2.5 19% |
| H.264 (h) | 6.9 | 4.6 | 9.5 |
Pro
Contra
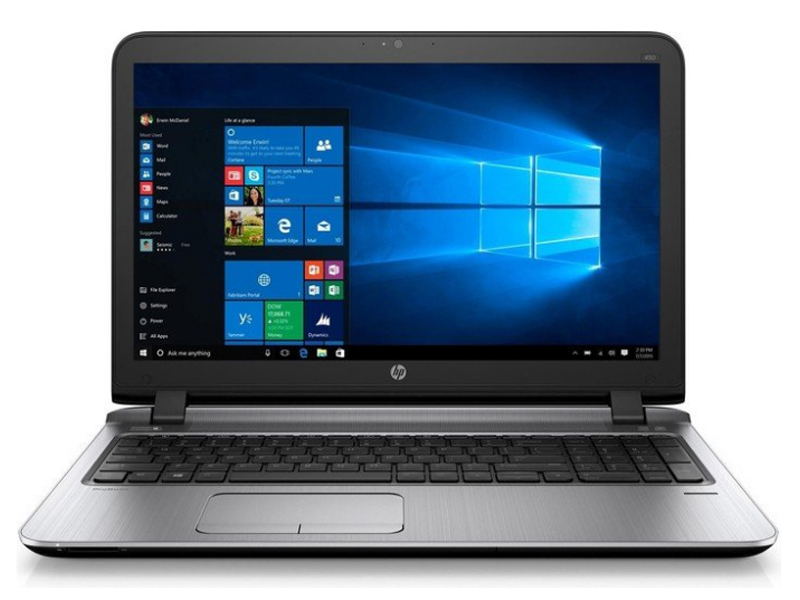
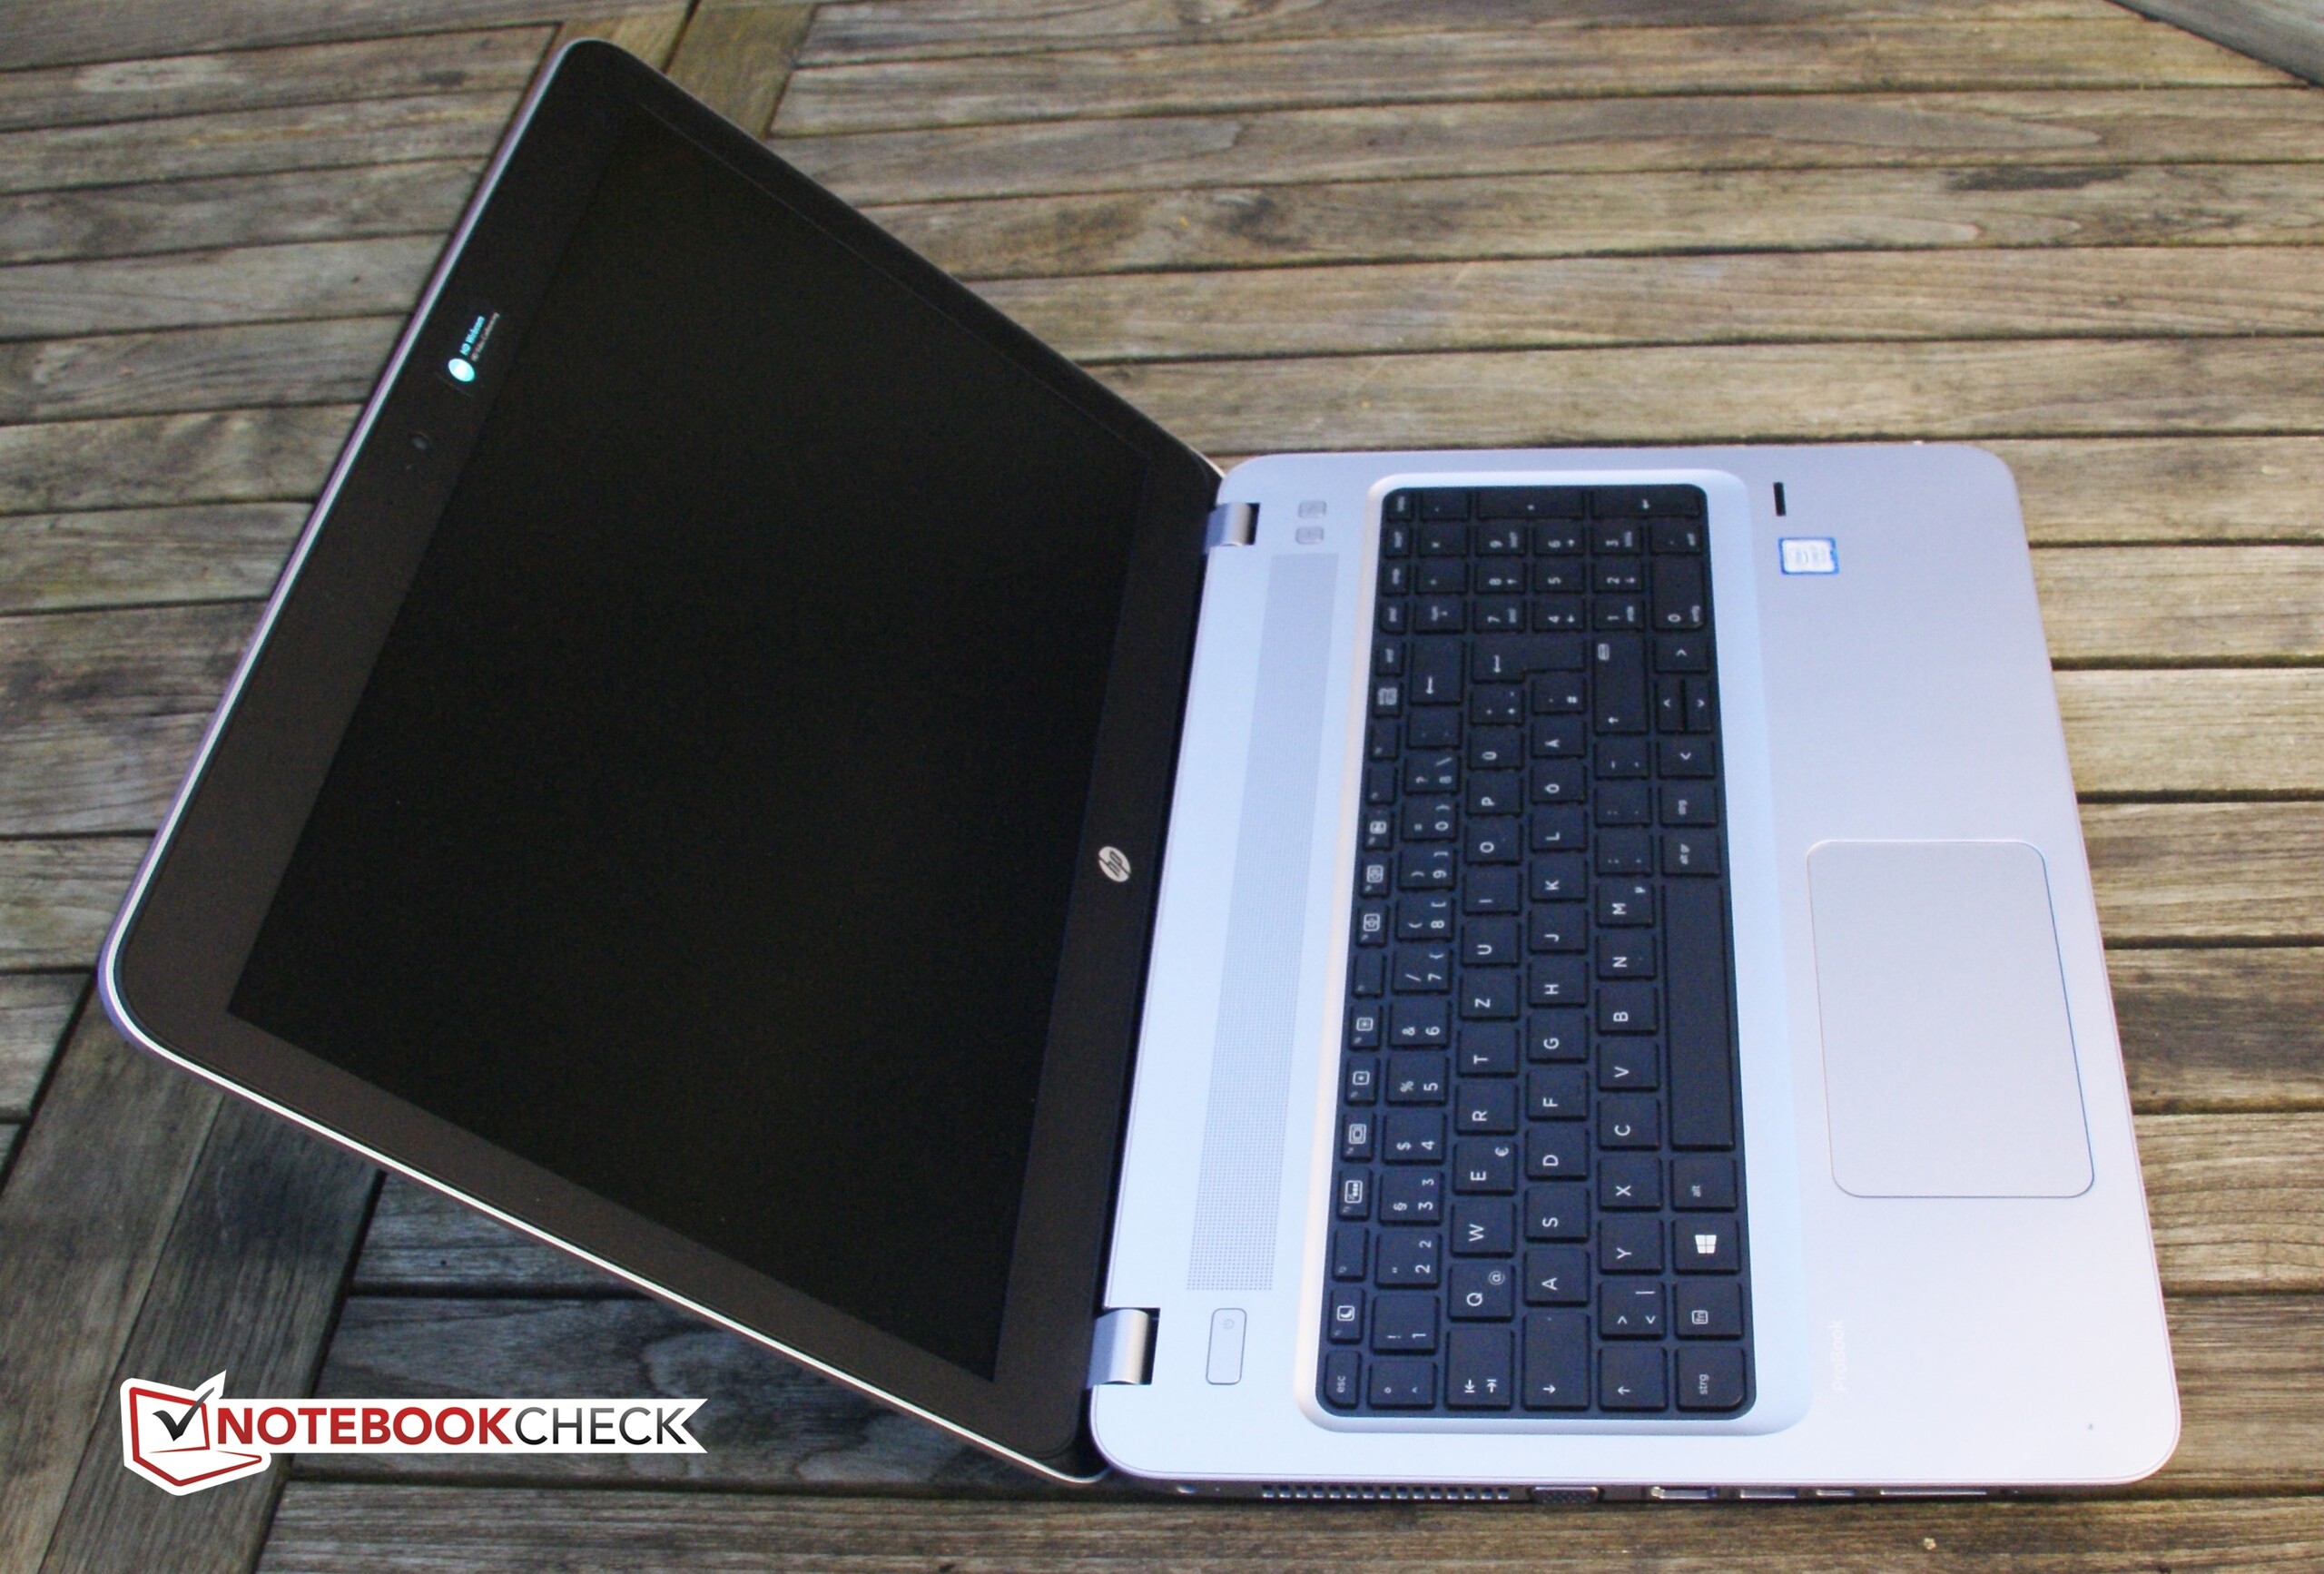
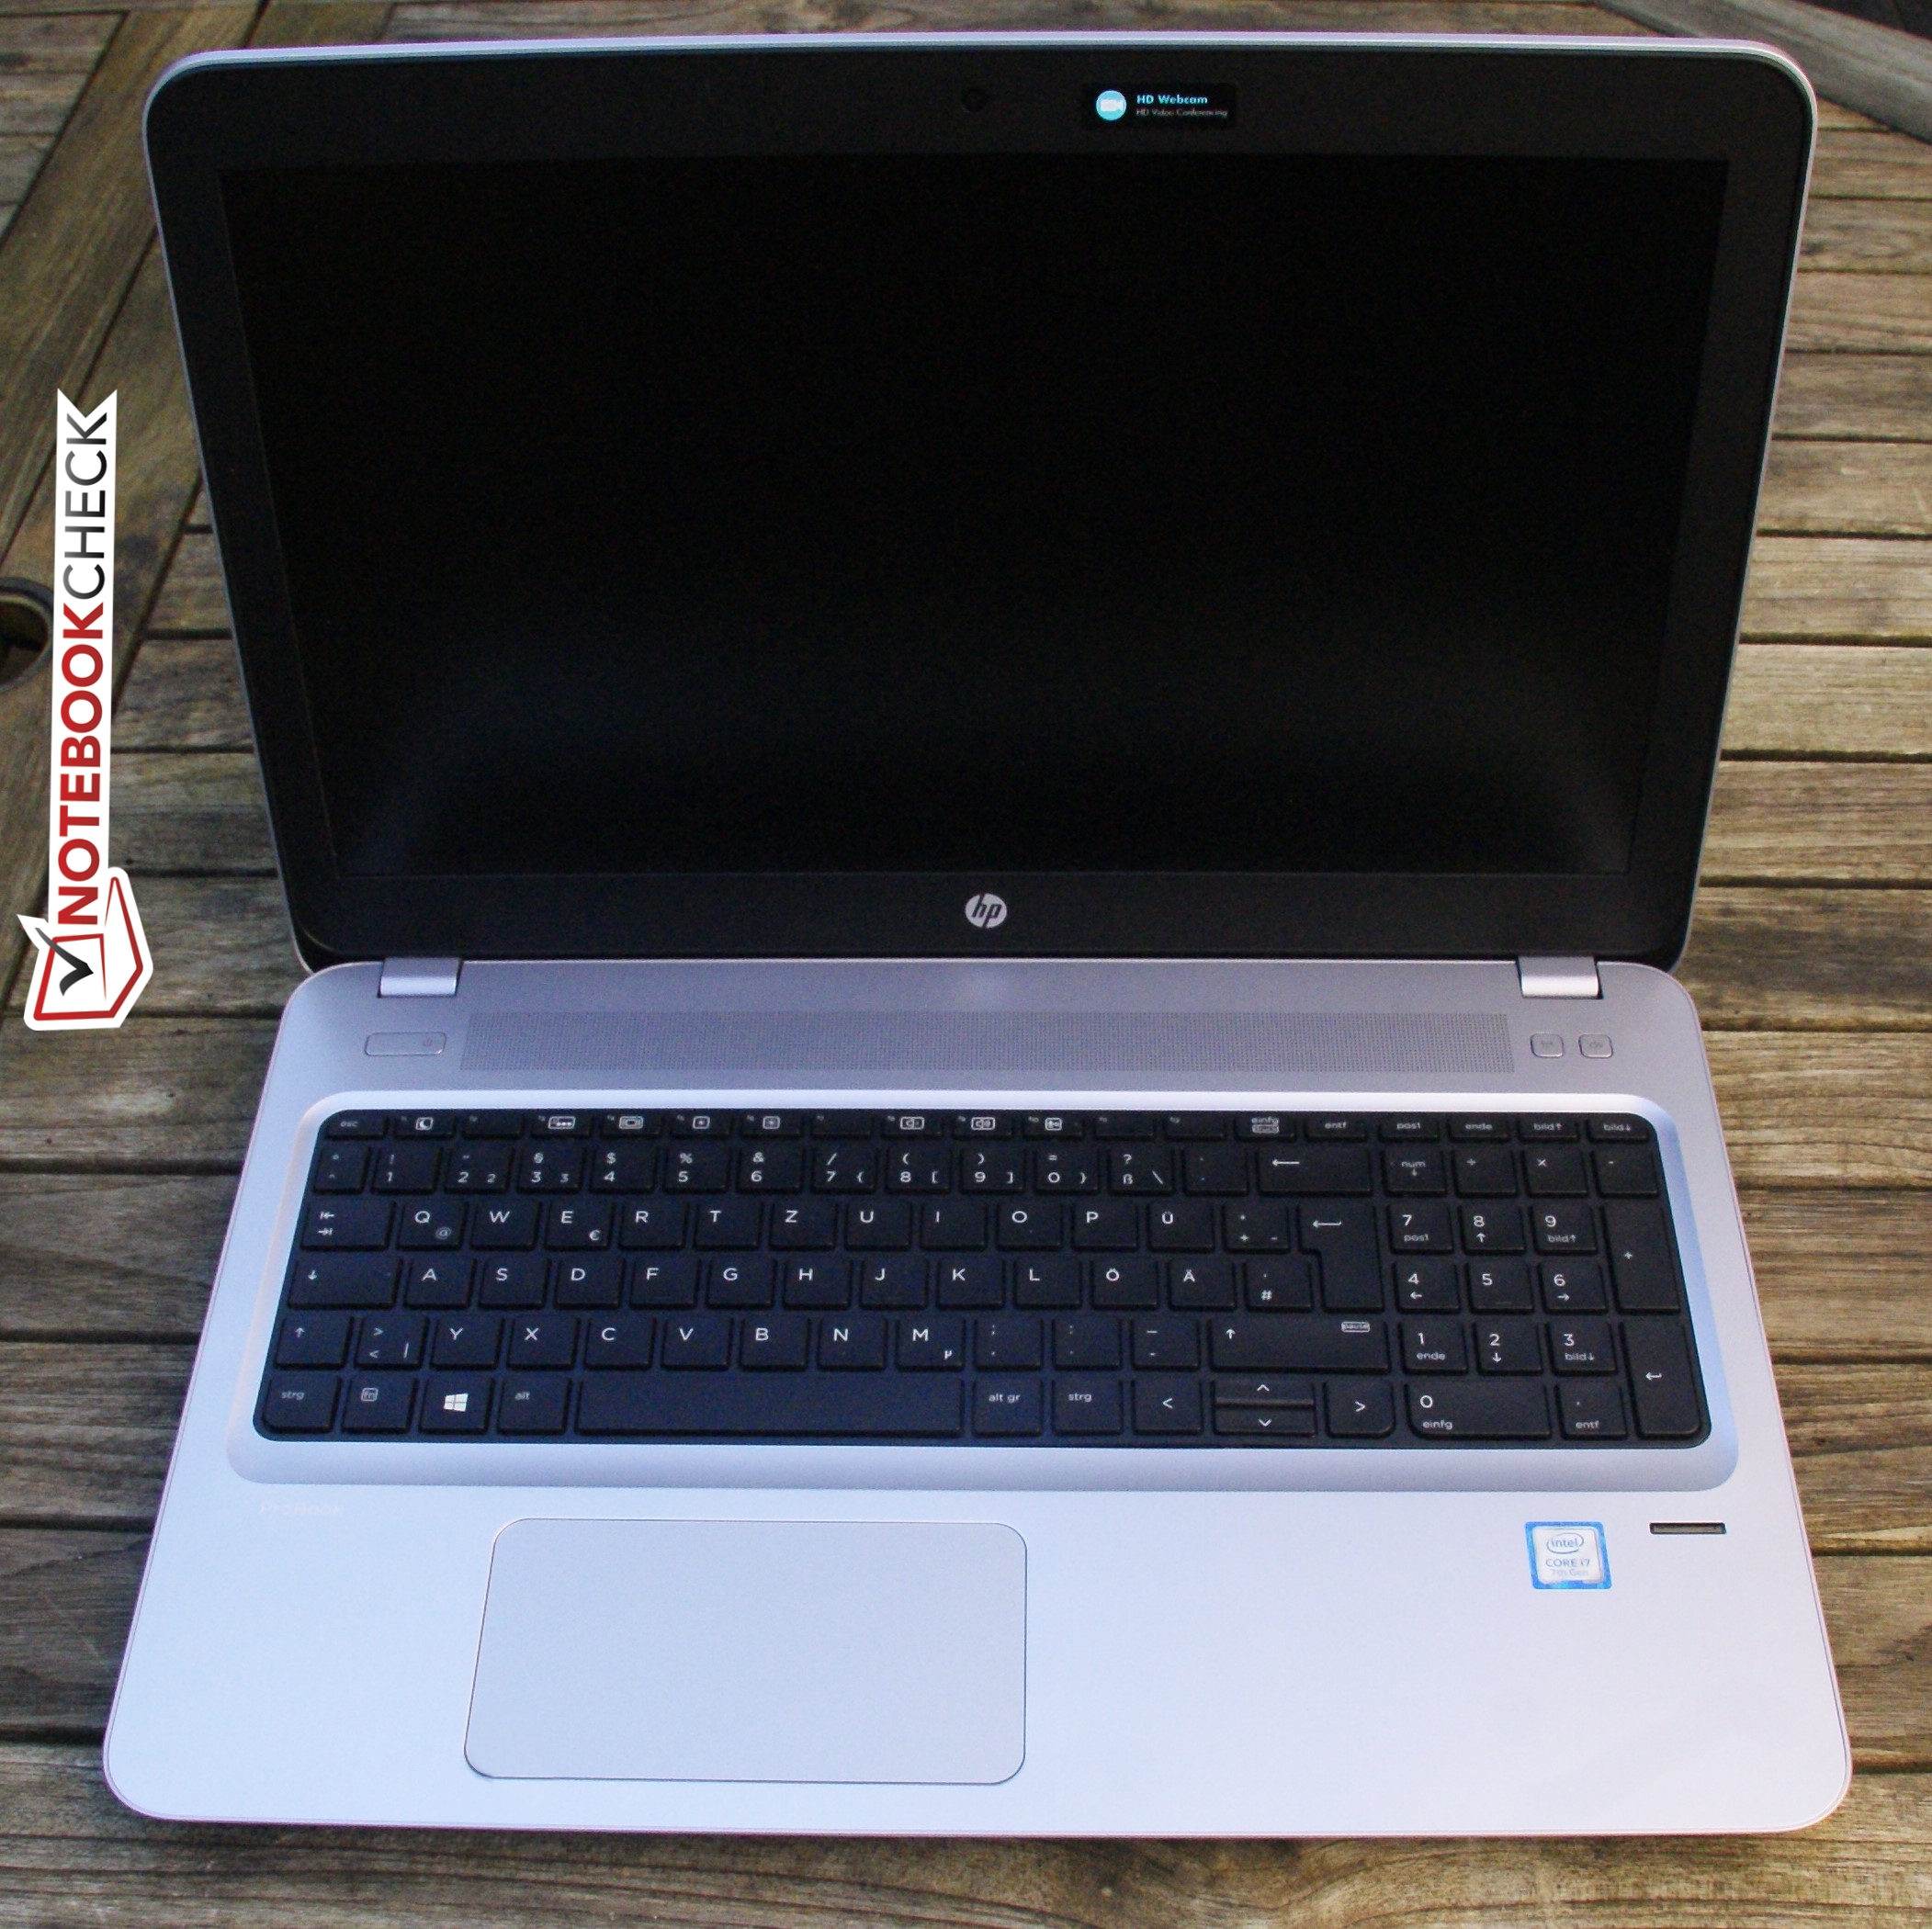
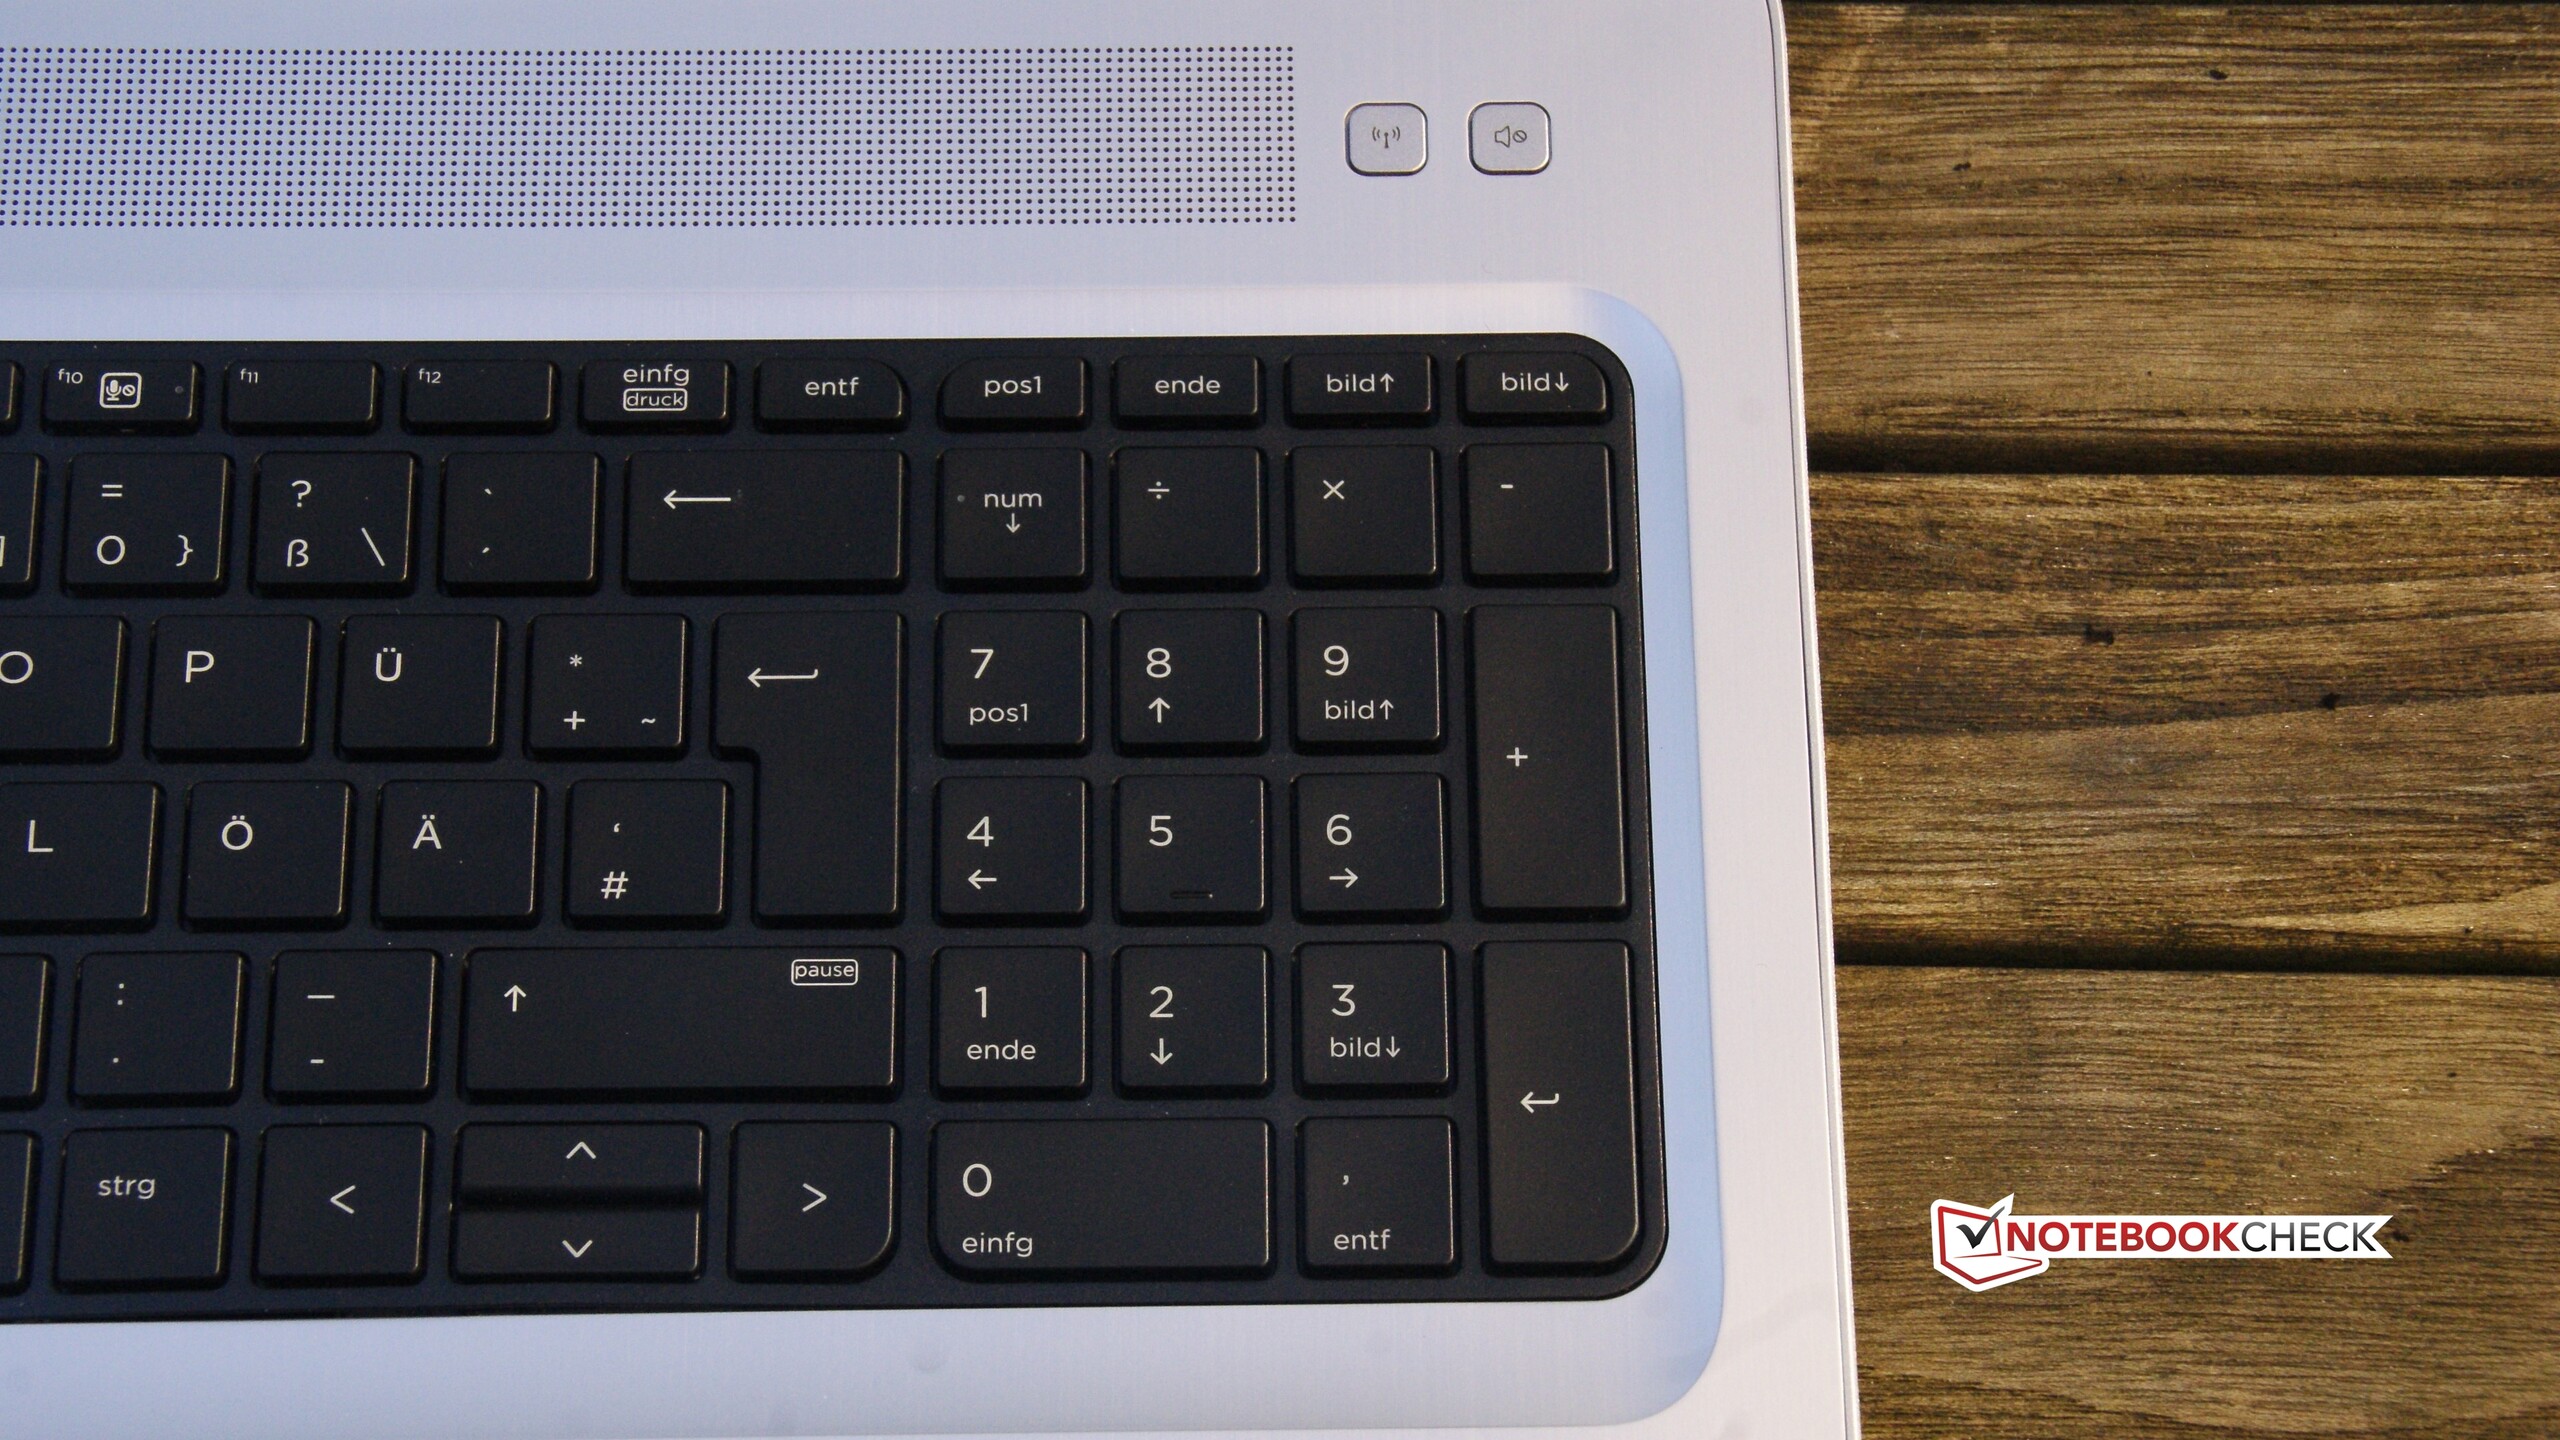
O ProBook 450 G4 é, de fato, um aparelho sólido A carcaça é boa e dificilmente apresenta fraquezas, o pousa palmas de metal se sente bem, e o aparelho oferece uma seleção de interfaces muito sólida que inclusive inclui o USB Type-C. Embora esta porta não seja capaz de nada a não ser USB, ela fornece segurança para o futuro. O processador oferece bom desempenho, o teclado é adequado para digitar, e o touchpad corresponde ao padrão do Precision. Finalmente, está a boa duração da bateria que é certamente atraente para trabalhar em movimento.
Infelizmente, isto não compensa a maior desvantagem do aparelho: A péssima tela. Isto poderia talvez ser justificado com um preço de 600 Euros (~$627), mas isto é simplesmente inaceitável com quase 1000 Euros (~$1045). Depois estão as outras desvantagens: O leitor de digitais é muito pouco viável e o processador esquenta muito durante o suo intenso. A HP deveria permitir que a ventoinha gire a uma velocidade um pouco mais alta aqui.
Uma pena: O fabricante estraga um pacote quase completo com uma tela que é simplesmente inapropriada para o preço.
O ProBook tem pouca concorrência no setor empresarial, pelo menos em termos de processador. No entanto, isto mudará em breve: O ThinkPad E570 foi anunciado, e será um aparelho de comparação interessante com o seu painel IPS e GeForce 950M. Os outros concorrentes provavelmente seguirão no início de 2017.
HP ProBook 450 G4 Y8B60EA
- 12/14/2016 v6 (old)
Benjamin Herzig