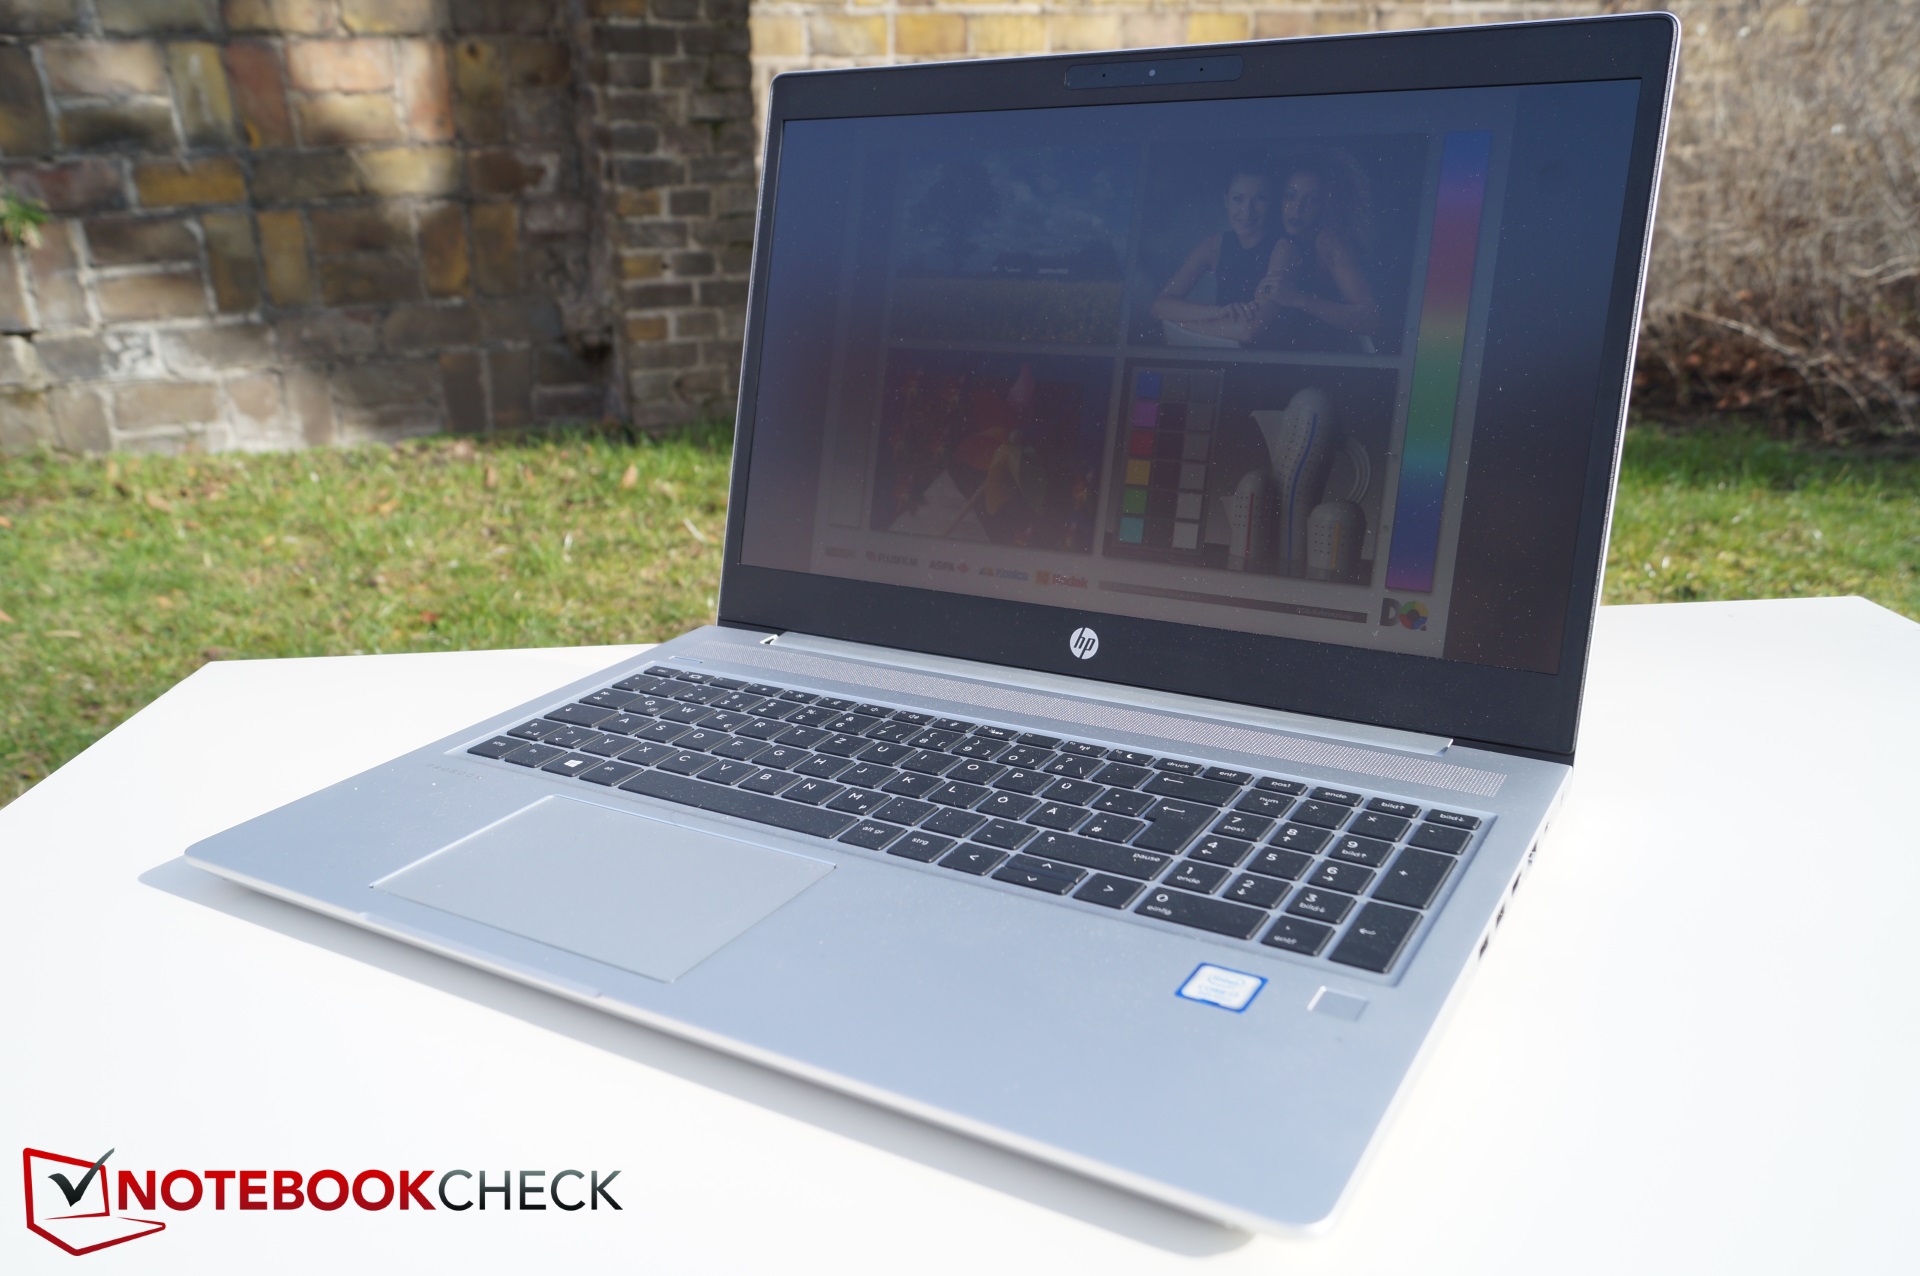
Breve Análise do Portátil HP ProBook 450 G6 (Core i7-8565U, GeForce MX130)
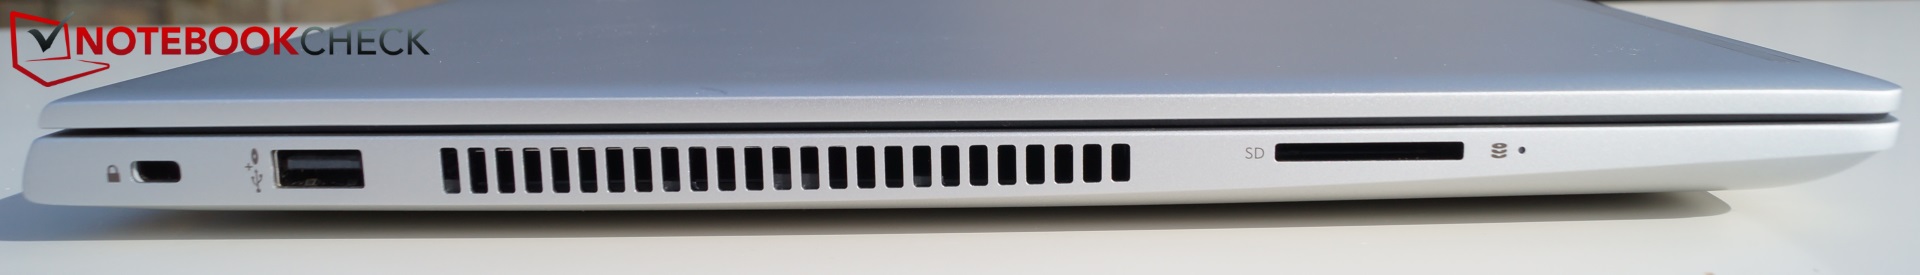
| SD Card Reader | |
| average JPG Copy Test (av. of 3 runs) | |
| Dell Latitude 5590 (Toshiba Exceria Pro SDXC 64 GB UHS-II) | |
| HP ProBook 450 G5-2UB53EA (Toshiba Exceria Pro SDXC 64 GB UHS-II) | |
| HP ProBook 450 G6-5TJ93EA (Toshiba Exceria Pro SDXC 64 GB UHS-II) | |
| Lenovo ThinkPad E580-20KS001RGE (Toshiba Exceria Pro SDXC 64 GB UHS-II) | |
| HP ProBook 650 G4 3UP57EA (Toshiba Exceria Pro M501 microSDXC 64GB) | |
| Média da turma Office (19.8 - 198.5, n=22, últimos 2 anos) | |
| Acer TravelMate P2510-G2-MG-50WE (Toshiba Exceria Pro SDXC 64 GB UHS-II) | |
| maximum AS SSD Seq Read Test (1GB) | |
| Dell Latitude 5590 (Toshiba Exceria Pro SDXC 64 GB UHS-II) | |
| HP ProBook 450 G5-2UB53EA (Toshiba Exceria Pro SDXC 64 GB UHS-II) | |
| Lenovo ThinkPad E580-20KS001RGE (Toshiba Exceria Pro SDXC 64 GB UHS-II) | |
| HP ProBook 450 G6-5TJ93EA (Toshiba Exceria Pro SDXC 64 GB UHS-II) | |
| Média da turma Office (27.4 - 249, n=21, últimos 2 anos) | |
| HP ProBook 650 G4 3UP57EA (Toshiba Exceria Pro M501 microSDXC 64GB) | |
| Acer TravelMate P2510-G2-MG-50WE (Toshiba Exceria Pro SDXC 64 GB UHS-II) | |
| Networking | |
| iperf3 transmit AX12 | |
| HP ProBook 450 G6-5TJ93EA | |
| Acer TravelMate P2510-G2-MG-50WE | |
| HP ProBook 650 G4 3UP57EA | |
| HP ProBook 450 G5-2UB53EA | |
| Lenovo ThinkPad E580-20KS001RGE | |
| Dell Latitude 5590 | |
| iperf3 receive AX12 | |
| HP ProBook 450 G6-5TJ93EA | |
| HP ProBook 450 G5-2UB53EA | |
| HP ProBook 650 G4 3UP57EA | |
| Acer TravelMate P2510-G2-MG-50WE | |
| Dell Latitude 5590 | |
| Lenovo ThinkPad E580-20KS001RGE | |
| |||||||||||||||||||||||||
iluminação: 88 %
iluminação com acumulador: 244 cd/m²
Contraste: 1152:1 (Preto: 0.21 cd/m²)
ΔE ColorChecker Calman: 4.7 | ∀{0.5-29.43 Ø4.72}
calibrated: 4
ΔE Greyscale Calman: 2.7 | ∀{0.09-98 Ø4.97}
64% sRGB (Argyll 1.6.3 3D)
40.8% AdobeRGB 1998 (Argyll 1.6.3 3D)
44.29% AdobeRGB 1998 (Argyll 3D)
64.2% sRGB (Argyll 3D)
42.83% Display P3 (Argyll 3D)
Gamma: 2.26
CCT: 6442 K
| HP ProBook 450 G6-5TJ93EA Chi Mei CMN15FE, , 1920x1080, 15.6" | HP ProBook 450 G5-2UB53EA AUO41ED, , 1920x1080, 15.6" | HP ProBook 650 G4 3UP57EA CMN15D3, , 1920x1080, 15.6" | Acer TravelMate P2510-G2-MG-50WE Chi Mei CMN15D3, , 1920x1080, 15.6" | Lenovo ThinkPad E580-20KS001RGE BOE NV156FHM-N49, , 1920x1080, 15.6" | Dell Latitude 5590 NV15N42, , 1920x1080, 15.6" | Apple MacBook 12 (Early 2016) 1.1 GHz APPA027, , 2304x1440, 12" | |
|---|---|---|---|---|---|---|---|
| Display | -11% | -2% | -1% | -8% | -4% | 53% | |
| Display P3 Coverage (%) | 42.83 | 38.04 -11% | 41.89 -2% | 42.27 -1% | 40 -7% | 41.56 -3% | 66.8 56% |
| sRGB Coverage (%) | 64.2 | 57.3 -11% | 63 -2% | 63.5 -1% | 58.2 -9% | 61.3 -5% | 95.4 49% |
| AdobeRGB 1998 Coverage (%) | 44.29 | 39.31 -11% | 43.28 -2% | 43.69 -1% | 41.32 -7% | 42.93 -3% | 68 54% |
| Response Times | -50% | 6% | -24% | -36% | -59% | -23% | |
| Response Time Grey 50% / Grey 80% * (ms) | 34.4 ? | 52.4 ? -52% | 31 ? 10% | 40 ? -16% | 48 ? -40% | 53.2 ? -55% | 41.2 ? -20% |
| Response Time Black / White * (ms) | 24.4 ? | 36 ? -48% | 24 ? 2% | 32 ? -31% | 32 ? -31% | 39.6 ? -62% | 30.4 ? -25% |
| PWM Frequency (Hz) | 26040 ? | 1000 ? | 25000 ? | 25000 ? | 1000 ? | ||
| Screen | -22% | 4% | 17% | 9% | -15% | 25% | |
| Brightness middle (cd/m²) | 242 | 252 4% | 305 26% | 259 7% | 290 20% | 243 0% | 387 60% |
| Brightness (cd/m²) | 226 | 249 10% | 270 19% | 230 2% | 267 18% | 234 4% | 358 58% |
| Brightness Distribution (%) | 88 | 88 0% | 80 -9% | 82 -7% | 81 -8% | 83 -6% | 88 0% |
| Black Level * (cd/m²) | 0.21 | 0.22 -5% | 0.39 -86% | 0.19 10% | 0.19 10% | 0.19 10% | 0.47 -124% |
| Contrast (:1) | 1152 | 1145 -1% | 782 -32% | 1363 18% | 1526 32% | 1279 11% | 823 -29% |
| Colorchecker dE 2000 * | 4.7 | 6.9 -47% | 3.26 31% | 3.13 33% | 4.9 -4% | 6.6 -40% | 1.6 66% |
| Colorchecker dE 2000 max. * | 18.5 | 18.4 1% | 6.84 63% | 7.81 58% | 9.52 49% | 22.3 -21% | 4 78% |
| Colorchecker dE 2000 calibrated * | 4 | 3.09 23% | 5 -25% | ||||
| Greyscale dE 2000 * | 2.7 | 6.9 -156% | 1.98 27% | 1.42 47% | 2.92 -8% | 5.2 -93% | 1 63% |
| Gamma | 2.26 97% | 2.43 91% | 2.38 92% | 2.36 93% | 2.31 95% | 2.24 98% | 2.26 97% |
| CCT | 6442 101% | 7524 86% | 6540 99% | 6391 102% | 6091 107% | 6990 93% | 6680 97% |
| Color Space (Percent of AdobeRGB 1998) (%) | 40.8 | 36.3 -11% | 40 -2% | 40 -2% | 37 -9% | 39.2 -4% | 61.6 51% |
| Color Space (Percent of sRGB) (%) | 64 | 57.2 -11% | 63 -2% | 63 -2% | 58 -9% | 60.8 -5% | 82.2 28% |
| Média Total (Programa/Configurações) | -28% /
-23% | 3% /
3% | -3% /
9% | -12% /
-0% | -26% /
-19% | 18% /
24% |
* ... menor é melhor
Exibir tempos de resposta
| ↔ Tempo de resposta preto para branco | ||
|---|---|---|
| 24.4 ms ... ascensão ↗ e queda ↘ combinadas | ↗ 14.4 ms ascensão | 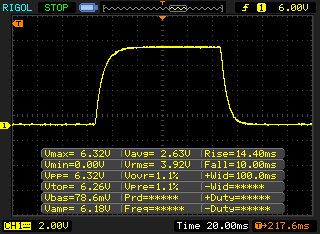 |
| ↘ 10 ms queda | ||
| A tela mostra boas taxas de resposta em nossos testes, mas pode ser muito lenta para jogadores competitivos. Em comparação, todos os dispositivos testados variam de 0.1 (mínimo) a 240 (máximo) ms. » 57 % de todos os dispositivos são melhores. Isso significa que o tempo de resposta medido é pior que a média de todos os dispositivos testados (19.8 ms). | ||
| ↔ Tempo de resposta 50% cinza a 80% cinza | ||
| 34.4 ms ... ascensão ↗ e queda ↘ combinadas | ↗ 17.2 ms ascensão | 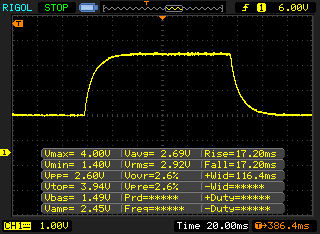 |
| ↘ 17.2 ms queda | ||
| A tela mostra taxas de resposta lentas em nossos testes e será insatisfatória para os jogadores. Em comparação, todos os dispositivos testados variam de 0.165 (mínimo) a 636 (máximo) ms. » 48 % de todos os dispositivos são melhores. Isso significa que o tempo de resposta medido é pior que a média de todos os dispositivos testados (31 ms). | ||
Cintilação da tela / PWM (modulação por largura de pulso)
| Tela tremeluzindo/PWM detectado | 26040 Hz | ≤ 40 % configuração de brilho | 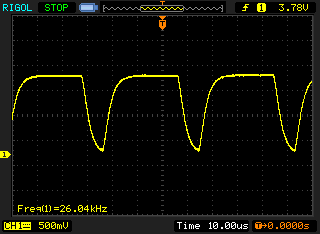 |
A luz de fundo da tela pisca em 26040 Hz (pior caso, por exemplo, utilizando PWM) Cintilação detectada em uma configuração de brilho de 40 % e abaixo. Não deve haver cintilação ou PWM acima desta configuração de brilho. A frequência de 26040 Hz é bastante alta, então a maioria dos usuários sensíveis ao PWM não deve notar nenhuma oscilação. [pwm_comparison] Em comparação: 52 % de todos os dispositivos testados não usam PWM para escurecer a tela. Se PWM foi detectado, uma média de 7781 (mínimo: 5 - máximo: 343500) Hz foi medida. | |||
| Cinebench R15 | |
| CPU Single 64Bit | |
| Média da turma Office (99.5 - 312, n=75, últimos 2 anos) | |
| Média Intel Core i7-8565U (138.3 - 193, n=51) | |
| Lenovo ThinkPad E580-20KS001RGE | |
| HP ProBook 450 G5-2UB53EA | |
| Dell Latitude 5590 | |
| HP ProBook 650 G4 3UP57EA | |
| Acer TravelMate P2510-G2-MG-50WE | |
| HP ProBook 450 G6-5TJ93EA | |
| CPU Multi 64Bit | |
| Média da turma Office (250 - 3380, n=75, últimos 2 anos) | |
| Dell Latitude 5590 | |
| Média Intel Core i7-8565U (452 - 815, n=52) | |
| HP ProBook 650 G4 3UP57EA | |
| HP ProBook 450 G5-2UB53EA | |
| HP ProBook 450 G6-5TJ93EA | |
| Acer TravelMate P2510-G2-MG-50WE | |
| Lenovo ThinkPad E580-20KS001RGE | |
| Cinebench R11.5 | |
| CPU Single 64Bit | |
| Média da turma Office (2 - 3.6, n=13, últimos 2 anos) | |
| HP ProBook 450 G6-5TJ93EA | |
| Média Intel Core i7-8565U (0.65 - 2.16, n=11) | |
| Dell Latitude 5590 | |
| CPU Multi 64Bit | |
| Média da turma Office (9.76 - 31.5, n=13, últimos 2 anos) | |
| Dell Latitude 5590 | |
| Média Intel Core i7-8565U (4.09 - 7.4, n=11) | |
| HP ProBook 450 G6-5TJ93EA | |
| Cinebench R10 | |
| Rendering Single CPUs 64Bit | |
| Média da turma Office (11106 - 15443, n=6, últimos 2 anos) | |
| HP ProBook 450 G6-5TJ93EA | |
| Dell Latitude 5590 | |
| Média Intel Core i7-8565U (5474 - 9435, n=6) | |
| Rendering Multiple CPUs 64Bit | |
| Média da turma Office (48700 - 76704, n=6, últimos 2 anos) | |
| Dell Latitude 5590 | |
| Média Intel Core i7-8565U (14542 - 26851, n=6) | |
| HP ProBook 450 G6-5TJ93EA | |
| PCMark 8 | |
| Home Score Accelerated v2 | |
| Média da turma Office (n=1últimos 2 anos) | |
| Lenovo ThinkPad E580-20KS001RGE | |
| HP ProBook 450 G5-2UB53EA | |
| Dell Latitude 5590 | |
| HP ProBook 650 G4 3UP57EA | |
| Acer TravelMate P2510-G2-MG-50WE | |
| HP ProBook 450 G6-5TJ93EA | |
| Média Intel Core i7-8565U, NVIDIA GeForce MX130 (n=1) | |
| Work Score Accelerated v2 | |
| Média da turma Office (n=1últimos 2 anos) | |
| Lenovo ThinkPad E580-20KS001RGE | |
| HP ProBook 450 G6-5TJ93EA | |
| Média Intel Core i7-8565U, NVIDIA GeForce MX130 (n=1) | |
| HP ProBook 650 G4 3UP57EA | |
| Acer TravelMate P2510-G2-MG-50WE | |
| Dell Latitude 5590 | |
| PCMark 8 Home Score Accelerated v2 | 3457 pontos | |
| PCMark 8 Work Score Accelerated v2 | 5033 pontos | |
| PCMark 10 Score | 3668 pontos | |
Ajuda | ||
| HP ProBook 450 G6-5TJ93EA Samsung SSD PM981 MZVLB512HAJQ | HP ProBook 450 G5-2UB53EA SanDisk SD8SN8U256G1006 | HP ProBook 650 G4 3UP57EA Toshiba XG5 KXG50ZNV256G | Acer TravelMate P2510-G2-MG-50WE SK Hynix HFS256G39TND-N210A | Lenovo ThinkPad E580-20KS001RGE Lenovo LENSE20256GMSP34MEAT2TA | Dell Latitude 5590 SK hynix SC311 M.2 | Média Samsung SSD PM981 MZVLB512HAJQ | |
|---|---|---|---|---|---|---|---|
| CrystalDiskMark 5.2 / 6 | -58% | -37% | -62% | -41% | -54% | -0% | |
| Write 4K (MB/s) | 126.1 | 51.6 -59% | 89.7 -29% | 71.8 -43% | 86.1 -32% | 76.7 -39% | 126.7 ? 0% |
| Read 4K (MB/s) | 43.92 | 27.1 -38% | 30.73 -30% | 21.23 -52% | 36.81 -16% | 28.41 -35% | 44 ? 0% |
| Write Seq (MB/s) | 1669 | 471.6 -72% | 385.3 -77% | 257.1 -85% | 845 -49% | 436.7 -74% | 1617 ? -3% |
| Read Seq (MB/s) | 2224 | 499.3 -78% | 1986 -11% | 476.3 -79% | 1268 -43% | 508 -77% | 1716 ? -23% |
| Write 4K Q32T1 (MB/s) | 410.4 | 283.2 -31% | 339.9 -17% | 202.6 -51% | 161.1 -61% | 288.1 -30% | 413 ? 1% |
| Read 4K Q32T1 (MB/s) | 338.1 | 257.9 -24% | 241.7 -29% | 282 -17% | 249.6 -26% | 271.9 -20% | 420 ? 24% |
| Write Seq Q32T1 (MB/s) | 1979 | 476.6 -76% | 345.2 -83% | 265.6 -87% | 1034 -48% | 503 -75% | 2076 ? 5% |
| Read Seq Q32T1 (MB/s) | 3368 | 533 -84% | 2759 -18% | 559 -83% | 1732 -49% | 549 -84% | 3130 ? -7% |
| Write 4K Q8T8 (MB/s) | 4.686 | 1264 ? | |||||
| Read 4K Q8T8 (MB/s) | 452.5 | 1193 ? | |||||
| AS SSD | -75% | -48% | -66% | -71% | -63% | 17% | |
| Seq Read (MB/s) | 2063 | 433.2 -79% | 1542 -25% | 487.3 -76% | 1315 -36% | 503 -76% | 1976 ? -4% |
| Seq Write (MB/s) | 1163 | 363.6 -69% | 362.7 -69% | 250.6 -78% | 770 -34% | 393 -66% | 1637 ? 41% |
| 4K Read (MB/s) | 50.6 | 25.58 -49% | 29.81 -41% | 27.61 -45% | 31.54 -38% | 29.03 -43% | 50.5 ? 0% |
| 4K Write (MB/s) | 125.4 | 48.17 -62% | 94.9 -24% | 72.1 -43% | 68.5 -45% | 73.5 -41% | 112 ? -11% |
| 4K-64 Read (MB/s) | 1352 | 338.3 -75% | 408.5 -70% | 375.9 -72% | 419 -69% | 306 -77% | 1203 ? -11% |
| 4K-64 Write (MB/s) | 1023 | 144.1 -86% | 327.6 -68% | 202.1 -80% | 91.6 -91% | 212.7 -79% | 1504 ? 47% |
| Access Time Read * (ms) | 0.044 | 0.145 -230% | 0.079 -80% | 0.08 -82% | 0.176 -300% | 0.111 -152% | 0.05092 ? -16% |
| Access Time Write * (ms) | 0.182 | 0.092 49% | 0.054 70% | 0.233 -28% | 0.173 5% | 0.047 74% | 0.08337 ? 54% |
| Score Read (Points) | 1608 | 407 -75% | 592 -63% | 452 -72% | 582 -64% | 385 -76% | 1451 ? -10% |
| Score Write (Points) | 1265 | 229 -82% | 459 -64% | 299 -76% | 237 -81% | 326 -74% | 1780 ? 41% |
| Score Total (Points) | 3658 | 849 -77% | 1303 -64% | 980 -73% | 1099 -70% | 912 -75% | 3966 ? 8% |
| Copy ISO MB/s (MB/s) | 1382 | 284.6 -79% | 369.5 -73% | 908 -34% | 311.5 -77% | 1755 ? 27% | |
| Copy Program MB/s (MB/s) | 414.3 | 122.4 -70% | 246.7 -40% | 174 -58% | 208.6 -50% | 454 ? 10% | |
| Copy Game MB/s (MB/s) | 660 | 182.2 -72% | 286.1 -57% | 132.7 -80% | 210 -68% | 1057 ? 60% | |
| Média Total (Programa/Configurações) | -67% /
-69% | -43% /
-44% | -64% /
-64% | -56% /
-60% | -59% /
-60% | 9% /
11% |
* ... menor é melhor

| 3DMark 11 - 1280x720 Performance GPU | |
| Média da turma Office (2551 - 18313, n=68, últimos 2 anos) | |
| Lenovo ThinkPad E580-20KS001RGE | |
| HP ProBook 450 G6-5TJ93EA | |
| Média NVIDIA GeForce MX130 (2476 - 3203, n=14) | |
| Acer TravelMate P2510-G2-MG-50WE | |
| HP ProBook 650 G4 3UP57EA | |
| Dell Latitude 5590 | |
| HP ProBook 450 G5-2UB53EA | |
| 3DMark | |
| 1280x720 Cloud Gate Standard Graphics | |
| Média da turma Office (11640 - 118515, n=37, últimos 2 anos) | |
| Lenovo ThinkPad E580-20KS001RGE | |
| HP ProBook 450 G6-5TJ93EA | |
| Média NVIDIA GeForce MX130 (12166 - 14880, n=13) | |
| Acer TravelMate P2510-G2-MG-50WE | |
| HP ProBook 650 G4 3UP57EA | |
| Dell Latitude 5590 | |
| HP ProBook 450 G5-2UB53EA | |
| 1920x1080 Fire Strike Graphics | |
| Média da turma Office (736 - 21871, n=73, últimos 2 anos) | |
| Lenovo ThinkPad E580-20KS001RGE | |
| HP ProBook 450 G6-5TJ93EA | |
| Média NVIDIA GeForce MX130 (2149 - 2495, n=13) | |
| Acer TravelMate P2510-G2-MG-50WE | |
| HP ProBook 650 G4 3UP57EA | |
| Dell Latitude 5590 | |
| HP ProBook 450 G5-2UB53EA | |
| 3DMark 11 Performance | 3122 pontos | |
| 3DMark Cloud Gate Standard Score | 10308 pontos | |
| 3DMark Fire Strike Score | 2226 pontos | |
Ajuda | ||
| Rise of the Tomb Raider | |
| 1024x768 Lowest Preset | |
| Acer TravelMate P2510-G2-MG-50WE | |
| Lenovo ThinkPad E580-20KS001RGE | |
| Média NVIDIA GeForce MX130 (30.7 - 51.2, n=8) | |
| HP ProBook 450 G6-5TJ93EA | |
| 1366x768 Medium Preset AF:2x | |
| Lenovo ThinkPad E580-20KS001RGE | |
| Acer TravelMate P2510-G2-MG-50WE | |
| Média NVIDIA GeForce MX130 (22.5 - 31.3, n=8) | |
| HP ProBook 450 G6-5TJ93EA | |
| 1920x1080 High Preset AA:FX AF:4x | |
| Lenovo ThinkPad E580-20KS001RGE | |
| Acer TravelMate P2510-G2-MG-50WE | |
| Média NVIDIA GeForce MX130 (13.2 - 16.9, n=8) | |
| HP ProBook 450 G6-5TJ93EA | |
| 1920x1080 Very High Preset AA:FX AF:16x | |
| Acer TravelMate P2510-G2-MG-50WE | |
| Média NVIDIA GeForce MX130 (12.1 - 14, n=7) | |
| HP ProBook 450 G6-5TJ93EA | |
| BioShock Infinite | |
| 1280x720 Very Low Preset | |
| Lenovo ThinkPad E580-20KS001RGE | |
| HP ProBook 450 G6-5TJ93EA | |
| Média NVIDIA GeForce MX130 (83.6 - 152.6, n=10) | |
| HP ProBook 650 G4 3UP57EA | |
| HP ProBook 450 G5-2UB53EA | |
| Dell Latitude 5590 | |
| 1366x768 Medium Preset | |
| Lenovo ThinkPad E580-20KS001RGE | |
| HP ProBook 450 G6-5TJ93EA | |
| Média NVIDIA GeForce MX130 (57.3 - 84.5, n=10) | |
| Dell Latitude 5590 | |
| HP ProBook 650 G4 3UP57EA | |
| HP ProBook 450 G5-2UB53EA | |
| 1366x768 High Preset | |
| Lenovo ThinkPad E580-20KS001RGE | |
| HP ProBook 450 G6-5TJ93EA | |
| Média NVIDIA GeForce MX130 (48 - 69, n=10) | |
| Dell Latitude 5590 | |
| HP ProBook 650 G4 3UP57EA | |
| HP ProBook 450 G5-2UB53EA | |
| 1920x1080 Ultra Preset, DX11 (DDOF) | |
| Média NVIDIA GeForce MX130 (22 - 48.7, n=10) | |
| HP ProBook 450 G6-5TJ93EA | |
| Lenovo ThinkPad E580-20KS001RGE | |
| HP ProBook 650 G4 3UP57EA | |
| Dell Latitude 5590 | |
| baixo | média | alto | ultra | |
|---|---|---|---|---|
| BioShock Infinite (2013) | 134.3 | 73.7 | 63.4 | 23.7 |
| The Witcher 3 (2015) | 26.1 | 21.3 | 10.6 | 7 |
| Dota 2 Reborn (2015) | 27.8 | 23.1 | 22.9 | 21 |
| Rise of the Tomb Raider (2016) | 30.7 | 23.6 | 14.4 | 12.4 |
Barulho
| Ocioso |
| 29 / 29 / 29 dB |
| HDD |
| 29.4 dB |
| Carga |
| 34.2 / 38.4 dB |
 | ||
30 dB silencioso 40 dB(A) audível 50 dB(A) ruidosamente alto |
||
min: | ||
| HP ProBook 450 G6-5TJ93EA GeForce MX130, i7-8565U, Samsung SSD PM981 MZVLB512HAJQ | HP ProBook 450 G5-2UB53EA UHD Graphics 620, i5-8250U, SanDisk SD8SN8U256G1006 | HP ProBook 650 G4 3UP57EA UHD Graphics 620, i5-8250U, Toshiba XG5 KXG50ZNV256G | Acer TravelMate P2510-G2-MG-50WE GeForce MX130, i5-8250U, SK Hynix HFS256G39TND-N210A | Lenovo ThinkPad E580-20KS001RGE Radeon RX 550 (Laptop), i5-8550U, Lenovo LENSE20256GMSP34MEAT2TA | Dell Latitude 5590 UHD Graphics 620, i5-8250U, SK hynix SC311 M.2 | |
|---|---|---|---|---|---|---|
| Noise | 4% | -8% | -4% | -5% | -4% | |
| desligado / ambiente * (dB) | 29 | 29.1 -0% | 30.3 -4% | 30.3 -4% | 30.1 -4% | 29 -0% |
| Idle Minimum * (dB) | 29 | 29.1 -0% | 32 -10% | 30.3 -4% | 30.1 -4% | 29 -0% |
| Idle Average * (dB) | 29 | 29.1 -0% | 33.8 -17% | 30.3 -4% | 30.1 -4% | 29 -0% |
| Idle Maximum * (dB) | 29 | 29.1 -0% | 34.2 -18% | 31 -7% | 31.6 -9% | 31.3 -8% |
| Load Average * (dB) | 34.2 | 31.4 8% | 36.2 -6% | 35.6 -4% | 37.7 -10% | 36.6 -7% |
| Witcher 3 ultra * (dB) | 34.2 | |||||
| Load Maximum * (dB) | 38.4 | 32 17% | 35.6 7% | 38.6 -1% | 38 1% | 40.9 -7% |
* ... menor é melhor
| HP ProBook 450 G6-5TJ93EA GeForce MX130, i7-8565U, Samsung SSD PM981 MZVLB512HAJQ | HP ProBook 450 G5-2UB53EA UHD Graphics 620, i5-8250U, SanDisk SD8SN8U256G1006 | HP ProBook 650 G4 3UP57EA UHD Graphics 620, i5-8250U, Toshiba XG5 KXG50ZNV256G | Acer TravelMate P2510-G2-MG-50WE GeForce MX130, i5-8250U, SK Hynix HFS256G39TND-N210A | Lenovo ThinkPad E580-20KS001RGE Radeon RX 550 (Laptop), i5-8550U, Lenovo LENSE20256GMSP34MEAT2TA | Dell Latitude 5590 UHD Graphics 620, i5-8250U, SK hynix SC311 M.2 | |
|---|---|---|---|---|---|---|
| Heat | -1% | 1% | -11% | -30% | 3% | |
| Maximum Upper Side * (°C) | 39.4 | 42.2 -7% | 35.7 9% | 49 -24% | 60 -52% | 36.6 7% |
| Maximum Bottom * (°C) | 50.2 | 45.5 9% | 33.8 33% | 47.4 6% | 57 -14% | 47.5 5% |
| Idle Upper Side * (°C) | 22.9 | 23.9 -4% | 28.4 -24% | 26.6 -16% | 29.1 -27% | 23.2 -1% |
| Idle Bottom * (°C) | 24.1 | 24.2 -0% | 27.4 -14% | 26.7 -11% | 30.2 -25% | 24.2 -0% |
* ... menor é melhor
(+) A temperatura máxima no lado superior é 39.4 °C / 103 F, em comparação com a média de 34.3 °C / 94 F , variando de 21.2 a 62.5 °C para a classe Office.
(-) A parte inferior aquece até um máximo de 50.2 °C / 122 F, em comparação com a média de 36.8 °C / 98 F
(+) Em uso inativo, a temperatura média para o lado superior é 22.5 °C / 73 F, em comparação com a média do dispositivo de 29.5 °C / ### class_avg_f### F.
(±) Jogando The Witcher 3, a temperatura média para o lado superior é 34.9 °C / 95 F, em comparação com a média do dispositivo de 29.5 °C / ## #class_avg_f### F.
(+) Os apoios para as mãos e o touchpad são mais frios que a temperatura da pele, com um máximo de 30.5 °C / 86.9 F e, portanto, são frios ao toque.
(-) A temperatura média da área do apoio para as mãos de dispositivos semelhantes foi 27.5 °C / 81.5 F (-3 °C / -5.4 F).
HP ProBook 450 G6-5TJ93EA análise de áudio
(±) | o volume do alto-falante é médio, mas bom (###valor### dB)
Graves 100 - 315Hz
(-) | quase nenhum baixo - em média 21.8% menor que a mediana
(±) | a linearidade dos graves é média (10.6% delta para a frequência anterior)
Médios 400 - 2.000 Hz
(±) | médios mais altos - em média 5.6% maior que a mediana
(±) | a linearidade dos médios é média (7.7% delta para frequência anterior)
Altos 2 - 16 kHz
(±) | máximos mais altos - em média 5.1% maior que a mediana
(+) | os máximos são lineares (4.6% delta da frequência anterior)
Geral 100 - 16.000 Hz
(±) | a linearidade do som geral é média (27.1% diferença em relação à mediana)
Comparado com a mesma classe
» 84% de todos os dispositivos testados nesta classe foram melhores, 5% semelhantes, 11% piores
» O melhor teve um delta de 7%, a média foi 21%, o pior foi 53%
Comparado com todos os dispositivos testados
» 83% de todos os dispositivos testados foram melhores, 4% semelhantes, 14% piores
» O melhor teve um delta de 4%, a média foi 24%, o pior foi 134%
Apple MacBook 12 (Early 2016) 1.1 GHz análise de áudio
(+) | os alto-falantes podem tocar relativamente alto (###valor### dB)
Graves 100 - 315Hz
(±) | graves reduzidos - em média 11.3% menor que a mediana
(±) | a linearidade dos graves é média (14.2% delta para a frequência anterior)
Médios 400 - 2.000 Hz
(+) | médios equilibrados - apenas 2.4% longe da mediana
(+) | médios são lineares (5.5% delta para frequência anterior)
Altos 2 - 16 kHz
(+) | agudos equilibrados - apenas 2% longe da mediana
(+) | os máximos são lineares (4.5% delta da frequência anterior)
Geral 100 - 16.000 Hz
(+) | o som geral é linear (10.2% diferença em relação à mediana)
Comparado com a mesma classe
» 7% de todos os dispositivos testados nesta classe foram melhores, 2% semelhantes, 91% piores
» O melhor teve um delta de 5%, a média foi 18%, o pior foi 53%
Comparado com todos os dispositivos testados
» 5% de todos os dispositivos testados foram melhores, 1% semelhantes, 94% piores
» O melhor teve um delta de 4%, a média foi 24%, o pior foi 134%
| desligado | |
| Ocioso | |
| Carga |
|
Key:
min: | |
| HP ProBook 450 G6-5TJ93EA i7-8565U, GeForce MX130, Samsung SSD PM981 MZVLB512HAJQ, IPS, 1920x1080, 15.6" | HP ProBook 450 G5-2UB53EA i5-8250U, UHD Graphics 620, SanDisk SD8SN8U256G1006, IPS LED, 1920x1080, 15.6" | HP ProBook 650 G4 3UP57EA i5-8250U, UHD Graphics 620, Toshiba XG5 KXG50ZNV256G, IPS LED, 1920x1080, 15.6" | Acer TravelMate P2510-G2-MG-50WE i5-8250U, GeForce MX130, SK Hynix HFS256G39TND-N210A, IPS, 1920x1080, 15.6" | Lenovo ThinkPad E580-20KS001RGE i5-8550U, Radeon RX 550 (Laptop), Lenovo LENSE20256GMSP34MEAT2TA, IPS LED, 1920x1080, 15.6" | Dell Latitude 5590 i5-8250U, UHD Graphics 620, SK hynix SC311 M.2, IPS, 1920x1080, 15.6" | Média NVIDIA GeForce MX130 | Média da turma Office | |
|---|---|---|---|---|---|---|---|---|
| Power Consumption | 17% | 25% | 7% | -38% | 5% | -9% | -3% | |
| Idle Minimum * (Watt) | 3.12 | 3.6 -15% | 3.2 -3% | 3.3 -6% | 7.4 -137% | 3.6 -15% | 4.54 ? -46% | 4.41 ? -41% |
| Idle Average * (Watt) | 6.3 | 6.2 2% | 6 5% | 5.6 11% | 10.4 -65% | 6.5 -3% | 6.98 ? -11% | 7.37 ? -17% |
| Idle Maximum * (Watt) | 9.78 | 7.2 26% | 6.4 35% | 7.8 20% | 10.3 -5% | 7.2 26% | 9.08 ? 7% | 8.58 ? 12% |
| Load Average * (Watt) | 57.6 | 35.2 39% | 34 41% | 54 6% | 57 1% | 46.2 20% | 54.1 ? 6% | 43 ? 25% |
| Witcher 3 ultra * (Watt) | 42 | |||||||
| Load Maximum * (Watt) | 67.3 | 46.4 31% | 34.4 49% | 63 6% | 57 15% | 68.8 -2% | 66.4 ? 1% | 64.6 ? 4% |
* ... menor é melhor
| HP ProBook 450 G6-5TJ93EA i7-8565U, GeForce MX130, 45 Wh | HP ProBook 450 G5-2UB53EA i5-8250U, UHD Graphics 620, 48 Wh | HP ProBook 650 G4 3UP57EA i5-8250U, UHD Graphics 620, 48 Wh | Acer TravelMate P2510-G2-MG-50WE i5-8250U, GeForce MX130, 48 Wh | Lenovo ThinkPad E580-20KS001RGE i5-8550U, Radeon RX 550 (Laptop), 45 Wh | Dell Latitude 5590 i5-8250U, UHD Graphics 620, 51 Wh | Média da turma Office | |
|---|---|---|---|---|---|---|---|
| Duração da bateria | -21% | -15% | -3% | -13% | -14% | 43% | |
| Reader / Idle (h) | 14.6 | 14.4 -1% | 17.4 19% | 23.7 ? 62% | |||
| H.264 (h) | 7.7 | 8.6 12% | 9.1 18% | 6.7 -13% | 15 ? 95% | ||
| WiFi v1.3 (h) | 9.7 | 7.7 -21% | 8.2 -15% | 8.4 -13% | 6.7 -31% | 7.4 -24% | 12.9 ? 33% |
| Load (h) | 2.2 | 2 -9% | 1.4 -36% | 1.4 -36% | 1.794 ? -18% |
Pro
Contra
O HP ProBook 450 G6 não é notável. Quase não há áreas nas quais brilhe, mas também não apresenta erros sérios. A HP fez alguns compromissos notáveis com a série ProBook 400 em comparação com a série ProBook 600.
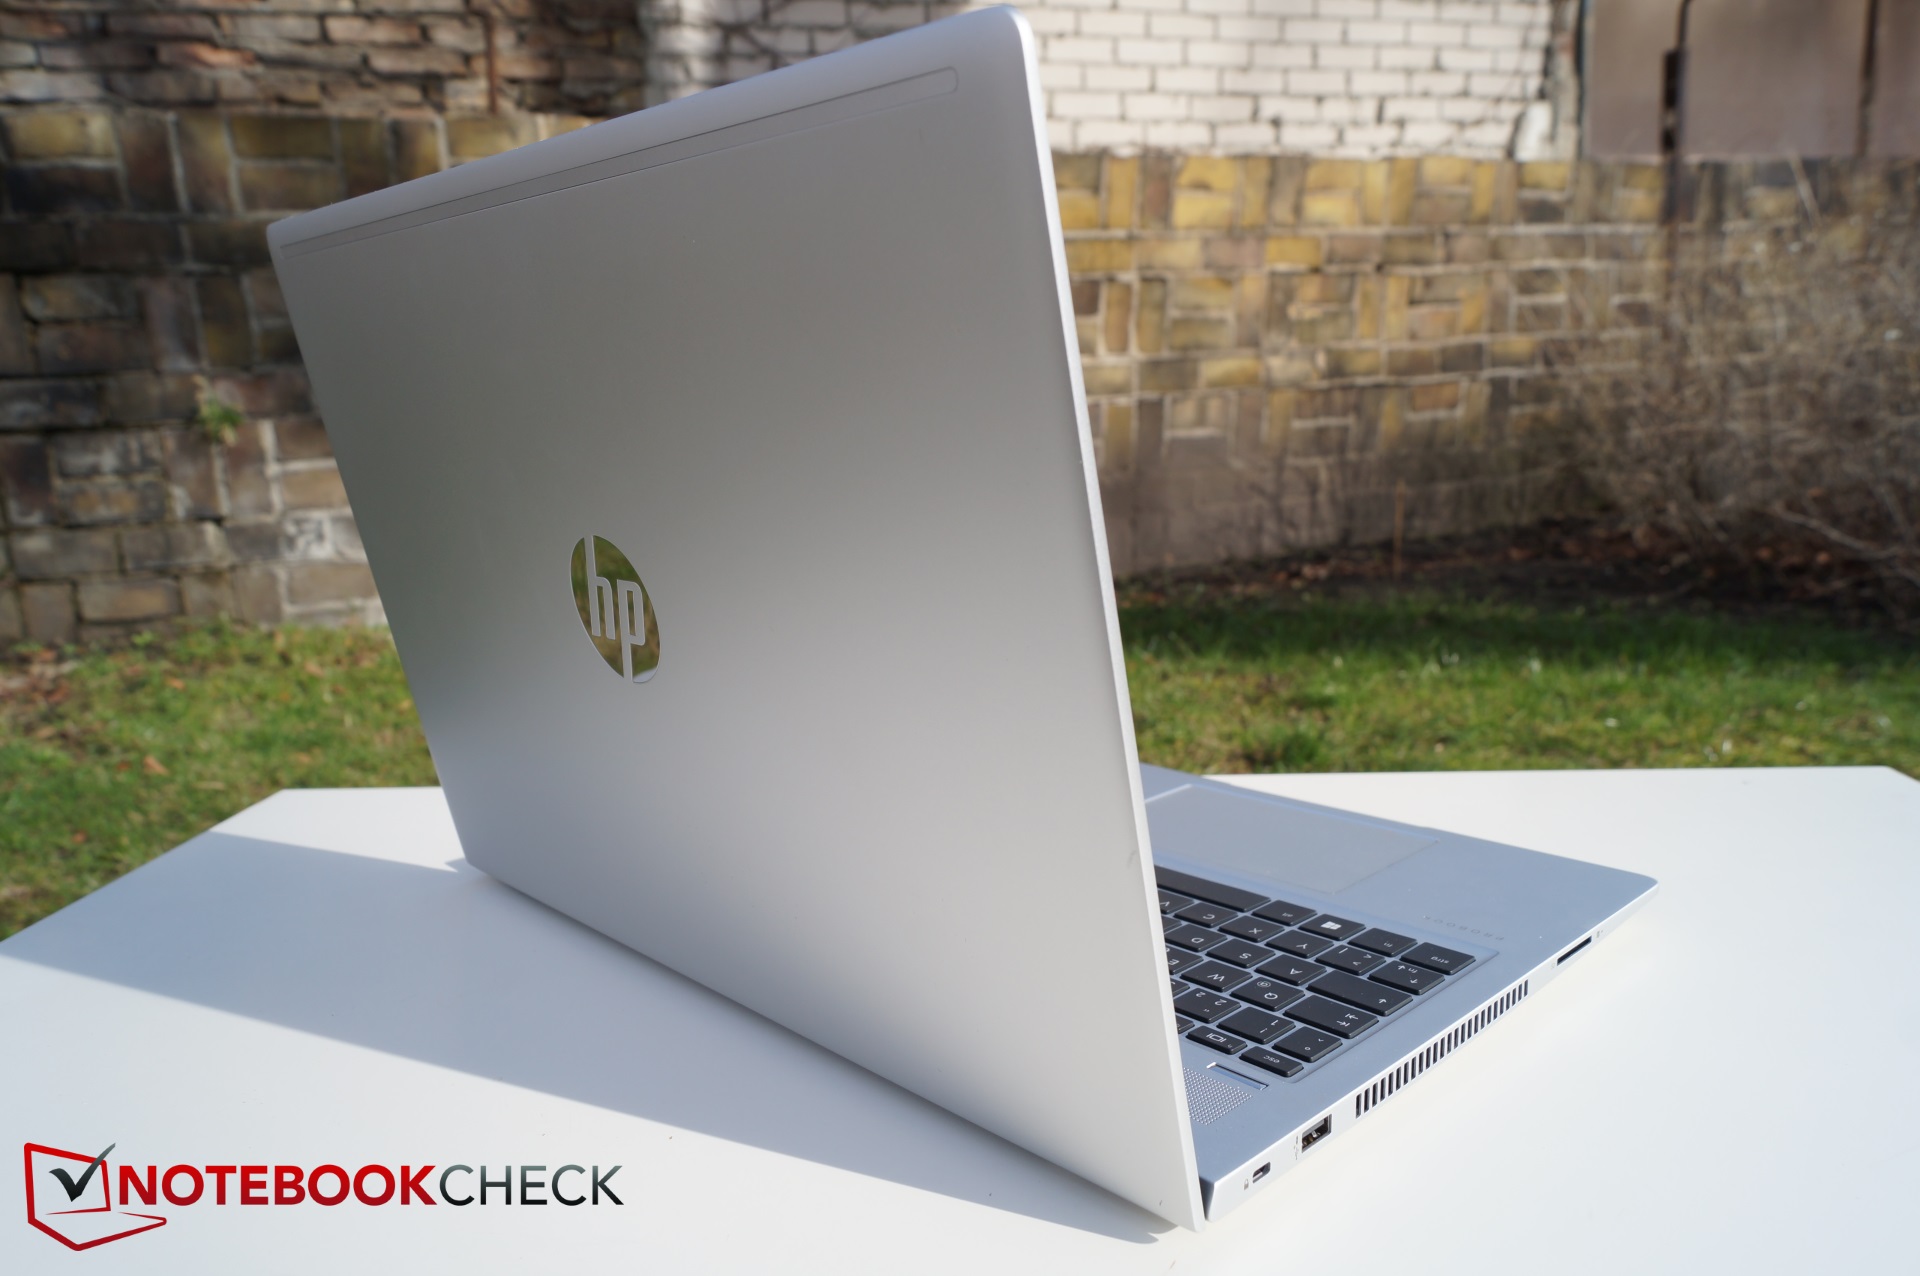
Não é tudo desgraça e melancolia. O SSD é excepcionalmente rápido, assim como o seu módulo Wi-Fi. Muitos de seus componentes também são atualizáveis ou substituíveis, embora acessá-los seja um processo mais complicado do que com o ProBook 450 G5.
O HP ProBook 450 G6 é um portátil compacto e leve de 15,6 polegadas que funciona bem, na maioria das áreas. No entanto, nossa unidade de análise oferece pouco valor pelo dinheiro e não se destaca de seus concorrentes.
O ProBook 450 G6 não pode tirar o máximo proveito de seu Core i7-8565U e torna a versão Core i5-8250U um melhor custo-benefício, em nossa opinião. Além disso, o ventilador pulsante vai incomodar algumas pessoas, como aconteceu conosco. A tela também poderia ser mais brilhante, enquanto as portas poderiam ser melhor preparadas para o futuro também. Em suma, o ProBook 450 G6 é um portátil empresarial sólido que fica aquém em várias áreas.
HP ProBook 450 G6-5TJ93EA
- 03/14/2019 v6 (old)
Christian Hintze
Price comparison
