Breve Análise do Portátil Lenovo ThinkPad E580 (i7-8550U, RX 550)
| SD Card Reader | |
| average JPG Copy Test (av. of 3 runs) | |
| Dell Latitude 5580 (Toshiba Exceria Pro SDXC 64 GB UHS-II) | |
| Lenovo ThinkPad E580-20KS001RGE (Toshiba Exceria Pro SDXC 64 GB UHS-II) | |
| HP ProBook 450 G4 Y8B60EA | |
| Lenovo ThinkPad E570-20H6S00000 (Toshiba Exceria Pro SDXC 64 GB UHS-II) | |
| Acer TravelMate P2510-M-51ZQ (Toshiba Exceria Pro SDXC 64 GB UHS-II) | |
| maximum AS SSD Seq Read Test (1GB) | |
| Dell Latitude 5580 (Toshiba Exceria Pro SDXC 64 GB UHS-II) | |
| HP ProBook 450 G4 Y8B60EA | |
| Lenovo ThinkPad E580-20KS001RGE (Toshiba Exceria Pro SDXC 64 GB UHS-II) | |
| Lenovo ThinkPad E570-20H6S00000 (Toshiba Exceria Pro SDXC 64 GB UHS-II) | |
| Acer TravelMate P2510-M-51ZQ (Toshiba Exceria Pro SDXC 64 GB UHS-II) | |
| |||||||||||||||||||||||||
iluminação: 81 %
iluminação com acumulador: 292 cd/m²
Contraste: 1526:1 (Preto: 0.19 cd/m²)
ΔE ColorChecker Calman: 4.9 | ∀{0.5-29.43 Ø4.71}
ΔE Greyscale Calman: 2.92 | ∀{0.09-98 Ø4.96}
58% sRGB (Argyll 1.6.3 3D)
37% AdobeRGB 1998 (Argyll 1.6.3 3D)
41.32% AdobeRGB 1998 (Argyll 3D)
58.2% sRGB (Argyll 3D)
40% Display P3 (Argyll 3D)
Gamma: 2.31
CCT: 6091 K
| Lenovo ThinkPad E580-20KS001RGE BOE NV156FHM-N49, , 1920x1080, 15.6" | HP ProBook 450 G4 Y8B60EA Chi Mei CMN15C4, , 1920x1080, 15.6" | Dell Latitude 5580 BOE NV15N42, , 1920x1080, 15.6" | Acer TravelMate P2510-M-51ZQ Chi Mei CMN15D3 / N156HCE-EAA, , 1920x1080, 15.6" | Lenovo ThinkPad E570-20H6S00000 AUO B156HAN04.4, , 1920x1080, 15.6" | |
|---|---|---|---|---|---|
| Display | 1% | 4% | 7% | -2% | |
| Display P3 Coverage (%) | 40 | 39.89 0% | 41.57 4% | 42.44 6% | 38.65 -3% |
| sRGB Coverage (%) | 58.2 | 59.5 2% | 60.7 4% | 63.2 9% | 58 0% |
| AdobeRGB 1998 Coverage (%) | 41.32 | 41.24 0% | 42.94 4% | 43.94 6% | 39.94 -3% |
| Response Times | 0% | 4% | 3% | 14% | |
| Response Time Grey 50% / Grey 80% * (ms) | 48 ? | 51 ? -6% | 43 ? 10% | 45 ? 6% | 44.8 ? 7% |
| Response Time Black / White * (ms) | 32 ? | 30 ? 6% | 33 ? -3% | 32 ? -0% | 25.6 ? 20% |
| PWM Frequency (Hz) | 25000 ? | 50 ? | 1020 ? | 25000 ? | |
| Screen | -74% | -7% | -23% | -11% | |
| Brightness middle (cd/m²) | 290 | 214 -26% | 234 -19% | 215 -26% | 242 -17% |
| Brightness (cd/m²) | 267 | 201 -25% | 224 -16% | 198 -26% | 243 -9% |
| Brightness Distribution (%) | 81 | 77 -5% | 84 4% | 78 -4% | 75 -7% |
| Black Level * (cd/m²) | 0.19 | 0.43 -126% | 0.18 5% | 0.32 -68% | 0.24 -26% |
| Contrast (:1) | 1526 | 498 -67% | 1300 -15% | 672 -56% | 1008 -34% |
| Colorchecker dE 2000 * | 4.9 | 10.68 -118% | 5.3 -8% | 5.15 -5% | 4.65 5% |
| Colorchecker dE 2000 max. * | 9.52 | 18.07 -90% | 9.09 5% | 10.89 -14% | 9.64 -1% |
| Greyscale dE 2000 * | 2.92 | 11.32 -288% | 4 -37% | 4.25 -46% | 3.39 -16% |
| Gamma | 2.31 95% | 2.26 97% | 2.46 89% | 2.61 84% | 2.7 81% |
| CCT | 6091 107% | 12204 53% | 6441 101% | 6603 98% | 6246 104% |
| Color Space (Percent of AdobeRGB 1998) (%) | 37 | 38 3% | 39 5% | 40 8% | 36.69 -1% |
| Color Space (Percent of sRGB) (%) | 58 | 59 2% | 60 3% | 63 9% | 57.66 -1% |
| Média Total (Programa/Configurações) | -24% /
-49% | 0% /
-4% | -4% /
-13% | 0% /
-6% |
* ... menor é melhor
Exibir tempos de resposta
| ↔ Tempo de resposta preto para branco | ||
|---|---|---|
| 32 ms ... ascensão ↗ e queda ↘ combinadas | ↗ 18 ms ascensão | 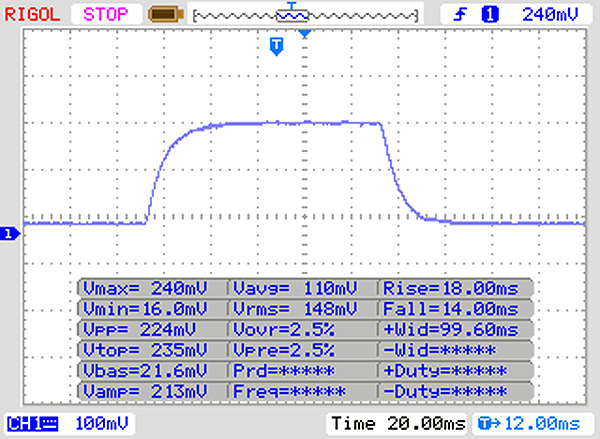 |
| ↘ 14 ms queda | ||
| A tela mostra taxas de resposta lentas em nossos testes e será insatisfatória para os jogadores. Em comparação, todos os dispositivos testados variam de 0.1 (mínimo) a 240 (máximo) ms. » 86 % de todos os dispositivos são melhores. Isso significa que o tempo de resposta medido é pior que a média de todos os dispositivos testados (19.8 ms). | ||
| ↔ Tempo de resposta 50% cinza a 80% cinza | ||
| 48 ms ... ascensão ↗ e queda ↘ combinadas | ↗ 26 ms ascensão | 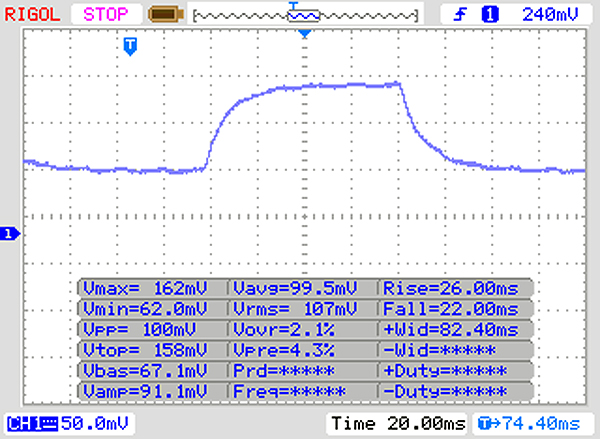 |
| ↘ 22 ms queda | ||
| A tela mostra taxas de resposta lentas em nossos testes e será insatisfatória para os jogadores. Em comparação, todos os dispositivos testados variam de 0.165 (mínimo) a 636 (máximo) ms. » 82 % de todos os dispositivos são melhores. Isso significa que o tempo de resposta medido é pior que a média de todos os dispositivos testados (31 ms). | ||
Cintilação da tela / PWM (modulação por largura de pulso)
| Tela tremeluzindo/PWM detectado | 25000 Hz | ≤ 90 % configuração de brilho | 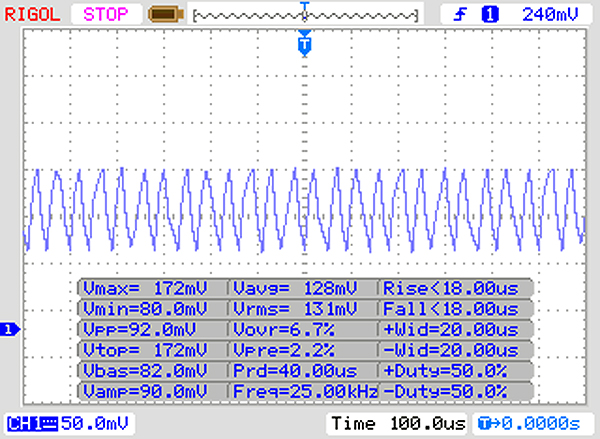 |
A luz de fundo da tela pisca em 25000 Hz (pior caso, por exemplo, utilizando PWM) Cintilação detectada em uma configuração de brilho de 90 % e abaixo. Não deve haver cintilação ou PWM acima desta configuração de brilho. A frequência de 25000 Hz é bastante alta, então a maioria dos usuários sensíveis ao PWM não deve notar nenhuma oscilação. [pwm_comparison] Em comparação: 52 % de todos os dispositivos testados não usam PWM para escurecer a tela. Se PWM foi detectado, uma média de 7754 (mínimo: 5 - máximo: 343500) Hz foi medida. | |||
| Cinebench R15 | |
| CPU Single 64Bit | |
| Lenovo ThinkPad P51 20HH0016GE | |
| Lenovo ThinkPad E580-20KS001RGE | |
| HP ProBook 450 G4 Y8B60EA | |
| Lenovo ThinkPad E480-20KQS00000 | |
| Dell Latitude 5580 | |
| Dell XPS 13 9370 i5 UHD | |
| Lenovo ThinkPad E570-20H6S00000 | |
| Acer TravelMate P2510-M-51ZQ | |
| CPU Multi 64Bit | |
| Lenovo ThinkPad P51 20HH0016GE | |
| Dell XPS 13 9370 i5 UHD | |
| Lenovo ThinkPad E480-20KQS00000 | |
| Lenovo ThinkPad E580-20KS001RGE | |
| HP ProBook 450 G4 Y8B60EA | |
| Lenovo ThinkPad E570-20H6S00000 | |
| Dell Latitude 5580 | |
| Acer TravelMate P2510-M-51ZQ | |
| PCMark 8 Home Score Accelerated v2 | 4273 pontos | |
| PCMark 8 Work Score Accelerated v2 | 5140 pontos | |
| PCMark 10 Score | 3757 pontos | |
Ajuda | ||
| Lenovo ThinkPad E580-20KS001RGE Lenovo LENSE20256GMSP34MEAT2TA | HP ProBook 450 G4 Y8B60EA SanDisk SD8SNAT256G1002 | Acer TravelMate P2510-M-51ZQ SK Hynix HFS256G39TND-N210A | Lenovo ThinkPad E570-20H6S00000 Toshiba THNSF5256GPUK | Lenovo ThinkPad E480-20KQS00000 Lenovo LENSE20256GMSP34MEAT2TA | |
|---|---|---|---|---|---|
| AS SSD | -15% | -2% | 45% | 22% | |
| Score Total (Points) | 1099 | 607 -45% | 959 -13% | 1578 44% | 1200 9% |
| Score Write (Points) | 237 | 300 27% | 286 21% | 369 56% | 325 37% |
| Score Read (Points) | 582 | 204 -65% | 448 -23% | 813 40% | 602 3% |
| Access Time Write * (ms) | 0.173 | 0.159 8% | 0.228 -32% | 0.036 79% | 0.138 20% |
| Access Time Read * (ms) | 0.176 | 0.141 20% | 0.071 60% | 0.06 66% | 0.095 46% |
| 4K-64 Write (MB/s) | 91.6 | 195.5 113% | 186.5 104% | 232.5 154% | 164 79% |
| 4K-64 Read (MB/s) | 419 | 137.1 -67% | 368.7 -12% | 654 56% | 417.1 0% |
| 4K Write (MB/s) | 68.5 | 73.4 7% | 75.2 10% | 73.1 7% | 98 43% |
| 4K Read (MB/s) | 31.54 | 17.96 -43% | 29.4 -7% | 37.12 18% | 32.07 2% |
| Seq Write (MB/s) | 770 | 315.9 -59% | 242 -69% | 636 -17% | 633 -18% |
| Seq Read (MB/s) | 1315 | 493.8 -62% | 496.8 -62% | 1227 -7% | 1531 16% |
* ... menor é melhor

| 3DMark | |
| 1280x720 Cloud Gate Standard Graphics | |
| Microsoft Surface Book 2 | |
| Lenovo ThinkPad E570-20H6S00000 | |
| Xiaomi Mi Notebook Pro i7 | |
| Lenovo ThinkPad E480-20KQS00000 | |
| Lenovo ThinkPad E580-20KS001RGE | |
| HP ProBook 450 G4 Y8B60EA | |
| Acer TravelMate P2510-M-51ZQ | |
| 1920x1080 Fire Strike Graphics | |
| Microsoft Surface Book 2 | |
| Lenovo ThinkPad E570-20H6S00000 | |
| Xiaomi Mi Notebook Pro i7 | |
| Lenovo ThinkPad E480-20KQS00000 | |
| Lenovo ThinkPad E580-20KS001RGE | |
| HP ProBook 450 G4 Y8B60EA | |
| Acer TravelMate P2510-M-51ZQ | |
| 3DMark 11 - 1280x720 Performance GPU | |
| Microsoft Surface Book 2 | |
| Lenovo ThinkPad E480-20KQS00000 | |
| Lenovo ThinkPad E480-20KQS00000 | |
| Lenovo ThinkPad E580-20KS001RGE | |
| Xiaomi Mi Notebook Pro i7 | |
| Lenovo ThinkPad E570-20H6S00000 | |
| HP ProBook 450 G4 Y8B60EA | |
| Acer TravelMate P2510-M-51ZQ | |
| Dell Latitude 5580 | |
| 3DMark 11 Performance | 4474 pontos | |
| 3DMark Cloud Gate Standard Score | 11982 pontos | |
| 3DMark Fire Strike Score | 2516 pontos | |
Ajuda | ||
| BioShock Infinite - 1366x768 High Preset | |
| HP Spectre x360 15t-bl100 | |
| Lenovo ThinkPad E570-20H6S00000 | |
| Lenovo ThinkPad E580-20KS001RGE | |
| baixo | média | alto | ultra | |
|---|---|---|---|---|
| BioShock Infinite (2013) | 155.3 | 88.3 | 72.6 | 22.17 |
| Company of Heroes 2 (2013) | 49 | 44.85 | 29.85 | 16.97 |
| Rise of the Tomb Raider (2016) | 44.31 | 35.98 | 18.01 |
Barulho
| Ocioso |
| 30.1 / 30.1 / 31.6 dB |
| Carga |
| 37.7 / 38 dB |
 | ||
30 dB silencioso 40 dB(A) audível 50 dB(A) ruidosamente alto |
||
min: | ||
(-) A temperatura máxima no lado superior é 60 °C / 140 F, em comparação com a média de 34.3 °C / 94 F , variando de 21.2 a 62.5 °C para a classe Office.
(-) A parte inferior aquece até um máximo de 57 °C / 135 F, em comparação com a média de 36.8 °C / 98 F
(+) Em uso inativo, a temperatura média para o lado superior é 27.5 °C / 82 F, em comparação com a média do dispositivo de 29.5 °C / ### class_avg_f### F.
(+) Os apoios para as mãos e o touchpad são mais frios que a temperatura da pele, com um máximo de 26.6 °C / 79.9 F e, portanto, são frios ao toque.
(±) A temperatura média da área do apoio para as mãos de dispositivos semelhantes foi 27.5 °C / 81.5 F (+0.9 °C / 1.6 F).
Lenovo ThinkPad E580-20KS001RGE análise de áudio
(-) | alto-falantes não muito altos (###valor### dB)
Graves 100 - 315Hz
(±) | graves reduzidos - em média 12.4% menor que a mediana
(+) | o baixo é linear (5.4% delta para a frequência anterior)
Médios 400 - 2.000 Hz
(±) | médios mais altos - em média 6.4% maior que a mediana
(±) | a linearidade dos médios é média (8.2% delta para frequência anterior)
Altos 2 - 16 kHz
(+) | agudos equilibrados - apenas 3.5% longe da mediana
(+) | os máximos são lineares (5.2% delta da frequência anterior)
Geral 100 - 16.000 Hz
(±) | a linearidade do som geral é média (21.2% diferença em relação à mediana)
Comparado com a mesma classe
» 52% de todos os dispositivos testados nesta classe foram melhores, 9% semelhantes, 40% piores
» O melhor teve um delta de 7%, a média foi 21%, o pior foi 53%
Comparado com todos os dispositivos testados
» 59% de todos os dispositivos testados foram melhores, 7% semelhantes, 34% piores
» O melhor teve um delta de 4%, a média foi 23%, o pior foi 134%
Dell Latitude 5580 análise de áudio
(-) | alto-falantes não muito altos (###valor### dB)
Graves 100 - 315Hz
(±) | graves reduzidos - em média 14.1% menor que a mediana
(+) | o baixo é linear (4.8% delta para a frequência anterior)
Médios 400 - 2.000 Hz
(+) | médios equilibrados - apenas 3.8% longe da mediana
(+) | médios são lineares (5.4% delta para frequência anterior)
Altos 2 - 16 kHz
(+) | agudos equilibrados - apenas 2% longe da mediana
(+) | os máximos são lineares (2.1% delta da frequência anterior)
Geral 100 - 16.000 Hz
(±) | a linearidade do som geral é média (15% diferença em relação à mediana)
Comparado com a mesma classe
» 14% de todos os dispositivos testados nesta classe foram melhores, 4% semelhantes, 82% piores
» O melhor teve um delta de 7%, a média foi 21%, o pior foi 53%
Comparado com todos os dispositivos testados
» 21% de todos os dispositivos testados foram melhores, 4% semelhantes, 75% piores
» O melhor teve um delta de 4%, a média foi 23%, o pior foi 134%
| desligado | |
| Ocioso | |
| Carga |
|
Key:
min: | |
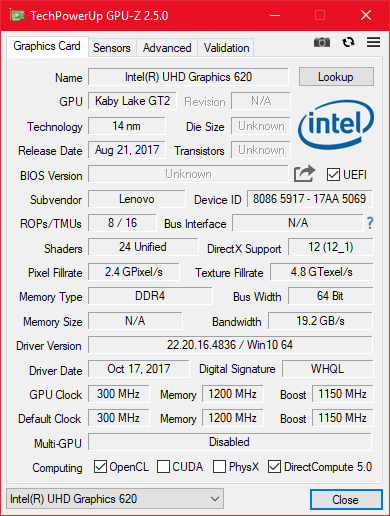
| Lenovo ThinkPad E580-20KS001RGE i5-8550U, Radeon RX 550 (Laptop), Lenovo LENSE20256GMSP34MEAT2TA, IPS LED, 1920x1080, 15.6" | HP ProBook 450 G4 Y8B60EA i7-7500U, GeForce 930MX, SanDisk SD8SNAT256G1002, TN LED, 1920x1080, 15.6" | Dell Latitude 5580 i5-7300U, HD Graphics 620, Toshiba MQ01ACF050, IPS, 1920x1080, 15.6" | Acer TravelMate P2510-M-51ZQ i5-7200U, HD Graphics 620, SK Hynix HFS256G39TND-N210A, IPS, 1920x1080, 15.6" | Lenovo ThinkPad E570-20H6S00000 i5-7200U, GeForce GTX 950M, Toshiba THNSF5256GPUK, IPS LED, 1920x1080, 15.6" | Lenovo ThinkPad E480-20KQS00000 i5-8250U, Radeon RX 550 (Laptop), Lenovo LENSE20256GMSP34MEAT2TA, IPS LED, 1920x1080, 14" | |
|---|---|---|---|---|---|---|
| Power Consumption | 26% | 25% | 39% | 24% | 21% | |
| Idle Minimum * (Watt) | 7.4 | 3.8 49% | 4.3 42% | 3.4 54% | 2.8 62% | 4.1 45% |
| Idle Average * (Watt) | 10.4 | 6.6 37% | 10.1 3% | 5.8 44% | 6.3 39% | 6.3 39% |
| Idle Maximum * (Watt) | 10.3 | 11.3 -10% | 11.8 -15% | 8 22% | 6.9 33% | 7.1 31% |
| Load Average * (Watt) | 57 | 38 33% | 32 44% | 38 33% | 51.6 9% | 54.8 4% |
| Load Maximum * (Watt) | 57 | 45 21% | 29 49% | 32 44% | 69.7 -22% | 66.4 -16% |
| Witcher 3 ultra * (Watt) | 43.8 |
* ... menor é melhor
| Lenovo ThinkPad E580-20KS001RGE i5-8550U, Radeon RX 550 (Laptop), 45 Wh | Lenovo ThinkPad E570-20H6S00000 i5-7200U, GeForce GTX 950M, 41 Wh | HP ProBook 450 G4 Y8B60EA i7-7500U, GeForce 930MX, 45 Wh | Dell Latitude 5580 i5-7300U, HD Graphics 620, 68 Wh | Acer TravelMate P2510-M-51ZQ i5-7200U, HD Graphics 620, 48 Wh | Lenovo ThinkPad E480-20KQS00000 i5-8250U, Radeon RX 550 (Laptop), 48 Wh | |
|---|---|---|---|---|---|---|
| Duração da bateria | 25% | 21% | 52% | 24% | 6% | |
| Reader / Idle (h) | 14.4 | 14.7 2% | 12.4 -14% | 15.2 6% | 19.4 35% | |
| H.264 (h) | 9.1 | 8.9 -2% | ||||
| WiFi v1.3 (h) | 6.7 | 7.7 15% | 8.6 28% | 10.2 52% | 8.8 31% | 5.7 -15% |
| Load (h) | 1.4 | 2.2 57% | 2.1 50% | 1.9 36% | 1.5 7% |
Pro
Contra

O E480 com dGPU não conseguiu chamar nossa atenção e garantir uma recomendação, apesar de sua fenomenal relação de preço-desempenho, principalmente porque esquentou muito, um problema que o E580 maior também sofre, porém em um grau um pouco mais baixo.
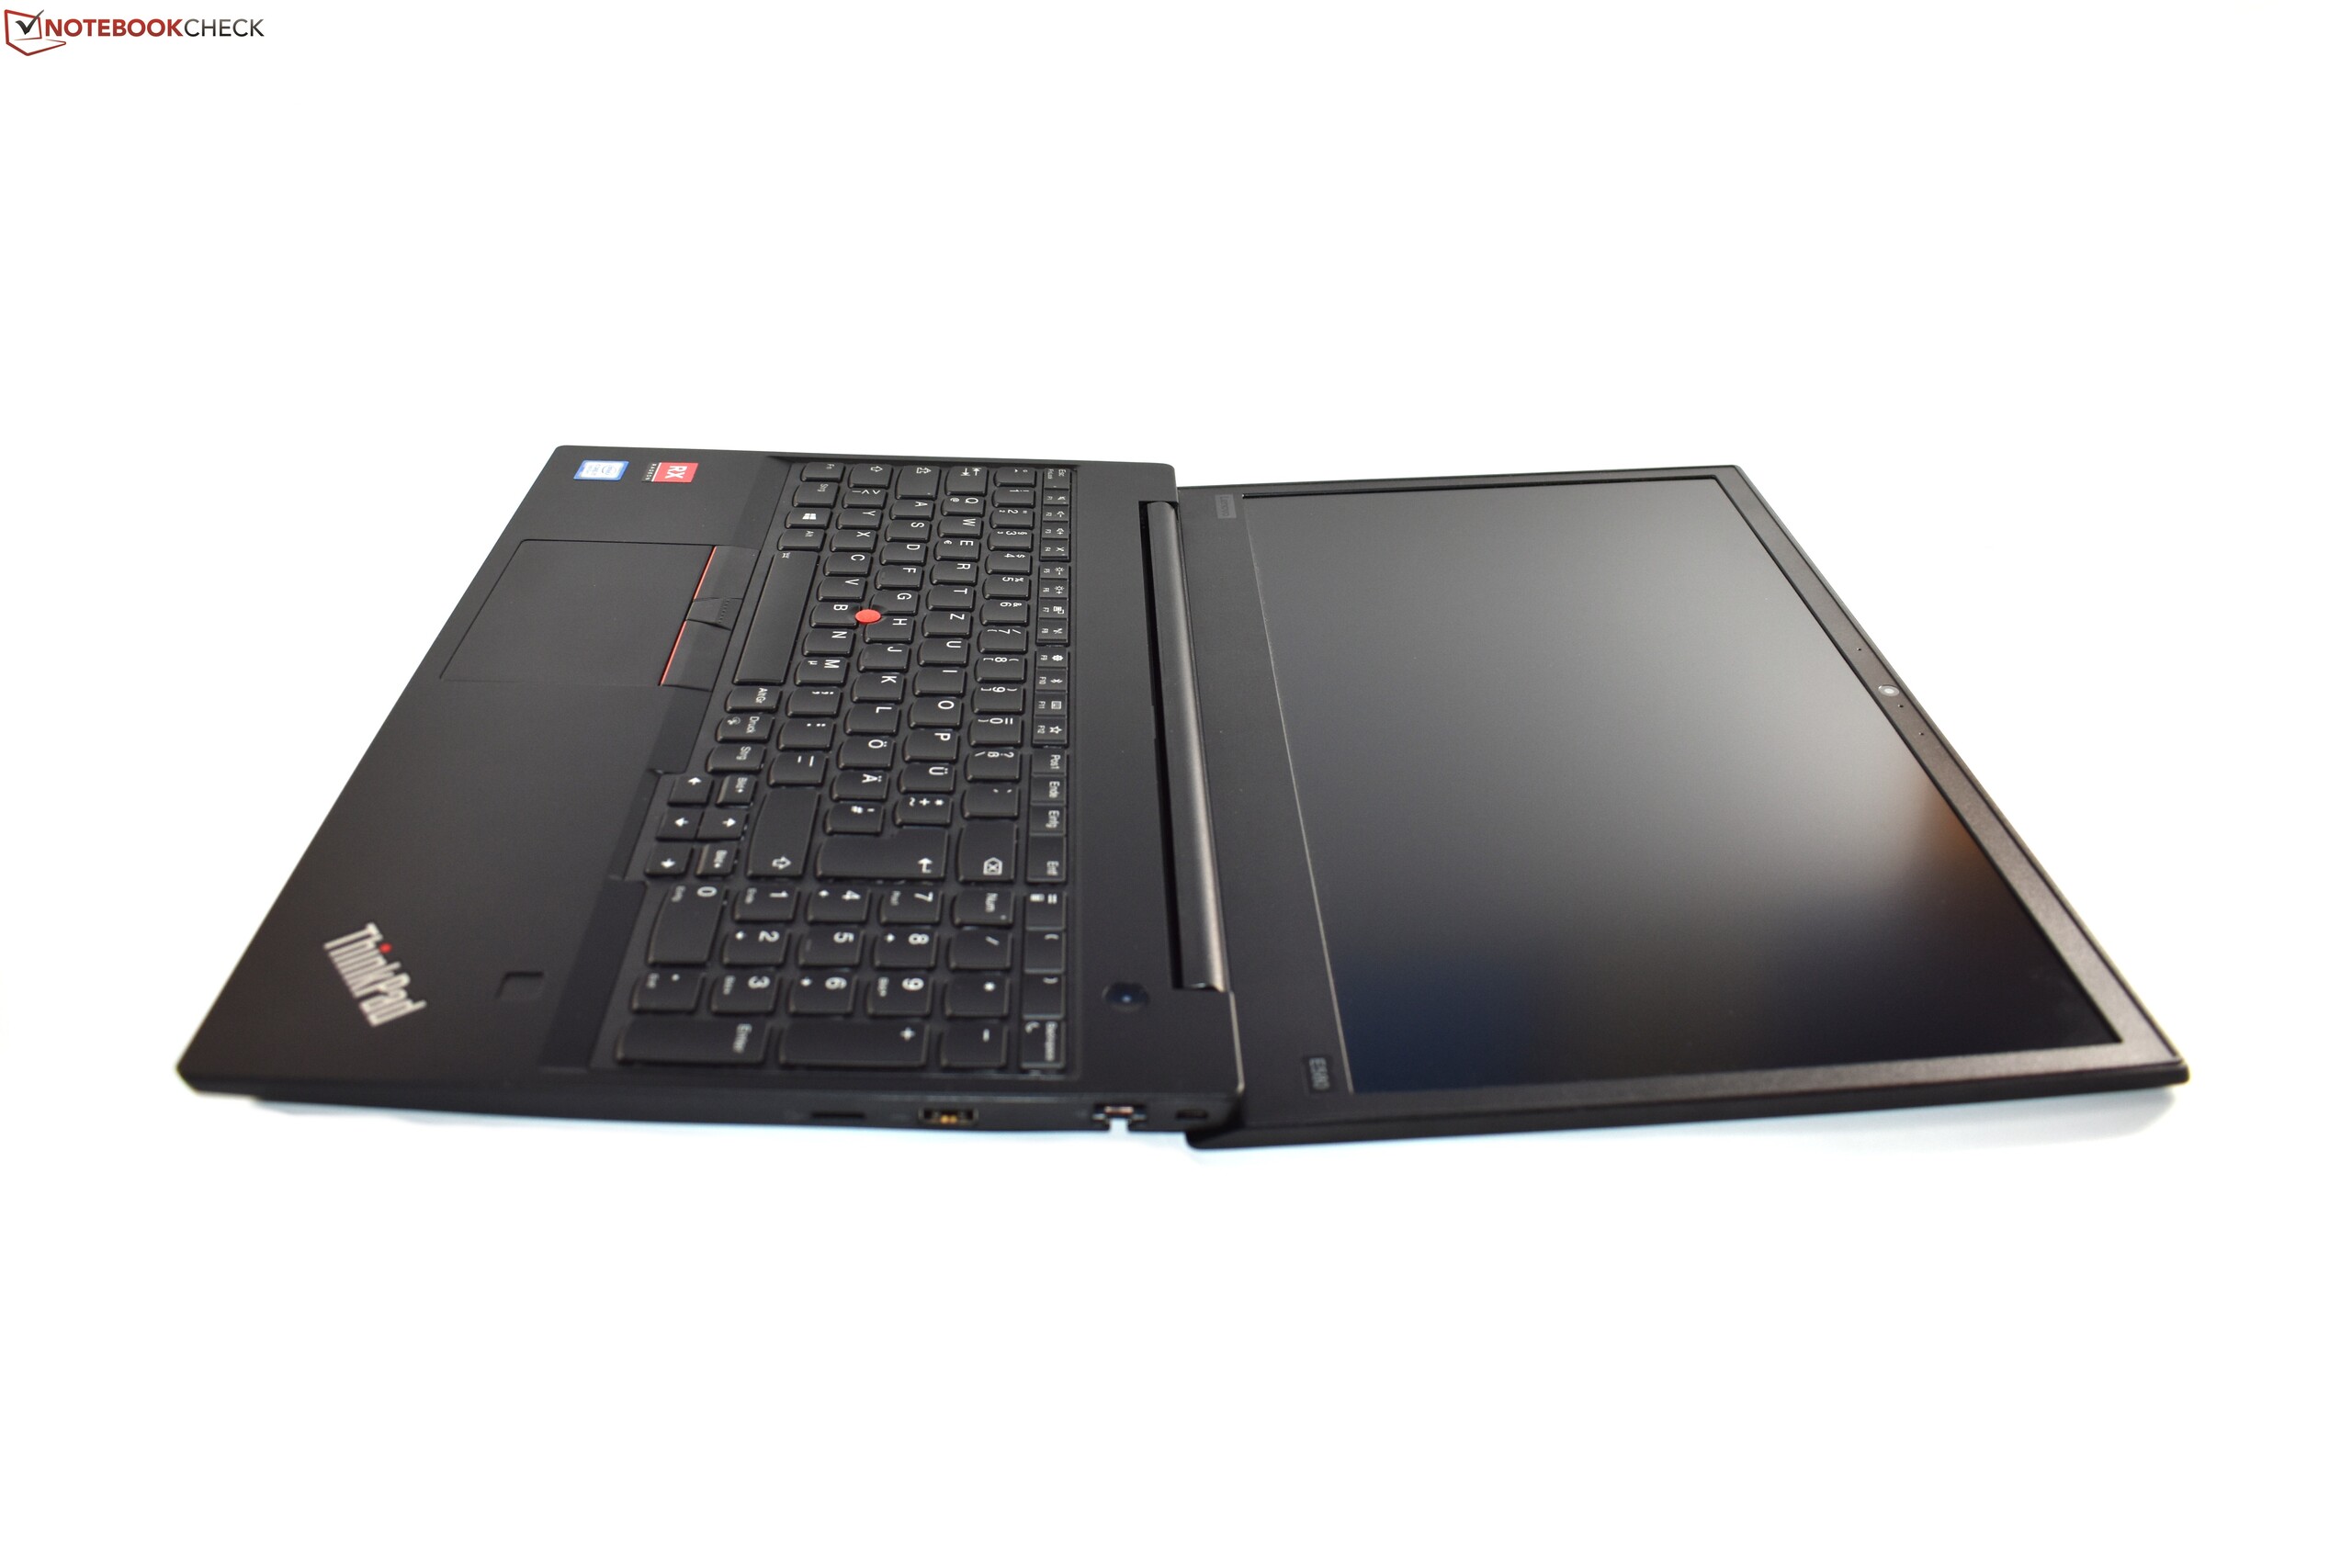
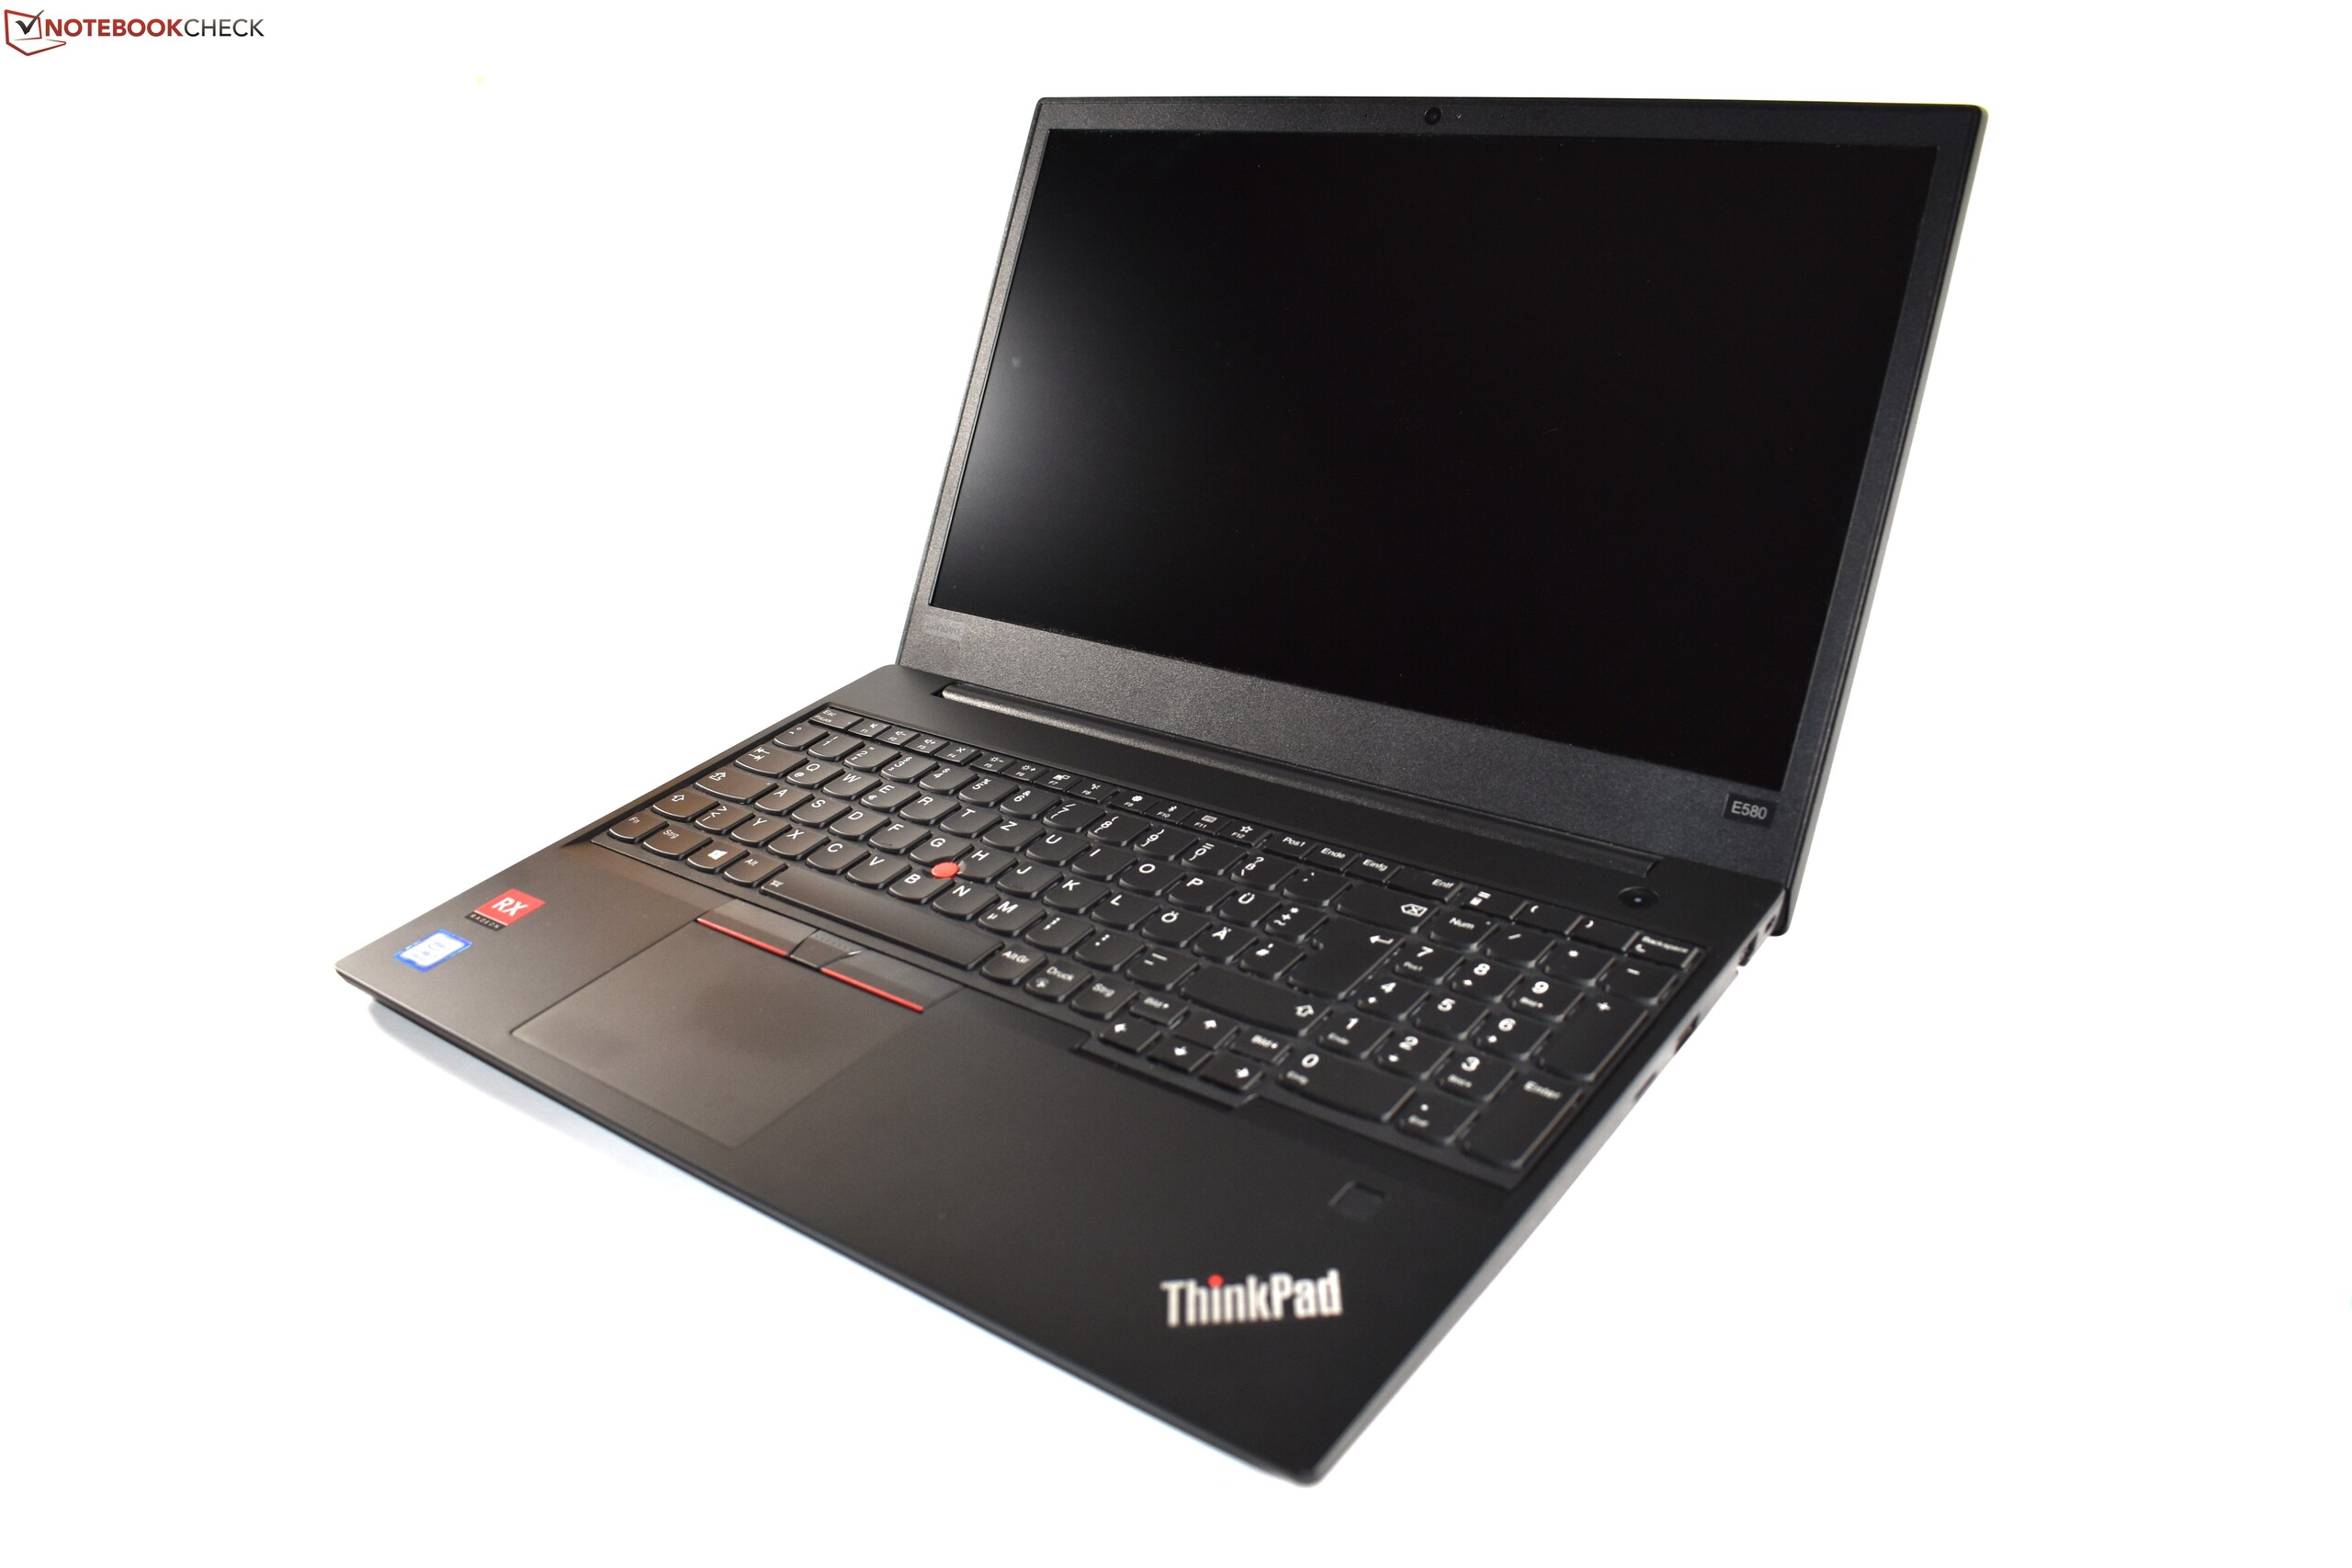
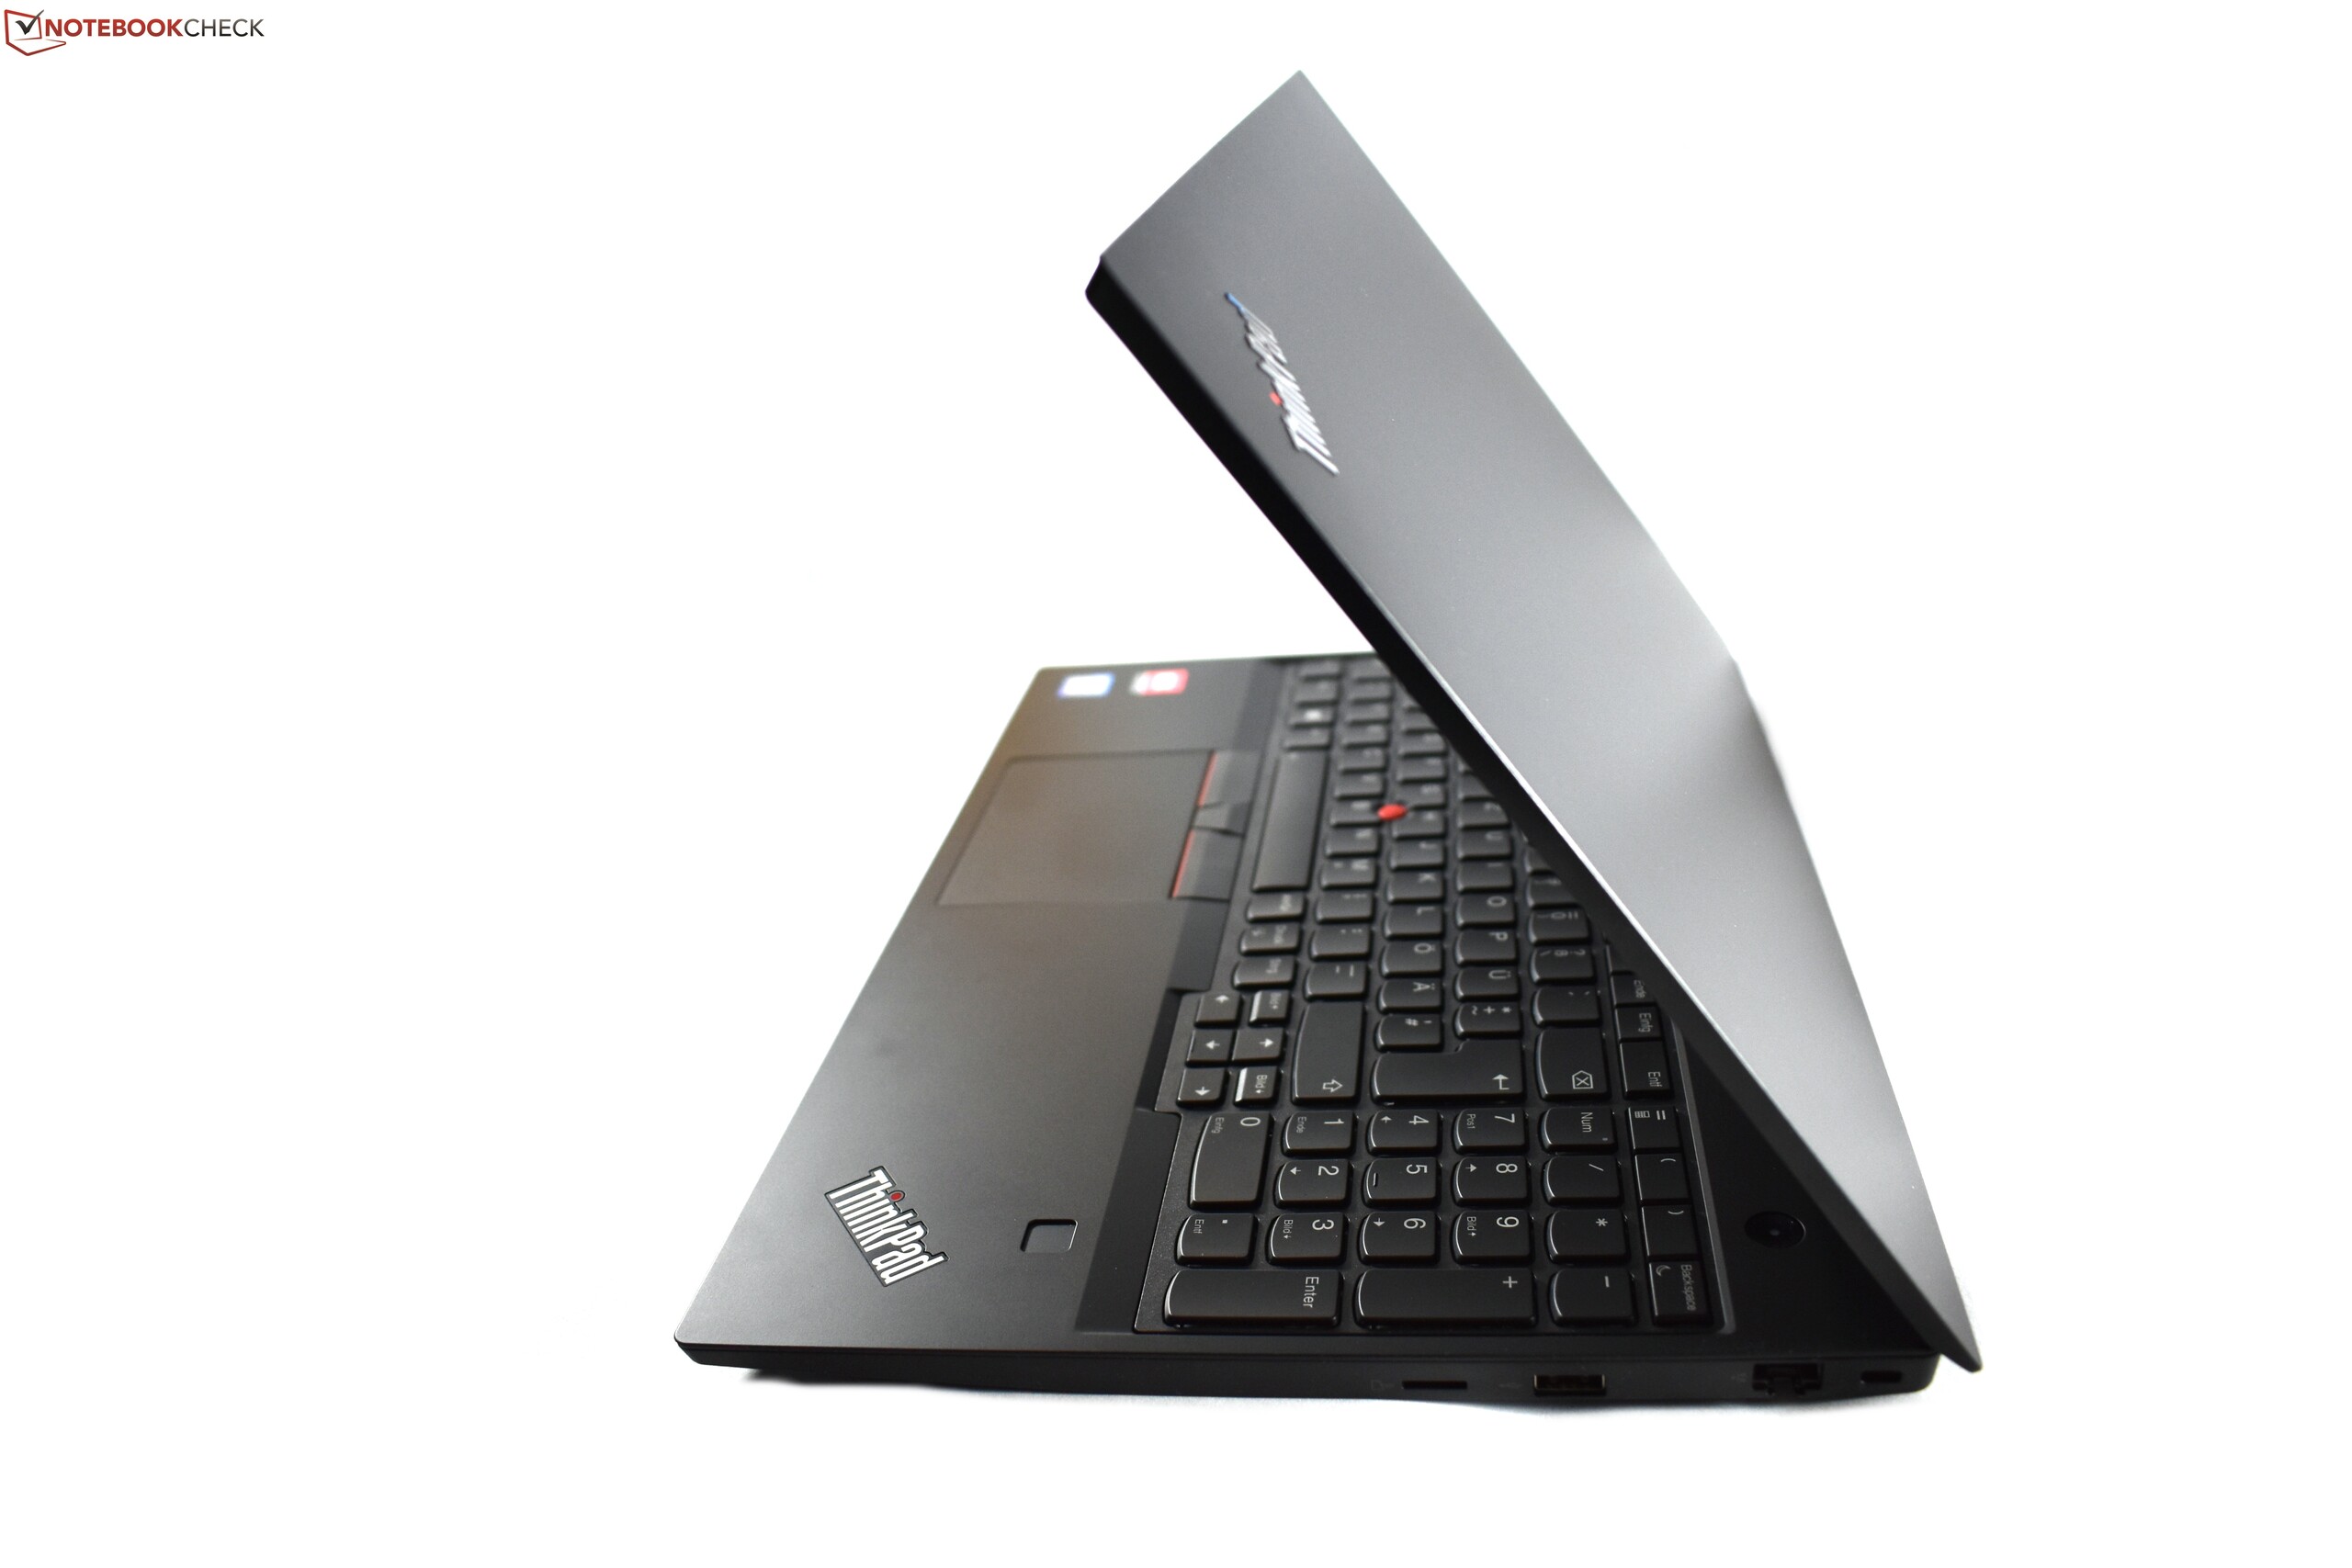
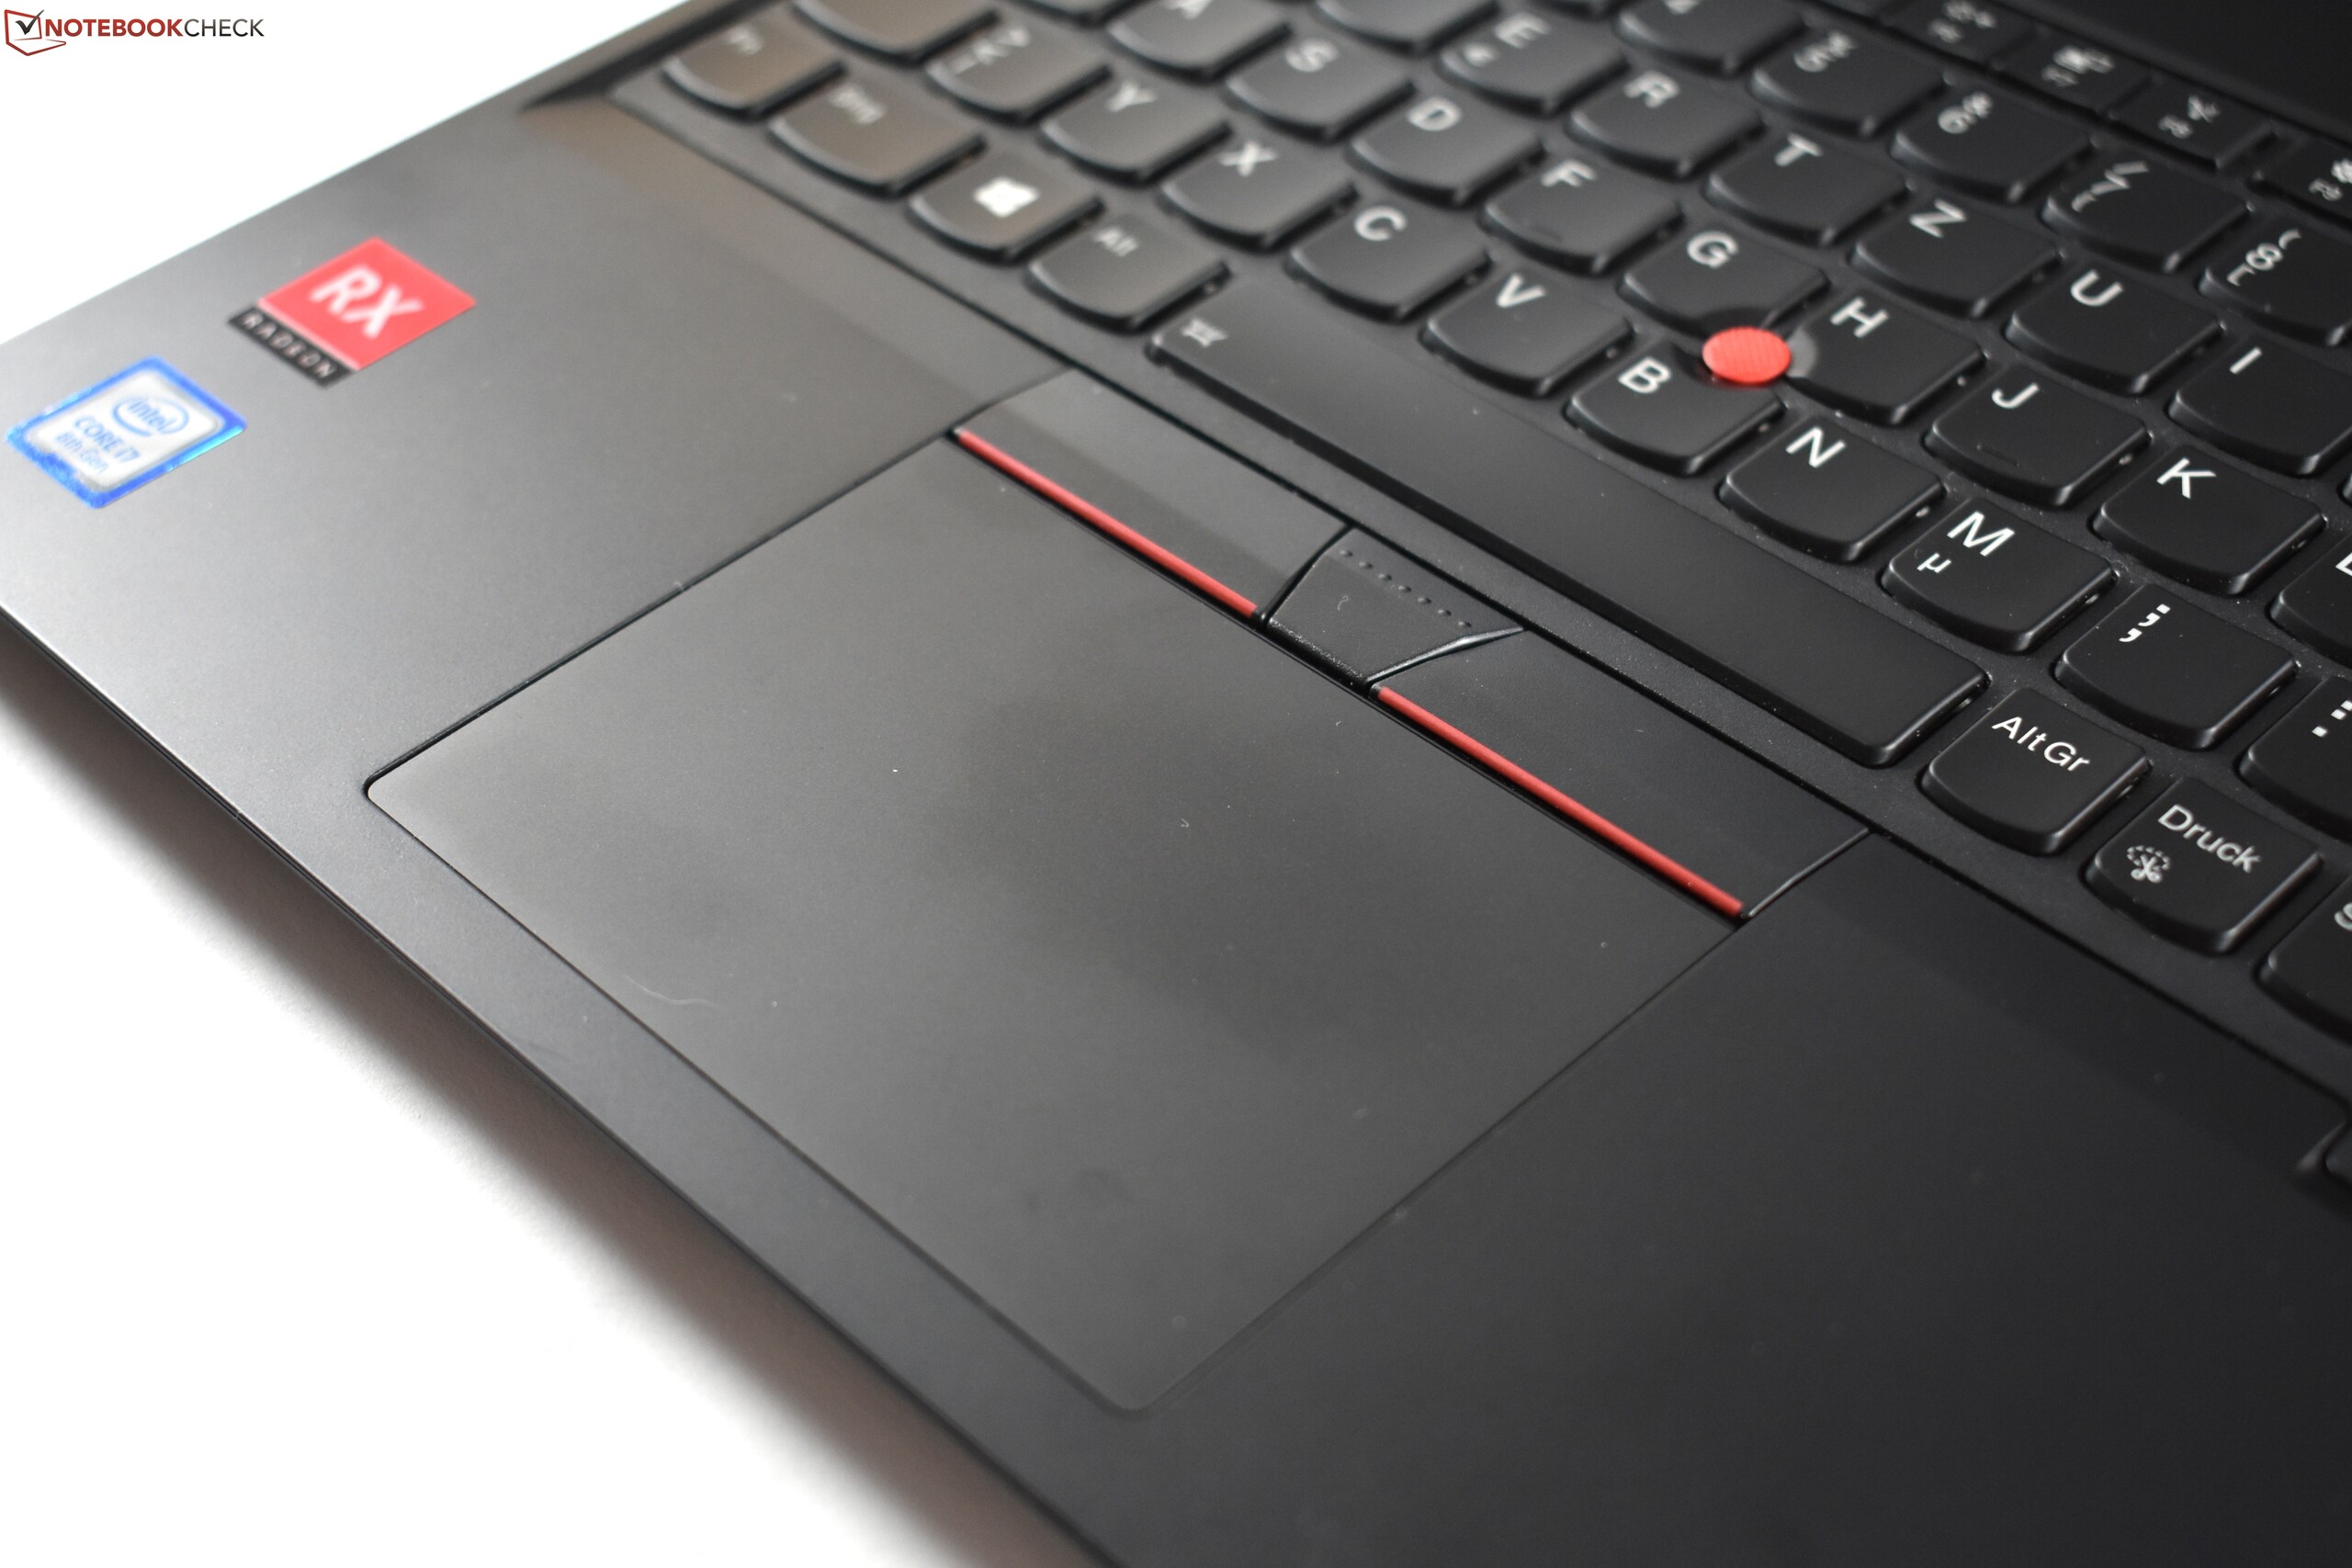
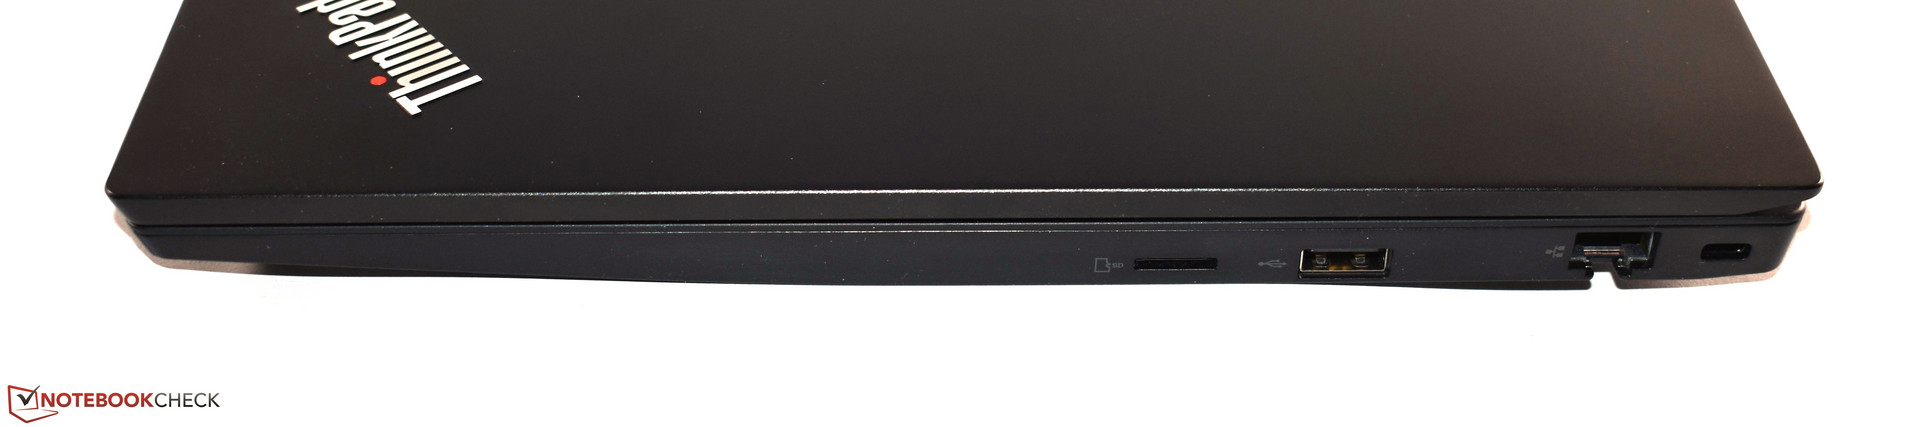
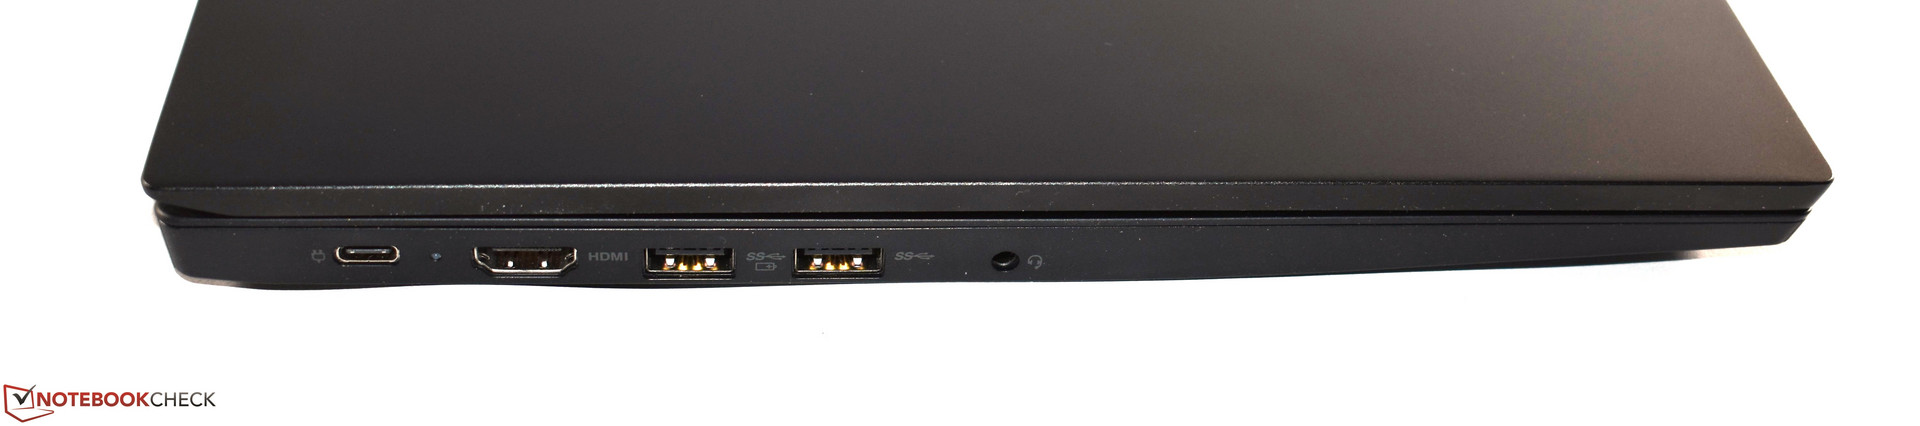
O E580 compartilha muitas das qualidades de seu irmão menor, como o excelente teclado, a combinação de TrackPoint e touchpad, sua capacidade de atualização exemplar, e sua decente tela IPS (fora a cobertura do espaço de cores). Além disso, a carcaça foi melhorada em ralação à do E570.
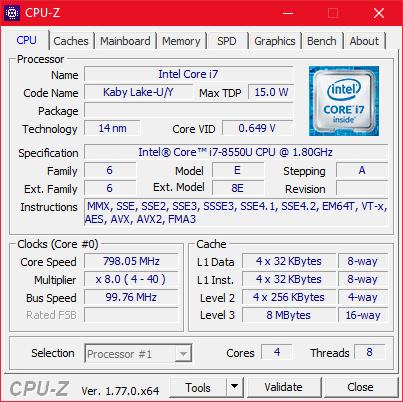
No entanto, toda moeda tem dois lados, e o E580 também compartilha muitas de suas desvantagens com o seu irmão menor. Uma das principais é o SDD bastante lento que conseguiu ser ainda mais lento. Além disso, o E580 possui um leitor microSD em vez de um leitor de cartões SD de tamanho normal, e ainda não entendemos por que a Lenovo tomou essa decisão. O gerenciamento do aquecimento é deficiente, e as temperaturas da superfície de até 60 °C (~140 °F) ainda são altas demais. Pelo menos o ventilador melhorou um pouco, o que já é um grande ponto positivo. Infelizmente, este aparente beneficio paga um preço alto: O desempenho da CPU é decepcionante, por dizer pouco. O i7-8550U nominalmente mais veloz, resultou ser mais lento que o i5-8250U do E480. Embora ainda seja muito mais veloz que a CPU dual-core do seu predecessor, atualizar o E580 do i5 para o i7 não faz sentido algum. A duração da bateria é tão medíocre quando a do E480, e a garantia do portátil se limita a 12 meses. E finalmente, descobrimos o desempenho da GPU se afogando fortemente com a bateria.
O E580 certamente esquenta menos que o seu irmão menor. Por isso, considerando a sua mais que decente relação de preço-desempenho, merece nossa recomendação.
Apesar de todos seus pontos negativos, o E580 merece nossa recomendação, no entanto, não sem uma advertência. Somente vale a pena comprar os SKUs i5, e usa-los sobre suas pernas pode se tornar um problema muito quente. Deixando os problemas de lado, o E580 é um portátil de escritório capaz de lidar com jogos, com ambições de multimídia.
Lenovo ThinkPad E580-20KS001RGE
- 02/19/2018 v6 (old)
Benjamin Herzig
Price comparison
