Breve Análise do Portátil HP ProBook 455R G6: Melhor duração de bateria graças ao Zen+
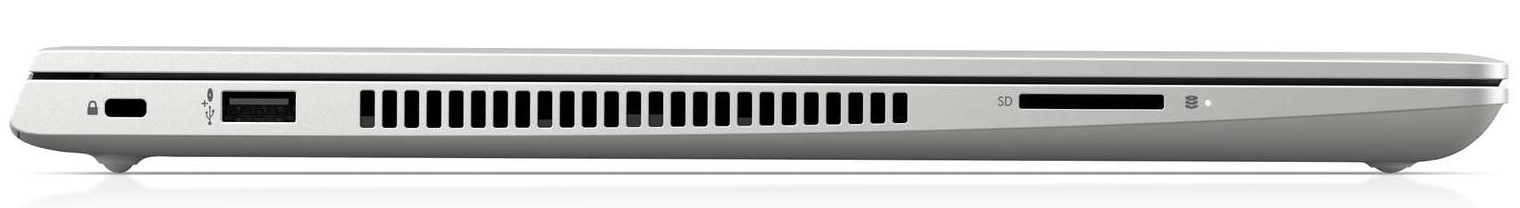
| SD Card Reader | |
| average JPG Copy Test (av. of 3 runs) | |
| HP ProBook 455R G6 (Toshiba Exceria Pro SDXC 64 GB UHS-II) | |
| HP ProBook 445 G6 (Toshiba Exceria Pro SDXC 64 GB UHS-II) | |
| Média da turma Office (22.4 - 198.5, n=21, últimos 2 anos) | |
| HP 250 G7 6HM85ES (Toshiba Exceria Pro SDXC 64 GB UHS-II) | |
| Dell Vostro 15-5581 (Toshiba Exceria Pro SDXC 64 GB UHS-II) | |
| maximum AS SSD Seq Read Test (1GB) | |
| HP ProBook 455R G6 (Toshiba Exceria Pro SDXC 64 GB UHS-II) | |
| HP ProBook 445 G6 (Toshiba Exceria Pro SDXC 64 GB UHS-II) | |
| Média da turma Office (27.4 - 249, n=20, últimos 2 anos) | |
| HP 250 G7 6HM85ES (Toshiba Exceria Pro SDXC 64 GB UHS-II) | |
| Dell Vostro 15-5581 (Toshiba Exceria Pro SDXC 64 GB UHS-II) | |
| Networking | |
| iperf3 transmit AX12 | |
| HP ProBook 455R G6 | |
| HP ProBook 445 G6 | |
| Dell Vostro 15-5581 | |
| Lenovo V155-15API | |
| HP 250 G7 6HM85ES | |
| iperf3 receive AX12 | |
| HP ProBook 455R G6 | |
| HP ProBook 445 G6 | |
| Dell Vostro 15-5581 | |
| Lenovo V155-15API | |
| HP 250 G7 6HM85ES | |
| |||||||||||||||||||||||||
iluminação: 83 %
iluminação com acumulador: 262 cd/m²
Contraste: 970:1 (Preto: 0.27 cd/m²)
ΔE ColorChecker Calman: 6.34 | ∀{0.5-29.43 Ø4.73}
calibrated: 4.82
ΔE Greyscale Calman: 4.33 | ∀{0.09-98 Ø4.97}
56% sRGB (Argyll 1.6.3 3D)
36% AdobeRGB 1998 (Argyll 1.6.3 3D)
38.71% AdobeRGB 1998 (Argyll 3D)
56.3% sRGB (Argyll 3D)
37.44% Display P3 (Argyll 3D)
Gamma: 2.06
CCT: 7041 K
| HP ProBook 455R G6 LG Philips LGD05CE, , 1920x1080, 15.6" | HP ProBook 445 G6 Chi Mei CMN14D4, , 1920x1080, 14" | Lenovo V155-15API AUO61ED, , 1920x1080, 15.6" | Dell Vostro 15-5581 156CL04 1G2XW, , 1920x1080, 15.6" | HP 250 G7 6HM85ES BOE0687, , 1920x1080, 15.6" | |
|---|---|---|---|---|---|
| Display | 11% | 2% | 4% | 6% | |
| Display P3 Coverage (%) | 37.44 | 41.53 11% | 38.14 2% | 38.86 4% | 39.61 6% |
| sRGB Coverage (%) | 56.3 | 62 10% | 57.4 2% | 58.5 4% | 59.5 6% |
| AdobeRGB 1998 Coverage (%) | 38.71 | 42.94 11% | 39.4 2% | 40.15 4% | 40.93 6% |
| Response Times | -13% | 7% | -10% | 15% | |
| Response Time Grey 50% / Grey 80% * (ms) | 34 ? | 40 ? -18% | 44 ? -29% | 36 ? -6% | 41 ? -21% |
| Response Time Black / White * (ms) | 24 ? | 26 ? -8% | 14 ? 42% | 27 ? -13% | 12 ? 50% |
| PWM Frequency (Hz) | 208 ? | 208 ? | 25000 ? | ||
| Screen | 8% | -46% | 14% | -46% | |
| Brightness middle (cd/m²) | 262 | 200 -24% | 220 -16% | 231 -12% | 205 -22% |
| Brightness (cd/m²) | 235 | 196 -17% | 200 -15% | 213 -9% | 205 -13% |
| Brightness Distribution (%) | 83 | 67 -19% | 80 -4% | 87 5% | 88 6% |
| Black Level * (cd/m²) | 0.27 | 0.17 37% | 0.355 -31% | 0.13 52% | 0.52 -93% |
| Contrast (:1) | 970 | 1176 21% | 620 -36% | 1777 83% | 394 -59% |
| Colorchecker dE 2000 * | 6.34 | 4.26 33% | 10.36 -63% | 4.81 24% | 11.15 -76% |
| Colorchecker dE 2000 max. * | 9.28 | 9.7 -5% | 18.91 -104% | 8.33 10% | 19.08 -106% |
| Colorchecker dE 2000 calibrated * | 4.82 | 4.2 13% | 2.98 38% | ||
| Greyscale dE 2000 * | 4.33 | 3.15 27% | 12.49 -188% | 5.19 -20% | 12.62 -191% |
| Gamma | 2.06 107% | 2.31 95% | 2.3 96% | 2.33 94% | 2.38 92% |
| CCT | 7041 92% | 6882 94% | 12808 51% | 7088 92% | 14189 46% |
| Color Space (Percent of AdobeRGB 1998) (%) | 36 | 40 11% | 36 0% | 37 3% | 38 6% |
| Color Space (Percent of sRGB) (%) | 56 | 62 11% | 57 2% | 58 4% | 59 5% |
| Média Total (Programa/Configurações) | 2% /
5% | -12% /
-29% | 3% /
9% | -8% /
-29% |
* ... menor é melhor
Exibir tempos de resposta
| ↔ Tempo de resposta preto para branco | ||
|---|---|---|
| 24 ms ... ascensão ↗ e queda ↘ combinadas | ↗ 14 ms ascensão | 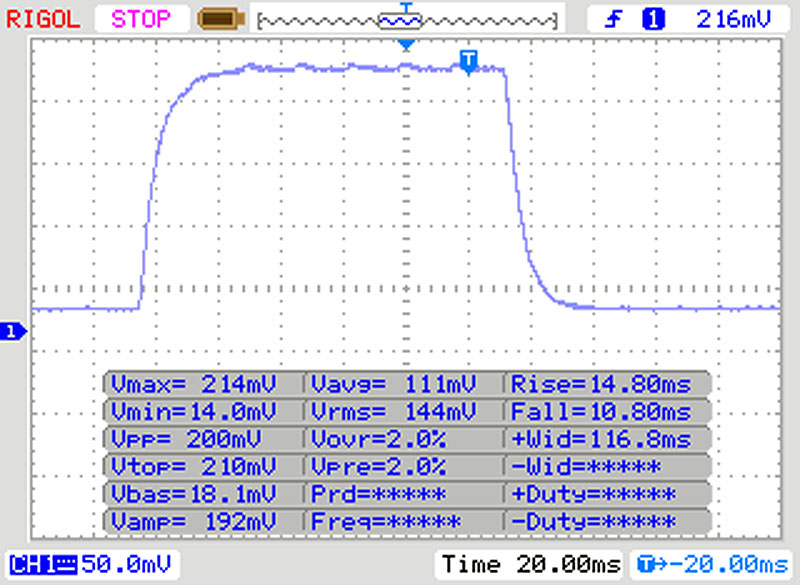 |
| ↘ 10 ms queda | ||
| A tela mostra boas taxas de resposta em nossos testes, mas pode ser muito lenta para jogadores competitivos. Em comparação, todos os dispositivos testados variam de 0.1 (mínimo) a 240 (máximo) ms. » 54 % de todos os dispositivos são melhores. Isso significa que o tempo de resposta medido é pior que a média de todos os dispositivos testados (19.9 ms). | ||
| ↔ Tempo de resposta 50% cinza a 80% cinza | ||
| 34 ms ... ascensão ↗ e queda ↘ combinadas | ↗ 18 ms ascensão | 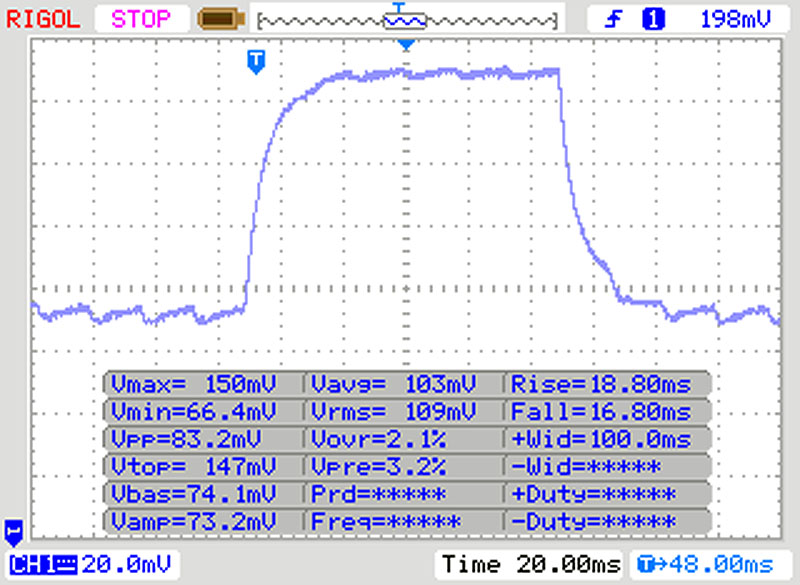 |
| ↘ 16 ms queda | ||
| A tela mostra taxas de resposta lentas em nossos testes e será insatisfatória para os jogadores. Em comparação, todos os dispositivos testados variam de 0.165 (mínimo) a 636 (máximo) ms. » 47 % de todos os dispositivos são melhores. Isso significa que o tempo de resposta medido é semelhante à média de todos os dispositivos testados (31.1 ms). | ||
Cintilação da tela / PWM (modulação por largura de pulso)
| Tela tremeluzindo / PWM não detectado | 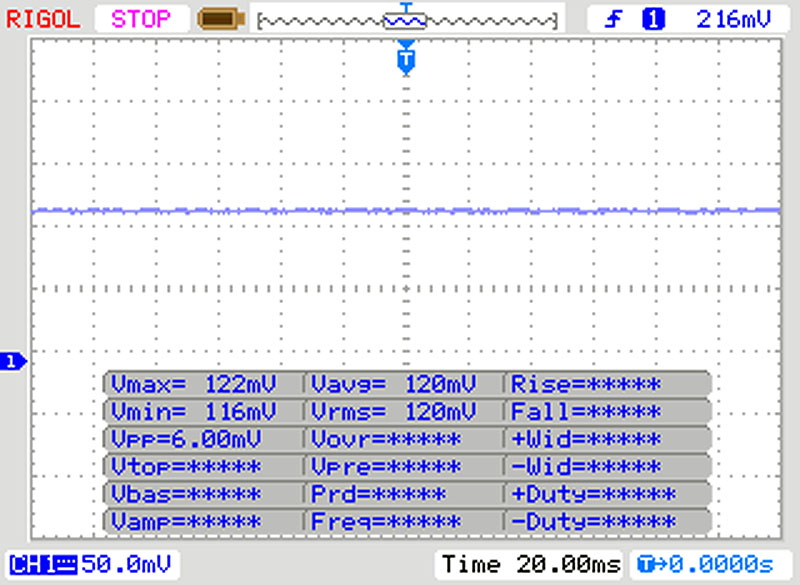 | ||
[pwm_comparison] Em comparação: 52 % de todos os dispositivos testados não usam PWM para escurecer a tela. Se PWM foi detectado, uma média de 7794 (mínimo: 5 - máximo: 343500) Hz foi medida. | |||
| Cinebench R15 | |
| CPU Single 64Bit | |
| Média da turma Office (99.5 - 312, n=74, últimos 2 anos) | |
| HP 250 G7 6HM85ES | |
| Lenovo V155-15API | |
| Média AMD Ryzen 5 3500U (131 - 147, n=18) | |
| HP ProBook 455R G6 | |
| HP ProBook 445 G6 | |
| Dell Vostro 15-5581 | |
| CPU Multi 64Bit | |
| Média da turma Office (250 - 3380, n=74, últimos 2 anos) | |
| HP ProBook 455R G6 | |
| Lenovo V155-15API | |
| Média AMD Ryzen 5 3500U (482 - 682, n=19) | |
| Dell Vostro 15-5581 | |
| HP ProBook 445 G6 | |
| HP 250 G7 6HM85ES | |
| PCMark 10 | |
| Score | |
| Média da turma Office (2601 - 9298, n=63, últimos 2 anos) | |
| Média AMD Ryzen 5 3500U, AMD Radeon RX Vega 8 (Ryzen 2000/3000) (3485 - 3972, n=16) | |
| Lenovo V155-15API | |
| HP ProBook 455R G6 | |
| HP 250 G7 6HM85ES | |
| HP ProBook 445 G6 | |
| Dell Vostro 15-5581 | |
| Essentials | |
| Média da turma Office (3245 - 11594, n=63, últimos 2 anos) | |
| HP 250 G7 6HM85ES | |
| Dell Vostro 15-5581 | |
| Média AMD Ryzen 5 3500U, AMD Radeon RX Vega 8 (Ryzen 2000/3000) (6690 - 8300, n=16) | |
| Lenovo V155-15API | |
| HP ProBook 455R G6 | |
| HP ProBook 445 G6 | |
| Productivity | |
| Média da turma Office (5336 - 17243, n=63, últimos 2 anos) | |
| HP 250 G7 6HM85ES | |
| HP ProBook 455R G6 | |
| Média AMD Ryzen 5 3500U, AMD Radeon RX Vega 8 (Ryzen 2000/3000) (5456 - 6074, n=16) | |
| Lenovo V155-15API | |
| HP ProBook 445 G6 | |
| Dell Vostro 15-5581 | |
| Digital Content Creation | |
| Média da turma Office (2049 - 13541, n=63, últimos 2 anos) | |
| Lenovo V155-15API | |
| Média AMD Ryzen 5 3500U, AMD Radeon RX Vega 8 (Ryzen 2000/3000) (2989 - 3526, n=16) | |
| HP ProBook 455R G6 | |
| HP ProBook 445 G6 | |
| HP 250 G7 6HM85ES | |
| Dell Vostro 15-5581 | |
| PCMark 8 | |
| Home Score Accelerated v2 | |
| Média da turma Office (n=1últimos 2 anos) | |
| Dell Vostro 15-5581 | |
| Média AMD Ryzen 5 3500U, AMD Radeon RX Vega 8 (Ryzen 2000/3000) (3316 - 4235, n=13) | |
| Lenovo V155-15API | |
| HP ProBook 455R G6 | |
| HP 250 G7 6HM85ES | |
| HP ProBook 445 G6 | |
| Work Score Accelerated v2 | |
| Média da turma Office (n=1últimos 2 anos) | |
| Dell Vostro 15-5581 | |
| Média AMD Ryzen 5 3500U, AMD Radeon RX Vega 8 (Ryzen 2000/3000) (4436 - 5039, n=12) | |
| HP ProBook 455R G6 | |
| HP 250 G7 6HM85ES | |
| HP ProBook 445 G6 | |
| PCMark 8 Home Score Accelerated v2 | 3316 pontos | |
| PCMark 8 Work Score Accelerated v2 | 4559 pontos | |
| PCMark 10 Score | 3691 pontos | |
Ajuda | ||
| HP ProBook 455R G6 SK hynix BC501 HFM256GDHTNG | HP ProBook 445 G6 SK Hynix BC501 NVMe 256 GB | Lenovo V155-15API Union Memory RTOTJ128VGD3EYX | Dell Vostro 15-5581 SK hynix BC501 HFM128GDJTNG-831 | HP 250 G7 6HM85ES WDC PC SN520 SDAPNUW-512G | Média SK hynix BC501 HFM256GDHTNG | |
|---|---|---|---|---|---|---|
| CrystalDiskMark 5.2 / 6 | -2% | -58% | -31% | 43% | -1% | |
| Write 4K (MB/s) | 126.4 | 110.4 -13% | 72.4 -43% | 129.3 2% | 179.3 42% | 116.4 ? -8% |
| Read 4K (MB/s) | 40.45 | 39.46 -2% | 27.84 -31% | 41.02 1% | 47.7 18% | 40.1 ? -1% |
| Write Seq (MB/s) | 702 | 808 15% | 145.1 -79% | 203.4 -71% | 1265 80% | 773 ? 10% |
| Read Seq (MB/s) | 1129 | 1130 0% | 496 -56% | 271.2 -76% | 1184 5% | 1099 ? -3% |
| Write 4K Q32T1 (MB/s) | 298.6 | 260.8 -13% | 129.6 -57% | 252.3 -16% | 450.6 51% | 290 ? -3% |
| Read 4K Q32T1 (MB/s) | 344 | 308 -10% | 200.9 -42% | 281.4 -18% | 556 62% | 342 ? -1% |
| Write Seq Q32T1 (MB/s) | 801 | 816 2% | 146.4 -82% | 319.8 -60% | 1455 82% | 818 ? 2% |
| Read Seq Q32T1 (MB/s) | 1723 | 1783 3% | 522 -70% | 1589 -8% | 1717 0% | 1648 ? -4% |
| AS SSD | 9% | -82% | -26% | 85% | 1% | |
| Seq Read (MB/s) | 1503 | 1546 3% | 480.8 -68% | 1195 -20% | 1477 -2% | 1384 ? -8% |
| Seq Write (MB/s) | 712 | 708 -1% | 135.8 -81% | 370.2 -48% | 1339 88% | 635 ? -11% |
| 4K Read (MB/s) | 36.63 | 34.12 -7% | 23.55 -36% | 39.14 7% | 46.26 26% | 38.2 ? 4% |
| 4K Write (MB/s) | 89.3 | 76.7 -14% | 47.43 -47% | 115.5 29% | 143.9 61% | 90.5 ? 1% |
| 4K-64 Read (MB/s) | 524 | 528 1% | 186.5 -64% | 257.9 -51% | 937 79% | 520 ? -1% |
| 4K-64 Write (MB/s) | 334.3 | 588 76% | 86.8 -74% | 166.2 -50% | 1190 256% | 381 ? 14% |
| Access Time Read * (ms) | 0.057 | 0.062 -9% | 0.118 -107% | 0.073 -28% | 0.046 19% | 0.05675 ? -0% |
| Access Time Write * (ms) | 0.041 | 0.048 -17% | 0.132 -222% | 0.045 -10% | 0.024 41% | 0.04 ? 2% |
| Score Read (Points) | 711 | 717 1% | 258 -64% | 417 -41% | 1131 59% | 696 ? -2% |
| Score Write (Points) | 495 | 735 48% | 148 -70% | 319 -36% | 1468 197% | 535 ? 8% |
| Score Total (Points) | 1540 | 1785 16% | 529 -66% | 922 -40% | 3181 107% | 1561 ? 1% |
| Copy ISO MB/s (MB/s) | 576 | 765 | 633 ? | |||
| Copy Program MB/s (MB/s) | 159.8 | 239.9 | 192.7 ? | |||
| Copy Game MB/s (MB/s) | 330.8 | 528 | 393 ? | |||
| Média Total (Programa/Configurações) | 4% /
4% | -70% /
-72% | -29% /
-28% | 64% /
67% | 0% /
0% |
* ... menor é melhor

| 3DMark 11 - 1280x720 Performance GPU | |
| Média da turma Office (2551 - 18313, n=68, últimos 2 anos) | |
| Lenovo V155-15API | |
| Média AMD Radeon RX Vega 8 (Ryzen 2000/3000) (1668 - 4317, n=44) | |
| HP ProBook 445 G6 | |
| HP ProBook 455R G6 | |
| Dell Vostro 15-5581 | |
| HP 250 G7 6HM85ES | |
| 3DMark | |
| 1280x720 Cloud Gate Standard Graphics | |
| Média da turma Office (11640 - 118515, n=37, últimos 2 anos) | |
| Média AMD Radeon RX Vega 8 (Ryzen 2000/3000) (7309 - 19399, n=37) | |
| HP ProBook 445 G6 | |
| Dell Vostro 15-5581 | |
| HP ProBook 455R G6 | |
| HP 250 G7 6HM85ES | |
| 1920x1080 Fire Strike Graphics | |
| Média da turma Office (736 - 21871, n=72, últimos 2 anos) | |
| Dell Vostro 15-5581 | |
| Média AMD Radeon RX Vega 8 (Ryzen 2000/3000) (1095 - 2901, n=41) | |
| HP ProBook 445 G6 | |
| HP ProBook 455R G6 | |
| HP 250 G7 6HM85ES | |
| 3DMark 11 Performance | 3102 pontos | |
| 3DMark Cloud Gate Standard Score | 10100 pontos | |
| 3DMark Fire Strike Score | 1693 pontos | |
Ajuda | ||
| BioShock Infinite | |
| 1280x720 Very Low Preset | |
| Média AMD Radeon RX Vega 8 (Ryzen 2000/3000) (68.9 - 122.8, n=29) | |
| HP ProBook 445 G6 | |
| Dell Vostro 15-5581 | |
| HP ProBook 455R G6 | |
| HP 250 G7 6HM85ES | |
| 1366x768 Medium Preset | |
| Média AMD Radeon RX Vega 8 (Ryzen 2000/3000) (50.2 - 83, n=15) | |
| Dell Vostro 15-5581 | |
| HP ProBook 445 G6 | |
| HP ProBook 455R G6 | |
| HP 250 G7 6HM85ES | |
| 1366x768 High Preset | |
| Média AMD Radeon RX Vega 8 (Ryzen 2000/3000) (17.2 - 68, n=16) | |
| Dell Vostro 15-5581 | |
| HP ProBook 445 G6 | |
| HP ProBook 455R G6 | |
| HP 250 G7 6HM85ES | |
| 1920x1080 Ultra Preset, DX11 (DDOF) | |
| Dell Vostro 15-5581 | |
| Média AMD Radeon RX Vega 8 (Ryzen 2000/3000) (7.6 - 28, n=30) | |
| HP ProBook 455R G6 | |
| HP ProBook 445 G6 | |
| HP 250 G7 6HM85ES | |
| Dota 2 Reborn | |
| 1280x720 min (0/3) fastest | |
| Média da turma Office (32.2 - 171.3, n=73, últimos 2 anos) | |
| Lenovo V155-15API | |
| Média AMD Radeon RX Vega 8 (Ryzen 2000/3000) (56.2 - 97.2, n=29) | |
| HP ProBook 455R G6 | |
| 1366x768 med (1/3) | |
| Média da turma Office (31.2 - 152, n=73, últimos 2 anos) | |
| Lenovo V155-15API | |
| Média AMD Radeon RX Vega 8 (Ryzen 2000/3000) (39.9 - 76.3, n=29) | |
| HP ProBook 455R G6 | |
| 1920x1080 high (2/3) | |
| Média da turma Office (16.2 - 143.3, n=73, últimos 2 anos) | |
| Lenovo V155-15API | |
| Média AMD Radeon RX Vega 8 (Ryzen 2000/3000) (20.4 - 47.8, n=29) | |
| HP ProBook 455R G6 | |
| 1920x1080 ultra (3/3) best looking | |
| Média da turma Office (14.6 - 135, n=73, últimos 2 anos) | |
| Lenovo V155-15API | |
| Média AMD Radeon RX Vega 8 (Ryzen 2000/3000) (18.8 - 44.8, n=29) | |
| HP ProBook 455R G6 | |
| Rise of the Tomb Raider | |
| 1024x768 Lowest Preset | |
| Média AMD Radeon RX Vega 8 (Ryzen 2000/3000) (27.7 - 49.3, n=10) | |
| HP ProBook 455R G6 | |
| HP 250 G7 6HM85ES | |
| 1366x768 Medium Preset AF:2x | |
| Média AMD Radeon RX Vega 8 (Ryzen 2000/3000) (19.6 - 26.8, n=3) | |
| HP ProBook 455R G6 | |
| HP 250 G7 6HM85ES | |
| 1920x1080 High Preset AA:FX AF:4x | |
| Média AMD Radeon RX Vega 8 (Ryzen 2000/3000) (5.9 - 15.4, n=11) | |
| HP ProBook 455R G6 | |
| baixo | média | alto | ultra | |
|---|---|---|---|---|
| BioShock Infinite (2013) | 82.7 | 50.2 | 39.38 | 14.03 |
| Dota 2 Reborn (2015) | 64.9 | 50.1 | 26.9 | 24.7 |
| Rise of the Tomb Raider (2016) | 35.1 | 21.7 | 11.1 |
Barulho
| Ocioso |
| 30 / 30 / 30 dB |
| Carga |
| 34.5 / 37.3 dB |
 | ||
30 dB silencioso 40 dB(A) audível 50 dB(A) ruidosamente alto |
||
min: | ||
(±) A temperatura máxima no lado superior é 40.1 °C / 104 F, em comparação com a média de 34.3 °C / 94 F , variando de 21.2 a 62.5 °C para a classe Office.
(±) A parte inferior aquece até um máximo de 43.3 °C / 110 F, em comparação com a média de 36.8 °C / 98 F
(+) Em uso inativo, a temperatura média para o lado superior é 26.6 °C / 80 F, em comparação com a média do dispositivo de 29.5 °C / ### class_avg_f### F.
(+) Os apoios para as mãos e o touchpad estão atingindo a temperatura máxima da pele (32.7 °C / 90.9 F) e, portanto, não estão quentes.
(-) A temperatura média da área do apoio para as mãos de dispositivos semelhantes foi 27.5 °C / 81.5 F (-5.2 °C / -9.4 F).
HP ProBook 455R G6 análise de áudio
(-) | alto-falantes não muito altos (###valor### dB)
Graves 100 - 315Hz
(-) | quase nenhum baixo - em média 23.6% menor que a mediana
(±) | a linearidade dos graves é média (13.9% delta para a frequência anterior)
Médios 400 - 2.000 Hz
(+) | médios equilibrados - apenas 2.9% longe da mediana
(±) | a linearidade dos médios é média (10.3% delta para frequência anterior)
Altos 2 - 16 kHz
(+) | agudos equilibrados - apenas 4.9% longe da mediana
(+) | os máximos são lineares (3.8% delta da frequência anterior)
Geral 100 - 16.000 Hz
(±) | a linearidade do som geral é média (21.2% diferença em relação à mediana)
Comparado com a mesma classe
» 51% de todos os dispositivos testados nesta classe foram melhores, 9% semelhantes, 40% piores
» O melhor teve um delta de 7%, a média foi 21%, o pior foi 53%
Comparado com todos os dispositivos testados
» 59% de todos os dispositivos testados foram melhores, 7% semelhantes, 34% piores
» O melhor teve um delta de 4%, a média foi 24%, o pior foi 134%
Apple MacBook 12 (Early 2016) 1.1 GHz análise de áudio
(+) | os alto-falantes podem tocar relativamente alto (###valor### dB)
Graves 100 - 315Hz
(±) | graves reduzidos - em média 11.3% menor que a mediana
(±) | a linearidade dos graves é média (14.2% delta para a frequência anterior)
Médios 400 - 2.000 Hz
(+) | médios equilibrados - apenas 2.4% longe da mediana
(+) | médios são lineares (5.5% delta para frequência anterior)
Altos 2 - 16 kHz
(+) | agudos equilibrados - apenas 2% longe da mediana
(+) | os máximos são lineares (4.5% delta da frequência anterior)
Geral 100 - 16.000 Hz
(+) | o som geral é linear (10.2% diferença em relação à mediana)
Comparado com a mesma classe
» 7% de todos os dispositivos testados nesta classe foram melhores, 2% semelhantes, 91% piores
» O melhor teve um delta de 5%, a média foi 18%, o pior foi 53%
Comparado com todos os dispositivos testados
» 5% de todos os dispositivos testados foram melhores, 1% semelhantes, 94% piores
» O melhor teve um delta de 4%, a média foi 24%, o pior foi 134%
| desligado | |
| Ocioso | |
| Carga |
|
Key:
min: | |
| HP ProBook 455R G6 R5 3500U, Vega 8, SK hynix BC501 HFM256GDHTNG, IPS, 1920x1080, 15.6" | HP ProBook 445 G6 R5 2500U, Vega 8, SK Hynix BC501 NVMe 256 GB, IPS, 1920x1080, 14" | Lenovo V155-15API R5 3500U, Vega 8, Union Memory RTOTJ128VGD3EYX, TN, 1920x1080, 15.6" | Dell Vostro 15-5581 i5-8265U, GeForce MX130, SK hynix BC501 HFM128GDJTNG-831, IPS, 1920x1080, 15.6" | HP 250 G7 6HM85ES i5-8265U, UHD Graphics 620, WDC PC SN520 SDAPNUW-512G, TN, 1920x1080, 15.6" | Média AMD Radeon RX Vega 8 (Ryzen 2000/3000) | Média da turma Office | |
|---|---|---|---|---|---|---|---|
| Power Consumption | 2% | -1% | -9% | 18% | -12% | -13% | |
| Idle Minimum * (Watt) | 4.8 | 4.8 -0% | 4.7 2% | 5 -4% | 3.2 33% | 5.68 ? -18% | 4.44 ? 7% |
| Idle Average * (Watt) | 7.6 | 6.9 9% | 7.4 3% | 7.9 -4% | 5.7 25% | 8.75 ? -15% | 7.38 ? 3% |
| Idle Maximum * (Watt) | 10.9 | 9.8 10% | 8 27% | 11.2 -3% | 6.1 44% | 10.1 ? 7% | 8.59 ? 21% |
| Load Average * (Watt) | 30.2 | 35 -16% | 40.7 -35% | 34 -13% | 36.5 -21% | 37.8 ? -25% | 43 ? -42% |
| Load Maximum * (Watt) | 42.2 | 39.7 6% | 42 -0% | 50.2 -19% | 37.5 11% | 46.2 ? -9% | 64.5 ? -53% |
* ... menor é melhor
| HP ProBook 455R G6 R5 3500U, Vega 8, 45 Wh | HP ProBook 445 G6 R5 2500U, Vega 8, 45 Wh | Lenovo V155-15API R5 3500U, Vega 8, 36 Wh | Dell Vostro 15-5581 i5-8265U, GeForce MX130, 42 Wh | HP 250 G7 6HM85ES i5-8265U, UHD Graphics 620, 41 Wh | Média da turma Office | |
|---|---|---|---|---|---|---|
| Duração da bateria | 1% | -39% | 12% | 11% | 86% | |
| Reader / Idle (h) | 8.8 | 10.4 18% | 12.5 42% | 13.9 58% | 23.7 ? 169% | |
| WiFi v1.3 (h) | 7.7 | 5.9 -23% | 4.7 -39% | 6.8 -12% | 5.7 -26% | 12.9 ? 68% |
| Load (h) | 1.5 | 1.6 7% | 1.6 7% | 1.5 0% | 1.807 ? 20% |
Pro
Contra
Veredicto - Uma atualização interna

A atualização da arquitetura Zen+ trouxe muitas melhorias, inclusive o desempenho multi-core. A duração da bateria também melhorou, apesar do ProBook 455R G6 manter a mesma bateria que seu antecessor. No entanto, recomendamos atualizar a RAM para ativar o modo de canal duplo, pois isso permitirá que o dispositivo faça pleno uso de sua GPU.
A atualização para a arquitetura Zen+ melhorou a duração da bateria e o desempenho, tornando o ProBook 455R G6 uma atualização digna em relação ao seu antecessor.
No entanto, nossa unidade de teste não consegue tirar o melhor proveito de seu processador AMD, especialmente quando sob carga sustentada. Além disso, embora a tela seja boa o suficiente para um portátil de escritório, teríamos preferido ver um painel mais brilhante. Da mesma forma, a garantia de 12 meses também parece um pouco mesquinha. No geral, estamos dispostos a ignorar essas deficiências, considerando o quão barato é o ProBook 455R G6.
HP ProBook 455R G6
- 09/22/2019 v7 (old)
Mike Wobker
Price comparison
