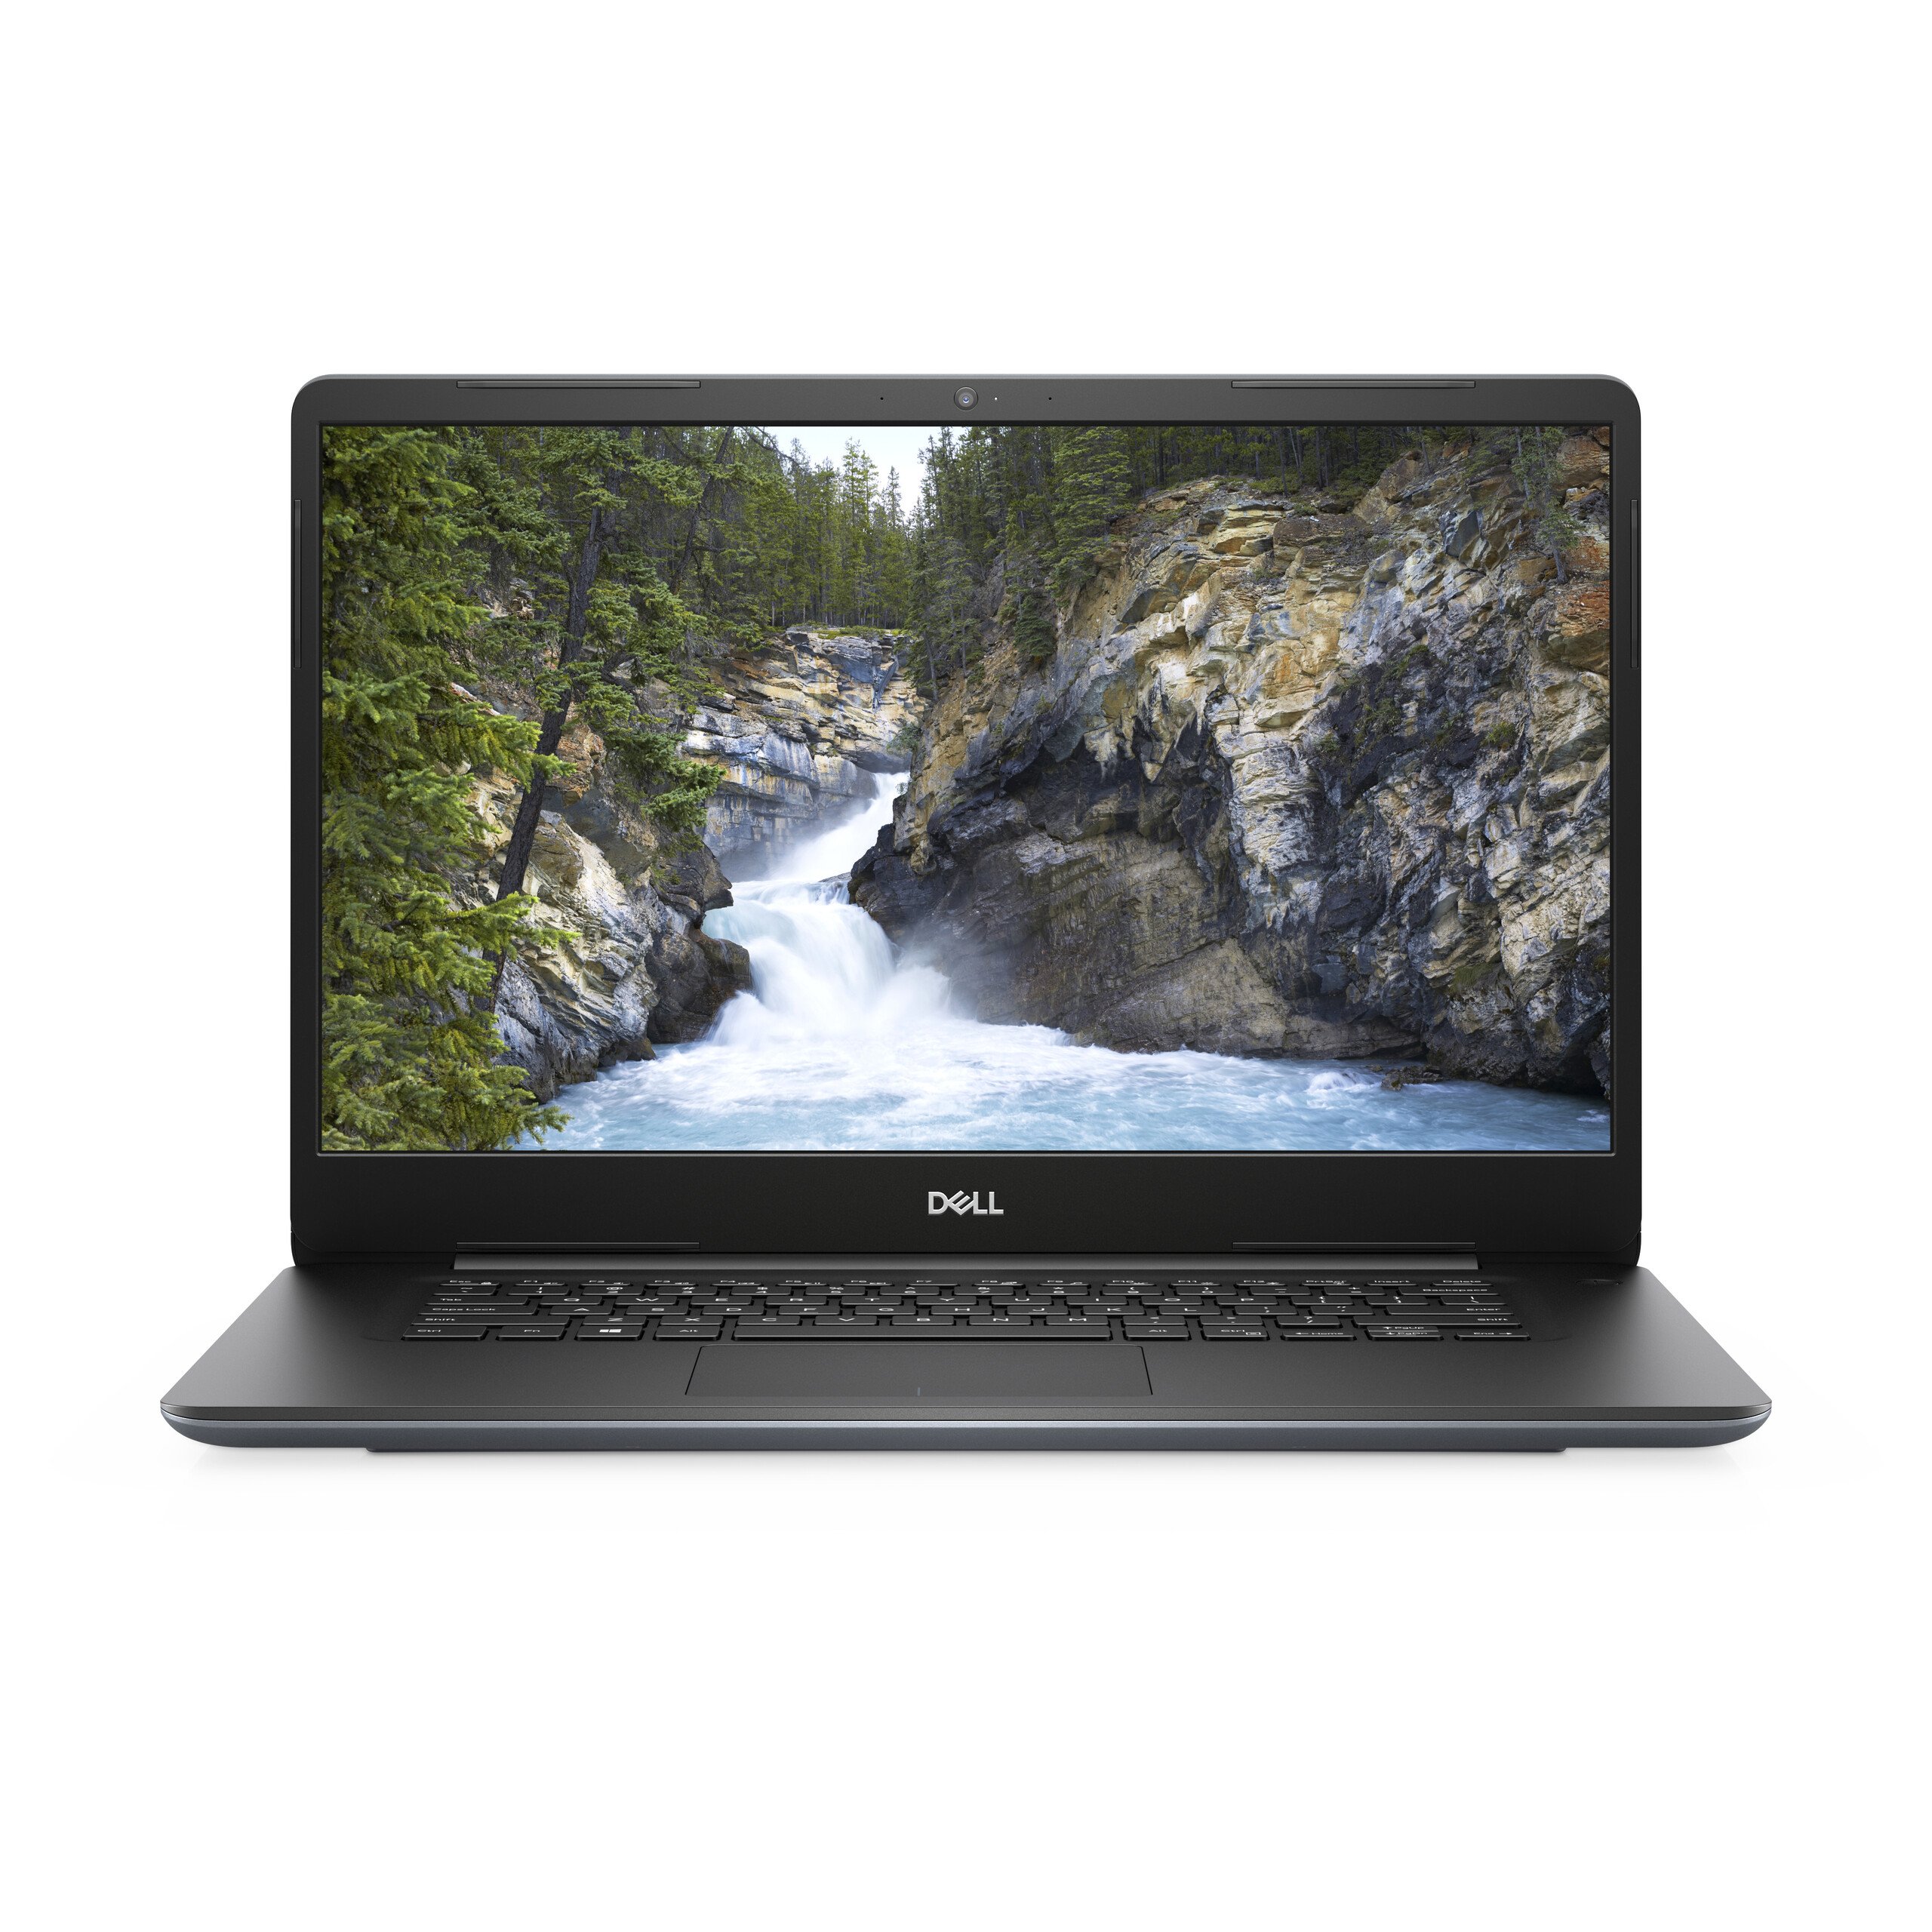
Breve Análise do Portátil Dell Vostro 15-5581: Um portátil de escritório com uma MX130 para jogos leves
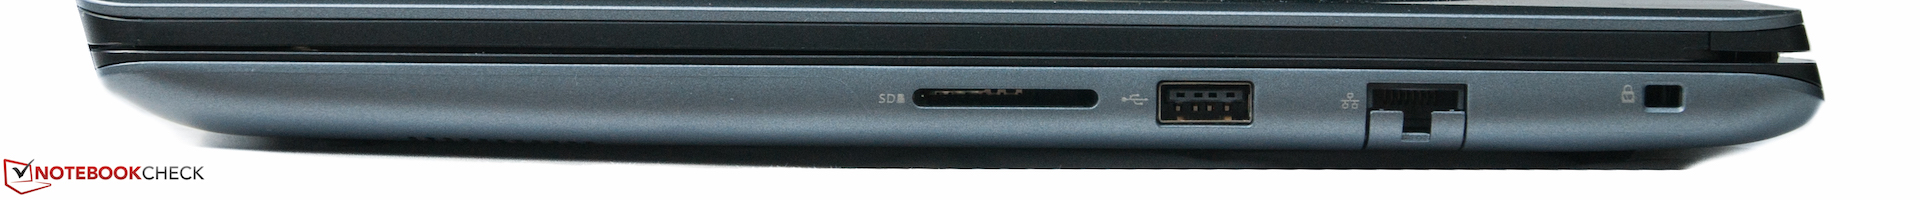

| SD Card Reader | |
| average JPG Copy Test (av. of 3 runs) | |
| HP ProBook 450 G6-5TJ93EA (Toshiba Exceria Pro SDXC 64 GB UHS-II) | |
| Média da turma Office (22.4 - 198.5, n=22, últimos 2 anos) | |
| HP 250 G7 6HM85ES (Toshiba Exceria Pro SDXC 64 GB UHS-II) | |
| Dell Vostro 15-5568 (Toshiba Exceria Pro SDXC 64 GB UHS-II) | |
| Dell Vostro 15-5568 (Toshiba Exceria Pro SDXC 64 GB UHS-II) | |
| Acer TravelMate X3410-M-50DD (Toshiba Exceria Pro SDXC 64 GB UHS-II) | |
| Dell Vostro 15-5581 (Toshiba Exceria Pro SDXC 64 GB UHS-II) | |
| maximum AS SSD Seq Read Test (1GB) | |
| HP ProBook 450 G6-5TJ93EA (Toshiba Exceria Pro SDXC 64 GB UHS-II) | |
| Média da turma Office (27.4 - 249, n=20, últimos 2 anos) | |
| HP 250 G7 6HM85ES (Toshiba Exceria Pro SDXC 64 GB UHS-II) | |
| Dell Vostro 15-5581 (Toshiba Exceria Pro SDXC 64 GB UHS-II) | |
| Dell Vostro 15-5568 (Toshiba Exceria Pro SDXC 64 GB UHS-II) | |
| Acer TravelMate X3410-M-50DD (Toshiba Exceria Pro SDXC 64 GB UHS-II) | |
| Dell Vostro 15-5568 (Toshiba Exceria Pro SDXC 64 GB UHS-II) | |
| Networking | |
| iperf3 transmit AX12 | |
| Acer TravelMate X3410-M-50DD | |
| Dell Vostro 15-5581 | |
| HP 250 G7 6HM85ES | |
| Dell Vostro 15-5568 | |
| Dell Vostro 15-5568 | |
| iperf3 receive AX12 | |
| Acer TravelMate X3410-M-50DD | |
| Dell Vostro 15-5581 | |
| HP 250 G7 6HM85ES | |
| Dell Vostro 15-5568 | |
| Dell Vostro 15-5568 | |
| |||||||||||||||||||||||||
iluminação: 87 %
iluminação com acumulador: 231 cd/m²
Contraste: 1777:1 (Preto: 0.13 cd/m²)
ΔE ColorChecker Calman: 4.81 | ∀{0.5-29.43 Ø4.73}
calibrated: 4.2
ΔE Greyscale Calman: 5.19 | ∀{0.09-98 Ø4.97}
58% sRGB (Argyll 1.6.3 3D)
37% AdobeRGB 1998 (Argyll 1.6.3 3D)
40.15% AdobeRGB 1998 (Argyll 3D)
58.5% sRGB (Argyll 3D)
38.86% Display P3 (Argyll 3D)
Gamma: 2.33
CCT: 7088 K
| Dell Vostro 15-5581 156CL04 1G2XW, , 1920x1080, 15.6" | Dell Vostro 15-5568 Chi Mei CMN15C4, , 1920x1080, 15.6" | Dell Vostro 15-5568 Chi Mei CMN154C-8KV42 , , 1920x1080, 15.6" | HP 250 G7 6HM85ES BOE0687, , 1920x1080, 15.6" | Acer TravelMate X3410-M-50DD N140HCA-EAC, , 1920x1080, 14" | |
|---|---|---|---|---|---|
| Display | 3% | 2% | 8% | ||
| Display P3 Coverage (%) | 38.86 | 40.14 3% | 39.61 2% | 41.96 8% | |
| sRGB Coverage (%) | 58.5 | 60 3% | 59.5 2% | 63 8% | |
| AdobeRGB 1998 Coverage (%) | 40.15 | 41.5 3% | 40.93 2% | 43.37 8% | |
| Response Times | 15% | -17% | 21% | -14% | |
| Response Time Grey 50% / Grey 80% * (ms) | 36 ? | 41 ? -14% | 47.6 ? -32% | 41 ? -14% | 42 ? -17% |
| Response Time Black / White * (ms) | 27 ? | 15 ? 44% | 27.2 ? -1% | 12 ? 56% | 30 ? -11% |
| PWM Frequency (Hz) | 208 ? | 26000 ? | 25000 ? | 24500 ? | |
| Screen | -62% | -71% | -69% | 6% | |
| Brightness middle (cd/m²) | 231 | 239 3% | 229 -1% | 205 -11% | 255 10% |
| Brightness (cd/m²) | 213 | 219 3% | 222 4% | 205 -4% | 218 2% |
| Brightness Distribution (%) | 87 | 86 -1% | 82 -6% | 88 1% | 72 -17% |
| Black Level * (cd/m²) | 0.13 | 0.43 -231% | 0.56 -331% | 0.52 -300% | 0.08 38% |
| Contrast (:1) | 1777 | 556 -69% | 409 -77% | 394 -78% | 3188 79% |
| Colorchecker dE 2000 * | 4.81 | 10.11 -110% | 10.36 -115% | 11.15 -132% | 5.01 -4% |
| Colorchecker dE 2000 max. * | 8.33 | 17.33 -108% | 14.95 -79% | 19.08 -129% | 17.44 -109% |
| Colorchecker dE 2000 calibrated * | 4.2 | 2.98 29% | 4.06 3% | ||
| Greyscale dE 2000 * | 5.19 | 10.88 -110% | 10.9 -110% | 12.62 -143% | 3 42% |
| Gamma | 2.33 94% | 2.33 94% | 2.21 100% | 2.38 92% | 2.26 97% |
| CCT | 7088 92% | 11924 55% | 10084 64% | 14189 46% | 6185 105% |
| Color Space (Percent of AdobeRGB 1998) (%) | 37 | 38 3% | 37.69 2% | 38 3% | 40 8% |
| Color Space (Percent of sRGB) (%) | 58 | 60 3% | 57.92 0% | 59 2% | 63 9% |
| Média Total (Programa/Configurações) | -15% /
-39% | -44% /
-62% | -15% /
-45% | 0% /
4% |
* ... menor é melhor
Exibir tempos de resposta
| ↔ Tempo de resposta preto para branco | ||
|---|---|---|
| 27 ms ... ascensão ↗ e queda ↘ combinadas | ↗ 16 ms ascensão | 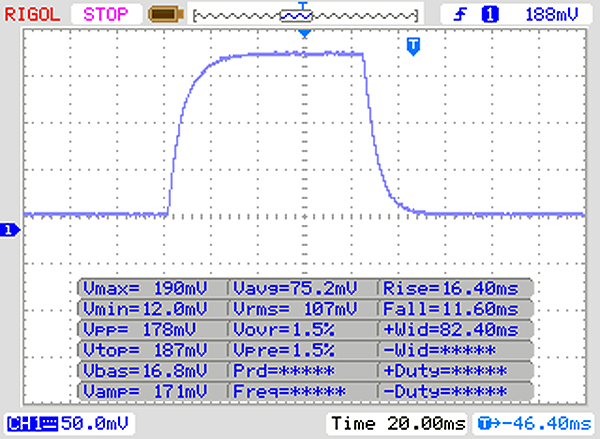 |
| ↘ 11 ms queda | ||
| A tela mostra taxas de resposta relativamente lentas em nossos testes e pode ser muito lenta para os jogadores. Em comparação, todos os dispositivos testados variam de 0.1 (mínimo) a 240 (máximo) ms. » 67 % de todos os dispositivos são melhores. Isso significa que o tempo de resposta medido é pior que a média de todos os dispositivos testados (19.9 ms). | ||
| ↔ Tempo de resposta 50% cinza a 80% cinza | ||
| 36 ms ... ascensão ↗ e queda ↘ combinadas | ↗ 18 ms ascensão | 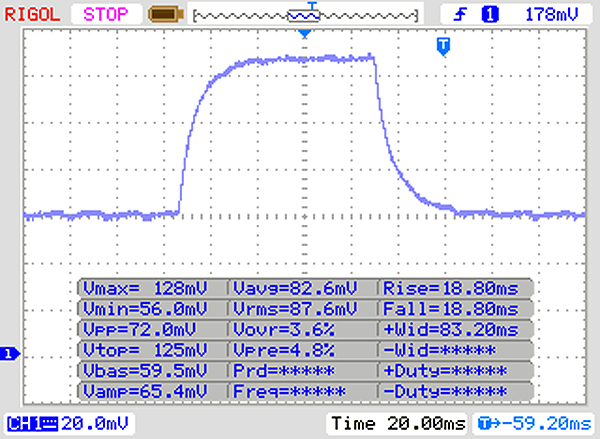 |
| ↘ 18 ms queda | ||
| A tela mostra taxas de resposta lentas em nossos testes e será insatisfatória para os jogadores. Em comparação, todos os dispositivos testados variam de 0.165 (mínimo) a 636 (máximo) ms. » 50 % de todos os dispositivos são melhores. Isso significa que o tempo de resposta medido é pior que a média de todos os dispositivos testados (31.1 ms). | ||
Cintilação da tela / PWM (modulação por largura de pulso)
| Tela tremeluzindo/PWM detectado | 208 Hz | ≤ 10 % configuração de brilho | 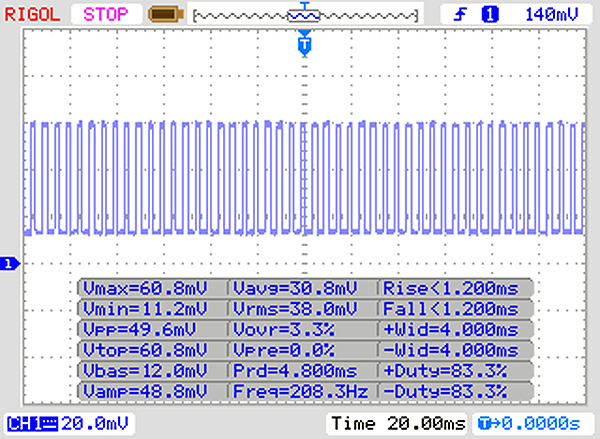 |
A luz de fundo da tela pisca em 208 Hz (pior caso, por exemplo, utilizando PWM) Cintilação detectada em uma configuração de brilho de 10 % e abaixo. Não deve haver cintilação ou PWM acima desta configuração de brilho. A frequência de 208 Hz é relativamente baixa, portanto, usuários sensíveis provavelmente notarão cintilação e sentirão fadiga ocular na configuração de brilho indicada e abaixo. [pwm_comparison] Em comparação: 52 % de todos os dispositivos testados não usam PWM para escurecer a tela. Se PWM foi detectado, uma média de 7798 (mínimo: 5 - máximo: 343500) Hz foi medida. | |||
| Cinebench R15 | |
| CPU Single 64Bit | |
| Média da turma Office (99.5 - 312, n=74, últimos 2 anos) | |
| Asus VivoBook 14 F412FJ-EB084T | |
| Lenovo ThinkPad E490-20N8000RGE | |
| Média Intel Core i5-8265U (111 - 164, n=35) | |
| HP 250 G7 6HM85ES | |
| Dell Vostro 15-5568 | |
| Dell Vostro 15-5568 | |
| Dell Vostro 15-5581 | |
| CPU Multi 64Bit | |
| Média da turma Office (250 - 3380, n=74, últimos 2 anos) | |
| Asus VivoBook 14 F412FJ-EB084T | |
| Dell Vostro 15-5581 | |
| Média Intel Core i5-8265U (457 - 750, n=38) | |
| Lenovo ThinkPad E490-20N8000RGE | |
| HP 250 G7 6HM85ES | |
| Dell Vostro 15-5568 | |
| Dell Vostro 15-5568 | |
| PCMark 8 Home Score Accelerated v2 | 3727 pontos | |
| PCMark 8 Work Score Accelerated v2 | 4946 pontos | |
| PCMark 10 Score | 3272 pontos | |
Ajuda | ||
| Dell Vostro 15-5581 SK hynix BC501 HFM128GDJTNG-831 | Dell Vostro 15-5568 SanDisk X400 256GB, SATA (SD8SB8U-256G) | Dell Vostro 15-5568 Micron SSD 1100 (MTFDDAV256TBN) | HP 250 G7 6HM85ES WDC PC SN520 SDAPNUW-512G | Média SK hynix BC501 HFM128GDJTNG-831 | |
|---|---|---|---|---|---|
| CrystalDiskMark 5.2 / 6 | 12% | 182% | 24% | ||
| Write 4K (MB/s) | 129.3 | 109.5 -15% | 179.3 39% | 108.2 ? -16% | |
| Read 4K (MB/s) | 41.02 | 26.43 -36% | 47.7 16% | 39.3 ? -4% | |
| Write Seq (MB/s) | 203.4 | 474.2 133% | 1265 522% | 284 ? 40% | |
| Read Seq (MB/s) | 271.2 | 482.8 78% | 1184 337% | 772 ? 185% | |
| Write 4K Q32T1 (MB/s) | 252.3 | 160.5 -36% | 450.6 79% | 239 ? -5% | |
| Read 4K Q32T1 (MB/s) | 281.4 | 221.5 -21% | 556 98% | 279 ? -1% | |
| Write Seq Q32T1 (MB/s) | 319.8 | 500 56% | 1455 355% | 303 ? -5% | |
| Read Seq Q32T1 (MB/s) | 1589 | 533 -66% | 1717 8% | 1597 ? 1% | |
| AS SSD | -20% | -14% | 188% | -8% | |
| Seq Read (MB/s) | 1195 | 502 -58% | 492.6 -59% | 1477 24% | 1157 ? -3% |
| Seq Write (MB/s) | 370.2 | 465.2 26% | 462.2 25% | 1339 262% | 359 ? -3% |
| 4K Read (MB/s) | 39.14 | 26.84 -31% | 25.59 -35% | 46.26 18% | 34.3 ? -12% |
| 4K Write (MB/s) | 115.5 | 50.3 -56% | 87.6 -24% | 143.9 25% | 105.6 ? -9% |
| 4K-64 Read (MB/s) | 257.9 | 357.9 39% | 231.9 -10% | 937 263% | 257 ? 0% |
| 4K-64 Write (MB/s) | 166.2 | 156.4 -6% | 290.7 75% | 1190 616% | 153.5 ? -8% |
| Access Time Read * (ms) | 0.073 | 0.098 -34% | 0.149 -104% | 0.046 37% | 0.09467 ? -30% |
| Access Time Write * (ms) | 0.045 | 0.083 -84% | 0.057 -27% | 0.024 47% | 0.04667 ? -4% |
| Score Read (Points) | 417 | 435 4% | 307 -26% | 1131 171% | 407 ? -2% |
| Score Write (Points) | 319 | 253 -21% | 424 33% | 1468 360% | 295 ? -8% |
| Score Total (Points) | 922 | 917 -1% | 896 -3% | 3181 245% | 883 ? -4% |
| Copy ISO MB/s (MB/s) | 267.5 | 765 | 245 ? | ||
| Copy Program MB/s (MB/s) | 106.4 | 239.9 | 135.3 ? | ||
| Copy Game MB/s (MB/s) | 161.1 | 528 | 223 ? | ||
| Média Total (Programa/Configurações) | -20% /
-20% | -1% /
-3% | 185% /
185% | 8% /
6% |
* ... menor é melhor

| 3DMark 11 Performance | 2692 pontos | |
| 3DMark Cloud Gate Standard Score | 10635 pontos | |
| 3DMark Fire Strike Score | 2115 pontos | |
| 3DMark Time Spy Score | 724 pontos | |
Ajuda | ||
| baixo | média | alto | ultra | |
|---|---|---|---|---|
| BioShock Infinite (2013) | 83.6 | 57.3 | 51 | 48.7 |
Barulho
| Ocioso |
| 30.6 / 31.6 / 31.6 dB |
| Carga |
| 42.6 / 42.8 dB |
 | ||
30 dB silencioso 40 dB(A) audível 50 dB(A) ruidosamente alto |
||
min: | ||
(±) A temperatura máxima no lado superior é 44.7 °C / 112 F, em comparação com a média de 34.3 °C / 94 F , variando de 21.2 a 62.5 °C para a classe Office.
(±) A parte inferior aquece até um máximo de 43.6 °C / 110 F, em comparação com a média de 36.8 °C / 98 F
(+) Em uso inativo, a temperatura média para o lado superior é 27.2 °C / 81 F, em comparação com a média do dispositivo de 29.5 °C / ### class_avg_f### F.
(+) Os apoios para as mãos e o touchpad são mais frios que a temperatura da pele, com um máximo de 27.1 °C / 80.8 F e, portanto, são frios ao toque.
(±) A temperatura média da área do apoio para as mãos de dispositivos semelhantes foi 27.5 °C / 81.5 F (+0.4 °C / 0.7 F).
Dell Vostro 15-5581 análise de áudio
(-) | alto-falantes não muito altos (###valor### dB)
Graves 100 - 315Hz
(-) | quase nenhum baixo - em média 18.9% menor que a mediana
(±) | a linearidade dos graves é média (11.1% delta para a frequência anterior)
Médios 400 - 2.000 Hz
(+) | médios equilibrados - apenas 3.6% longe da mediana
(±) | a linearidade dos médios é média (7.7% delta para frequência anterior)
Altos 2 - 16 kHz
(+) | agudos equilibrados - apenas 1.9% longe da mediana
(+) | os máximos são lineares (5.9% delta da frequência anterior)
Geral 100 - 16.000 Hz
(±) | a linearidade do som geral é média (18.9% diferença em relação à mediana)
Comparado com a mesma classe
» 35% de todos os dispositivos testados nesta classe foram melhores, 7% semelhantes, 58% piores
» O melhor teve um delta de 7%, a média foi 21%, o pior foi 53%
Comparado com todos os dispositivos testados
» 44% de todos os dispositivos testados foram melhores, 8% semelhantes, 48% piores
» O melhor teve um delta de 4%, a média foi 24%, o pior foi 134%
Apple MacBook 12 (Early 2016) 1.1 GHz análise de áudio
(+) | os alto-falantes podem tocar relativamente alto (###valor### dB)
Graves 100 - 315Hz
(±) | graves reduzidos - em média 11.3% menor que a mediana
(±) | a linearidade dos graves é média (14.2% delta para a frequência anterior)
Médios 400 - 2.000 Hz
(+) | médios equilibrados - apenas 2.4% longe da mediana
(+) | médios são lineares (5.5% delta para frequência anterior)
Altos 2 - 16 kHz
(+) | agudos equilibrados - apenas 2% longe da mediana
(+) | os máximos são lineares (4.5% delta da frequência anterior)
Geral 100 - 16.000 Hz
(+) | o som geral é linear (10.2% diferença em relação à mediana)
Comparado com a mesma classe
» 7% de todos os dispositivos testados nesta classe foram melhores, 2% semelhantes, 91% piores
» O melhor teve um delta de 5%, a média foi 18%, o pior foi 53%
Comparado com todos os dispositivos testados
» 5% de todos os dispositivos testados foram melhores, 1% semelhantes, 94% piores
» O melhor teve um delta de 4%, a média foi 24%, o pior foi 134%
| desligado | |
| Ocioso | |
| Carga |
|
Key:
min: | |
| Dell Vostro 15-5581 i5-8265U, GeForce MX130, SK hynix BC501 HFM128GDJTNG-831, IPS, 1920x1080, 15.6" | Dell Vostro 15-5568 i7-7500U, GeForce 940MX, Micron SSD 1100 (MTFDDAV256TBN), TN LED, 1920x1080, 15.6" | HP ProBook 450 G6-5TJ93EA i7-8565U, GeForce MX130, Samsung SSD PM981 MZVLB512HAJQ, IPS, 1920x1080, 15.6" | HP 250 G7 6HM85ES i5-8265U, UHD Graphics 620, WDC PC SN520 SDAPNUW-512G, TN, 1920x1080, 15.6" | Média NVIDIA GeForce MX130 | Média da turma Office | |
|---|---|---|---|---|---|---|
| Power Consumption | 11% | -6% | 26% | -10% | -2% | |
| Idle Minimum * (Watt) | 5 | 3.1 38% | 3.12 38% | 3.2 36% | 4.54 ? 9% | 4.4 ? 12% |
| Idle Average * (Watt) | 7.9 | 6.3 20% | 6.3 20% | 5.7 28% | 6.98 ? 12% | 7.32 ? 7% |
| Idle Maximum * (Watt) | 11.2 | 6.5 42% | 9.78 13% | 6.1 46% | 9.08 ? 19% | 8.56 ? 24% |
| Load Average * (Watt) | 34 | 46 -35% | 57.6 -69% | 36.5 -7% | 54.1 ? -59% | 42.5 ? -25% |
| Load Maximum * (Watt) | 50.2 | 54 -8% | 67.3 -34% | 37.5 25% | 66.4 ? -32% | 64.1 ? -28% |
| Witcher 3 ultra * (Watt) | 42 |
* ... menor é melhor
| Dell Vostro 15-5581 i5-8265U, GeForce MX130, 42 Wh | Dell Vostro 15-5568 i7-7500U, GeForce 940MX, 42 Wh | Dell Vostro 15-5568 i5-7200U, HD Graphics 620, 42 Wh | HP 250 G7 6HM85ES i5-8265U, UHD Graphics 620, 41 Wh | Média da turma Office | |
|---|---|---|---|---|---|
| Duração da bateria | -17% | 16% | -1% | 80% | |
| Reader / Idle (h) | 12.5 | 13.3 6% | 16.9 35% | 13.9 11% | 23.7 ? 90% |
| H.264 (h) | 6.6 | 8.5 29% | 7.1 8% | 15 ? 127% | |
| WiFi v1.3 (h) | 6.8 | 4.3 -37% | 6 -12% | 5.7 -16% | 12.9 ? 90% |
| Load (h) | 1.6 | 1.3 -19% | 1.8 13% | 1.5 -6% | 1.807 ? 13% |
Pro
Contra
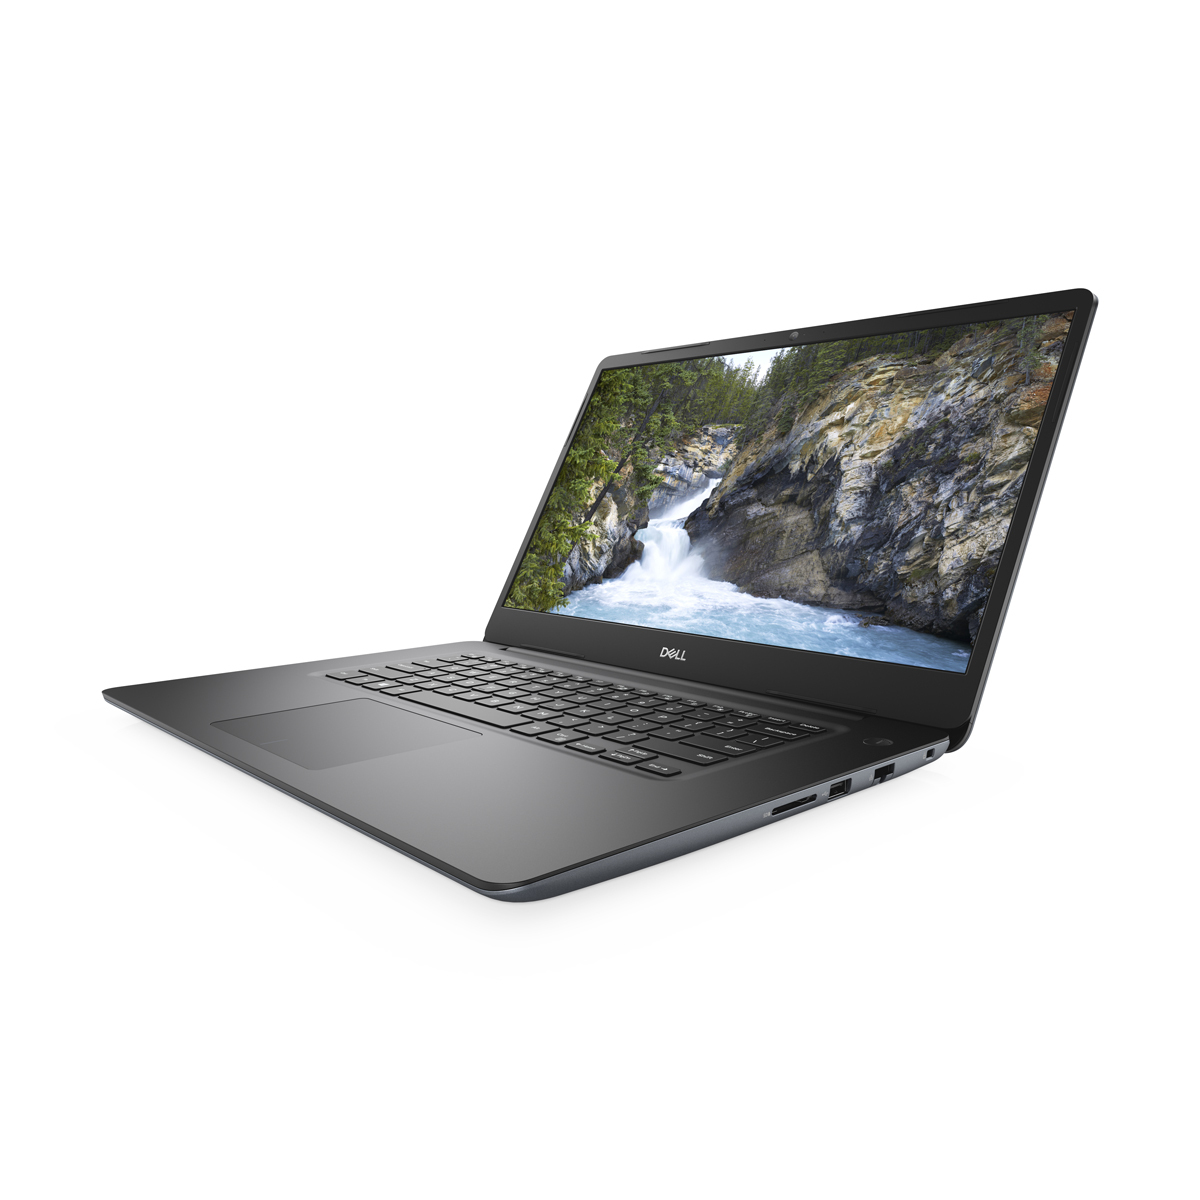
O dispositivo tem um design elegante, embora sua carcaça plástica tenha algumas inconsistências no acabamento. A Dell também equipou o Vostro 15-5581 com dispositivos de entrada decentes, então você nunca deveria sentir a necessidade de pegar um mouse ou teclado externo.
Infelizmente, a tela em nossa unidade de teste está abaixo do esperado, com um brilho máximo inaceitavelmente baixo. Ele tem ângulos de visão estáveis e um acabamento mate, então as reflexões de luzes artificiais brilhantes nunca deveriam ser um problema.
No lado positivo, o Vostro 15-5581 tem potência suficiente para lidar com todas as tarefas de escritório e até mesmo com tarefas gráficas mais intensas, graças à sua GPU GeForce MX130. No entanto, o dispositivo não obtém o máximo dos dois componentes, e seu comportamento é muito agressivo para o nosso gosto. No entanto, o Vostro 15-5581 fez avanços a partir de seu antecessor, com mais potência, melhores dispositivos de entrada e maior duração da bateria.
O Dell Vostro 15-5581 é um portátil de 15,6 polegadas mediano. Não irá inspirar as pessoas, mas não foi feito para isso. Simplesmente, vai fazer o trabalho.
No geral, o Vostro 15-5581 se destaca em algumas áreas, como a duração da bateria e o desempenho da CPU. Uma tela nada surpreendente, um ventilador agressivo e um SSD comparativamente lento, estragam o que poderia ter sido um sólido portátil corporativo.
Dell Vostro 15-5581
- 06/17/2019 v6 (old)
Nino Ricchizzi
Price comparison
